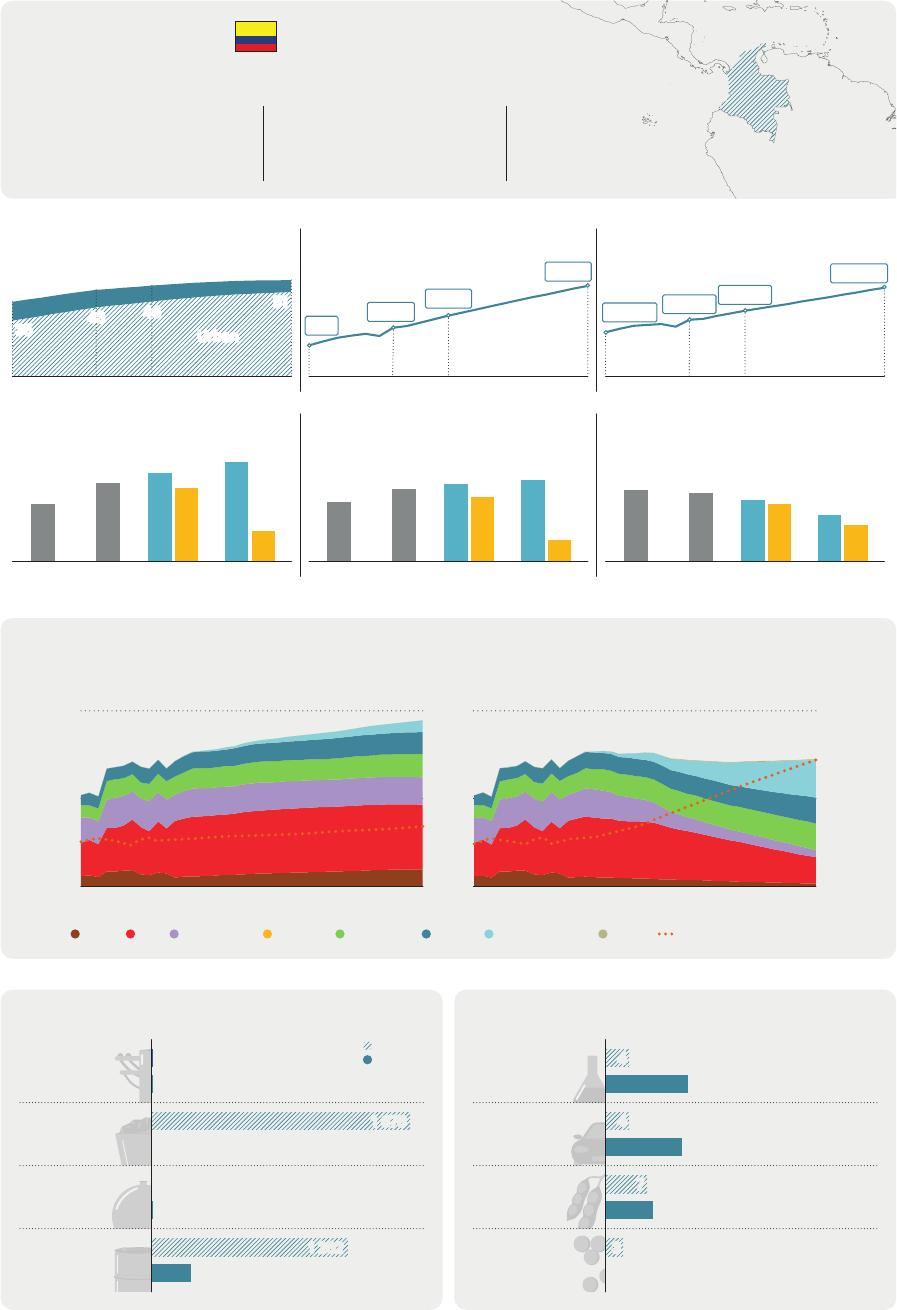
LatinAmericaEnergyOutlookOverview:ColombiaWorldEnergyOutlookSpecialReportINTERNATIONALENERGYAGENCYTheIEAexaminestheIEAmemberIEAassociationfullspectrumcountries:countries:ofenergyissuesincludingoil,gasAustraliaArgentinaandcoalsupplyandAustriaBrazildemand,renewableBelgiumChinaenergytechnologies,CanadaEgyptelectricitymarkets,CzechRepublicIndiaenergyefficiency,DenmarkIndonesiaaccesstoenergy,EstoniaKenyademandsideFinlandMoroccomanagementandFranceSenegalmuchmore.ThroughGermanySingaporeitswork,theIEAGreeceSouthAfricaadvocatespoliciesHungaryThailandthatwillenhancetheIrelandUkrainereliability,affordabilityItalyandsustainabilityofJapanenergyinitsKorea31membercountries,Lithuania13associationLuxembourgcountriesandMexicobeyond.NetherlandsNewZealandThispublicationandanyNorwaymapincludedhereinarePolandwithoutprejudicetothePortugalstatusoforsovereigntyoverSlovakRepublicanyterritory,totheSpaindelimitationofinternationalSwedenfrontiersandboundariesSwitzerlandandtothenameofanyRepublicofTürkiyeterritory,cityorarea.UnitedKingdomUnitedStatesTheEuropeanCommissionalsoparticipatesintheworkoftheIEASource:IEA.InternationalEnergyAgencyWebsite:www.iea.orgColombia6th8th6thlargestcity(Bogota)inLatinlargeste-busleetintheworldlargestcoalexporterAmericaandtheCaribbeanintheworldPopulationMillionpeopleGDPBillionUSD(2022,PPP)GDPpercapitaUSDpercapita(2022,PPP)98Rural6180030700105112002210014000186004346100035Urban600201020222030205020102022203020502010202220302050CO2emissionsMtCO2CO2emissionspercapitatCO2/capitaEnergyintensityGJperthousandUSD1091.41.71.81.5(2022,PPP)8697331.90.6812.01.91.71.6631.3EJ1.0STEPS201020222030APS205020102022203020502010202220302050Primaryenergysupplyandshareoflow-emissionssourcesAPSSTEPS100%2.51.2550%2010205020102050Shareoflow-emissions(rightaxis)CoalOilNaturalgasNuclearBioenergyHydroWindandsolarOtherTradeofmainenergyproducts(2021)PJTradeofnon-energyproducts(2021)BillionUSD1ExportsImportsChemicals4Electricity1421676Manufactured4Coalgoods13GasFood72products8Oil2551262Pearls,preciousstones3andnon-monetarygoldTable1⊳RecentpolicydevelopmentsinColombiaPolicyPublicationyearEconomy-wide•ClimateActionLaw:NetZeroGHGemissionsby2050.2021measures2021•NDC:UnconditionaltargettoreduceGHGemissions51%belowbusiness-2016Justtransitionas-usualby2030.policies2023AFOLU•CarbontaxforpetroleumderivativesandgasusedforcombustionOilandgas(USD5/tCO2-eq).CarbontaxforcoalwillbeincreasedgraduallytoreachproductionUSD12/tCO2-eqby2028.HydrogenPower•NewNationalEnergyPlanwhichwillincludetheJustEnergyTransitionroadmapby2050(announced).TransportEnergy•Law2056toregulatetheorganisationandfunctioningofthegeneral2020efficiencysystemofroyalties.•ClimateActionLaw:Reductionofdeforestationto50000ha/yearandzero2021deforestationby2030.•Legislationtobanfracking(announced).2022•Haltonnewfossilfuelexplorationlicences(announced).2023•NationalHydrogenStrategy:40%low-emissionshydrogenintotal2021consumptioninindustrysectorby2030.•Promotionofrenewablesintegrationthroughlong-termauctions.2021•E2050strategy:Quantitativetargetsforcleanelectricitygeneration2021(10GWoffshorewindby2050).•NationalElectricMobilityStrategy:600000EVstock(excludingtwo/three-2019wheelers)by2030.•ProductEfficiencyCalltoActionatCOP-26:Doubletheefficiencyofair2021conditioners,refrigerators,lightingandindustrialelectricmotorsby2030.Table2⊳MajorinfrastructureprojectsinColombiaProjectSizeDateStatusDescriptiononlineCartagenarefinery9ktH2/year2026Dedicatedrenewable(capacity)2026DedicatedrenewableHydrogen/Barrancabermeja9ktH2/yearammoniarefinery(capacity)2027Grid2022CrudeoilderivativesBEAUTYAmmonia170ktH2/year2028DelayedduetoCOVID(capacity)-OilandgasSebastopol150000b/drefineryPublictransportBogotaMetro72000passengersRail,Line1perhourIEA.CCBY4.0.ColombiaenergyprofileFigure1⊳FinalenergyconsumptionbyscenarioinColombia32STEPSAPS1EJLever2010Avoideddemand2022ElectrificationActivityEnergyefficiencyTransportFuelswitchingIndustrySectorBuildingsOther2050Transport2022BuildingsActivityIndustryTransportIndustryBuildings2050IEA.CCBY4.0.Today,thetransportandbuildingssectorsaccountfor68%offinalenergyconsumption.Totalfinalconsumptionincreases40%by2050intheSTEPS,ledbytransportandindustry.IntheAPS,onlytheindustrysectorconsumesmoreenergyin2050thanin2022.Figure2⊳FuelconsumptioninindustrybytypeandscenarioinColombiaEnergy-intensiveindustriesOtherindustryActivitydrivers0.5350EJIndex(2022=100)0.43000.32500.22000.115020101002050202220302030205020302050201020222030205020302050STEPSAPSSTEPSAPSChemicalsCrudesteelIndustryVALACCoalOilNaturalgasBioenergyElectricityOtherIEA.CCBY4.0.IEA.CCBY4.0.Coalcurrentlymeetsathirdofenergyconsumptioninindustry,anditremainsthemainfuelintheSTEPSforenergy-intensiveindustriesassteelproductionmorethantriplesby2050.IntheAPS,theroll-outofheatpumpsandprocessesbasedonelectrolytichydrogenleadtoelectricitydemanddisplacingcoalinmostindustrialsectors.InternationalEnergyAgencyLatinAmericaEnergyOutlookFigure3⊳FuelconsumptionintransportbytypeandscenarioinColombia0.8RoadNon-roadActivitydrivers300EJIndex(2022=100)0.62500.42000.215020101002050202220302030205020302050201020222030205020302050STEPSAPSSTEPSAPSOilNaturalgasBioenergyElectricityOtherPassengercarsTrucksLACIEA.CCBY4.0.Colombiahastheworld’seighth-largestelectricbusfleettoday.IntheAPS,nearly80%ofthebusfleetiselectricby2050.IntheAPS,passengeractivityincreasesby170%from2022levelsby2050,butoiluseinroadtransportfallsby55%astheshareofelectricityinconsumptionrisestoover40%.Figure4⊳FuelconsumptioninbuildingsbytypeandscenarioinColombiaHeatingandSpacecoolingandActivitydriversappliances8500.3cookingEJIndex(2022=100)0.26000.135020101002050202220302030205020302050201020222030205020302050STEPSAPSSTEPSAPSAirconditionerstockFloorspaceLACOilNaturalgasBioenergyElectricityOtherIEA.CCBY4.0.IEA.CCBY4.0.MostheatingandcookingneedsinColombiaaremetbybioenergy,oilandnaturalgas.IntheAPS,theshareofoildeclinesaselectrificationincreases.Increaseduseofhouseholdappliancesandspacecoolingdriveselectricitydemandgrowthinbuildings.IntheAPS,morestringentMEPScutthegrowthbynearly15%comparedtoSTEPS.ColombiaenergyprofileFigure5⊳AverageelectricitydailyloadprofilebyscenarioinColombia402022STEPS2050APS2050GW3020100h24h0h24h0h24hIndustryBuildingsTransportIEA.CCBY4.0.By2050,peakelectricitydemanddoublesintheSTEPSandmorethantriplesintheAPS,outpacinggrowthinaverageelectricitydemand.IntheAPS,smartchargingofEVscouldsmooththeeveningpeakindemand.Figure6⊳ElectricitygenerationandcapacitybyfuelandscenarioinColombiaSTEPSAPS90STEPSAPSTWh3002050GW2006020221002030302050201020502030202220222050CoalOilNaturalgasBioenergyNuclearHydroWindSolarPVBatteryOtherDedicatedrenewablesforhydrogenEA.CCBY4.0.IEA.CCBY4.0.Today’spowermixisdominatedbyhydropower(75%),withnaturalgasandoilaccountingformostoftherest.RisingdemandforelectricityismetprimarilybywindandsolarPVgeneration.IntheAPS,solarPVandwindgenerationincreasesfrom1%todaytoalmost60%in2050.InternationalEnergyAgencyLatinAmericaEnergyOutlookFigure7⊳FueldemandandproductionbyscenarioinColombiaOil(mb/d)Naturalgas(bcm)Low-emissionshydrogen(Mt)0.9150.90.6100.60.350.3202220302050203020502022203020502030205020222030205020302050STEPSAPSSTEPSAPSSTEPSAPSProductionDemandIEA.CCBY4.0.Oilandgasproductiondeclineinbothscenarios,butthedeclineismuchstarkerintheAPSasColombiadeliversonitspledgeofnonewoilandgasexplorationcontracts.IntheSTEPS,low-emissionshydrogenproductionrisesto0.1Mtby2050.IntheAPS,itincreasestoalmost1Mt.Figure8⊳AnnualinvestmentinenergysupplybytypeandscenarioinColombia20302022CleanenergyHydro2050STEPSNon-hydrorenewablesAPSNuclearBatterystorageSTEPSElectricitygridsAPSCleanfuelsOtherlow-emissionsUnabatedfossilfuelsOilCoalNaturalgasOtherfossilfuels246810BillionUSD(2022,MER)IEA.CCBY4.0.IEA.CCBY4.0.Investmentincleanenergysupplyaccountsfor0.6%ofGDPinColombiaintheSTEPSby2050and1.4%intheAPS.Morethanathirdofoverallinvestmentforcleanenergysupplysupportsgriddevelopmentinbothscenariosin2050.ColombiaenergyprofileNoteshahectaresUnitskmkilometreAreaDistanceGtCO2gigatonnesofcarbondioxideEmissionsMtCO2milliontonnesofcarbondioxideMtCO2-eqmilliontonnesofcarbon-dioxideequivalent(using100‐EnergyyearglobalwarmingpotentialsfordifferentgreenhousetCO2-eqgases)Gastonnesofcarbon-dioxideequivalentEJMassPJexajoule(1joulex1018)MonetaryTWhpetajoule(1joulex1015)OilTcalterawatt-hourPowerteracalorie(1caloriex1012)bcmbcm/dbillioncubicmetresmcm/dbillioncubicmetresperdaymillioncubicmetresperdaykgktkilogrammekilotonnes(1tonne=1000kg)USDmillionUSDbillion1USdollarx1061USdollarx109mb/db/dmillionbarrelsperdaybarrelsperdayGWMWgigawattkVmegawattkilovoltIEA.CCBY4.0.TermsActivitydriversforindustryincludeproductionlevels(Mt)andvalueadded(USD2022,PPP);fortransport,vehicle-kilometres(km)forpassengercarsandtonne-kmfortrucks;forbuildings,airconditioning(millionunits)andfloorspace(millionsquaremetres).TheactivitynumberspresentedcorrespondtotheStatedPoliciesScenario(STEPS)indexedonthe2022value.Bioenergyreferstobioenergyandwaste.Cleanfuelsreferstobiofuels,hydrogenandhydrogen-relatedfuels.InternationalEnergyAgencyLatinAmericaEnergyOutlookIEA.CCBY4.0.Dailyaverageelectricityloadprofilesdonotfactorinelectricitydemandgeneratedbydedicatedrenewablesourcesconnectedtoelectrolysers,andtheyalsodonotconsidertheinfluenceofdemand-responsemechanisms.Energy-intensiveindustriesincludechemicals,ironandsteel,non-metallicminerals(cementandother),non-ferrousmetals(aluminiumandother)andpulp,paperandprinting.Heatingandcookinginbuildingsreferstoenergydemandforspaceandwaterheating,andcooking.Hydrogendemandexcludesbothhydrogenexportsandthehydrogenusedforproducinghydrogen-basedfuelswhichareexported.Investmentdataarepresentedinrealtermsinyear-2022USdollars.Large-scaleCCUSprojectsreferonlytofacilitieswithaplannedcapturecapacityhigherthan100000tonnesofCO2peryear.Low-emissionshydrogenprojectsconsideredarethosewithanannouncedcapacityfor2030.Non-roadtransportincludesrail,domesticnavigation,domesticaviation,pipelineandothernon-specifiedtransport.Otherforpowergenerationandcapacityreferstogeothermal,concentratedsolarpower,marine,non-renewablewasteandothernon-specifiedsources.Otherforfinalconsumptioninsectorsreferstonon-renewablewaste,hydrogen,solarthermalandgeothermal.Otherinasectorcategoryreferstoagricultureandothernon-energyuses.Otherfossilfuelsinenergysupplyinvestmentrefertonon-renewablewasteandothersupplysources.Otherfuelshiftsincludebioenergy,nuclear,solarthermal,geothermalandnaturalgas.Otherindustryreferstotheconstruction,foodandtobacco,machinery,miningandquarrying,textileandleather,transportequipment,woodindustrybranchesandremainingindustry.Otherlow-emissionsinenergysupplyinvestmentincludeheatpumps,CCUS,electricitygenerationfromhydrogen,electricitygenerationfromammoniaanddirectaircapture.Roadtransportincludessixvehiclecategories(passengercars,buses,two/three-wheelers,light-dutyvansandtrucks,andmediumandheavytrucks).SDG7referstoSustainableDevelopmentGoal(SDG)7:“ensureaccesstoaffordable,reliable,sustainableandmodernenergyforall”,adoptedbytheUnitedNationsin2015.Solarpotentialdataiscalculatedbasedontheaveragepotentialatnationallevelassessedinkilowatt-hourperkilowattpeakperday(2020).ColombiaenergyprofileTotalfinalconsumptionincludesconsumptionbythevariousend‐usesectors(industry,transport,buildings,agriculture,andothernon‐energyuse).Itexcludesinternationalmarineandaviationbunkers,exceptatworldlevelwhereitisincludedinthetransportsector.AcronymsScenarios:STEPS=StatedPoliciesScenario;APS=AnnouncedPledgesScenario.AFOLUagriculture,forestryandotherlanduseBECCSbioenergywithcarboncaptureandstorageCCUScarboncapture,utilisationandstorageCNGcompressednaturalgasEVelectricvehicleGDPgrossdomesticproductGHGgreenhousegasesH2hydrogenHVDChighvoltagedirectcurrentICEinternalcombustionengineMEPSminimumenergyperformancestandardsMERmarketexchangerateNDCNationallyDeterminedContributionPPPpurchasingpowerparityPVphotovoltaicsSDGSustainableDevelopmentGoalsVAvalueaddedZEVzeroemissionsvehicleThepolicytablesincludeexistingpoliciesandannouncementsasoftheendofSeptember2023.Thesameappliestothetablesofexistingandannouncedprojects.TheIEAdoesnotusecolourstorefertothevarioushydrogenproductionroutes.However,whenreferringtospecificpolicyannouncements,programmes,regulationsandprojectswhereanauthorityusescolourtodefineahydrogenproductionroute,e.g.greenhydrogen,weusethatterminologytoreportdevelopmentsinthisreview.IEA.CCBY4.0.InternationalEnergyAgencyLatinAmericaEnergyOutlookInternationalEnergyAgency(IEA)ThisworkreflectstheviewsoftheIEASecretariatbutdoesnotnecessarilyreflectthoseoftheIEA’sindividualmembercountriesorofanyparticularfunderorcollaborator.Theworkdoesnotconstituteprofessionaladviceonanyspecificissueorsituation.TheIEAmakesnorepresentationorwarranty,expressorimplied,inrespectofthework’scontents(includingitscompletenessoraccuracy)andshallnotberesponsibleforanyuseof,orrelianceon,thework.SubjecttotheIEA’sNoticeforCC-licencedContent,thisworkislicencedunderaCreativeCommonsAttribution4.0InternationalLicence.Thisdocumentandanymapincludedhereinarewithoutprejudicetothestatusoforsovereigntyoveranyterritory,tothedelimitationofinternationalfrontiersandboundariesandtothenameofanyterritory,cityorarea.Unlessotherwiseindicated,allmaterialpresentedinfiguresandtablesisderivedfromIEAdataandanalysis.IEAPublicationsInternationalEnergyAgencyWebsite:www.iea.orgContactinformation:www.iea.org/contactTypesetinFrancebyIEA-November2023Coverdesign:IEAPhotocredits:©GettyImages


 VIP
VIP VIP
VIP VIP
VIP VIP
VIP VIP
VIP VIP
VIP VIP
VIP VIP
VIP VIP
VIP VIP
VIP