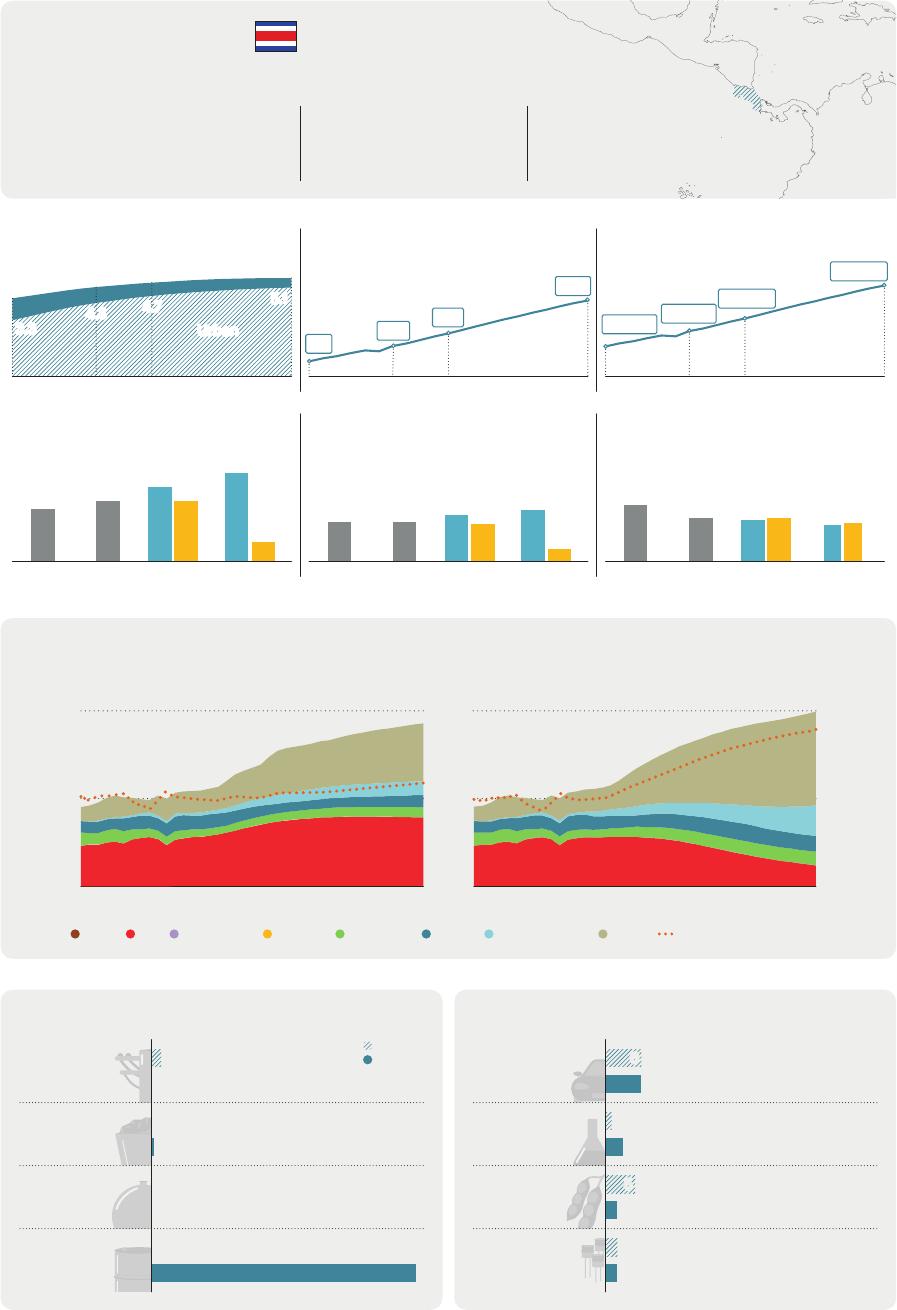
LatinAmericaEnergyOutlookOverview:CostaRicaWorldEnergyOutlookSpecialReportINTERNATIONALENERGYAGENCYTheIEAexaminestheIEAmemberIEAassociationfullspectrumcountries:countries:ofenergyissuesincludingoil,gasAustraliaArgentinaandcoalsupplyandAustriaBrazildemand,renewableBelgiumChinaenergytechnologies,CanadaEgyptelectricitymarkets,CzechRepublicIndiaenergyefficiency,DenmarkIndonesiaaccesstoenergy,EstoniaKenyademandsideFinlandMoroccomanagementandFranceSenegalmuchmore.ThroughGermanySingaporeitswork,theIEAGreeceSouthAfricaadvocatespoliciesHungaryThailandthatwillenhancetheIrelandUkrainereliability,affordabilityItalyandsustainabilityofJapanenergyinitsKorea31membercountries,Lithuania13associationLuxembourgcountriesandMexicobeyond.NetherlandsNewZealandThispublicationandanyNorwaymapincludedhereinarePolandwithoutprejudicetothePortugalstatusoforsovereigntyoverSlovakRepublicanyterritory,totheSpaindelimitationofinternationalSwedenfrontiersandboundariesSwitzerlandandtothenameofanyRepublicofTürkiyeterritory,cityorarea.UnitedKingdomUnitedStatesTheEuropeanCommissionalsoparticipatesintheworkoftheIEASource:IEA.InternationalEnergyAgencyWebsite:www.iea.orgCostaRica3RD100%HIGHESTlargestproducerofgeothermalenergyshareofrenewableselectriicationinbuildingsininLatinAmericaandtheCaribbeaninelectricitygenerationLatinAmericaandtheCaribbeanPopulationMillionpeopleGDPBillionUSD(2022,PPP)GDPpercapitaUSDpercapita(2022,PPP)0.90.8Rural0.6455001.34.34.75.1260307003.3Urban170130252001950090201020222030205020102022203020502010202220302050CO2emissionsMtCO2CO2emissionspercapitatCO2/capitaEnergyintensityGJperthousandUSD(2022,PPP)10.2127.18.28.22.12.20.5EJ1.61.61.91.51.71.61.71.41.5STEPS2050APS2.720102022203020502010202220302010202220302050Primaryenergysupplyandshareoflow-emissionssourcesAPSSTEPS100%0.40.250%2010205020102050Shareoflow-emissions(rightaxis)CoalOilNaturalgasNuclearBioenergyHydroWindandsolarOtherTradeofmainenergyproducts(2021)PJTradeofnon-energyproducts(2021)BillionUSD4ExportsImportsManufactured6ElectricityCoal116goods611GasChemicalsOil3Food5products2Partsand2componentsforelectronicgoods2Table1⊳RecentpolicydevelopmentsinCostaRicaPolicyPublicationyearEconomy-wide•NDC(revisedin2020):Commitmenttoamaximumof9.11MtCO2-eqof2020measuresnetemissionsby2030andtoreachnetzeroemissionsby2050.2019AFOLU•Netzeroemissionstarget(targetreiteratedinNDCin2020):General2022Oilandgascommitmenttonetzeroemissionsgoalby2050initsNationalproductionDecarbonisationPlan2018-2050.HydrogenPower•NationalAdaptationPlan(2022-2026):RoadmaptostrengthenresiliencetoIndustrytheimpactsofclimatechange.Transport•ImplementationPlanfortheNationalREDD+Strategy:Increaseforestcover2017Buildingsbyrecovering254923hectaresofagriculturallandby2025.•DecreeNo.41578:extendsthenationalmoratoriumonactivitiesrelatedto2019oilexplorationandexploitationfrom2021to2050.•NationalHydrogenStrategy2022-2050.Threekeystrategies:usegreen2022hydrogentodecarbonisethetransportandindustrysectors;developatechnologyhub;andfostertheconditionstofacilitatehydrogenexports.•GenerationExpansionPlan2022-2040:Install1775MWofsolarPVand2023windcapacity.•DecarbonisationNationalPlan2018-2050:Industrytoshiftenergysources2019toreduceemissionswhileincreasingactivity.•DecarbonisationNationalPlan2018-2050:60%ofthelight-dutyvehicle2019fleetand100%ofthepublictransportfleetwillbezeroemissions,withelectricityasthemainpowersource.•PlanNacionaldeDesarrolloenInversiónPública2023-2026:Rogelio2022FernándezGüell:Implementsablendingtargetof8%ofrenewablecomponentsinfossilfuelssoldinthedomesticmarket.•Agreement09-MINAE.CreatestheNationalEnvironmentalandEnergy2023EfficiencyLabellingProgrammeofCostaRicaandtheTechnicalCommitteeforEnvironmentalandEnergyLabelling.Table2⊳MajorinfrastructureprojectsinCostaRicaHydrogen/ammoniaProjectSizeDateonlineStatusDescriptionHydropowerCostaRicaTransportation0.2ktH2/year2025DedicatedGeothermalrenewablesEcosystemProject(capacity)2029HydropowerFourthCliff61MW2027GeothermalBorinquenI55MW2031GeothermalBorinquenII55MWIEA.CCBY4.0.CostaRicaenergyprofileFigure1⊳FinalenergyconsumptionbyscenarioinCostaRica0.40.3STEPSAPS0.2EJLever0.12010Avoideddemand2022ElectrificationActivityEnergyefficiencyTransportFuelswitchingIndustrySectorBuildingsOther2050Transport2022BuildingsActivityIndustryTransportIndustryBuildings2050IEA.CCBY4.0.Today,transportaloneaccountsformorethanhalfoffinalenergyconsumption.IntheSTEPS,totalfinalenergyconsumptionincreasesby50%by2050,mainlydrivenbyincreasedtransportdemand.IntheAPS,finalenergyconsumptionincreasesbyonly6%thanksinparttoacceleratedelectrificationthattempers33%oftheincreaseinactivity.Figure2⊳FuelconsumptioninindustrybytypeandscenarioinCostaRicaEnergy-intensiveindustriesOtherindustryActivitydrivers0.04300EJIndex(2022=100)0.0220020101002050202220302030Cement2050AluminiumLAC2030IndustryVA2050IEA.CCBY4.0.201020222030205020302050STEPSAPSSTEPSAPSCoalOilNaturalgasBioenergyElectricityOtherIEA.CCBY4.0.Energy-intensiveindustriesaccountforover40%ofenergydemandinindustrytoday.IntheAPS,bioenergycontinuestoplayakeyrole,andelectricityuserisesasindustrialheatpumpssupplylow-temperatureheat.Oiluseinindustryishalvedby2050comparedtotoday.InternationalEnergyAgencyLatinAmericaEnergyOutlookFigure3⊳FuelconsumptionintransportbytypeandscenarioinCostaRica0.16RoadNon-roadActivitydrivers400EJIndex(2022=100)0.123250.082500.0417520101002050202220302030205020302050201020222030205020302050STEPSAPSSTEPSAPSOilNaturalgasBioenergyElectricityOtherPassengercarsTrucksLACIEA.CCBY4.0.Thetransportsectoristhelargestsourceofenergy-relatedCO2emissionsinCostaRica.Electrificationplaysakeyroletodecarbonisetransportinfutureyears.IntheAPS,electricityis50%ofconsumptionin2050,curbingenergydemandgrowth.Figure4⊳FuelconsumptioninbuildingsbytypeandscenarioinCostaRicaHeatingandSpacecoolingandActivitydrivers7000.03cookingappliancesEJIndex(2022=100)0.025000.0130020101002050202220302030205020302050201020222030205020302050STEPSAPSSTEPSAPSAirconditionerstockFloorspaceLACOilNaturalgasBioenergyElectricityOtherIEA.CCBY4.0.IEA.CCBY4.0.Mostcookingneedstodayaremetbyelectricity.IntheAPS,theshareofoilinheatingandcookingdeclinesastheshareofelectricityrises1.4-timesfromits2022level.IntheSTEPS,theincreaseindemandforappliancesandspacecoolingisresponsiblefor60%oftheincreaseinelectricityconsumptioninthebuildingssector.CostaRicaenergyprofileFigure5⊳AverageelectricitydailyloadprofilebyscenarioinCostaRica62022STEPS2050APS205054GW3210h24h0h24h0h24hIndustryBuildingsTransportIEA.CCBY4.0.Peakelectricitydemanddoublesby2050fromcurrentlevelsintheSTEPSandincreasesmorethan3.5-timesintheAPS.Itrisesover80%morethanaverageelectricitydemand.Electricityfortransportisthemaindriveroftheincreaseinelectricitypeakdemand.Figure6⊳ElectricitygenerationandcapacitybyfuelandscenarioinCostaRica4030STEPSAPSSTEPSAPS2010TWh152050GW12202292030205062030205032010202220502022CoalOilNaturalgasBioenergyNuclearHydroWindSolarPVBatteryOtherDedicatedrenewablesforhydrogenIEA.CCBY4.0.IEA.CCBY4.0.Hydropowerdominatesthecurrentpowermix.Itcontinuestoplayakeyroleto2050inbothscenarios.Geothermalplaysanimportantrolebothtodayandinthefuture.WindandsolarPVmeetmostoftheelectricitydemandincreaseinbothscenarios.IntheAPS,theirshareoftotalgenerationrisesfrom10%todaytomorethan50%in2050.InternationalEnergyAgencyLatinAmericaEnergyOutlookFigure7⊳FueldemandandproductionbyscenarioinCostaRicaOil(mb/d)Naturalgas(bcm)Low-emissionshydrogen(Mt)0.090.030.120.060.020.080.030.010.04202220302050203020502022203020502030205020222030205020302050STEPSAPSSTEPSAPSSTEPSAPSProductionDemandIEA.CCBY4.0.After2030,demandforoilplateausintheSTEPSanddecreasessignificantlyintheAPS.Low-emissionshydrogenproductionanddemandisaround0.1Mtby2050intheAPS.Figure8⊳AnnualinvestmentinenergysupplybytypeandscenarioinCostaRica20302022CleanenergyHydro2050STEPSNon-hydrorenewablesAPSNuclearBatterystorageSTEPSElectricitygridsAPSCleanfuelsOtherlow-emissionsUnabatedfossilfuelsOilCoalNaturalgasOtherfossilfuels0.20.40.60.81.01.2BillionUSD(2022,MER)IEA.CCBY4.0.IEA.CCBY4.0.Investmentincleanenergysupplyaccountsfor0.3%ofGDPinCostaRicaintheSTEPSin2050and0.8%intheAPS.IntheAPS,investmentincleanenergysupplyincreasesfourfoldby2030fromcurrentlevels,andoverUSD0.6billionisinvestedinrenewablesin2050.CostaRicaenergyprofileNoteshahectaresUnitskmkilometreAreaDistanceGtCO2gigatonnesofcarbondioxideEmissionsMtCO2milliontonnesofcarbondioxideMtCO2-eqmilliontonnesofcarbon-dioxideequivalent(using100‐EnergyyearglobalwarmingpotentialsfordifferentgreenhousetCO2-eqgases)Gastonnesofcarbon-dioxideequivalentEJMassPJexajoule(1joulex1018)MonetaryTWhpetajoule(1joulex1015)OilTcalterawatt-hourPowerteracalorie(1caloriex1012)bcmbcm/dbillioncubicmetresmcm/dbillioncubicmetresperdaymillioncubicmetresperdaykgktkilogrammekilotonnes(1tonne=1000kg)USDmillionUSDbillion1USdollarx1061USdollarx109mb/db/dmillionbarrelsperdaybarrelsperdayGWMWgigawattkVmegawattkilovoltIEA.CCBY4.0.TermsActivitydriversforindustryincludeproductionlevels(Mt)andvalueadded(USD2022,PPP);fortransport,vehicle-kilometres(km)forpassengercarsandtonne-kmfortrucks;forbuildings,airconditioning(millionunits)andfloorspace(millionsquaremetres).TheactivitynumberspresentedcorrespondtotheStatedPoliciesScenario(STEPS)indexedonthe2022value.Bioenergyreferstobioenergyandwaste.Cleanfuelsreferstobiofuels,hydrogenandhydrogen-relatedfuels.InternationalEnergyAgencyLatinAmericaEnergyOutlookIEA.CCBY4.0.Dailyaverageelectricityloadprofilesdonotfactorinelectricitydemandgeneratedbydedicatedrenewablesourcesconnectedtoelectrolysers,andtheyalsodonotconsidertheinfluenceofdemand-responsemechanisms.Energy-intensiveindustriesincludechemicals,ironandsteel,non-metallicminerals(cementandother),non-ferrousmetals(aluminiumandother)andpulp,paperandprinting.Heatingandcookinginbuildingsreferstoenergydemandforspaceandwaterheating,andcooking.Hydrogendemandexcludesbothhydrogenexportsandthehydrogenusedforproducinghydrogen-basedfuelswhichareexported.Investmentdataarepresentedinrealtermsinyear-2022USdollars.Large-scaleCCUSprojectsreferonlytofacilitieswithaplannedcapturecapacityhigherthan100000tonnesofCO2peryear.Low-emissionshydrogenprojectsconsideredarethosewithanannouncedcapacityfor2030.Non-roadtransportincludesrail,domesticnavigation,domesticaviation,pipelineandothernon-specifiedtransport.Otherforpowergenerationandcapacityreferstogeothermal,concentratedsolarpower,marine,non-renewablewasteandothernon-specifiedsources.Otherforfinalconsumptioninsectorsreferstonon-renewablewaste,hydrogen,solarthermalandgeothermal.Otherinasectorcategoryreferstoagricultureandothernon-energyuses.Otherfossilfuelsinenergysupplyinvestmentrefertonon-renewablewasteandothersupplysources.Otherfuelshiftsincludebioenergy,nuclear,solarthermal,geothermalandnaturalgas.Otherindustryreferstotheconstruction,foodandtobacco,machinery,miningandquarrying,textileandleather,transportequipment,woodindustrybranchesandremainingindustry.Otherlow-emissionsinenergysupplyinvestmentincludeheatpumps,CCUS,electricitygenerationfromhydrogen,electricitygenerationfromammoniaanddirectaircapture.Roadtransportincludessixvehiclecategories(passengercars,buses,two/three-wheelers,light-dutyvansandtrucks,andmediumandheavytrucks).SDG7referstoSustainableDevelopmentGoal(SDG)7:“ensureaccesstoaffordable,reliable,sustainableandmodernenergyforall”,adoptedbytheUnitedNationsin2015.Solarpotentialdataiscalculatedbasedontheaveragepotentialatnationallevelassessedinkilowatt-hourperkilowattpeakperday(2020).CostaRicaenergyprofileTotalfinalconsumptionincludesconsumptionbythevariousend‐usesectors(industry,transport,buildings,agriculture,andothernon‐energyuse).Itexcludesinternationalmarineandaviationbunkers,exceptatworldlevelwhereitisincludedinthetransportsector.AcronymsScenarios:STEPS=StatedPoliciesScenario;APS=AnnouncedPledgesScenario.AFOLUagriculture,forestryandotherlanduseBECCSbioenergywithcarboncaptureandstorageCCUScarboncapture,utilisationandstorageCNGcompressednaturalgasEVelectricvehicleGDPgrossdomesticproductGHGgreenhousegasesH2hydrogenHVDChighvoltagedirectcurrentICEinternalcombustionengineMEPSminimumenergyperformancestandardsMERmarketexchangerateNDCNationallyDeterminedContributionPPPpurchasingpowerparityPVphotovoltaicsSDGSustainableDevelopmentGoalsVAvalueaddedZEVzeroemissionsvehicleThepolicytablesincludeexistingpoliciesandannouncementsasoftheendofSeptember2023.Thesameappliestothetablesofexistingandannouncedprojects.TheIEAdoesnotusecolourstorefertothevarioushydrogenproductionroutes.However,whenreferringtospecificpolicyannouncements,programmes,regulationsandprojectswhereanauthorityusescolourtodefineahydrogenproductionroute,e.g.greenhydrogen,weusethatterminologytoreportdevelopmentsinthisreview.IEA.CCBY4.0.InternationalEnergyAgencyLatinAmericaEnergyOutlookInternationalEnergyAgency(IEA)ThisworkreflectstheviewsoftheIEASecretariatbutdoesnotnecessarilyreflectthoseoftheIEA’sindividualmembercountriesorofanyparticularfunderorcollaborator.Theworkdoesnotconstituteprofessionaladviceonanyspecificissueorsituation.TheIEAmakesnorepresentationorwarranty,expressorimplied,inrespectofthework’scontents(includingitscompletenessoraccuracy)andshallnotberesponsibleforanyuseof,orrelianceon,thework.SubjecttotheIEA’sNoticeforCC-licencedContent,thisworkislicencedunderaCreativeCommonsAttribution4.0InternationalLicence.Thisdocumentandanymapincludedhereinarewithoutprejudicetothestatusoforsovereigntyoveranyterritory,tothedelimitationofinternationalfrontiersandboundariesandtothenameofanyterritory,cityorarea.Unlessotherwiseindicated,allmaterialpresentedinfiguresandtablesisderivedfromIEAdataandanalysis.IEAPublicationsInternationalEnergyAgencyWebsite:www.iea.orgContactinformation:www.iea.org/contactTypesetinFrancebyIEA-November2023Coverdesign:IEAPhotocredits:©GettyImages


 VIP
VIP VIP
VIP VIP
VIP VIP
VIP VIP
VIP VIP
VIP VIP
VIP VIP
VIP VIP
VIP VIP
VIP