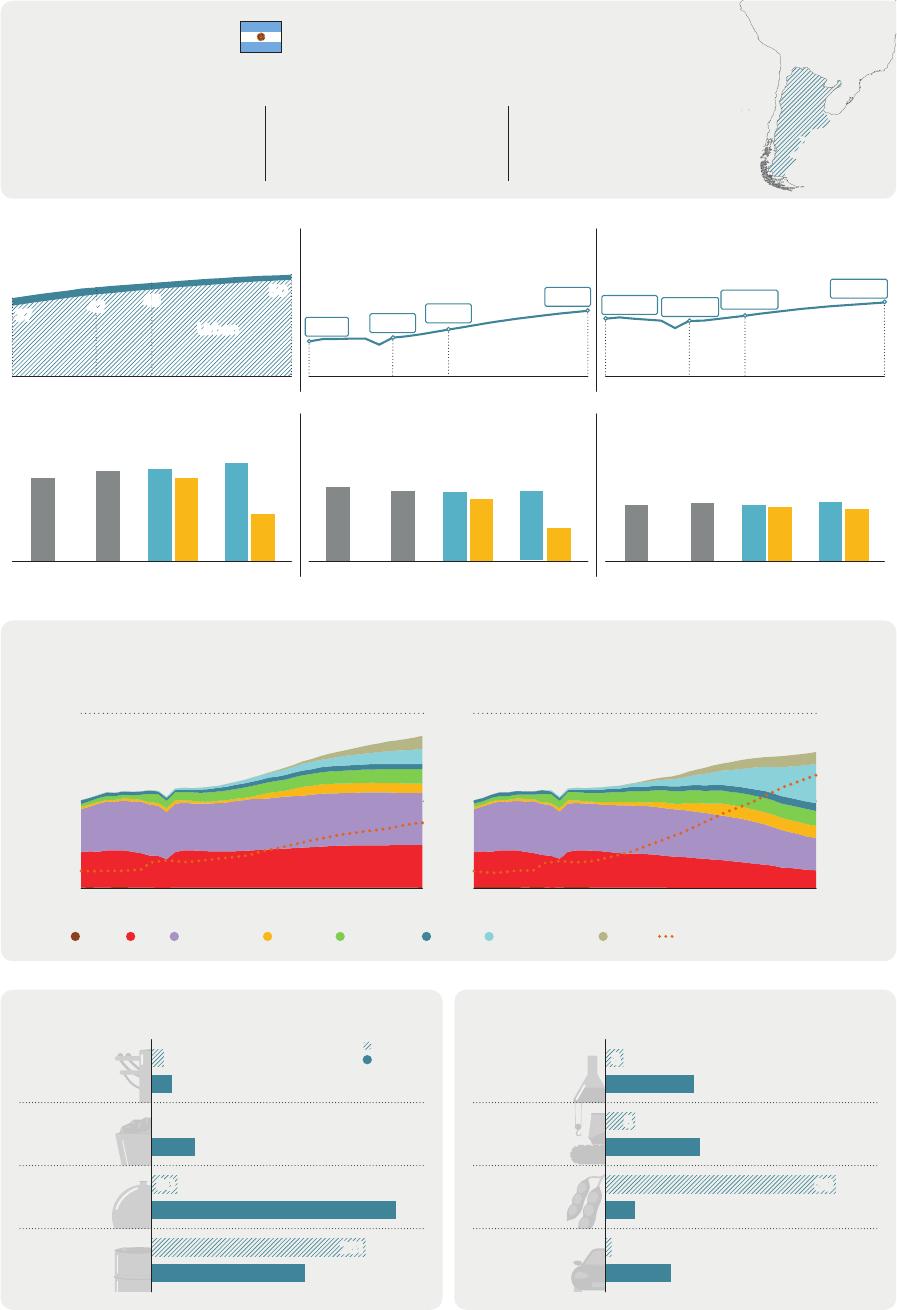
LatinAmericaEnergyOutlookOverview:ArgentinaWorldEnergyOutlookSpecialReportINTERNATIONALENERGYAGENCYTheIEAexaminestheIEAmemberIEAassociationfullspectrumcountries:countries:ofenergyissuesincludingoil,gasAustraliaArgentinaandcoalsupplyandAustriaBrazildemand,renewableBelgiumChinaenergytechnologies,CanadaEgyptelectricitymarkets,CzechRepublicIndiaenergyefficiency,DenmarkIndonesiaaccesstoenergy,EstoniaKenyademandsideFinlandMoroccomanagementandFranceSenegalmuchmore.ThroughGermanySingaporeitswork,theIEAGreeceSouthAfricaadvocatespoliciesHungaryThailandthatwillenhancetheIrelandUkrainereliability,affordabilityItalyandsustainabilityofJapanenergyinitsKorea31membercountries,Lithuania13associationLuxembourgcountriesandMexicobeyond.NetherlandsNewZealandThispublicationandanyNorwaymapincludedhereinarePolandwithoutprejudicetothePortugalstatusoforsovereigntyoverSlovakRepublicanyterritory,totheSpaindelimitationofinternationalSwedenfrontiersandboundariesSwitzerlandandtothenameofanyRepublicofTürkiyeterritory,cityorarea.UnitedKingdomUnitedStatesTheEuropeanCommissionalsoparticipatesintheworkoftheIEASource:IEA.InternationalEnergyAgencyWebsite:www.iea.orgArgentinaLargest2nd6thnaturalgasproducerinLatinlargestlithiumproducerinlargestCNGvehicleleetAmericaandtheCaribbeanLatinAmericaandtheCaribbeanintheworldPopulationMillionpeopleGDPBillionUSD(2022,PPP)GDPpercapitaUSDpercapita(2022,PPP)3Rural34450357004245140019002780026600293003711001200Urban201020222030205020102022203020502010202220302050CO2emissionsMtCO2CO2emissionspercapitatCO2/capitaEnergyintensityGJperthousandUSD2024.24.03.93.5(2022,PPP)171185189971713.91.92.72.82.72.62.82.5201020222030EJ205020102022203020502010202220302050STEPSAPSPrimaryenergysupplyandshareoflow-emissionssourcesAPSSTEPS100%6350%2010205020102050Shareoflow-emissions(rightaxis)CoalOilNaturalgasNuclearBioenergyHydroWindandsolarOtherTradeofmainenergyproducts(2021)PJTradeofnon-energyproducts(2021)BillionUSD1439ExportsChemicals3ElectricityImports1523Coal50Machinery5Gasandtransport16Oil30equipment287Food5251products1801Manufactured11goodsTable1⊳RecentpolicydevelopmentsinArgentinaPolicyPublicationyearEconomy-wide•NDC:maximumabsolutetargetof349MtCO2-eqin2030.2021measures•Long-termstrategy:GHGneutralityby2050.2022Justtransitionpolicies•NationalEnergyTransitionPlanto2030includes8%reductionofenergy2023AFOLUdemand,atleast50%ofrenewableelectricitygeneration.Producereconomies•DecreeN°332/2022:EnergySubsidySegmentationPlan.2022HydrogenPower•GreenEmploymentProgramme.2023Industry•ResolutionNo255/2021:FederalNetworkofArgentinianMiningWomen.2021Transport•PilotprogrammeofpaymentsbasedonREDD+results(reductionof2020Buildingsdeforestationemissionsanddegradationofforests)-target2027.•Law27.487topromoteinvestmentinforestplantations.2019•DecreeN°892/2020:“PlanGas.Ar”-subsidiestothehydrocarbonindustry.2020•2023-2050NationalStrategyfortheDevelopmentoftheHydrogen20232017Economy.20222022•Law27.424incentivisestheintegrationofdistributedgenerationtothe2023publicelectricitynetwork(netmeteringscheme)-1GWdistributedsolarPVby2030.•Nationalplanforindustrialdevelopment:RecommendationstoleveragefinancialsupportandtaxcreditsofmorethanUSD3billion.•NationalPlanforSustainableTransportation:ReduceGHGemissionstominimum5.84MtCO2-eqbelowabusiness-as-usualscenarioby2030-target15%ofvehiclestorunonnaturalgas.•NationalHousingLabellingProgramme(PRONEV)tounifyenergyefficiencylabellingsystem.Table2⊳MajorinfrastructureprojectsinArgentinaHydrogen/ProjectSizeDateStatusDescriptionammonia35ktH2/yearonlineNuclearPampas(production)2024DedicatedrenewablesHydro104ktH2/yearRioNegro(phase1)2024DedicatedrenewablesOilandgas(capacity)2027Transmission,CAREMproject32MWSmallmodularreactorinterconnectionsNéstorKirchnerand20251310MWSouthernmostJorgeCepernic2024hydroelectricdamshydroelectricplant20bcm/dNéstorKirchnernatural470kmnaturalgasgaspipelinephase2pipelineAMBAI500/220/132kV-Substationsandhighvoltagelines(+500km)IEA.CCBY4.0.ArgentinaenergyprofileFigure1⊳FinalenergyconsumptionbyscenarioinArgentina64STEPSAPS2EJLever2010Avoideddemand2022ElectrificationActivityEnergyefficiencyTransportFuelswitchingIndustrySectorBuildingsOther2050Transport2022BuildingsActivityIndustryTransportIndustryBuildings2050IEA.CCBY4.0.Today,transportandbuildingsaccountfortwo-thirdsoftotalfinalenergyconsumption.Inbothscenarios,transportenergyconsumptionrisesthemostthroughto2050.IntheSTEPS,totalfinalconsumptionincreases50%by2050.IntheAPS,finalenergyconsumptionrisesbyonly17%thankstoelectrificationandenergyefficiencygains.Figure2⊳FuelconsumptioninindustrybytypeandscenarioinArgentinaEnergy-intensiveindustriesOtherindustryActivitydrivers0.5225EJIndex(2022=100)0.42000.31750.21500.112520101002050202220302030205020302050201020222030205020302050STEPSAPSSTEPSAPSCrudesteelChemicalsIndustryVALACCoalOilNaturalgasBioenergyElectricityOtherIEA.CCBY4.0.IEA.CCBY4.0.Today,around45%ofenergyusedinenergy-intensiveindustriesisnaturalgas:energy-intensiveindustriesaccountfor60%oftotalenergydemandinindustryinArgentina.IndustrialactivityinArgentinaseeslessgrowththantheaverageintheregion.MostofthismodestincreaseismetbynaturalgasandelectricityintheSTEPS.IntheAPS,mostoftheincreaseismetbyelectricitywhilegasandoilconsumptiondecline.InternationalEnergyAgencyLatinAmericaEnergyOutlookFigure3⊳FuelconsumptionintransportbytypeandscenarioinArgentina1.6RoadNon-roadActivitydrivers300EJIndex(2022=100)1.22500.82000.415020101002050202220302030205020302050201020222030205020302050STEPSAPSSTEPSAPSOilNaturalgasBioenergyElectricityOtherPassengercarsTrucksLACIEA.CCBY4.0.Oilaccountsfornearly80%oftransportenergyconsumptiontoday.Naturalgasseesitscurrentshareriseinbothscenarios;EVsalesriserapidly,especiallyintheAPS.Roadfreightandpassengercaractivitybothincreaseby160%between2022and2050.Figure4⊳FuelconsumptioninbuildingsbytypeandscenarioinArgentinaHeatingandSpacecoolingandActivitydrivers7000.8cookingappliancesEJIndex(2022=100)0.65500.44000.225020101002050202220302030205020302050201020222030205020302050STEPSAPSSTEPSAPSAirconditionerstockFloorspaceLACOilNaturalgasBioenergyElectricityOtherIEA.CCBY4.0.IEA.CCBY4.0.Naturalgascurrentlymeets80%ofheatingandcookingneeds.Energyefficiencygainstemperincreasesindemandforheatinginbothscenarios.Demandforspacecoolingrisesbyover25%by2030intheSTEPSandmorethan15%intheAPS.Appliancesaccountformostgrowthinelectricityconsumptioninbuildingsinbothscenarios.ArgentinaenergyprofileFigure5⊳AverageelectricitydailyloadprofilebyscenarioinArgentina602022STEPS2050APS20505040GW3020100h24h0h24h0h24hIndustryBuildingsTransportIEA.CCBY4.0.Between2022and2050,peakelectricitydemandincreasesby70%intheSTEPSandmorethandoublesintheAPS:mainlydrivenbycoolingneedsandrisingfleetofEVs.IntheAPS,smartchargingofEVscouldplayacentralroleinpeakdemandmanagement.Figure6⊳ElectricitygenerationandcapacitybyfuelandscenarioinArgentinaSTEPSAPS240STEPSAPSTWh6002050GW45018020223002030120205015020306020502010205020222022CoalOilNaturalgasBioenergyNuclearHydroWindSolarPVBatteryOtherDedicatedrenewablesforhydrogenIEA.CCBY4.0.IEA.CCBY4.0.Naturalgassupplies50%ofelectricitytoday,butwindandsolarPVmeetmostofthedemandgrowthinbothscenarios,drivenbythesignificantwindpotentialinPatagonia.IntheAPS,solarPVandwindproduce67%ofelectricitygenerationby2050,upfrom12%today.Nucleargenerationalsoincreases.Gas-firedgenerationfallssteadily.InternationalEnergyAgencyLatinAmericaEnergyOutlookFigure7⊳FueldemandandproductionbyscenarioinArgentinaOil(mb/d)Naturalgas(bcm)Low-emissionshydrogen(Mt)1.28040.96030.64020.3201202220302050203020502022203020502030205020222030205020302050STEPSAPSSTEPSAPSSTEPSAPSDemandProductionIEA.CCBY4.0.IntheSTEPS,oilproductionincreasesby40%to2030andthenplateaus.Argentinabecomesanaturalgasexporterasgasproductionincreasesby25%to2030.IntheAPS,abundantrenewableenergypotential(windinthesouthandsolarinthenorth)enableslow-emissionshydrogenproductiontoreachover3Mtin2050.Figure8⊳AnnualinvestmentinenergysupplybytypeandscenarioinArgentina20302022CleanenergyHydro2050STEPSNon-hydrorenewablesAPSNuclearBatterystorageSTEPSElectricitygridsAPSCleanfuelsOtherlow-emissionsUnabatedfossilfuelsOilCoalNaturalgasOtherfossilfuels510152025BillionUSD(2022,MER)IEA.CCBY4.0.IEA.CCBY4.0.IntheSTEPS,investmentincleanenergysupplyincreasesfrom0.4%ofGDPtodayto0.9%by2050.IntheAPS,itreacheseight-timesthecurrentlevel.IntheAPS,mostremainingfossilfuelinvestmentisfornaturalgasby2050.ArgentinaenergyprofileNoteshahectaresUnitskmkilometreAreaDistanceGtCO2gigatonnesofcarbondioxideEmissionsMtCO2milliontonnesofcarbondioxideMtCO2-eqmilliontonnesofcarbon-dioxideequivalent(using100‐EnergyyearglobalwarmingpotentialsfordifferentgreenhousetCO2-eqgases)Gastonnesofcarbon-dioxideequivalentEJMassPJexajoule(1joulex1018)MonetaryTWhpetajoule(1joulex1015)OilTcalterawatt-hourPowerteracalorie(1caloriex1012)bcmbcm/dbillioncubicmetresmcm/dbillioncubicmetresperdaymillioncubicmetresperdaykgktkilogrammekilotonnes(1tonne=1000kg)USDmillionUSDbillion1USdollarx1061USdollarx109mb/db/dmillionbarrelsperdaybarrelsperdayGWMWgigawattkVmegawattkilovoltIEA.CCBY4.0.TermsActivitydriversforindustryincludeproductionlevels(Mt)andvalueadded(USD2022,PPP);fortransport,vehicle-kilometres(km)forpassengercarsandtonne-kmfortrucks;forbuildings,airconditioning(millionunits)andfloorspace(millionsquaremetres).TheactivitynumberspresentedcorrespondtotheStatedPoliciesScenario(STEPS)indexedonthe2022value.Bioenergyreferstobioenergyandwaste.Cleanfuelsreferstobiofuels,hydrogenandhydrogen-relatedfuels.InternationalEnergyAgencyLatinAmericaEnergyOutlookIEA.CCBY4.0.Dailyaverageelectricityloadprofilesdonotfactorinelectricitydemandgeneratedbydedicatedrenewablesourcesconnectedtoelectrolysers,andtheyalsodonotconsidertheinfluenceofdemand-responsemechanisms.Energy-intensiveindustriesincludechemicals,ironandsteel,non-metallicminerals(cementandother),non-ferrousmetals(aluminiumandother)andpulp,paperandprinting.Heatingandcookinginbuildingsreferstoenergydemandforspaceandwaterheating,andcooking.Hydrogendemandexcludesbothhydrogenexportsandthehydrogenusedforproducinghydrogen-basedfuelswhichareexported.Investmentdataarepresentedinrealtermsinyear-2022USdollars.Large-scaleCCUSprojectsreferonlytofacilitieswithaplannedcapturecapacityhigherthan100000tonnesofCO2peryear.Low-emissionshydrogenprojectsconsideredarethosewithanannouncedcapacityfor2030.Non-roadtransportincludesrail,domesticnavigation,domesticaviation,pipelineandothernon-specifiedtransport.Otherforpowergenerationandcapacityreferstogeothermal,concentratedsolarpower,marine,non-renewablewasteandothernon-specifiedsources.Otherforfinalconsumptioninsectorsreferstonon-renewablewaste,hydrogen,solarthermalandgeothermal.Otherinasectorcategoryreferstoagricultureandothernon-energyuses.Otherfossilfuelsinenergysupplyinvestmentrefertonon-renewablewasteandothersupplysources.Otherfuelshiftsincludebioenergy,nuclear,solarthermal,geothermalandnaturalgas.Otherindustryreferstotheconstruction,foodandtobacco,machinery,miningandquarrying,textileandleather,transportequipment,woodindustrybranchesandremainingindustry.Otherlow-emissionsinenergysupplyinvestmentincludeheatpumps,CCUS,electricitygenerationfromhydrogen,electricitygenerationfromammoniaanddirectaircapture.Roadtransportincludessixvehiclecategories(passengercars,buses,two/three-wheelers,light-dutyvansandtrucks,andmediumandheavytrucks).SDG7referstoSustainableDevelopmentGoal(SDG)7:“ensureaccesstoaffordable,reliable,sustainableandmodernenergyforall”,adoptedbytheUnitedNationsin2015.Solarpotentialdataiscalculatedbasedontheaveragepotentialatnationallevelassessedinkilowatt-hourperkilowattpeakperday(2020).ArgentinaenergyprofileTotalfinalconsumptionincludesconsumptionbythevariousend‐usesectors(industry,transport,buildings,agriculture,andothernon‐energyuse).Itexcludesinternationalmarineandaviationbunkers,exceptatworldlevelwhereitisincludedinthetransportsector.AcronymsScenarios:STEPS=StatedPoliciesScenario;APS=AnnouncedPledgesScenario.AFOLUagriculture,forestryandotherlanduseBECCSbioenergywithcarboncaptureandstorageCCUScarboncapture,utilisationandstorageCNGcompressednaturalgasEVelectricvehicleGDPgrossdomesticproductGHGgreenhousegasesH2hydrogenHVDChighvoltagedirectcurrentICEinternalcombustionengineMEPSminimumenergyperformancestandardsMERmarketexchangerateNDCNationallyDeterminedContributionPPPpurchasingpowerparityPVphotovoltaicsSDGSustainableDevelopmentGoalsVAvalueaddedZEVzeroemissionsvehicleThepolicytablesincludeexistingpoliciesandannouncementsasoftheendofSeptember2023.Thesameappliestothetablesofexistingandannouncedprojects.TheIEAdoesnotusecolourstorefertothevarioushydrogenproductionroutes.However,whenreferringtospecificpolicyannouncements,programmes,regulationsandprojectswhereanauthorityusescolourtodefineahydrogenproductionroute,e.g.greenhydrogen,weusethatterminologytoreportdevelopmentsinthisreview.IEA.CCBY4.0.InternationalEnergyAgencyLatinAmericaEnergyOutlookInternationalEnergyAgency(IEA)ThisworkreflectstheviewsoftheIEASecretariatbutdoesnotnecessarilyreflectthoseoftheIEA’sindividualmembercountriesorofanyparticularfunderorcollaborator.Theworkdoesnotconstituteprofessionaladviceonanyspecificissueorsituation.TheIEAmakesnorepresentationorwarranty,expressorimplied,inrespectofthework’scontents(includingitscompletenessoraccuracy)andshallnotberesponsibleforanyuseof,orrelianceon,thework.SubjecttotheIEA’sNoticeforCC-licencedContent,thisworkislicencedunderaCreativeCommonsAttribution4.0InternationalLicence.Thisdocumentandanymapincludedhereinarewithoutprejudicetothestatusoforsovereigntyoveranyterritory,tothedelimitationofinternationalfrontiersandboundariesandtothenameofanyterritory,cityorarea.Unlessotherwiseindicated,allmaterialpresentedinfiguresandtablesisderivedfromIEAdataandanalysis.IEAPublicationsInternationalEnergyAgencyWebsite:www.iea.orgContactinformation:www.iea.org/contactTypesetinFrancebyIEA-November2023Coverdesign:IEAPhotocredits:©GettyImages


 VIP
VIP VIP
VIP VIP
VIP VIP
VIP VIP
VIP VIP
VIP VIP
VIP VIP
VIP VIP
VIP VIP
VIP