欧洲电力回顾(2023)European Electricity Review 2023VIP专享VIP免费

European
Electricity
Review
2023
Ember’s analysis of the EU electricity
transition in 2022: what happened in
2022, what can we expect for 2023?
Publication date
31 January 2023
About
The European Electricity Review analyses full-year electricity generation and
demand data for 2022 in all EU-27 countries to understand the regions progress
in transitioning from fossil fuels to clean electricity. It is the seventh annual report
on the EU power sector published by Ember (previously as Sandbag). Our data is
free and easily downloadable, and is available at annual and monthly granularity. We
hope others also find the data useful for their own analysis.
Lead author
Dave Jones
Other contributors
Sarah Brown, Paweł Czyżak, Hannah Broadbent, Chelsea Bruce-Lockhart,
Reynaldo Dizon, Matt Ewen, Nicolas Fulghum, Libby Copsey, Alison Candlin, Chris
Rosslowe and Harriet Fox.
Disclaimer
The information in this report is complete and correct to the best of our knowledge,
but if you spot an error, please email info@ember-climate.org
Creative Commons
This report is published under a Creative Commons ShareAlike Attribution Licence
(CC BY-SA 4.0). You are actively encouraged to share and adapt the report, but you
must credit the authors and title, and you must share any material you create under
the same licence.
Copyright © Ember, 2023
2
Contents
4 Executive Summary
8 Chapter 1 | Pathway for 1.5C
10 Chapter 2 | The Big Picture
32 Chapter 3 | EU Electricity Trends
33 Electricity Demand
37 Power Sector CO2 Emissions
44 Electricity Generation
45 Chapter 4 | Electricity Source Trends
46 Solar
50 Wind
54 Coal
58 Gas
62 Hydro
66 Nuclear
70 Bioenergy
74 Conclusion
75 Supporting Materials
3
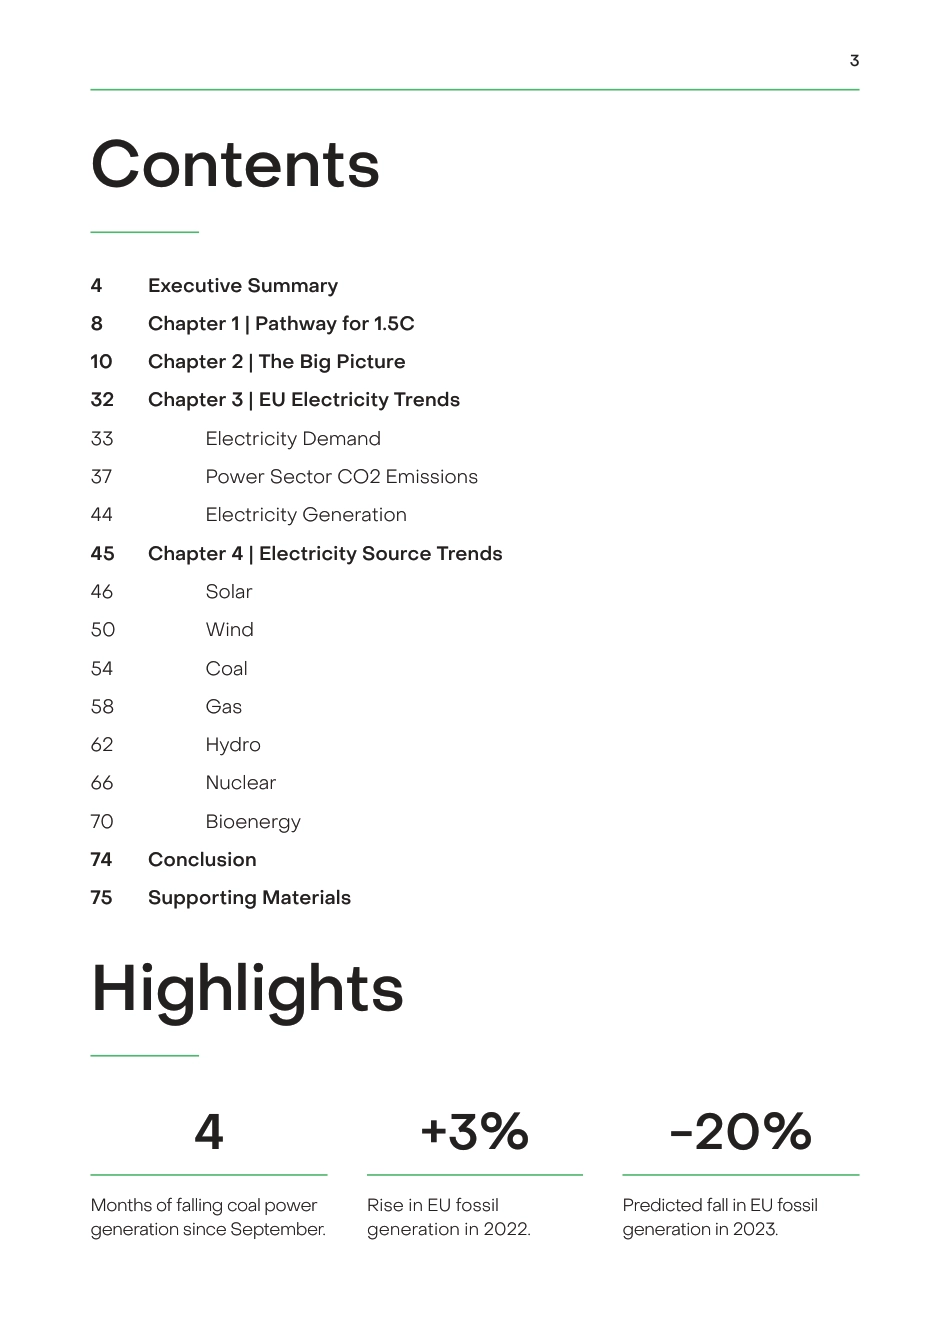
Highlights
4+3% -20%
Months of falling coal power
generation since September.
Rise in EU fossil
generation in 2022.
Predicted fall in EU fossil
generation in 2023.
EuropeanElectricityReview2023Ember’sanalysisoftheEUelectricitytransitionin2022:whathappenedin2022,whatcanweexpectfor2023?Publicationdate31January2023AboutTheEuropeanElectricityReviewanalysesfull-yearelectricitygenerationanddemanddatafor2022inallEU-27countriestounderstandtheregion’sprogressintransitioningfromfossilfuelstocleanelectricity.ItistheseventhannualreportontheEUpowersectorpublishedbyEmber(previouslyasSandbag).Ourdataisfreeandeasilydownloadable,andisavailableatannualandmonthlygranularity.Wehopeothersalsofindthedatausefulfortheirownanalysis.LeadauthorDaveJonesOthercontributorsSarahBrown,PawełCzyżak,HannahBroadbent,ChelseaBruce-Lockhart,ReynaldoDizon,MattEwen,NicolasFulghum,LibbyCopsey,AlisonCandlin,ChrisRossloweandHarrietFox.DisclaimerTheinformationinthisreportiscompleteandcorrecttothebestofourknowledge,butifyouspotanerror,pleaseemailinfo@ember-climate.orgCreativeCommonsThisreportispublishedunderaCreativeCommonsShareAlikeAttributionLicence(CCBY-SA4.0).Youareactivelyencouragedtoshareandadaptthereport,butyoumustcredittheauthorsandtitle,andyoumustshareanymaterialyoucreateunderthesamelicence.Copyright©Ember,2023CreativeCommonsThisreportispublishedunderaCreativeCommonsShareAlikeAttributionLicence(CCBY-SA4.0).Youareactivelyencouragedtoshareandadaptthereport,butyoumustcredittheauthorsandtitle,andyoumustshareanymaterialyoucreateunderthesamelicence.Copyright©Ember,20232Contents4ExecutiveSummary8Chapter1Pathwayfor1.5C10Chapter2TheBigPicture32Chapter3EUElectricityTrends33ElectricityDemand37PowerSectorCO2Emissions44ElectricityGeneration45Chapter4ElectricitySourceTrends46Solar50Wind54Coal58Gas62Hydro66Nuclear70Bioenergy74Conclusion75SupportingMaterials3Highlights4+3%-20%MonthsoffallingcoalpowergenerationsinceSeptember.RiseinEUfossilgenerationin2022.PredictedfallinEUfossilgenerationin2023.ExecutiveSummaryEurope’selectricitytransitionemergesfromtheenergycrisisstrongerthaneverCoalgenerationhasbeenfallingsincethestartofwinter,andastheelectricitytransitionheatsup,fallingfossilfuelpower—especiallygas—issettobethestoryof2023.Europe’spoliticalresponsetoRussia’sinvasionofUkrainein2022wastoaccelerateitselectricitytransition.Thereisnowafocusonrapidlycuttinggasdemand—atthesametimeasphasingoutcoal.Thismeansamassivescale-upincleanenergyisonitsway.In2022,windandsolargeneratedarecordfifthofEUelectricity(22%),forthefirsttimeovertakingfossilgas(20%),andremainingabovecoalpower(16%).However,theshiftawayfromfossilfuelswasputonholdbythetwincrisesinEurope’selectricitysystemin2022.A1-in-500yeardroughtacrossEuropeledtothelowestlevelofhydrogenerationsinceatleast2000,andtherewerewidespreadunexpectedFrenchnuclearoutagesjustasGermannuclearunitswereclosing.Thiscreatedalarge185TWhgapingeneration,equalto7%ofEurope’stotalelectricitydemandin2022.Five-sixthsofthegapwasmadeupbymorewindandsolargenerationandafallinelectricitydemand.Buttheremainingsixthwasmetbyincreasedfossilgeneration.Sincecoalwaslessexpensivethangas,coalaccountedforthemajorityoftheincrease,rising7%(+28TWh)in2022,comparedto2021.Asaresult,EUpowersectoremissionsroseby3.9%(+26MtCO2)in2022comparedto2021.Gasgenerationwasalmostunchanged(+0.8%),andbecausegaswasalreadymoreexpensivethancoalin2021,therewasnofurtherswitchingfromgasintocoalin2022.Itcouldhavebeenmuchworse:wind,solarandafallinelectricitydemandpreventedamuchlargerreturntocoal.Incontext,therisewasnotsubstantial:coalpowerincreasedbyjust1.5percentagepointstogenerate16%ofEUelectricityin2022,remainingbelow2018levels.The28TWhriseinEU’scoalgenerationaddedonly0.3%toglobalcoalgeneration.2023willbequitetheopposite.Hydrogenerationwillrebound,Frenchnuclearunitswillreturn,windandsolardeploymentwillaccelerate,andelectricitydemandwilllikelycontinuetofalloverthecomingmonths.In2023,Europeissettowitnessahugefallinfossilfuels—ofcoalpower,yes,butespeciallygaspower.Europe’scoalpowerisnowfallingCoalgenerationfellinallfourofthefinalmonthsof2022.Itdroppedby6%(-9.6TWh)fromSeptembertoDecembercomparedtothesamemonthsin2021.Thiswasprimarilycausedbyfallingelectricitydemand.The26coalunitsbroughtbackasemergencystandbyranatjust18%averageutilisationthroughoutQ42022;nineofthe26unitsdidnotprovideanygeneration.Thesestandbyadditions015addedonly0.9%toEUcoalgenerationin2022.Despiteimporting22milliontonnesofextracoalthroughout2022,theEUonlyusedathirdofthisandthesurplustwo-thirdsremainedunused.Perhapsmostencouragingly,countriesremainascommittedtophasingoutcoalastheywerebeforethecrisis.ElectricitydemandstartedtofallfastEUelectricitydemandhasbeguntofallfast—droppingby7.9%inQ42022comparedtothesameperiodthepreviousyear—closeinscaletothe9.6%fallwitnessedinQ22020whenEuropewasinlockdown.ThistrendwasobservedinallEUcountries.PriortoOctober,thefallwasmuchlessnotable.AllthreemonthsofQ42022werewarmerthanin2021,butweatheralonewouldnotexplainsuchlargefalls.Itislikelythattemporarycutsweredrivenlargelybyaffordabilityconcerns,alongsidesolidaritybymanycitizenstocutenergydemandinatimeofcrisisandimprovementsinenergyefficiency.Thetransitionwillultimatelybringamajorriseindemandthroughelectrification.Andwiththestepupinheatpumps,EVsandelectrolysersin2022,itisapparentthatthischangewillhappenquickly.Wemustnotallowthecurrentfallindemandtoslowdowntheroll-outofcleanenergy.Solar’ssurgeisonlyjuststartingSolargenerationrosebyarecord39TWh(+24%)in2022,helpingtoavoid€10billioningascosts.Thiswasduetorecordinstallationsof41GWin2022,47%morethanwasaddedin2021.TwentyEUcountriesachievedtheirhighestevershareofsolarelectricity.TheNetherlandswastheleader,producing14%ofitspowerfromsolar—overtakingcoalgenerationforthefirsttime.GreeceransolelyonrenewablesforfivehoursinOctoberandisexpectedtoreachits2030solarcapacitytargetof8GWbytheendof2023,sevenyearsearly.Forthefirsttime,windandsolarreachedoverafifth(22%)ofEUelectricityin2022.02036“Europehasavoidedtheworstoftheenergycrisis.Theshocksof2022onlycausedaminorrippleincoalpowerandahugewaveofsupportforrenewables.Anyfearsofacoalreboundarenowdead.Europe’scleanpowertransitionemergesfromthiscrisisstrongerthanever.NotonlyareEuropeancountriesstillcommittedtophasingoutcoal,theyarenowstrivingtophaseoutgasaswell.TheenergycrisishasundoubtedlyspedupEurope’selectricitytransition.Europeishurtlingtowardsaclean,electrifiedeconomy,andthiswillbeonfulldisplayin2023.Changeiscomingfast,andeveryoneneedstobereadyforit.”DaveJonesHeadofDataInsights,EmberGasgenerationsetforarecordfallin2023Fossilgenerationrose3%in2022.Basedonthelatestindustryprojections,thiswillnotberepeatedin2023.EDFforecastsmanyofitsFrenchnuclearplantswillreturnin2023(andmanyarealreadybackonlinealready),Europe’swindandsolarindustrygroupsshowsolarandwindgenerationshouldrisebyabout20%,hydrostockshavenearlynormalisedandelectricitydemandwilllikelycontinuetofallintheshortterm.TheonlybrakeswillbethefallinnuclearasGermanycompletesitsphase-out.Basedontheseindicationsfromtheindustry,Emberestimatesthatfossilgenerationcouldplummetby20%in2023,doublethepreviousrecordfrom2020.Coalgenerationwillfall,butgasgenerationwillfallthefastest,sinceitisexpectedtoremainmoreexpensivethancoaluntilatleast2025basedoncurrentforwardprices.Thepowersectorislikelytobethefastestfallingsegmentofgasdemandduring2023,helpingtobringcalmtoEuropeangasmarketsasEuropeadjuststolifewithoutRussiangas.047Chapter1Pathwayfor1.5CShiftingtocleanelectricityby2035TransformingEurope’selectricitysectorwillbeacriticalpartofbuildinganewenergysystemthataddressesthetriplecrisisofclimate,energysecurityandaffordability.Actionthisdecadeiscritical,notonlytoaddresstheimmediatefossilfuelcrisis,buttoquicklybendthecurveonemissions.ThisisanecessityifEuropeistomakeafaircontributiontothegoalsoftheParisAgreement.DecarbonisingandexpandingEurope’selectricitysupplyisthemosteffectivewaytodisplacefossilfuelsacrosstheeconomy,reducingrelianceonimportedenergy.Thegoodnewsisallthetechnologiesrequiredtosuperchargethetransitionareavailableandaffordable,withwindandsolarpowerformingthebackboneofthetransition.ThereisampleevidencethatEuropemustachieveafullydecarbonisedpowersystembythemid2030sforapathwaythatkeeps1.5Cinreach.ThisconclusionisreachedbothbytheIEANetZeroroadmapandanassessmentofthelatestclimatemodelsusedbytheIPCC.TheUKandGermanyarealreadyaimingforcompletelydecarbonisedpowerby2035andtheG7havesetasimilartarget,howeveraunifiedsignalfromEuropeandtheEUislacking.ModellingbyEmbershowsthatthisispossible.Europecanachieveacleanpowersystemby2035;atnoextracostabovestatedplansandwithoutcompromisingsecurityofsupply.Makingthisvisionarealitywillrequireinvestmentaboveandbeyondexistingplans,aswellasimmediateactiontoaddressbarrierstotheexpansionofcleanenergyinfrastructure.SuchamobilistionwouldboosttheEuropeaneconomy,cementtheEU’spositionasaclimateleaderandsendavitalinternationalmessagethatthesechallengescanbeovercome.9Chapter2TheBigPictureInsightsThebiggeststoriesof2022:thereturntocoalthatwasn’t,winterdemandcollapseandsolar’ssurge.Andlookingforward,2023shouldbetheyearthatthefullscaleofthetransitionbecomesclear.FollowingRussia’sinvasionofUkraine,itwasimmediatelyobviousthatEurope’senergysystemwouldhavetochangeforever.Someexpectedthatthisnewgeopoliticallandscapewouldmeanthatthetransitionfromfossilfuelstocleanpowerwouldbeputonpause.Instead,theEUmadeanambitiousenergytransitionanimmediatepriority,centraltoitsresponsetomultipleemergingcrises.AcrossEurope,thecostoffossilfuelreliancecameintofocus,withattentiononhowthisfedintosecurityvulnerabilitiesandcostoflivingincreases,aswellasunprecedenteddisastersstemmingfromextremeweather.Annualpowersectordatareflectstheimpactofthesecrises,butindicatorslookingtowardsthenextyearsuggestthat2022wasthestartofaprofoundshiftthatwillcontinuelongbeyondtheemergencyresponsesofthemoment.Insight1:ThefallacyofEurope’s“returntocoal”ThebackgroundtoEurope’s“returntocoal”WhenRussiainvadedUkraineinFebruary2022,itquicklybecameapparentthatEuropewasfacingagascrisis.Therewerenumerous,rapidresponsesatanEUandMemberStateleveltomitigatetherisksandreducethescaleofthecrisis.Amongahostofothermeasures,theseincludedreactivatingcoalunits,importingmorecoalanddiversifyingfossilfuelsupplies.Combinedwithrisingcoalgenerationatthestartofsummer(theEU’scoalburninMarchwas35%higherthaninMarch2021),thiscreatedinternationalspeculationthatEuropewas“returningtocoal”.ThebackgroundtoEurope’s“returntocoal”CoalpowerhasbeeninstructuraldeclineintheEUforthepastdecade.Evenwiththerisein2022,coalgenerationwasstill37%below2015levels,producingjust16%oftheEU’selectricity.Thetemporaryuptickin2022wasasmallbumpinthepathtophasingoutcoalinEurope,withawiderviewshowingwhyitisinaccuratetosayEurope“returnedtocoal”.ThewintercoalsurgedidnotmaterialiseEUcoalgenerationfellineachofthelastfourmonthsof2022,comparedtothesamemonthsin2021.InSeptemberitfellby2%,Octoberby13%,Novemberby7%andDecemberby2%.Acrossthefourthquarterof2022,thismeantafallof7%inEUcoalgeneration.Gasgenerationfellevenfurtheroverthesameperiod,by10%.Thefallincoalpowerthiswinterwasduetoamajordecreaseinelectricitydemand.Thiscanbeattributedtotheeffortsofhouseholdsandindustrytoreduceelectricityconsumption,combinedwithmildweather.HadFrenchnuclearpowernotseenreducedgenerationpersistwellintoDecember,thefallsincoalinQ4wouldundoubtedlyhavebeenevengreater.Insight2providesmoredetailonthisdeclineindemand.Thewintercoalsurgedidnotmaterialise11Acrosstheyear,totalEUcoalgenerationroseby7%in2022comparedto2021.Therewerelargerisesincoalgenerationearlierintheyear,ashighas35%inMarch2022versusMarch2021.Whilemanycommentatorsspeculatedthisearlytrendcouldcontinueintowinter,theoppositehappened.LowhydroandnucleargenerationdroveriseincoalburnUnderstandingcoal’s7%riseaspartoftheresponsetotheshortfallinnuclearandhydroputsitintoperspective.Nuclearandhydrogenerationin2022fellby185TWhcomparedtothepreviousyear,sixtimesmorethancoal’sriseingeneration(28TWh).Togivesomecontextofthescale,185TWhisequalto7%oftheEU’stotalgenerationin2022.Five-sixthsofthegapfromnuclearandhydrowasmetbyincreasedwindandsolargenerationandfallingelectricitydemand,whereasonlyone-sixthwasmadeupfromincreasedcoalgeneration.Gasgenerationwasalmostunchanged(+0.8%).Lowhydroandnucleargenerationdroveriseincoalburn12Whileanyriseincoalcausesunderstandablealarm,coalhadarelativelyminorroleinrespondingtotheseshortfalls.Andgiventhatthesearenotrecurringfactors,2023islikelytoplayoutverydifferently[seeInsight4].TheshortfallinhydropowerIn2022,Europefaceditsworstdroughtinatleast500years,pushinghydrogenerationtoitslowestlevelsinceatleast2000.Hydrogenerationwas66TWhbelow2021,leadingtoa19%year-on-yearfall,from349TWhin2021to283TWhin2022.2021wasslightlywetterthanaverage,howeverhydropowergenerationin2022was50TWhbelowthe2000-2021average.TheAlpineregionwastheworsthit,withgeneration9%belowthelowestyearsofarthiscentury.TheIberianregionsawthefourthlowestlevelofhydrogenerationthiscentury,andtheNordicregionsawgenerationslightlyaboveaverage.Ofthe50TWhshortfallagainstaverage2000-2021levels,15TWhwasinItaly,13TWhinFranceand11TWhinSpain.Thesituationisnowalmostremediated.BySeptember2022,hydrogenerationwasbacktothelevelsseenin2021.2023hasstartedwithhydrostocksonlyslightlylowerthanthehistoricalaverages.Theshortfallinhydropower13TheshortfallinhydropowerEUnuclearpowerfellby16%(119TWh)in2022.Ofthisfall,69%wasinFrancefromoutages,and27%ofitwasasaresultofGermannuclearplants.In2022,arecordnumberofFrenchnuclearreactorswentoffline,resultinginthelowestoutputin30years.Thiswas82TWhbelow2021levels,leadingtoa22%year-on-yearfall,from379TWhin2021to297TWhin2022.Thesituationimprovedtowardstheendoftheyearwhenaslewofreactorsreturnedtothemarket.ByJanuary9thof2023,72%oftotalcapacitywasoperational(44GW),comparedtojust48%onaverageacross2022.Germany’snucleargenerationalmosthalvedfrom69TWhin2021to37TWhin2022,followingunitsclosinginDecember2021.ThefinalunitswillcomeofflineinApril2023.Theshortfallinnuclearpower14TheshortfallinhydropowerFranceishistoricallythebiggestexporterofelectricityinEurope.However,forthefirsttimesinceatleast2000,Francebecameanetimporterwithtotalflowsswitchingby59TWh.Germany,SpainandtheUKallflippedfrombeingnetimportersfromFrancetonetexporterstoFranceforthefirsttimesinceatleast2015.Thatmeansalmosttwo-thirds(59TWh)ofthe96TWhfallinFrance’syear-on-yearnuclearandhydrogenerationwasreplacedbyimportedelectricityfromothercountries.CoalgenerationinSpainroseby3TWh,butwith15TWhmoreelectricitysenttoFrancethanin2021.WithoutFrance’sissues,itishighlylikelythatcoalgenerationwouldnothaveriseninSpain.InGermany,coalroseby17TWh,but11TWhmoreelectricitywassenttoFrancethanin2021;FranceundoubtedlycontributedtosomeoftheriseinGermancoalgeneration.Withthesechanges,2022highlightedhowimportantinterconnectorsarehelpingtoachievesecurityofsupply.Two-thirdsofFrance’snuclearandhydroshortfallwasmadeupbyothercountries15TheshortfallinhydropowerSwitchingfromgas-firedgenerationbacktodirtiercoalplayedlittlepartincoal’srisein2022.Gasgenerationfor2022asawholewasalmostunchanged(+0.8%)from2021.FromJuly2021,whenRussiafirstbegancurtailingEuropeangasflows,thegaspricerosesignificantlyabovecoal.Thisledtoswitchingfromgastohardcoalgenerationin2021.Consequently,therewaslittlecoal-gasswitchingin2022,becausemostofithadalreadyhappened.Gas-to-coalswitchingplayedlittleroleincoal’srisein202216TheshortfallinhydropowerWithRussia’sinvasionofUkraineandassociatedenergyblackmail,Europewascompelledtoactivatetemporaryemergencymeasurestoensureenergysecurity,especiallyforthiscurrentwinter.Theseincludedthecreationofstrategicreservesbyseveralgovernments,allowingcoalplantstoremainoperationalbeyondscheduledshutdowndatesormothballedplantstobeplacedonstandby.ReactivatedcoalunitsbarelyimpactedtheEU’scoalgeneration17Intotal,26coalunitswith11GWofcapacitythatshouldhavebeenofflineinthefourthquarterof2022werepermittedtoreturntoorremaininthemarket.Theseunitsspanacrosssevencountries,with19(73%)inGermany.Theaverageutilisationofthe26unitsduringthisperiodwasjust18%.Sincecomingbackonline,theseunitshavegenerated4TWh.ThatispredominatelylignitegenerationinGermany.Thisrepresentsonly0.9%oftheEU’stotal2022coalgenerationof447TWh.EUcoalpowerroseby28TWhin2022,soonly14%ofthisrisecanbeattributedtothereactivationofthesecoalunits.Afurther11GWofplantsinItalyandtheNetherlandshadloadfactorlimitsremovedtoenablethemtorunmoreifrequired.IntheNetherlands,alawwaspassedinJune2022revokinganorderfromDecember2021thatlimitedcoalplantsto35%capacity.Sincethen,thefourremainingDutchcoalplantshavegeneratedat45%capacity,lowerthanthe65%capacityoverthesameperiodin2021.InItaly,capacitylimitsoncoalplantswereliftedinAugust2022,lastinguntilMarch2023.Therewasnoobservablechangesincethisdecree—coalunitsranatanaverageof30%capacityin2022,thesameasin2021.TheshortfallinhydropowerImportsofthermalcoalintotheEUincreasedby51%in2022,asEuropesoughttoincreasestocklevels.Importsrosefrom43milliontonnes(Mt)in2021to65Mtin2022.However,RussiancoalimportswerebannedinAugust2022,resultinginanevenlargerpick-upincoalimportsfromothercountries.ImportsfromSouthAfricaandAustraliarosesixfoldfrom2to13Mtand1to6Mtrespectively;fromIndonesiatheyrosefromnear-zeroto6Mt;fromColombiatheyroseby80%from8to14Mt.Althoughthisincreasewaslarge,itledtosomewildlyexaggeratedclaims.InJune,Indonesia’sMinistryofEnergyandMineralResourcesrevealedaplantoincreaseitscoalproductiontargetfollowingasupposedrequestfromGermanytobuyupto150MtfromIndonesia.AlatercommunicationfromtheIndonesianembassyinBerlinstatedthefigurewasonly5-6Mt.However,whilecoalimportsroseby22Mtlastyear,hardcoalpowerplantsburnedonly8Mtmorecoal(excludingPoland,whichmostlysuppliesitshardcoalplantswithdomesticcoal).Therefore,onlyjustoverathirdoftheextracoalthatwasimportedwasburned.Theremainingtwo-thirdsoftheextracoalimportedwasimplicitlyaddedtostockpiles.Two-thirdsofthesurgeinimportedcoalwasstockpiled,notburnt18Europe’sstrategywastoreplenishlowstocklevelsfromlastwinter,whichbeganwithrelativelylowstockpiles,andtoenterthiswinterwithextrahighstockpiles.Thiswasincasetherewasanemergencyinthegassystemduringwinter,althoughfortunatelythisscenariodidnotmaterialise.Asaresult,coalisnowpilingup.Withstocksalreadyhighgoinginto2023,coalimportsareunlikelytostayhigh.TheshortfallinhydropowerTherestartingofcoalplantsisonlyatemporary,emergencymeasure.ThemajorityofcoalunitsinreservefacilitieshaveonlybeengrantedpermissiontocontinueoperatingoverthiswinteruntiltheendofMarch2023.GermanyisallowingitsemergencyreserveplantstobeavailableuntilMarch2024butremainsfirmlycommittedtoitscoalexitplan.Thegovernmenthasreiterated,“thecoalexitin2030isn’twobblingatall.Itismoreimportantthaneverthatithappensin2030.”RWEhasmadethisevenmoreofarealitybyagreeingtophaseoutallofitscoalplantseightyearsearlierthanexpected,in—2030insteadof2038.Romaniaalsomoveditscoalexitdateforwardfrom2032to2030.Europe’scoalphase-outisstillverymuchalive19TheNetherlandsandCzechiaarenotamendingtheirrespectivecoalphase-outdatesof2029and2033.FranceisonlyallowingtheEmileHuchet6unit(595MW)tobeinreserveforthiswinter.AndAustriahasclearlystatedthattheMellachplantiscomingoutofretirement“sothatinanemergencyitcanonceagainproduceelectricityfromcoal(notgas)”.TheseactionsindicatethatEuropehasnointentionofreturningtocoal.TheconsensusinEuropeisthattheonlywaytopermanentlyextricateitselffromthecostandsecuritycrisesitfacesistogetoffallfossilfuels,bothcoalandgas,andtodosoasquicklyaspossible.Insight2:Europe’sbigfallindemandthiswinterTowardstheendof2022,theEUsawafallinelectricitydemandonthesamescalewitnessedduringthedeepestCovid-19lockdowns.Itwasthereasonwhycoalandgasgenerationfellinthefinalmonthsof2022.Fallingelectricitydemandwillbeamajorthemeinto2023,andmoreworkisneededtounderstandhowstructuralthisdemandshiftis,orifwecanexpecttoseeareboundlikewiththeeconomicrecoveryfromtheCovid-19pandemic.Europesawasubstantialfallinelectricitydemandof7.9%inthefourthquarterof2022,closeinscaletothatwitnessedduringthemostextremelockdowns,whendemandfellby10.2%inQ22020.ElectricitydemandintheEUforOctoberdroppedby10%,Novemberby9%andDecemberby7%year-on-year.Althoughthesewerelessthanthefallsingasdemand,whichwere25%inOctoberand23%inNovember,thedecreasesinelectricitydemandnecessitateacloserlook.Mildtemperaturesplayedaroleinlowerdemand:October,NovemberandDecemberin2022werewarmerby1.9,0.8and0.9degreescelsiusrespectivelyacrossEuropecomparedto2021.However,temperatureexplainsonlypartofthisfallindemand.ThefallinelectricitydemandinthelastquarteroftheyearoccurredatasimilarmagnitudeinmostEUcountries.Likewise,themajorityofcountrieshadnotseenalargedemandfallin2022priortoQ4.2021The8%dropinelectricitydemandinQ42022wastheprimaryfactorinthe9%fallincoalandgasgenerationoverthesameperiod.Coalgenerationfellforfourconsecutivemonths,andgasgenerationfortwo.ThiswasdespiteFrenchnuclearavailabilityremaininglowuntillateDecember.HadFrenchnuclearplantsrunatthesamelevelsas2021,thedemandfallwouldhavecuttheEU’sfossilgenerationtwiceasfast,by18%inQ4.TheshortfallinhydropowerBroadly,thereasonsbehindthefallindemandareclear.Incidentalactionsreducingelectricitydemandoverthewinterhavebeenmuchdiscussedinthepressandelsewhere,butdetailedquantificationischallenging.Someofthereductionmaybeattributedtoinvestmentsintoefficiency.Sometoreductionsinindustrialandcommercialoutput.Muchofitislikelytobeachangeinbehaviourwithcost-of-livingchallenges,electricitypricesrisingandactionsinsolidarityagainstRussia’sinvasion.Someofthatisvoluntary,aswellassomemandatedelectricitydemandreductionsintroducedforthewinterbytheEuropeanCommissioninSeptember2022.Thesecurrentlyonlyapplyuntil31March2023.Whatdoesthedemandfalltellus?22Itishardtopredictthepermanenceorlongevityoftheshiftindemand.WhentheEuropeanCommissionandtheIEAanalysedthewaystourgentlyreduceRussiangasimportsin2022,itwasassumedthatbehaviourchangerelatedtoenergysavings,suchasturningdownheatingthermostats,wouldbetemporaryandnotsustainedinto2023.Therearemultipleuncertaintiesrelatedtoforecastingfuturedemand.Willsummerequallyseeshiftsindemandwithchangestoairconditioninguse?Willthereductionsgrowaselectricitybillsrisefurtherin2023,orcoulddemandquicklyreboundbacklikeitdidfollowingCovid-19impacts?Thisfallinelectricitydemandisunprecedented,buttheseuncertaintiescomplicateplanningintotheyearsahead.Whatisalreadyevidentthoughisthatthecrisiswillspurfasterelectrification.HeatpumpsalesdoubledinPoland,Italy,AustriaandtheNetherlandsduringthefirsthalfof2022,EVsalesarehighandrising,andhydrogenelectrolyserssawastepchangein2022.Thisshiftmayaddtoelectricitydemandfasterthisdecadethanmanyexpertspreviouslythought.Onethingiscertain:thecurrentlullinelectricitydemandmustnotbeanexcusetoslowdowntherolloutofcleanenergy.Insight3:SolarshieldedEuropefromtheenergycrisisRussia’sinvasionofUkrainehadaprofoundimpactonEuropein2022,withtheresultinggasshortagesandall-time-highfossilfuelpricespushingthecontinentintoacostoflivingcrisis.Whilebothwindandsolardeliveredthroughtheenergycrunch,forthefirsttimegeneratingmorethanafifthofEUelectricityin2022(22%),itwassolarpowerthatreallyshined,settingelectricitygenerationrecordsandsavingbillionsinimportedgascosts.TheshortfallinhydropowerTheyear2022sawthelargesteverabsoluteincreaseinsolarelectricitygeneration.Itroseby39TWh(+24%),whichwasalmostdoubletheriseofanyyearsofar.Thatmirroredthe25%riseincapacityfrom168GWto209GW.Newinstallationsrosebyarecord41GWin2022,whichwas47%morethanwasinstalledin2021.Solarsetgenerationrecordsacrossthecontinent23Two-thirdsofthesurgeinimportedcoalwasstockpiled,notburntTwo-thirdsofthesurgeinimportedcoalwasstockpiled,notburntSolarproduced7.3%(203TWh)ofEUelectricityin2022,upfrom5.7%in2021.BetweenMayandAugust,12%oftheEU’spowercamefromsolar,exceeding10%forthefirstsummerinhistory.Thesefourmonthsweresweltering,settingnewtemperaturerecords.Ashydrogenerationfellshortduetothedroughtandnuclearoutputwascutbecauseofwatertemperatureconstraints,solarreliablydelivered.TheshortfallinhydropowerTheNetherlandswastheunquestionablesolarenergyleaderof2022,generating14%ofitselectricityfromthesunandsurpassingpreviousleaderSpain,typicallyamuchsunniercountry,bytwopercentagepoints(12%).Forthefirsttime,solargenerationinboththeNetherlandsandGreecesurpassedthatofcoalgeneration.Overall,twentyEUcountriessetnewsolarsharerecordsin2022.For2022solarcapacityadditions,thetopfivecountrieswereGermany(7.9GW),Spain(7.5GW),Poland(4.9GW),theNetherlands(4GW)andFrance(2.7GW)Effectivepoliciesdrovesolargrowth24TheNetherlandshasdemonstratedhowsimpleandeffectivepoliciesdrivesolargrowth.Since2020,ithasbeensupportingresidentialsolarthroughnet-metering.Thisenabledarapidexpansionofrooftopsolar,with1.8GWofcapacityaddedin2022,38%morethanin2021(1.3GW).Othersolarsegmentsarethrivingaswell,withonemillionconsumerstakingpartinenergycooperatives.Commercialandutility-scalesolararesubsidisedbyatenderingscheme,with2.3GWoftheseprojectsapplyingforfinancingin2022alone.25ThesesupportivepoliciesledtosubstantialgrowthinDutchsolargeneration:risingfromjust1%ofthepowermixin2015to14%in2022.Inabsoluteterms,solargenerationgrewby51%in2022alone(from12TWhto17TWh).Somebarriers,suchasgridcongestion,arebeingswiftlyremovedbythegovernment.TheNetherlandsalsoannouncedarapidoffshorewindexpansionplaninresponsetoRussia’sinvasionofUkrainethatputsthecountryinlinewithatargetfora100%cleanpowersystemby2030.Solardeploymentisexpectedtoremainstrong,withan11GWlarge-scaleprojectpipelineandannualcapacityadditionsexpectedtostayabove4GWuntil2026.Aspectacularexampleofthestrengthofrenewablesin2022alsocamefromGreece,wheretheelectricitygridransolelyonrenewablesforfivehoursinOctober.Thiswaspossibleduetosolar’sshareinpowergenerationincreasingfrom9.6%in2021to12.6%,placingGreeceinsecondplaceonEurope’ssolarleaderboard.Greeceaddedarecord1.3GWinsolarcapacity,partlyasaresultofthesimplificationofpermitting,bringingitscumulativecapacityto5.5GW.SimilarlytootherregionsinEurope,gridcongestionisemergingasamajorbottleneck,andthegovernmentistacklingitthroughagridexpansionplanandasupportschemeforenergystorageunits.Thesolarprojectpipelineisalsostrong,witharound3GWofsolarprojectsauctionedin2022alone.Greeceisexpectedtoreachits2030totalinstalledsolartargetof7.7GWbytheendof2023,sevenyearsearly.TheshortfallinhydropowerEuropeangovernmentsquicklyrespondedtoRussia’sinvasionofUkraine,acceleratingclimatepoliciesandcuttingbothelectricitydemandandRussianfossilfuelimports.Butintheshadowoftop-levelaction,aquietrevolutionstarted.Europeanhouseholdsmassivelyinvestedinrooftopsolarpanels,adding25GWin2022,8GWmorethanin2021.Rooftopsolarnowrepresents66%oftheEU’stotalinstalledsolarcapacityof209GW.Newgovernmentinitiativeshelpedacceleraterooftopsolar’sgrowthin2022:Belgiumprovidedfreesolarpanelstohouseholdswhocouldnotaffordthem,andseveralstatesinGermanyintroducedarooftopsolarobligationonnewbuildings.TheEuropeanCommissionpublisheditsEUSolarEnergyStrategy,aimingtoovercomeworkforcebottlenecks,acceleraterooftopsolardeploymentandstreamlinepermitting.Europeancitizenssteppedup,deployingrooftopsolaratscale26Severalgovernmentsalsoraisedtheir2030renewableenergytargetsin2022,includingEstonia,France,Denmark,Greece,Ireland,theNetherlandsandPortugal.SolaravoidedbillionsingasimportcostsWithouttherecordsolargenerationof203TWh,theEUwouldhaverequiredanadditional35billioncubicmetres(bcm)ofgasimportstoproducethatelectricitywithgas.Thatistheequivalentofaround25%oftheEU’sRussiangasimportsin2021.ApplyingtheaverageEuropeanbenchmarkTTFgaspricefor2022of€121/MWh,thisequatesto€49billioninavoidedgascosts.Theyear-on-yearsolargrowthof39TWhalonedeliveredsavingsof7bcmand€10billion.KeepingthesolarmomentumgoingItiscrucialtheEUmaintainsthemomentumaroundsolarandimplementsnewmeasuresin2023toenableevenfasterdeployment.AsEmber’spreviousresearchshows,permittingtimesforsolarinsomeEUcountriesaredoublethetwoyearlimitsetintheRenewableEnergyDirective.TheEuropeanCouncilapprovedtemporaryemergencymeasurestolimitpermittingtimesinDecember2022.FutureamendmentstotheRenewableEnergyDirectivemustalsoaddressakeybottleneckforindustrialscalesolar:gridconnectiontimes.In2022,manyEUcountriesdemonstratedthatrooftopsolarcanramp-upatspeed.NowisthetimeforanEU-widesolarmandateonallnewandrenovatedbuildings,aswellasexistingnon-residentialbuildings.Whilethiswouldbeasubstantialinitiative,thesetargetsbuildonthosealreadysetintheEuropeanSolarRooftopsInitiativeandwouldhaveanimmediateimpactonhouseholdsinthecomingwinters.ThefutureisevenbrighterIn2018,theEUhad103GWofinstalledsolarcapacity.Injustfouryearsthatdoubled,reaching209GWattheendof2022.Fouryearsfromnow,anditispossiblethatsolarwillhavetripledagaintonearly600GW.SolaravoidedbillionsingasimportcostsKeepingthesolarmomentumgoingThefutureisevenbrighter27SolarPowerEurope’slatestforecastseesinstalledsolarcapacitygrowingby54GWin2023(mediumscenario)andbyupto68GW(highscenario).Thisis30-65%higherthantherecord41GWinstalledin2022.Andthisgrowthaccelerates.By2026,annualcapacityadditionsareanticipatedtoreach85GW(medium)and120GW(high).AspartofitsREPowerEUplantoexpediterenewablesdeploymentandreplacefossilfuels,theEuropeanCommissionhassetsolarcapacitytargetsof400GWby2025and740GWby2030.SolarPowerEurope‘shighscenarioshowsthatthisisnotambitiousenough,andcapacitywillreach484GWby2026and920GWby2030—evenunderitsmediumscenario—and591GWby2026and1184GWby2030underitshighscenario.Solargrowthhasconsistentlyexceededexpectations,andpoliciesarecontinuouslyevolvingtoenablehighertargets.ThecurrentambitionfromREPowerEUandSolarPowerEuropeisalignedwithandevenovershootingtherequirementsfor1.5C.ItisnowimperativethattheseEUgoalstranslateintolocalaction.MemberStatesmustensurethatregulationandinfrastructureisfitforpurposetoenabletherapidrateofdeploymentofrenewablesthatisnotonlynecessarybutinevitable.28Insight4:Coalandgasgenerationtoplummetin2023Coalgenerationroseby7%in2022,andgasgenerationroseby0.8%.Theincreaseinfossilgenerationof3%wasnecessaryduetotwoelectricitycrisesin2022:large-scaleoutagesofFrance’snuclearpowerplants,anda1-in-500yeardrought.However,2023willbeaverydifferentstory,evenasGermanycompletesitsnuclearphase-out.Frenchnuclearplantsshouldreturn,evenmoresolarandwindgenerationwillbeadded,hydroshouldreturntonormalandelectricitydemandwillcontinuetofall.Muchremainsunpredictableinourcurrentperiodofheightenedeconomic,geopoliticalandclimatevolatility.Butifourassumptionsbelowbasedoncurrentindicationscometofruition,fossilgenerationacrosstheEUwouldplummetby20%(211TWh)in2023.Thatwouldbealmostdoubletherecord11%dropseenin2020whenCovid-19struck.TheshortfallinhydropowerWeassumethattotalnucleargenerationwillremainunchangedin2023.InlinewithEDF’sannouncement,wecanexpectFrenchnucleargenerationtoriseby40TWh,howeverGermannuclearphase-outwillcompleteinApril,knocking30TWhoff2023production.Germannucleargenerationin2022was37TWh,buttwo(2.7GW)unitsweregivenextensionsuntilApril2023,atwhichpointGermannucleargenerationfallstozero.Weassumea10TWhdecreaseinotherEUcountries.Belgium’sTihange2(3GW)willcloseon31stJanuary,althoughthereshouldbeincreaseselsewhereasFinland’snewnuclearplantbeginscommercialoperation.Weassumethathydrorisesby40TWh.In2023,hydroshouldreboundbacktoseasonalnorms,whichwas50TWhhigherthanin2022.Butstocksenteredtheyearalittlelower,stilllingeringfromlowerrainfallin2022.Theconfirmedgrowthincapacityfrom2022into2023fromWindEuropeandSolarPowerEurope,showsanincrease19%higherthanthe72TWhrisein2022.Basedonthis,weassumethatwindandsolarrisesby86TWhin2023.Whattoexpectfor202329Electricitydemandisperhapsthebiggestuncertainty.Demandonlybeganfallinginearnestin2022inQ4,whichrecordedanunprecedented8%fall.Ifweassumea6%fallinQ12023,a3%fallinsummer2023,withQ42023thesameasin2022,thenthiswouldbea3%totalannualfallacross2023,or84TWh.AcrosstheEUpowersector,thistrajectorywouldmeanasubstantialdeclineinfossilgeneration,fallingby20%(211TWh)in2023.WhatthismeansforEuropeGasgenerationwillfallthefastest,asitisexpectedtoremainmoreexpensivethancoaluntilatleast2025(basedoncurrentforwardprices).Iftotalfossilgenerationfallsby20%,thatmeansanevenlargerpercentagefallingas.However,therewillbemanyhourswhengaspowerisnotrequired,especiallywithevenmorewindandsolaraddedanddecreaseddemand.Thismeanscoalgenerationwillverylikelyfallaswell.WhatthismeansforEurope30Thelargefallingasgenerationmeansthepowersectorislikelytobethefastestfallingsegmentofgasdemandduring2023,helpingtobringcalmtoEuropeangasmarketsasEuropeadjuststolifewithoutRussiangas.Adecreaseof20%inEUgasgenerationwouldreducetheEU’seconomy-widegasdemandby5%,therebycontributingtoamoresecuregassystemin2023.Thefirsttwoweeksof2023,atthetimeofwriting,hadalreadyseena29%fallinfossilgenerationcomparedtothesameperiodin2022,althoughtheweatherhasbeenmildandwindyacrossEurope.31DataontheEUelectricitysectorin2022,withanoverviewofchangesandtrendsoverthelasttwodecades.Chapter3EUElectricityTrendsDataontheEU’selectricitysectorin2022At2809TWh,theEUrepresents10%ofglobalelectricitydemand.Germanyhasthehighestelectricitydemand(556TWh),accountingforalmost20%oftotalEUdemand.GermanyisfollowedbyFrance(484TWh),Italy(322TWh)andSpain(265TWh).TheNordiccountriesofFinland(15MWh)andSweden(13MWh)havethehighestdemandpercapita,whileRomania(3MWh)hasthelowest.EUElectricityTrends2022ElectricityDemand2,809TWhEUtotaldemandin20226.31MWhEUdemandpercapitain20220108642161412CzechiaIrelandSloveniaEstoniaFranceBelgiumAustriaLuxembourgSwedenFinland0600500400300200100AustriaFinlandBelgiumNetherlandsSwedenPolandSpainItalyFranceGermanyEUcountrieswithhighestdemandElectricitydemand(TWh)EUcountrieswithhighestdemandpercapitaElectricitydemandpercapita(MWh)ElectricitydemandacrosstheEUElectricitydemand(TWh,y-axis)anddemandpercapita(MWh,x-axis)RegionalContextSource:EmberNote:usesfull-yeardatafor2022inallEU-27countries01086421412Demandpercapita(MWh)02000100080060040020028002600240022001800160014001200AustriaBelgiumBulgariaCroatiaCzechiaDenmarkFinlandFranceGermanyGreeceHungaryIrelandItalyLithuaniaNetherlandsPolandPortugalRomaniaSlovakiaSloveniaSpainSweden34DecNovOctSepAugJulJunMayAprMarFebJan0-8-6-42-2LargestincreasesLargestincreasesCyprusMaltaPortugalIreland054321LargestdeclinesLargestdeclinesLargestdeclinesFinlandSloveniaSwedenEstoniaRomaniaSlovakia0-8-6-4-2LargestincreasesLargestdeclinesLargestdeclinesLargestdeclinesLargestdeclines0Largestdeclines0Largestdeclines-6NetherlandsSpainItalyGermanySwedenFranceFinlandRomaniaBelgiumSlovakiaRestofEUTotal0-80-60-40-20FromOctober2022,EUelectricitydemandhasseenlargeyear-on-yearfalls.Itfellby8.5%inQ42022comparedtothesameperiodin2021.Earlierintheyear,electricitydemandwasonlyslightlydown.Thefallindemandwasprimarilyduetomildweather,alongsidedemandreductionmeasuresdriveninpartbyhighelectricityprices.Acrosstheyearasawhole,EUdemandfellby2.7%(-79TWh),from2888TWhin2021to2809TWhin2022.Thisfollowsasubstantialincreasein2021of118TWh(+4.2%)asdemandreboundedfromapandemiclow.Francerecordedthelargestabsolutereductionindemandin2022withdemandfallingby22TWh(-4.3%)to484TWhfrom505TWh.Slovakiasawthelargestrelativedecreasewithdemandfalling8.1%(-2.5TWh).AlmostallEUcountriesexperiencedfallingorstagnantdemandin2022.Malta,Cyprus,IrelandandPortugalweretheexception,withdemandgrowingbetween3and6%.KeychangesinEUelectricitydemandChangeinelectricitydemandyear-on-year(TWh)EUelectricitydemandElectricitydemand(TWh)Changein2022JanFebMarAprMayJunJulAugSepOctNovDec20028026024022018016020222022202120212020202020192019MonthlychangesinEUelectricitydemandChangeinelectricitydemandyear-on-year(%)LargestincreasesChangeinelectricitydemandyear-on-year(%)LargestdeclinesChangeinelectricitydemandyear-on-year(%)Source:EmberNote:usesfull-yeardatafor2022inallEU-27countries35202020152010200520000100-10050-50150-150108642161412RomaniaLatviaCyprusLithuaniaPolandCroatiaHungarySlovakiaMaltaGreeceItalyPortugalBulgariaSpainDenmarkNetherlandsGermanyCzechiaIrelandSloveniaEstoniaFranceBelgiumAustriaLuxembourgSwedenFinlandUntiltheCovid-19pandemic,EUelectricityusehasbeenlargelystablesince2010,followingrecoveryfromthefinancialcrisis.In2020,theimpactofthepandemicsawdemandreductionscomparablewiththoseofthefinancialcrisis,witha110TWhfallinpowerconsumption(comparedtoa151TWhdropin2009).In2022,demandwas2%belowwhatitwasatthetimeoftheParisAgreementin2015.EU-wideelectricitydemandpercapitahasremainedbroadlyflatoverthelasttwodecades.In2000,itwas6.2MWh,risingonlyslightlyto6.3MWh2022.However,thisvariesatthecountrylevel.EasternEuropeancountriessuchasHungary,Croatia,PolandandLithuaniahaveseenmoderateincreaseswhereaswesternEuropeancountrieslikeGermany,SpainandFrancehaveseendemandpercapitadecline.EUelectricitydemandisexpectedtoincreasethisdecadeaselectrificationexpandsacrosssectors,whichmayhappenquickerthanexpectedinresponsetotheenergycrisis.FranceGermanyItalySpainEU086-64-42-2AnnualchangesinelectricitydemandacrosstheEUChangeinelectricitydemandyear-on-year(%)AnnualchangesinEUelectricitydemandChangeinelectricitydemandyear-on-year(TWh)Long-termTrendsSource:EmberNote:usesfull-yeardatafor2022inallEU-27countries20152022Demandpercapita,EUcountriesElectricitydemandpercapita(MWh)20152022DEFRITESEUTotalRestofEUDemandsavings,however,havesofarkepttrackwiththeseincreases,andtherearestillmanyremainingopportunitiesforefficiencyimprovements.36TheEUhastheworld’sfourth-mostCO2emittingpowersector,consideredalongsidecountriesglobally.Itwasresponsiblefor712milliontonnesofCO2in2022,whichis5.7%oftheworld’stotalpowersectoremissions.At230milliontonnes,GermanyhasbyfarthehighesttotalpowersectoremissionsofanyEUcountryaheadofPoland,ItalyandSpain.Polandhasthemostcarbon-intensiveelectricityat692gCO2/kWh,duetoitsheavyuseofcoalforelectricitygeneration.AcrosstheEU,carbonintensityofelectricityproductionis255gCO2/kWh.EUElectricityTrends2022PowerSectorCO2Emissions712mtCO2EUpoweremissionsin2022255gCO2/kwhEUCO2intensityin20220700600500400300200100ItalyNetherlandsGreeceMaltaEstoniaGermanyBulgariaCzechiaCyprusPoland020010050150RomaniaGreeceBulgariaFranceNetherlandsCzechiaSpainItalyPolandGermanyEU’slargestpowersectoremittersTotalemissions(mtCO2)EU’sdirtiestelectricitygridsCO2intensity(gCO2/kWh)RegionalContextSource:EmberNote:usesfull-yeardatafor2022inallEU-27countriesEUpowersectoremissionsPowersectoremissions(mtCO2,y-axis)andCO2intensity(gCO2/kWh,x-axis)060050040030020010050650550450350250150CO2intensity(gCO2/kWh)0700600500400300200100AustriaBelgiumBulgariaCroatiaCyprusCzechiaDenmarkEstoniaFinlandFranceGermanyGreeceHungaryIrelandItalyNetherlandsPolandPortugalRomaniaSlovakiaSloveniaSpain38DecNovOctSepAugJulJunMayAprMarFebJan03020-2010-10LargestincreasesLargestincreasesBulgariaFranceCroatiaSpainItaly02010515LargestdeclinesLargestdeclinesLuxembourgDenmarkLithuaniaSlovakiaLatvia0-40-30-20-10LargestincreasesLargestdeclinesGermanySpainItalyCzechiaFranceBulgariaDenmarkSlovakiaPolandNetherlandsRestofEUTotal040302010Thelastfourmonthsof2022sawyear-on-yeardeclinesinEUpowersectorCO2emissions,resultingfromdemandreductionsandareductioninfossilgeneration.Overallpowersectoremissionsroseby3.9%(+26MtCO2)comparedto2021.Thiswasdespiteyear-on-yearincreasesofover20%forsomemonthsearlierintheyear,asnuclearandhydroshortfallsrequiredalargeincreaseoffossilgeneration,andespeciallyofcoalgeneration.ThebiggestabsoluteemissionsincreasewasfromGermany,producing230MtC02(+13MtCO2,+6.1%).OtherincreasescamefromSpain(+7.6MtCO2,+19%),Italy(+6.9MtCO2,+9.3%)andBulgaria(+4.7MtCO2,+23%).Thesecondbiggestemitter,Poland,hadthegreatestreductioninemissionsofallEUcountries(-3.7MtCO2,-2.9%).KeychangesinEUelectricityemissionsChangeinemissionsyear-on-year(mtCO2)EUpowersectoremissionsEmissions(mtCO2)Changein2022JanFebMarAprMayJunJulAugSepOctNovDec20028026024022018016020222022202120212020202020192019MonthlychangesinEUelectricityemissionsChangeinemissionsyear-on-year(%)LargestincreasesChangeinemissionsyear-on-year(%)LargestdeclinesChangeinemissionsyear-on-year(%)Source:EmberNote:usesfull-yeardatafor2022inallEU-27countries390800600400200SwedenFranceFinlandLuxembourgLatviaAustriaSlovakiaBelgiumDenmarkLithuaniaPortugalSpainCroatiaHungaryIrelandSloveniaRomaniaItalyNetherlandsGreeceMaltaEstoniaGermanyBulgariaCzechiaCyprusPoland2020201520102005200001,0008006004002001,2000600500400300200100202020152010200520000-10080-8060-6040-4020-20-1202022marksthesecondyearinarowofincreasingemissionsafterthepost-pandemicdemandreboundin2021sawemissionsriseby10%(+62milliontonnesofCO2),thelargesteveryear-on-yearincrease.However,theemissionsrisesin2021and2022followedthreeyearsofstrongemissionsreductionsbetween2018and2020.TheEU’scarbonintensityofelectricitygenerationin2022(255gCO2/kWh)issignificantlylowerthanitwasin2000(396gCO2/kWh).Windandsolardeploymenthasacceleratedsince2010,anddespitethedeclineinnucleargeneration(-29%since2000),theEUgridcontinuestogetcleaner.TotalEUemissionshavefallenby32%(-329MtCO2)since2010.SincetheParisAgreementin2015,carbonintensityhasfallenineveryEUcountry(withtheexceptionofFranceasaresultofthisyear’snuclearshortfall).Asaresult,EUannualpowersectoremissionshavedecreasedby22%(-195MtCO2)overthesameperiod.AnnualchangesinEUelectricityemissionsChangeinemissionsyear-on-year(mtCO2)Long-termTrendsSource:EmberNote:usesfull-yeardatafor2022inallEU-27countriesLong-termtrendsinEUelectricityemissionsEmissions(mtCO2,leftaxis)andCO2intensity(gCO2/kWh,rightaxis)EmissionsCO2intensityCarbonintensityofelectricity,EUcountriesCO2intensityofelectricity,(gCO2/kWh)20152022DEFRITESEUTotalRestofEU40TheEUwasanearlydeployerofrenewablepowersources,andcontinuestobealeaderinthisarea.Aproposed45%renewableenergygoalfor2030wouldsee69%oftheEU’selectricitygeneratedfromrenewablesbythatyear.Todayhowever,EUelectricitygenerationisstillheavilyreliantonfossilfuels.39%(1,104TWh)ofitselectricityisgeneratedfromcoal,gasandotherfossilsources.Coalproduces16%(447TWh),gas20%(557TWh)andotherfossilfuels3.6%(100TWh).NuclearremainsthesinglelargestcontributortoEUelectricityat22%(613TWh)ofthemix.15%(420TWh)isproducedbywindand7.3%(203TWh)isproducedbysolar.Combined,windandsolarproducemoreelectricitythananyotherfuel(22%,623TWh).Therestisproducedbyhydro(10%,283TWh),bioenergy(6%,167TWh)andotherrenewables(0.2%,6.7TWh).EUElectricityTrends20222,795TWhEUtotalgenerationin2022623TWhEUwindandsolargenerationin2022ElectricityGeneration1,104TWhEUfossilfuelsgenerationin2022SolarOtherresOtherfossilNuclearHydroGasCoalBioenergyWindEUelectricitymixShareofelectricity(%)0100908070605040302010EU0100908070605040302010Shareofgeneration(%)0200010008006004002002600240022001800160014001200AustriaBelgiumBulgariaCroatiaCzechiaDenmarkFinlandFranceGermanyGreeceHungaryIrelandItalyNetherlandsPolandPortugalRomaniaSlovakiaSloveniaSpainSwedenRegionalContextSource:EmberNote:usesfull-yeardatafor2022inallEU-27countriesSolarOtherresOtherfossilNuclearHydroGasCoalBioenergyWindElectricitygenerationacrosstheEUElectricitygeneration(TWh,y-axis)andshareofelectricity(%,x-axis)420100-10080-8060-6040-4020-20GermanyFranceSpainItalyPolandSwedenNetherlandsBelgiumCzechiaFinlandRestofEUSolarWindHydroNuclearCoalGasOtherTotal03020-2010-10SolarWindHydroNuclearCoalGasOtherTotal0-10050-50-150In2022,changesinEUelectricitygenerationweredominatedbyhistoricfallsinhydroandnucleargeneration.Hydrogenerationwasheavilyimpactedbyprolongedheatwavesinthesummer,fallingby66TWh(-19%).OutagesandmaintenanceofFrenchplantssignificantlydecreasedavailabilityofnucleargenerationthroughoutmostoftheyear.Germannuclearplantclosuresfurtherreducednuclearoutput.Asaconsequence,nucleargenerationdropped119TWh(-16%)toitslowestshareofthemix(22%)in40years.Frenchnuclearalonewasresponsiblefor82TWhoftheshortfall.Lowhydroandnuclearoutputmeantthatdespitelowerelectricitydemand,fossilgenerationincreasedyear-on-year.Coalwasup28TWh(+6.7%)andgaswasup4.5TWh(+0.8%).Windandsolargenerationcontinuedtogrow,withwindup33TWh(+8.6%)andsolargrowinganimpressive39TWh(+24%).Thisbroughttheirmarketshareto22%,upfrom19%inthepreviousyear.Otherfossilpower,otherrenewablesandbioenergygenerationallremainedlargelystable.AbsolutechangesinEUelectricitygenerationChangeingenerationyear-on-year(TWh)Changein2022RelativechangesinEUelectricitygenerationChangeingenerationyear-on-year(%)Source:EmberNote:usesfull-yeardatafor2022inallEU-27countriesElectricitygenerationchangesinEUcountriesChangeingenerationyear-on-year(TWh)JanFebMarAprMayJunJulAugSepOctNovDec030-3020-2010-10MonthlychangesinEUelectricitygenerationChangeingenerationyear-on-year(TWh)Wind+SolarHydro+NuclearGasCoalOtherWind+SolarHydro+NuclearGasCoalOtherOtherincludesbioenergy,otherrenewablesandotherfossilfuels.4320202015201020052000030002000100050025001500ThedefiningcharacteristicofthechangesinEUelectricitygenerationhasbeenthegrowthofwindandsolargenerationaswellasareductionofcoal.Windandsolargenerationhasgrownfromjust13%(364TWh)atthetimeoftheParisagreementto22%(623TWh)in2022.In2000,theshareofwindandsolargenerationinthemixwaslessthan1%.ThegrowthofwindandsolarhasallowedtheEUtoreducecoalgeneration.In2000,nearlyathirdoftheEU’selectricitywasgeneratedusingcoal(30%,800TWh).Ithadonlydeclinedslightlyto25%(705TWh)by2015.Sincethen,theaccelerationofwindandsolarbuilduphasreducedcoaltojust16%(447TWh)oftheelectricitymix.Coalgenerationhasfallensubstantially,andislikelytodeclinefurtherinthecomingyears.However,theEU’ssecondlargestcontributortoemissionsfromthepowersector,fossilgas,hasseenanincreaseoverthelasttwodecades.Itgrewfromjust13%(331TWh)in2000to20%(557TWh)ofthemixin2022.Gashasseensubstantialincreasessince2015,whenitcontributedonly14%(397TWh)toEUelectricitygeneration.Despitefallsinnucleargenerationoverthelasttwodecadesandsince2015,aswellastherecentriseingasgeneration,fossilgenerationasawholehasdeclinedsubstantially.Electricitygeneratedfromcleansourcesnowproduces61%(1,692TWh)oftheEU’selectricity.Fossilfuelsgenerate39%(1,104TWh).In2000,theyproduced48%(1,263TWh)and52%(1,361TWh)respectively.EUelectricitygenerationGeneration(TWh)Long-termTrendsSource:EmberNote:usesfull-yeardatafor2022inallEU-27countries20202015201020052000010080604020EUelectricitymixShareofelectricity(%)202220212020201920182017201620150-300200-200100-100AnnualchangesinEUelectricitygenerationChangeingenerationyear-on-year(TWh)EUtotalSolarOtherresOtherfossilNuclearHydroGasCoalBioenergyWind44DataonEUelectricitygenerationfrombioenergy,coal,gas,hydro,nuclear,solarandwindin2022,withanoverviewofchangesandtrendsoverthelasttwodecades.Chapter4ElectricitySourceTrendsDataonEUelectricitysourcesin2022Solarpowerproduced7.3%(203TWh)ofEUelectricityin2022.Germanyisthebiggestgeneratorat59TWh(10%ofitselectricitymix),producingnearlytwiceasmuchasthesecondbiggestgenerationSpain(33TWh,12%).TheNetherlandshavethehighestpercentageshareofsolargenerationintheirelectricitymixwith14%(17TWh),aheadofGreece(6.6TWh,13%)andHungary(4.5TWh,13%).EUElectricityTrends2022SolarRoleofsolarSolarprovidescleanpowerthatcanbedeployedquicklyandlocallytothedemandsource.Assuch,togetherwithwind,itwillformthebackboneofthefutureelectricitysystembyprovidingnearly70%ofglobalelectricityby2050.Newsolarpowerproducesthecheapestelectricityinhistory,accordingtotheIEA.203TWhEUsolargenerationin20227.3%solarshareinEUgenerationin2022SolarOtherresOtherfossilNuclearHydroGasCoalBioenergyWindEUelectricitymixShareofelectricity(%)0100908070605040302010EU0100908070605040302010BelgiumItalyGermanyLithuaniaCyprusSpainMaltaHungaryGreeceNetherlands060504030201055545352515PortugalHungaryGreeceBelgiumPolandNetherlandsFranceItalySpainGermanyLargestsolargeneratorsintheEUElectricitygeneration(TWh)HighestsharesofsolarpowerShareofelectricity(%)MajorplayersinsolarpowerElectricitygeneration(TWh,y-axis)andshareofelectricity(%,x-axis)RegionalContextSource:EmberNote:usesfull-yeardatafor2022inallEU-27countries0100908070605040302010Shareofgeneration(%)0200010008006004002002600240022001800160014001200AustriaBelgiumBulgariaCzechiaDenmarkFinlandFranceGermanyGreeceHungaryIrelandItalyNetherlandsPolandPortugalRomaniaSlovakiaSpainSwedenSolarOtherfueltypes47DecNovOctSepAugJulJunMayAprMarFebJan0605040302010LargestincreasesLargestincreasesLithuaniaPolandSwedenDenmarkEstonia010080604020120LargestdeclinesLargestdeclinesAustriaSlovenia0-2-1-0.5-1.5LargestincreasesLargestdeclinesGermanyNetherlandsSpainFrancePolandItalyBelgiumGreecePortugalSwedenRestofEUTotal040302010SolarelectricitygenerationintheEUgrewby24%in2022,from164TWhin2021to203TWhin2022.Thisbroughtsolar’sshareintheelectricitymixto7.3%,a1.6percentagepointincreasefromthepreviousyear(5.7%).TheincreasedsolargenerationwasduetoasignificantriseinGermany(+9.6TWh,+20%)aswellassubstantialincreasesinSpain(+5.7TWh,+21%),theNetherlands(+5.8TWh,+51%),France(+4.3TWh,+27%)andPoland(+4.1TWh,+104%).Comparedtothepreviousyear,solargenerationfellonlyinAustria(-0.05TWh,-1.8%)andSlovenia(-0.01TWh,-2.2%).Januarysawthehighestyear-on-yearpercentageincreaseof58%.May(+32%,+5.9TWh),July(+32%,+6.5TWh)andAugust(+35%,+6.4TWh)allsawyear-on-yearincreasesabove30%andresultedinthelargestabsoluteincreasescomparedtolastyear.KeychangesinEUsolargenerationChangeingenerationyear-on-year(TWh)EUsolargenerationElectricitygeneration(TWh)Changein2022JanFebMarAprMayJunJulAugSepOctNovDec03020105251520222022202120212020202020192019MonthlychangesinEUsolargenerationChangeingenerationyear-on-year(%)LargestincreasesChangeingenerationyear-on-year(%)LargestdeclinesChangeingenerationyear-on-year(%)Source:EmberNote:usesfull-yeardatafor2022inallEU-27countries4820202015201020052000020010050250150010864220202015201020052000040302010-10SolargenerationroseintheoverallEUelectricitymixfrom0%(0.1TWh)in2000to7.3%(203TWh)in2022.SolardeploymentinGermanyandItalydrovestronggrowthintheearly2010,butfollowingthatgrowthfell,decliningtonearlyzeroin2016.However,solarhasbeengrowingatanaverageannualrateof11%sincetheParisAgreementin2015.Thisrepresentsslowergrowththantheupwardstrendbetween2000-2015(+58%annually).2022sawayear-on-yearincreaseof24%(39TWh).Solar’smarketsharehasgrownfrom3.5%to7.3%ofEUelectricitygenerationsince2015.CountrieslikeHungary,theNetherlandsandCyprushaveseenaremarkablyquickintegrationofsolargenerationintotheirelectricitymix.TheshareofsolarintheNetherlandsincreasedfromonly1%(1.1TWh)to14%(17TWh)since2015.Hungarysawsimilargrowthfrom0.5%(0.1TWh)to13%(4.5TWh)inthesameperiod.Justlikewindgeneration,solarhasseenbroadbuy-inacrosstheentireEUandgrewinnearlyallcountries.Solarshare,EUcountriesShareofelectricity(%)010080604020LatviaIrelandFinlandCroatiaSwedenSlovakiaCzechiaRomaniaSloveniaBulgariaAustriaFrancePolandDenmarkEstoniaPortugalBelgiumItalyGermanyLithuaniaCyprusSpainMaltaHungaryGreeceNetherlandsLuxembourgLong-termtrendsinEUsolargenerationElectricitygeneration(TWh)andshareofelectricity(%)AnnualchangesinEUsolargenerationChangeingenerationyear-on-year(TWh)Long-termTrends20152022Generation(TWh)%ShareSource:EmberNote:usesfull-yeardatafor2022inallEU-27countriesDEFRITESEUTotalRestofEU49Windpowerproduced15%(420TWh)ofEUelectricityin2022.Germanyisthebiggestgeneratorat126TWh(22%ofitselectricitymix),aheadofSpain(62TWh,22%).Denmarkhasthehighestpercentagesharewith55%ofitselectricitymix(19TWh)aheadofLithuania(38%),Ireland(34%)andPortugal(28%).WindgenerationiscurrentlythesecondlargestcleansourceofelectricityintheEU,butissettocontinuetogrowandsurpassnucleargeneration.TherearenoweightEUcountrieswherewindproducesmorethan20%ofelectricity,and16countrieswithmorethan10%share.EUElectricityTrends2022WindRoleofwindWind,alongsidesolar,iskeytoreducingemissionsintheelectricitysector.Bothsourceswillformthebackboneofthefutureelectricitysystembyprovidingnearly70%ofglobalelectricityby2050.Therefore,rapidscale-upisrequiredthisdecade.420TWhEUwindgenerationin202215.0%windshareinEUgenerationin2022SolarOtherresOtherfossilNuclearHydroGasCoalBioenergyWindEUelectricitymixShareofelectricity(%)0100908070605040302010EU0100908070605040302010NetherlandsSwedenGreeceGermanySpainLuxembourgPortugalIrelandLithuaniaDenmark010080604020120BelgiumPortugalDenmarkPolandItalyNetherlandsSwedenFranceSpainGermanyLargestwindgeneratorsintheEUElectricitygeneration(TWh)HighestsharesofwindpowerintheEUShareofelectricity(%)MajorEUplayersinwindpowerElectricitygeneration(TWh,y-axis)andshareofelectricity(%,x-axis)RegionalContextSource:EmberNote:usesfull-yeardatafor2022inallEU-27countries0100908070605040302010Shareofgeneration(%)0200010008006004002002600240022001800160014001200AustriaBelgiumBulgariaCzechiaDenmarkFinlandFranceGermanyGreeceHungaryIrelandItalyNetherlandsPolandPortugalRomaniaSlovakiaSpainSwedenWindOtherfueltypes51DecNovOctSepAugJulJunMayAprMarFebJan0403020-2010-10LargestincreasesLargestincreasesFinlandLatviaSwedenPolandDenmark040302010LargestdeclinesLargestdeclinesSpainItalyHungaryCyprusEstonia0-10-8-6-4-2-14-12LargestdeclinesLargestdeclines-8-2LargestdeclinesGermanySwedenPolandFinlandDenmarkNetherlandsIrelandFranceRomaniaItalyRestofEUTotal03020105352515EUwindgenerationroseby8.6%(+33TWh),from387TWhin2021to420TWhin2022.Thismorethanmakesupforlastyear’sfallof11TWh,butisstilllowerthangrowthin2015,2017andthelargestyear-on-yearincreasein2019of47TWh.Shareofwindpowerintheelectricitymixalsogrewby1.6percentagepoints,from13.4%in2021to15%in2022.TheincreaseinwindpowerwasdrivenbysignificantincreasesinGermany(+11TWh,10%)aswellasSweden(+6TWh,22%)andPoland(+3.5TWh,22%).Italy,Hungary,CyprusandEstoniasawsomereductionsinwindgeneration,butonlywithmodestabsolutefallsthatdidnotaffecttheoverallbalanceofgenerationacrosstheEU.KeychangesinEUwindgenerationChangeingenerationyear-on-year(TWh)EUwindgenerationElectricitygeneration(TWh)Changein2022JanFebMarAprMayJunJulAugSepOctNovDec504030201020222022202120212020202020192019MonthlychangesinEUwindgenerationChangeingenerationyear-on-year(%)LargestincreasesChangeingenerationyear-on-year(%)LargestdeclinesChangeingenerationyear-on-year(%)Source:EmberNote:usesfull-yeardatafor2022inallEU-27countries52Windgenerationhasincreasedby398TWhinthelasttwodecades(+1,873%)andhassubsequentlyalsorisenintheoverallelectricitymix(from0.8%oftheEU’selectricitymixin2000to15%in2022).Therehasbeenconsistentgrowthinwindgenerationoverthelast20yearswiththeexceptionof2021.Thiswasnotastructuraldecline,butrathercausedbybadwindconditionsinthefirsthalfoftheyearthatresultedinlowerthanusualgeneration.SincetheParisAgreementin2015,windhasbeengrowinganaverageof6.9%annually.Thisrepresentsadeclineoftheupwardstrendbetween2000-2015(+18.3%annually).However,2022sawayear-on-yearincreaseof8.6%(33TWh).Wind’smarketsharehasrisenfrom9.2%to15%ofEUelectricitygenerationsince2015.ThistrendisconsistentacrossmostoftheEUwithafewexceptionsincountrieswithHungaryandCyprusastheonlyexceptions.LargeincreasesinmarketshareinLithuaniaandLuxembourgaremostlyexplainedbytheirlowoverallgeneration.Long-termTrends202020152010200520000504030-3020-2010-10DE2020201520102005200005004003002001000201052515Long-termtrendsinEUwindgenerationElectricitygeneration(TWh)andshareofelectricity(%)AnnualchangesinEUwindgenerationChangeingenerationyear-on-year(TWh)FRITESEUTotalGeneration(TWh)%ShareRestofEUWindshare,EUcountriesShareofelectricity(%)010080604020MaltaSlovakiaSloveniaCzechiaHungaryBulgariaLatviaCyprusItalyEstoniaFranceAustriaPolandRomaniaBelgiumFinlandCroatiaNetherlandsSwedenGreeceGermanySpainLuxembourgPortugalIrelandLithuaniaDenmark20152022Source:EmberNote:usesfull-yeardatafor2022inallEU-27countries53Coalpowerproduced16%(447TWh)ofEUelectricityin2022.Germanyisthebiggestcoalgenerator(181TWh,31%ofitselectricitymix),whilePolandhasthehighestpercentageshareat69%,withatotaloutputof124TWh.Poland,Czechia,BulgariaandGermanyallstillproducemorethan30%oftheirelectricityfromcoal.MoreandmorecountriesintheEUhaveeitherphasedoutorhavecommittedtoaphase-outofcoalgeneration.EUElectricityTrends2022CoalRoleofcoalCoalisthesinglelargestcontributortoemissionsfromthepowergenerationsector.Assuch,itsrolehastobereducedrapidlyinthenexttwodecadessotheworldhasachancetolimitglobalwarmingto1.5C.AsperIEANetZeroscenario,unabatedcoalplantsneedtobephasedoutby2030indevelopedcountriesandby2040indevelopingones.447TWhEUcoalgenerationin202216.0%coalshareinEUgenerationin2022SolarOtherresOtherfossilNuclearHydroGasCoalBioenergyWindEUelectricitymixShareofelectricity(%)0100908070605040302010EU0100908070605040302010GreeceDenmarkCroatiaNetherlandsRomaniaSloveniaGermanyBulgariaCzechiaPoland020010050150FranceGreeceSpainRomaniaNetherlandsItalyBulgariaCzechiaPolandGermanyLargestcoalgeneratorsintheEUElectricitygeneration(TWh)HighestsharesofcoalpowerintheEUShareofelectricity(%)MajorEUplayersincoalpowerElectricitygeneration(TWh,y-axis)andshareofelectricity(%,x-axis)RegionalContextSource:EmberNote:usesfull-yeardatafor2022inallEU-27countries0100908070605040302010Shareofgeneration(%)0200010008006004002002600240022001800160014001200AustriaBelgiumBulgariaCzechiaDenmarkFinlandFranceGermanyGreeceHungaryIrelandItalyNetherlandsPolandPortugalRomaniaSlovakiaSpainSwedenCoalOtherfueltypes55DecNovOctSepAugJulJunMayAprMarFebJan0403020-2010-10LargestincreasesLargestincreasesSpainItalyBulgariaFinlandGermany0605040302010LargestdeclinesLargestdeclinesIrelandSloveniaDenmarkFrancePortugal0-100-80-60-40-20LargestincreasesLargestdeclinesLargestdeclinesLargestdeclines-60-20LargestdeclinesGermanyItalyBulgariaCzechiaSpainNetherlandsPortugalDenmarkFrancePolandRestofEUTotal040302010EUcoalelectricitygenerationroseby6.7%(28TWh),from419TWhin2021to447TWhin2022.Thispushedcoal’sshareintheEUelectricitymixfrom14.5%in2021to16%in2022.Theincreasewaslargelytemporary,ascoalmetsomeofthereductioninnuclearandhydrogeneration.ThelargestincreaseswererecordedinMarchandoverthesummermonths.ThistrendwaslargelyreversedbytheQ42022.Thelastfourmonthsoftheyearsawcoalgenerationbelow2021levels.TheriseincoalpowerwasmostnoticeableinGermany(+17TWh,+10%)withsmallerrisesinItaly(+7.2TWh,+51%)andBulgaria(+4.3TWh,+25%).Portugalreducedcoalpowertonearzero(-93%,-0.7TWh)asitcloseditslastcoalpowerplant.France,Denmark,SloveniaandIrelandalsosawcutstocoalgeneration.Polandrecordedthelargestabsolutedeclinewithcoalfalling2.5TWh(-2.7%).KeychangesinEUcoalgenerationChangeingenerationyear-on-year(TWh)EUcoalgenerationElectricitygeneration(TWh)Changein2022JanFebMarAprMayJunJulAugSepOctNovDec60504030201020222022202120212020202020192019MonthlychangesinEUcoalgenerationChangeingenerationyear-on-year(%)LargestincreasesChangeingenerationyear-on-year(%)LargestdeclinesChangeingenerationyear-on-year(%)Source:EmberNote:usesfull-yeardatafor2022inallEU-27countries56Coalgenerationhasfallenby353TWhinthelasttwodecades(-44%),goingfrom30%oftheEU’selectricitymixin2000to16%in2022.Despiteincreasesin2021and2022,coalpowerin2022wasstill37%below2015levels.Coal’ssharehasfallenfrom25%to16%ofEUelectricitygenerationsince2015.EveryEUcountryhadasmallershareofcoalin2022thanin2015.ThebiggestfallsingenerationsharewereinGreece(10%,downfrom43%),Portugal(0.1%,downfrom29%),theNetherlands(13%,downfrom36%)andSpain(2.7%,downfrom19%).Theuseofcoalforpowergenerationissettofallfurther.Coalphaseouttargets,increasedgenerationfromwindandsolar,aswellasareboundinFrenchnucleargenerationwillreducetheneedforthecomparativelyexpensivefossilfuel.Long-termTrends202020152010200520000-200100-10050-50-150DE2020201520102005200001,00080060040020005040302010Long-termtrendsinEUcoalgenerationElectricitygeneration(TWh)andshareofelectricity(%)AnnualchangesinEUcoalgenerationChangeingenerationyear-on-year(TWh)FRITESEUTotalGeneration(TWh)%ShareRestofEUCoalshare,EUcountriesShareofelectricity(%)010080604020CyprusEstoniaLatviaLithuaniaLuxembourgMaltaSwedenBelgiumPortugalAustriaFranceSpainFinlandSlovakiaIrelandItalyHungaryGreeceDenmarkCroatiaNetherlandsRomaniaSloveniaGermanyBulgariaCzechiaPoland20152022Source:EmberNote:usesfull-yeardatafor2022inallEU-27countries57In2022,gaspoweraccountedfor20%oftheEU’selectricityproduction,withatotaloutputof557TWh.Italywasthelargestgeneratorofgaspower,producing141TWh,whichrepresented51%ofitsenergymix,thesecondlargestgasshareofanyEUcountry.Maltahadthehighestpercentageofgaspowerinitsenergymixat84%,withatotaloutputof1.8TWh.EUElectricityTrends2022GasRoleofgasGas,aftercoal,isthesecondlargestcontributortoemissionsfromthepowersector.So,althoughitwillplayausefulroleinthemid-term,helpingwiththepowersystemflexibilitytoaccommodatealargeinfluxofwindandsolar,unabatedgaswillneedtobephasedoutby2040,inordertomovetoacleanpowersystem.557TWhEUgasgenerationin202219.9%gasshareinEUgenerationin2022SolarOtherresOtherfossilNuclearHydroGasCoalBioenergyWindEUelectricitymixShareofelectricity(%)0100908070605040302010EU0100908070605040302010HungaryCroatiaLatviaSpainPortugalGreeceNetherlandsIrelandItalyMalta010080604020160140120PolandIrelandPortugalGreeceBelgiumFranceNetherlandsSpainGermanyItalyLargestgasgeneratorsintheEUElectricitygeneration(TWh)HighestsharesofgaspowerintheEUShareofelectricity(%)MajorEUplayersingaspowerElectricitygeneration(TWh,y-axis)andshareofelectricity(%,x-axis)RegionalContextSource:EmberNote:usesfull-yeardatafor2022inallEU-27countries0100908070605040302010Shareofgeneration(%)0200010008006004002002600240022001800160014001200AustriaBelgiumBulgariaCzechiaDenmarkFinlandFranceGermanyGreeceHungaryIrelandItalyNetherlandsPolandPortugalRomaniaSlovakiaSpainSwedenGasOtherfueltypes59DecNovOctSepAugJulJunMayAprMarFebJan04030-3020-2010-10LargestincreasesLargestincreasesFranceSpainCroatiaPortugalAustria030201052515LargestdeclinesLargestdeclinesLatviaLuxembourgSlovakiaLithuaniaFinland0-70-60-50-40-30-20-10LargestincreasesLargestdeclinesLargestdeclinesLargestdeclines-40-10LargestdeclinesSpainFrancePortugalIrelandSlovakiaFinlandItalyGreecePolandNetherlandsRestofEUTotal030201052515GaselectricitygenerationintheEUsawaslightincreaseof0.8%in2022(+4.5TWh).ThisbroughttheshareofgasintheEU’selectricitymixto19.9%,a0.7percentagepointincreasefromthepreviousyear(19.2%).Despitethehighcostofgasgenerationin2022astheglobalenergycrisisdroveupgasprices,severalcountriesstillexperiencedgrowth.ThelargestincreaseswereseeninSpain(+16TWh,22%)andFrance(+9.6TWh,29%).GasgenerationinthesecountrieslikelywouldnothaverisenwithoutlargelossesofnuclearpowerinFrancethatresultedinlowerexportstoSpain.ThereweresmallgaspowerfallsinPoland,Greece,ItalyandFinland,andalargerfallintheNetherlands(-9.7TWh,-17%)whichsawincreasedwindandsolarpowerreplacegaspower.KeychangesinEUgasgenerationChangeingenerationyear-on-year(TWh)EUgasgenerationElectricitygeneration(TWh)Changein2022JanFebMarAprMayJunJulAugSepOctNovDec605040302020222022202120212020202020192019MonthlychangesinEUgasgenerationChangeingenerationyear-on-year(%)LargestincreasesChangeingenerationyear-on-year(%)LargestdeclinesChangeingenerationyear-on-year(%)Source:EmberNote:usesfull-yeardatafor2022inallEU-27countries60Annualgasgenerationhassubstantiallyincreasedby225TWhinthelasttwodecades(+68%).Asaresult,theshareintheelectricitymixhasincreasedfrom13%in2000to20%in2022.Itistheonlyfossilfuelthathasseengrowthoverthepasttwodecades.Inthesameperiod,coalgenerationwascutinhalf.SincetheParisAgreementin2015,gashasbeengrowingbyanaverageof5%annually.Thisrepresentsanaccelerationofthegrowthtrendbetween2000-2015(1.2%annually).Theincreasein2022ofonly0.8%isslowerthanrecenttrends.Themarketshareofgashasincreasedfrom14%to20%ofEUelectricitygenerationsince2015.Whilethereareseveralcountriesthathavereducedtheirrelianceongassince2015,somecountrieswithhighelectricitydemandsuchasGermany,Italy,SpainandFrancehaveseengasgenerationtakeamoreimportantrole.InItaly,theshareofgasinthemixincreasedfrom39%to51%(+30TWh),whileGermanysawanincreasefrom10%to16%(+32TWh).Long-termTrends20202015201020052000080-8060-6040-4020-20DE202020152010200520000800600400200040302010Long-termtrendsinEUgasgenerationElectricitygeneration(TWh)andshareofelectricity(%)AnnualchangesinEUgasgenerationChangeingenerationyear-on-year(TWh)FRITESEUTotalGeneration(TWh)%ShareRestofEUGasshare,EUcountriesShareofelectricity(%)010080604020CyprusSwedenEstoniaFinlandDenmarkSloveniaBulgariaPolandCzechiaSlovakiaLuxembourgFranceLithuaniaGermanyRomaniaAustriaBelgiumHungaryCroatiaLatviaSpainPortugalGreeceNetherlandsIrelandItalyMalta20152022Source:EmberNote:usesfull-yeardatafor2022inallEU-27countries61In2022,hydropowergenerationaccountedfor10%oftheEU’selectricityproduction,withatotaloutputof283TWh.Swedenwasthelargestgeneratorofhydropower,producing69TWh(40.2%ofitselectricitymix),aheadofFrance(46TWh,9.8%)andAustria(36TWh,56%).Austria’sshareof56%wasthehighestshareofhydropowerinitselectricitymixamongEUcountries.EUElectricityTrends2022HydroRoleofhydroHydropowerhasanimportantroleinthecurrentenergymix.Notonlyisitcurrentlythelargestsourceofcleanpower,butitalsoprovidesflexibilitytohelpaccommodatethelargeinfluxofwindandsolar.Theworldneedsnewhydropowerplants,butinmanyregionshydroresourceshavealreadybeenmaximised,andinotherregionswherethereispotential,theprojectsmaycomeattoohighanecologicalcost.283TWhEUhydrogenerationin202210.1%hydroshareinEUgenerationin2022SolarOtherresOtherfossilNuclearHydroGasCoalBioenergyWindEUelectricitymixShareofelectricity(%)0100908070605040302010EU0100908070605040302010LithuaniaSlovakiaPortugalFinlandSloveniaRomaniaCroatiaSwedenLatviaAustria070605040302010CroatiaPortugalFinlandRomaniaGermanySpainItalyAustriaFranceSwedenLargesthydrogeneratorsintheEUElectricitygeneration(TWh)HighestsharesofhydropowerintheEUShareofelectricity(%)MajorplayersinEUhydropowerElectricitygeneration(TWh,y-axis)andshareofelectricity(%,x-axis)RegionalContextSource:EmberNote:usesfull-yeardatafor2022inallEU-27countries0100908070605040302010Shareofgeneration(%)0200010008006004002002600240022001800160014001200AustriaBelgiumBulgariaCzechiaDenmarkFinlandFranceGermanyGreeceHungaryIrelandItalyNetherlandsPolandPortugalRomaniaSlovakiaSpainSwedenHydroOtherfueltypes63DecNovOctSepAugJulJunMayAprMarFebJan0-50-40-30-20-10LargestincreasesLargestincreasesLithuaniaLatvia02010515LargestdeclinesLargestdeclinesItalyPortugalSpainLuxembourgBelgium0-50-40-30-20-10LargestdeclinesLargestdeclinesLargestdeclines-30-10LargestdeclinesFinlandCroatiaGermanyAustriaRomaniaPortugalSwedenSpainFranceItalyRestofEUTotal0-80-60-4020-20Adrought-strickensummerin2022meantthatEUhydrogenerationfelltothelowestlevelsinceatleast2000.Itfellby19%,withatotaldecreaseof66TWhfrom349TWhto283TWh.Asaresult,theshareofhydropowerintheelectricitymixfellby2%from12%in2021to10%in2022.TheAlpsandIberiawereparticularlyaffectedbythedrought.Italy,FranceandSpainallsawhydrooutputfallbymorethan10TWh.Thisrepresentedreductionsof34%(Italy),23%(France)and37%(Spain).However,theNordicregionwasalsoimpacted.Lithuania(+0.07TWh)andLatvia(+0.06TWh)weretheonlyEUcountriestoseeanyriseinhydrogeneration,butonlyrecordedsmallincreases.KeychangesinEUhydrogenerationChangeingenerationyear-on-year(TWh)EUhydrogenerationElectricitygeneration(TWh)Changein2022JanFebMarAprMayJunJulAugSepOctNovDec302035251520222022202120212020202020192019MonthlychangesinEUhydrogenerationChangeingenerationyear-on-year(%)LargestincreasesChangeingenerationyear-on-year(%)LargestdeclinesChangeingenerationyear-on-year(%)Source:EmberNote:usesfull-yeardatafor2022inallEU-27countries64Hydrocapacityhasremainedalmostunchangedsince2000,withverylittleaddedorclosedsince.Theonlyfactorimpactinggenerationisprecipitation.Hydrogenerationin2022was19%lower(-67TWh)thanin2000.The67TWhfallisnearlyequivalenttothefalljustseenin2022of66TWh.Despitethelargefallsin2022,hydro’s10%shareofgenerationwasnotsubstantiallylowerthanthemarketsharein2000of13%.Similarly,therehavebeennostructuralchangessincetheParisAgreementin2015.Growthfromcleansourceshaslargelybeenconcentratedonthebuildupofwindandsolargeneration.Long-termTrends202020152010200520000-8060-6040-4020-20DE20202015201020052000040030020010002010515Long-termtrendsinEUhydrogenerationElectricitygeneration(TWh)andshareofelectricity(%)AnnualchangesinEUhydrogenerationChangeingenerationyear-on-year(TWh)FRITESEUTotalGeneration(TWh)%ShareRestofEUHydroshare,EUcountriesShareofelectricity(%)010080604020CyprusMaltaDenmarkNetherlandsBelgiumEstoniaHungaryPolandIrelandCzechiaGermanyLuxembourgSpainBulgariaGreeceFranceItalyLithuaniaSlovakiaPortugalFinlandSloveniaRomaniaCroatiaSwedenLatviaAustria20152022Source:EmberNote:usesfull-yeardatafor2022inallEU-27countries65In2022,nuclearaccountedfor22%oftheEU’selectricityproduction,withatotaloutputof613TWh.Francewasthelargestgeneratorofelectricityfromnucleargeneration,producing297TWh.Itisalsothecountrywiththehighestshareofnuclearpowerinitselectricitymixat63%.EUElectricityTrends2022NuclearRoleofnuclearNuclearpowerisanimportantsourceoffirmzero-carbonenergy,giventheseverityoftheclimatecrisisandthenecessitytoquicklymoveofffossilfuels.Nuclearpowercapacityneedstoincreasesignificantlyoverthecomingdecadesinlinewithgrowingelectricitydemand,butitsshareofglobalelectricitygenerationislikelytoremainsimilartotoday.613TWhEUnucleargenerationin202221.9%nuclearshareinEUgenerationin2022SolarOtherresOtherfossilNuclearHydroGasCoalBioenergyWindEUelectricitymixShareofelectricity(%)0100908070605040302010EU0100908070605040302010SpainSwedenBulgariaFinlandCzechiaSloveniaHungaryBelgiumSlovakiaFrance030020010050250150HungarySlovakiaBulgariaFinlandCzechiaGermanyBelgiumSwedenSpainFranceLargestnucleargeneratorsintheEUElectricitygeneration(TWh)HighestsharesofnuclearpowerintheEUShareofelectricity(%)MajorEUplayersinnuclearpowerElectricitygeneration(TWh,y-axis)andshareofelectricity(%,x-axis)RegionalContextSource:EmberNote:usesfull-yeardatafor2022inallEU-27countries0100908070605040302010Shareofgeneration(%)0200010008006004002002600240022001800160014001200AustriaBelgiumBulgariaCzechiaDenmarkFinlandFranceGermanyGreeceHungaryIrelandItalyNetherlandsPolandPortugalRomaniaSlovakiaSpainSwedenNuclearOtherfueltypes67DecNovOctSepAugJulJunMayAprMarFebJan0-30-20-10-5-25-15LargestincreasesLargestincreasesNetherlandsFinlandSpainSlovakiaCzechia0108642LargestdeclinesLargestdeclinesLargestdeclinesSloveniaSwedenBelgiumFranceGermany0-50-40-30-20-10LargestincreasesLargestdeclinesLargestdeclinesLargestdeclines0Largestdeclines0Largestdeclines-30SpainFinlandNetherlandsCzechiaSlovakiaHungarySwedenBelgiumGermanyFranceRestofEUTotal0-100-80-60-40-20-120In2022,nucleargenerationintheEUsawitslargesteveryear-on-yeardecline,falling16%,atotalof119TWhcomparedto2021(from732TWhto613TWh).Consequently,theshareofnucleargenerationintheelectricitymixfellby3.5percentagepointsto21.9%from25.4%in2021.Spain(+1.9TWh,3.3%),Finland(+1.5TWh,6.2%)andtheNetherlands(+0.4TWh,9.4%)sawthelargestincreasesin2022,althoughthesewerestillrelativelymodest.TheclosureofnuclearplantsinGermanyledtoadeclineingenerationof33TWh(-47%).Theheatwaveinthesummerof2022sawreducedoutputfromsomeFrenchnuclearplants,duetohightemperaturesinriversusedforcooling.Plannedmaintenancereducednuclearoutputfurther.Consequently,Frenchnucleargenerationfellby82TWh(22%),areductionofnearly3%oftheEU’stotalannualelectricitygeneration.KeychangesinEUnucleargenerationChangeingenerationyear-on-year(TWh)EUnucleargenerationElectricitygeneration(TWh)Changein2022JanFebMarAprMayJunJulAugSepOctNovDec80706050403020222022202120212020202020192019MonthlychangesinEUnucleargenerationChangeingenerationyear-on-year(%)LargestincreasesChangeingenerationyear-on-year(%)LargestdeclinesChangeingenerationyear-on-year(%)Source:EmberNote:usesfull-yeardatafor2022inallEU-27countries68202020152010200520000100-10050-50-150DE2020201520102005200001,00080060040020005040302010Between2000and2022,nucleargenerationfellby29%.Likewise,itsshareintheEUelectricitymixfellfrom33%in2000to22%in2022.Thisisduetonear-zeronuclearplantscomingonline,awaveofclosuresofoldernuclearpowerplantsandwidespreadtemporaryoutagesofexistingFrenchpowerplantsin2022.SincetheParisAgreementin2015,EUnucleargenerationhasbeenfallinganaverageof3.5%annually.Thisrepresentsanaccelerationofthedownwardstrendbetween2000-2015(-0.6%annually).2022sawasubstantialdecreaseof16%(119TWh).Nuclear’smarketsharehasfallenfrom27%to22%ofEUelectricitygenerationsince2015.Long-termtrendsinEUnucleargenerationElectricitygeneration(TWh)andshareofelectricity(%)AnnualchangesinEUnucleargenerationChangeingenerationyear-on-year(TWh)FRITESEUTotalLong-termTrendsGeneration(TWh)%ShareRestofEUNuclearshare,EUcountriesShareofelectricity(%)010080604020AustriaCroatiaCyprusDenmarkEstoniaGreeceIrelandItalyLatviaLithuaniaLuxembourgMaltaPolandPortugalNetherlandsGermanyRomaniaSpainSwedenBulgariaFinlandCzechiaSloveniaHungaryBelgiumSlovakiaFrance20152022Source:EmberNote:usesfull-yeardatafor2022inallEU-27countries69In2022,bioenergyaccountedfor6%oftheEU’selectricityproduction,withatotaloutputof167TWh.GermanywasthelargestgeneratorofelectricityfrombioenergyintheEUbyaconsiderablemargin,producing47TWh,or8.1%ofitsenergymix.Italywasthesecondlargestgenerator,producing18TWh.Estoniahadthehighestpercentageofbioenergypowergenerationat30%,withatotaloutputof2.5TWh.EUElectricityTrends2022BioenergyRoleofbioenergyBioenergyhasbeenwidelyassumedtobecarbonneutral,butrecentscientificevidenceshowsthatmanyformsofbioenergyareamajorriskofsignificantcarbonemissions.Giventheserisks,countriesshouldaimtominimiseoreliminatetheinclusionoflarge-scalebioenergyinthepowersector.SolarOtherresOtherfossilNuclearHydroGasCoalBioenergyWindEUelectricitymixShareofelectricity(%)0100908070605040302010EU167TWhEUbioenergygenerationin20226.0%bioenergyshareinEUgenerationin20220100908070605040302010SwedenGermanyNetherlandsCroatiaPortugalLatviaLithuaniaFinlandDenmarkEstonia05040302010545352515CzechiaSpainPolandDenmarkNetherlandsFranceSwedenFinlandItalyGermanyLargestbioenergygeneratorsintheEUElectricitygeneration(TWh)HighestsharesofbioenergypowerintheEUShareofelectricity(%)MajorEUplayersinbioenergypowerElectricitygeneration(TWh,y-axis)andshareofelectricity(%,x-axis)RegionalContextSource:EmberNote:usesfull-yeardatafor2022inallEU-27countries0100908070605040302010Shareofgeneration(%)0200010008006004002002600240022001800160014001200AustriaBelgiumBulgariaCzechiaDenmarkFinlandFranceGermanyGreeceHungaryIrelandItalyNetherlandsPolandPortugalRomaniaSlovakiaSpainSwedenBioenergyOtherfueltypes71DecNovOctSepAugJulJunMayAprMarFebJan0-10-8-6-42-2LargestincreasesLargestincreasesEstoniaIrelandSloveniaCroatiaFrance040302010LargestdeclinesLargestdeclinesSlovakiaDenmarkNetherlandsAustriaLatvia0-20-10-5-15LargestdeclinesLargestdeclinesLargestdeclines-15LargestdeclinesEstoniaFranceFinlandGermanyPolandSwedenItalyDenmarkAustriaNetherlandsRestofEUTotal0-32-21-1BioenergygenerationintheEUdeclinedslightlyby1.6%(-2.8TWh)in2022.ThiswasthefirstfallinEUbioenergyelectricitygenerationsince1996.However,itcomesafteramoderaterisein2021(+4.2TWh,+6.7%).Poland,Sweden,Italy,Denmark,AustriaandtheNetherlandssawthelargestabsolutereductionsingeneration.Estoniasawanincreaseof41%,resultinginasmallriseof0.7TWh.HighergenerationinFrance,FinlandandGermanyledtoanadditionalsmalloffsetthatpreventedanevenlargerEU-widereduction.KeychangesinEUbioenergygenerationChangeingenerationyear-on-year(TWh)EUbioenergygenerationElectricitygeneration(TWh)Changein2022JanFebMarAprMayJunJulAugSepOctNovDec10987121120222022202120212020202020192019MonthlychangesinEUbioenergygenerationChangeingenerationyear-on-year(%)LargestincreasesChangeingenerationyear-on-year(%)LargestdeclinesChangeingenerationyear-on-year(%)Source:EmberNote:usesfull-yeardatafor2022inallEU-27countries72Bioenergygenerationhasincreasedmorethanfivefoldsince2000,from30TWhto167TWhin2022,risingfromaround1.2%oftheEU’selectricitymixin2000to6%in2022.However,therisehassloweddramatically.Generationin2022wasonly12%higherthanin2015.SincetheParisAgreementin2015,bioenergygenerationhasbeengrowinganaverageof1.6%annually.ThisissignificantlyslowerthantheaverageannualEUgrowthrateofbioenergyof11%between2000-2015.Bioenergy’smarketsharehasseenaslightincreasefrom5.2%to6%ofEUelectricitygenerationsince2015.Estoniahasseenthebiggestincreaseinmarketsharesince2015,withbioenergyrisingfrom8%to30%ofEstonia’selectricitymix.Long-termTrends2020201520102005200002010-105-515DE2020201520102005200002001005015008642Long-termtrendsinEUbioenergygenerationElectricitygeneration(TWh)andshareofelectricity(%)AnnualchangesinEUbioenergygenerationChangeingenerationyear-on-year(TWh)FRITESEUTotalGeneration(TWh)%ShareRestofEUBioenergyshare,EUcountriesShareofelectricity(%)010080604020MaltaGreeceCyprusRomaniaFranceSloveniaSpainIrelandPolandBelgiumBulgariaAustriaCzechiaHungarySlovakiaItalySwedenGermanyNetherlandsCroatiaPortugalLatviaLithuaniaFinlandDenmarkEstoniaLuxembourg20152022Source:EmberNote:usesfull-yeardatafor2022inallEU-27countries73ConclusionAnacceleratoryearfortheEU’stransitiontocleanpowerThereisnodoubtthat2022wasanextremelychallengingyearfortheEU.Russia’sinvasionofUkrainecreatedmassiveshockwavesandcausedanunprecedentedenergycrisis,whichinturnfuelledacripplinghikeinlivingcosts.OneoutcomehasbeenarushtocutdependenceonRussianfossilfuelimports.Thiscanonlybeachievedthroughanacceleratedcleanenergytransition.Itbecameabundantlyclearthatfossilfuelsarenotthesolution.Instead,theycauseskyrocketingelectricitypricesandenergyinsecurity.Coalpowerdidincreaseyear-on-year,butthiswasduetohydroandnuclearissuesratherthananyappetitetorevitalisetheroleofcoal.Somecoal-firedunitsmayhavebeenplacedonstandbyforthewinterbutthisisashort-term,emergencymeasure,resultinginminimalgeneration.Theanticipatedcoalresurgencefailedtomaterialiseandcurrenthighstocklevelswilllimitcoalimportrequirementsfor2023.Europe’scoalphase-outiswellandtrulystillalive.Electricitydemanddroppedsignificantlyinthefourthquarterof2022duetobothmandatedandvoluntaryenergysavingsandmildweather.However,wedonotknowhowlongthiswilllastand,ultimately,thetransitionwillincreaseelectricitydemand.Thishigherconsumptionmustbemetthroughrenewableenergysources.Soitisextremelyencouragingthat2022sawrecordgenerationandcapacityadditionsforwindandsolar.Bothplayedacriticalroleinmitigatingtheimpactoftheenergycrisis—fromafinancial,securityandclimateperspective—withsolarleadingthecharge.Andtheoutlookisevenbrighterwithacknowledgementthatevenmoreambitioustargetsareachievableoverthecomingyears.Thetransitionwillgainevenmoremomentumin2023andbeyond.Itisnotonlynecessarybutinevitable.TheEUmustnowstepuptoensuretherightpolicies,investmentsandinfrastructureareinplacetoenablethis.SupportingmaterialsMethodologyThedatainthisreportiscuratedbyEmber.Thefulldatasetisavailabletodownload.Pleaseaddressanydataqueriestodata@ember-climate.org.Generation,importsanddemandAnnualdatafrom2000to2020isgrossgeneration,publishedbyEurostat.1Morerecentdataisanestimateofgrossgeneration,basedonnetgenerationgatheredfrommonthlydata.Thisestimateiscalculatedbyapplyingabsolutechangesinnetgenerationtothemostrecentgrossbaseline.Netimportsfrom2000to2020arealsopublishedbyEurostat,withrecentdataestimatedinthesamemannerasgeneration.2Demandiscalculatedasthesumofgenerationandnetimports,andvalidatedagainstdirectdemandfigurespublishedbyENTSO-E.Monthlydataisgatheredfromanumberofsources,includingbothcentrallyreportedENTSO-Edataanddirectlyreportednationaltransmissionsystemoperators.Insomecasesdataispublishedonamonthlylag;herewehaveestimatedrecentmonthsbasedonrelativechangesinpreviousyears.Thesecasesareflaggedinthedataset.1.Grossgenerationincludesallelectricityproducedbyapowerplant,includingthepoweritconsumestooperate.Netgenerationistheelectricitymeteredleavingthepowerplantandenteringthegrid,andisalwayssmallerthangross.2.Flowsbetweencountriesarepublishedonlyinrecentdata,andassucharesummedtoproduceannualdatawithoutanyconversion.Assuch,inasmallnumberoffigures,summedvaluesfornetflowswillnotperfectlyequalvaluesfornetimports.Generation,importsanddemand75Monthlypublisheddataisoftenreportedprovisionally,andisfarfromperfect.Everyefforthasbeenmadetoensureaccuracy,andwherepossiblewecomparemultiplesourcestoconfirmtheiragreement.Belowisalistofcountriesincluded,andsourcesforrecentmonthlydata.Acompletecountry-by-countrymethodologyforallcountries,includingthoseoutsideofEurope,isavailablefordownloadhere.–Austria:ENTSO-E–Belgium:ENTSO-E–Bulgaria:ENTSO-E–Croatia:ENTSO-E–Cyprus:Eurostat–Czechia:ENTSO-E–Denmark:ENTSO-E–Estonia:ENTSO-E–Finland:Biomass,gas,hydro,solarandwindfromEurostat;otherfuelsfromENTSO-E–France:ENTSO-E–Germany:BiomassandgasfromAgora;otherfuelsfromENTSO-E–Greece:ENTSO-E–Hungary:Solardatabefore2020fromEurostat;otherfuelsfromENTSO-E–Ireland:SustainableEnergyAuthorityofIreland–Italy:BiomassandsolarfromTerna;otherfuelsfromENTSO-E.FlowdatafromTerna–Latvia:ENTSO-E–Lithuania:ENTSO-E–Luxembourg:Eurostat–Malta:Eurostat–Netherlands:StatisticsNetherlands–Poland:SolardatafromAREviaInstrat;otherfuelsfromENTSO-E–Portugal:ENTSO-E–Romania:ENTSO-E–Slovakia:ENTSO-E–Slovenia:ENTSO-E–Spain:ENTSO-E.Flowdatafrome-SIOS–Sweden:ENTSO-E76TheshortfallinhydropowerNote:thismethodologydiffersslightlyfromourglobalmethodology,inthatitusesemissionsfactorsmorespecifictoEUcountries.Asaresult,figuresprovidedinthisreportwilldifferslightlyfromthosewereportelsewhere.Wereportemissionsvaluesbyfueltype,andemissionsintensitybycountry.Thesevaluesarecalculatedbymultiplyingourgenerationnumbersbythebelowemissionsfactors:–Hardcoal830gCO2eq/kWh–Lignite1100gCO2eq/kWh–Fossilgas370gCO2eq/kWh–Otherfossilfuels700gCO2eq/kWh.ThesefactorsarecalculatedwithreferencetodataonthegreenhousegasemissionintensityofelectricitygenerationfromtheEuropeanEnvironmentAgency(EEA)andgrosselectricityproductionandelectricityproductionbyfueltypefromEurostat.ThesefactorsreproducerecenthistoricemissionsatanEUlevel,butforanumberofreasonswillnotbecompletelyaccurateatcountrylevel.Inparticular,thermalplantefficiencyandthecarboncontentoffuelsvariesbycountry.N.b.duetothemethodologyusedbytheEEAforthehistoricdataset,thevaluesdonotincludeCO2eqemissionsfromthecombustionofbiomass;nordotheyincludeupstreamemissions(e.g.fugitiveemissionsduetomethaneleaks).Emissionsintensityiscalculatedastotalemissionsdividedbytotalgeneration.ShortRunMarginalCost(SRMC)ofgenerationSRMCiscalculatedasthecostoffuelperMWhofgeneration,plusthecostofcarboncredits(EU-ETS)perMWh.Variableoperatingandmaintenancecostsarenotincluded.Thefollowingplantefficiencyrateshavebeenapplied:–Gasplantefficiencyrate=55%(LowerHeatingValue)–Coalplantefficiencyrate=40%Coal(API2),gas(TTF)andCO2(EU-ETS)pricesareprovidedbyMontel.EmissionsShortRunMarginalCost(SRMC)ofgeneration77SolarinhydropowerAllsolarcapacitydataisingigawatts(DC)1NetCalorificValue=0.9GrossCalorificValueCalorificvalueofRussiangas=37.83MJ/m31billioncubicmetre=10.5TerawatthoursSolarandgassavings78EmberTheFisheries,1MentmoreTerrace,LondonFields,E83PNEmailinfo@ember-climate.orgTwitter@EmberClimateFacebook/emberclimate

1、当您付费下载文档后,您只拥有了使用权限,并不意味着购买了版权,文档只能用于自身使用,不得用于其他商业用途(如 [转卖]进行直接盈利或[编辑后售卖]进行间接盈利)。
2、本站所有内容均由合作方或网友上传,本站不对文档的完整性、权威性及其观点立场正确性做任何保证或承诺!文档内容仅供研究参考,付费前请自行鉴别。
3、如文档内容存在违规,或者侵犯商业秘密、侵犯著作权等,请点击“违规举报”。

碎片内容

碳中和
已认证
内容提供者

碳中和

确认删除?
回到顶部
微信客服
  • 管理员微信
QQ客服
  • QQ客服点击这里给我发消息
客服邮箱