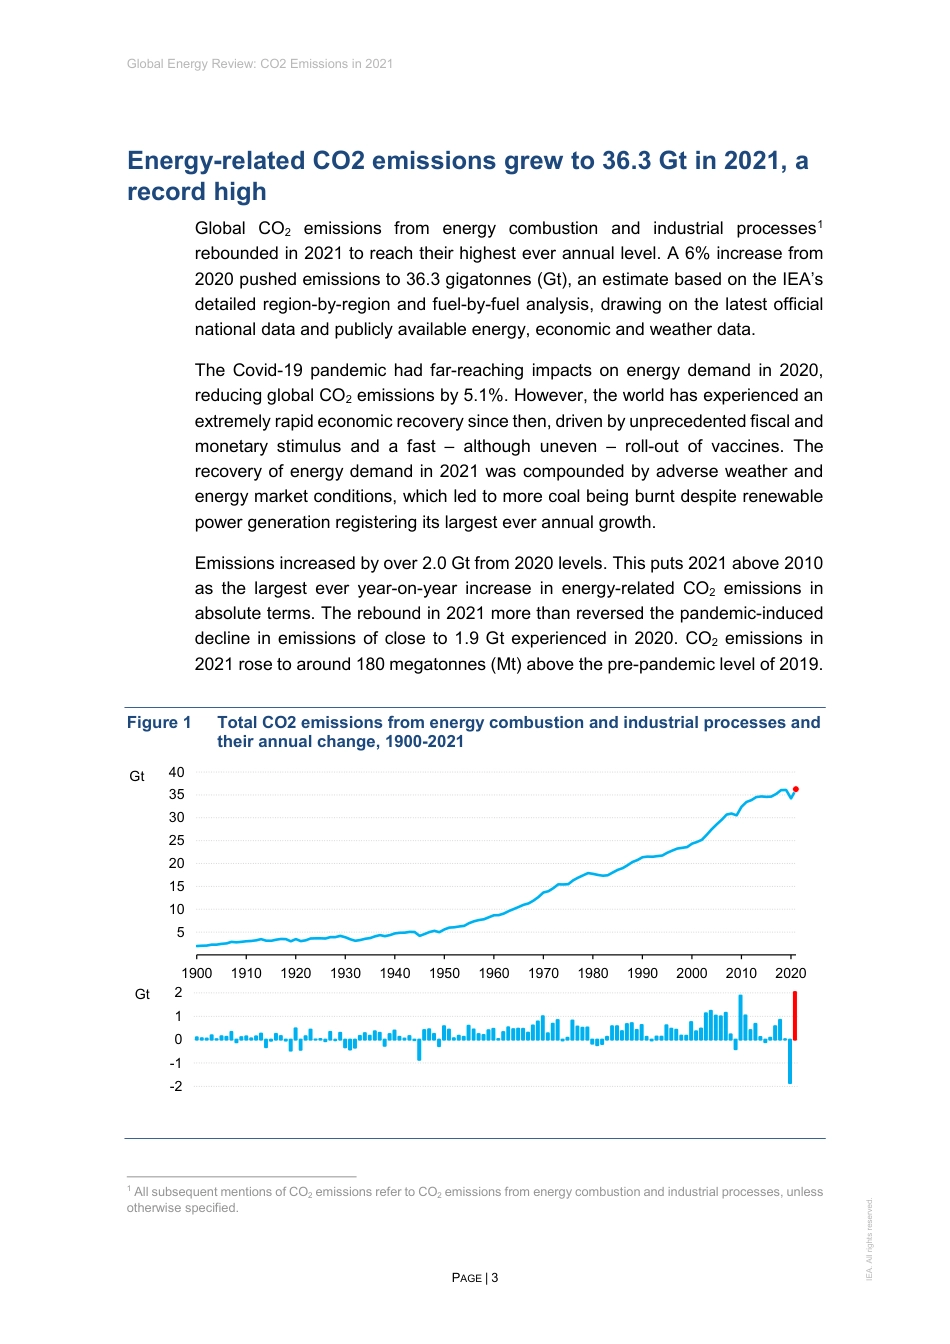
GlobalEnergyReview:CO2Emissionsin2021GlobalemissionsreboundsharplytohighesteverlevelTheIEAexaminesthefullspectrumofenergyissuesincludingoil,gasandcoalsupplyanddemand,renewableenergytechnologies,electricitymarkets,energyefficiency,accesstoenergy,demandsidemanagementandmuchmore.Throughitswork,theIEAadvocatespoliciesthatwillenhancethereliability,affordabilityandsustainabilityofenergyinits31membercountries,8associationcountriesandbeyond.Pleasenotethatthispublicationissubjecttospecificrestrictionsthatlimititsuseanddistribution.Thetermsandconditionsareavailableonlineatwww.iea.org/t&c/Thispublicationandanymapincludedhereinarewithoutprejudicetothestatusoforsovereigntyoveranyterritory,tothedelimitationofinternationalfrontiersandboundariesandtothenameofanyterritory,cityorarea.Source:IEA.Allrightsreserved.InternationalEnergyAgencyWebsite:www.iea.orgIEAmembercountries:AustraliaAustriaBelgiumCanadaCzechRepublicDenmarkEstoniaFinlandFranceGermanyGreeceHungaryIrelandItalyJapanKoreaLithuaniaLuxembourgMexicoNetherlandsNewZealandNorwayPolandPortugalSlovakRepublicSpainSwedenSwitzerlandTurkeyUnitedKingdomUnitedStatesTheEuropeanCommissionalsoparticipatesintheworkoftheIEAIEAassociationcountries:BrazilChinaIndiaIndonesiaMoroccoSingaporeSouthAfricaThailandINTERNATIONALENERGYAGENCYGlobalEnergyReview:CO2Emissionsin2021PAGE3IEA.Allrightsreserved.Energy-relatedCO2emissionsgrewto36.3Gtin2021,arecordhighGlobalCO2emissionsfromenergycombustionandindustrialprocesses1reboundedin2021toreachtheirhighesteverannuallevel.A6%increasefrom2020pushedemissionsto36.3gigatonnes(Gt),anestimatebasedontheIEA’sdetailedregion-by-regionandfuel-by-fuelanalysis,drawingonthelatestofficialnationaldataandpubliclyavailableenergy,economicandweatherdata.TheCovid-19pandemichadfar-reachingimpactsonenergydemandin2020,reducingglobalCO2emissionsby5.1%.However,theworldhasexperiencedanextremelyrapideconomicrecoverysincethen,drivenbyunprecedentedfiscalandmonetarystimulusandafast–althoughuneven–roll-outofvaccines.Therecoveryofenergydemandin2021wascompoundedbyadverseweatherandenergymarketconditions,whichledtomorecoalbeingburntdespiterenewablepowergenerationregisteringitslargesteverannualgrowth.Emissionsincreasedbyover2.0Gtfrom2020levels.Thisputs2021above2010asthelargesteveryear-on-yearincreaseinenergy-relatedCO2emissionsinabsoluteterms.Thereboundin2021morethanreversedthepandemic-induceddeclineinemissionsofcloseto1.9Gtexperiencedin2020.CO2emissionsin2021rosetoaround180megatonnes(Mt)abovethepre-pandemiclevelof2019.Figure1TotalCO2emissionsfromenergycombustionandindustrialprocessesandtheirannualchange,1900-20211AllsubsequentmentionsofCO2emissionsrefertoCO2emissionsfromenergycombustionandindustrialprocesses,unlessotherwisespecified.5101520253035401900191019201930194019501960197019801990200020102020Gt-2-1012GtGlobalEnergyReview:CO2Emissionsin2021PAGE4IEA.Allrightsreserved.The6%increaseinCO2emissionsin2021wasinlinewiththejumpinglobaleconomicoutputof5.9%.ThismarksthestrongestcouplingofCO2emissionswithGrossdomesticproduct(GDP)growthsince2010,whenglobalemissionsreboundedby6.2%whileeconomicoutputgrewby5.1%astheworldemergedfromtheGlobalFinancialCrisis.TheworldhasnotheededthecallforasustainablerecoveryfromtheCovid-19crisisWithcarbon-intensivegrowthreminiscentof2010,theglobaleconomicrecoveryfromtheCovid-19crisishasnotbeenthesustainablerecoverythatIEAExecutiveDirectorFatihBirolcalledforattheonsetofthepandemicin2020.Nonetheless,certainadvancedeconomieshaveemphasiseddecarbonisationmeasuresintheireconomicrecovery.TheIEA’sSustainableRecoveryTrackerhasshownthatasofOctober2021,USD470bilionhadbeenearmarkedforsustainablemeasureswithinrecoverypackagesthrough2030.Lookingatthecrucial2021-2023period,measurestodatecouldmobilisearoundUSD400billionayearincleanenergyandsustainablerecoveryinvestment.However,thiswouldstillonlyrepresent40%oftheinvestmentneededintheIEA’sSustainableRecoveryPlan,whichisalignedwithapathwaytowardsreachingnetzeroemissionsby2050globally.Cleanenergyprovisionsintherecoverypackagesofseveralmajoreconomieshavecontributedsomewhattomitigatingthenear-termreboundinemissions,largelywherelow-carbonprogrammeswerealreadyinplaceandcouldchanneltheadditionalsupportquickly.However,manyrecoveryplanshaveaddednewprogrammes,whicharesettohavegreatermitigationimpactsinthecomingyears.Theworldmustnowensurethattheglobalreboundinemissionsin2021wasaone-off–andthatsustainableinvestmentscombinedwiththeaccelerateddeploymentofcleanenergytechnologieswillreduceCO2emissionsin2022,keepingalivethepossibilityofreducingglobalCO2emissionstonetzeroby2050.CO2emissionsfromcoalrisetoall-timehighCoalaccountedforover40%oftheoverallgrowthinglobalCO2emissionsin2021.Coalemissionsnowstandatanall-timehighof15.3Gt,surpassingtheirpreviouspeak(seenin2014)byalmost200Mt.CO2emissionsfromnaturalgasalsoreboundedwellabove2019levelsto7.5Gt,asdemandincreasedinallsectors.At10.7Gt,emissionsfromoilremainedsignificantlybelowpre-pandemiclevelsbecauseofthelimitedrecoveryinglobaltransportactivityin2021.GlobalEnergyReview:CO2Emissionsin2021PAGE5IEA.Allrightsreserved.Oildemandfortransportremained8%belowpre-pandemiclevelsThepandemiccontinuedtoimpactoilusefortransportin2021,withdemandmorethan6millionbarrelsperdaybelow2019levels,andemissions600Mtlower.CO2emissionsrelatedtointernationalaviationin2021stoodatonly60%(370Mt)oftheirpre-pandemiclevels.ContinuedlockdownsandotherCovid-19transmissionreductionmeasuresinmanymajoreconomiesthroughthecourseoftheyearalsostymiedtherecoveryofroadtransportactivity.Areturntopre-pandemiclevelsoftransportactivitywouldhaveaddedanother600MttoglobalCO2emissionsin2021.Thatwouldhavebroughtemissionsfromoilinlinewith2019levels.Theresultant7.8%increaseintotalCO2emissionswouldhavebeenthefastestrateofgrowthsincethe1950s.Figure2ChangeinCO2emissionsbyfossilfuel,relativeto2019levels,2019-2021IEA.Allrightsreserved.ThebiggestincreaseinCO2emissionsbysectorin2021tookplaceinelectricityandheatproduction,wheretheyjumpedbymorethan900Mt.Thisaccountedfor46%oftheglobalincreaseinemissions,sincetheuseofallfossilfuelsincreasedtohelpmeetelectricitydemandgrowth.CO2emissionsfromthesectorneared14.6Gt,theirhighesteverlevelandaround500Mthigherthanin2019.ThePeople’sRepublicofChina(hereafter“China”)accountedforalmostallofthe-1500-1000-5005001000201920202021MtCO2CoalOilNaturalgasEmissionsfromtheworld’spowerplantsreachedtheirhighesteverlevelGlobalEnergyReview:CO2Emissionsin2021PAGE6IEA.Allrightsreserved.globalincreaseinelectricityandheatsectoremissionsbetween2019and2021.AsmalldeclinefromtherestoftheworldwasinsufficienttooffsettheincreaseinChina.GlobalCO2emissionsfromthebuildingsandindustrysectorsreboundedbacktotheir2019levels,drivenbyincreasesinbothadvancedeconomiesandemergingmarketanddevelopingeconomies.Chinawasthenotableexception,withlowercoaluseinindustrypushingCO2emissionsfromtheindustrysectorbelowtheir2019levelforthesecondyearinarow.TransportwastheonlysectorinwhichglobalCO2emissionsremainedwellbelow2019levels.Theemissionsreductionimpactofrecordelectriccarsalesin2021wascancelledoutbytheparallelincreaseinsalesofSUVs.Figure3AnnualchangeinCO2emissionsbysector,2020-2021IEA.Allrightsreserved.The6.9%increaseinCO2emissionsfromtheelectricityandheatsectorsin2021wasdrivenbythebiggesteveryear-on-yearincreaseinglobalelectricitydemand.Risingbycloseto1400terawatt-hours(TWh),or5.9%,thegrowthinelectricitydemandin2021wasmorethan15timesthesizeofthedropindemandin2020.Coal-firedpowerplantswerecalledupontomeethalfoftheincreaseinglobalelectricitydemandin2021,withcoal’sshareoftotalgenerationreboundingabove36%.CO2emissionsfromcoalpowerplantsrosetoarecord10.5Gt,whichis800Mtabovetheir2020levelandmorethan200Mtabovetheirpreviouspeakin2018.WithoutsupplyconstraintsandhighpricesthataffectedChinaandIndiaduringcertainperiodsoftheyear,globalcoaluseforelectricitygenerationin2021wouldhavebeenevenhigher.-1500-1000-50005001000150020202021MtCO2ElectricityandheatIndustryTransportBuildingsOtherNetchange(2019-2021)GlobalEnergyReview:CO2Emissionsin2021PAGE7IEA.Allrightsreserved.Spikingnaturalgaspricesresultedingas-to-coalswitching,increasingemissionsbyover100MtTherecoursetocoal-firedelectricitygenerationin2021wascompoundedbyrecordhighnaturalgasprices.ThecostsofoperatingexistingcoalplantsacrosstheUnitedStatesandmanyEuropeanpowersystemswereconsiderablycheaperthantheoperatingcostsforgas-firedpowerplantsforthemajorityof2021.Gas-to-coalswitchingpushedupglobalCO2emissionsfromelectricitygenerationbywellover100Mt,notablyintheUnitedStatesandEuropewherecompetitionbetweengas-andcoal-firedpowerplantsistightest.IntheUnitedStates,emissionsfromcoal-firedplantsjumpedby17%in2021butnonethelessremainedlowerthanin2019.Theincreasewas16%intheEuropeanUnion,butthiswasstillsignificantlysmallerthanthe21%declinein2020.Renewablepowerposteditsbiggesteverincreasein2021Despitethereboundincoaluse,renewableenergysourcesandnuclearpowerprovidedahighershareofglobalelectricitygenerationthancoalin2021.Renewables-basedgenerationreachedanall-timehigh,exceeding8000TWhin2021,arecord500TWhabovethelevelin2020.OutputfromwindandsolarPVincreasedby270TWhand170TWh,respectively,whilehydrogenerationdeclinedby15TWhduetotheimpactsofdrought,notablyintheUnitedStatesandBrazil.Nuclearpoweroutputexpandedby100TWh.Withoutincreasingoutputfromrenewablesandnuclearpower,theriseinglobalCO2emissionsin2021wouldhavebeen220Mthigher.Figure4CO2emissionsfromelectricityandheatproductionbyfuel,andsharebyfuel,2000-2021IEA.Allrightsreserved.5%10%15%20%25%30%35%40%45%2468101214161820002005201020152021GtCO2Non-renewablewasteOilNaturalgasCoalCoalLowemissionsGenerationshare(rightaxis):GlobalEnergyReview:CO2Emissionsin2021PAGE8IEA.Allrightsreserved.ThereboundofglobalCO2emissionsabovepre-pandemiclevelshaslargelybeendrivenbyChinaAlmostallregionspostedanincreaseinCO2emissionsin2021,withtheannualchangerangingfromgrowthofmorethan10%inBrazilandIndia,tolessthan1%inJapan.EmissionsinChinaroseby5%,whiletheUnitedStatesandEuropeanUnionbothregisteredincreasesofaround7%.China’sCO2emissionsincreasedby750Mtoverthetwo-yearperiodbetween2019and2021.Chinawastheonlymajoreconomytoexperienceeconomicgrowthinboth2020and2021.TheemissionsincreaseinChinamorethanoffsettheaggregatedeclineintherestoftheworldof570Mtbetween2019and2021.ElectricitydemandinChinajumpedby10%in2021,addingtheequivalentofthetotaldemandofallofAfricaTheeconomicrecoveryinChinaappearstobeparticularlyenergyintensive.TheprimaryenergydemandintensityofChina’sGDPbetween2019and2021improvedbyanaverageofonly1%annually,comparedwith1.2%between2008and2010whenChinaenactedhugeeconomicstimulus,andanaverageimprovementrateof3.7%from2010to2019.China’senergyintensityin2021wasimpactedprimarilybyevolutionsintheelectricitysector.WithrapidGDPgrowthandadditionalelectrificationofenergyservices,electricitydemandinChinagrewby10%in2021,fasterthaneconomicgrowthat8.4%.Theincreaseindemandofalmost700TWhwasthelargesteverexperiencedinChina.Withdemandgrowthoutstrippingtheincreaseoflowemissionssupply,coalwascalledontofill56%oftheriseinelectricitydemand.Thiswasdespitethecountryalsoseeingitslargesteverincreaseinrenewablepoweroutputin2021.ElectricitygenerationfromrenewablesinChinaneared2500TWhin2021,accountingfor28%oftotalgenerationinthecountry.CO2emissionsinIndiareboundedstronglyin2021torise80Mtabove2019levels,ledbygrowthincoaluseforelectricitygeneration.Coal-firedgenerationreachedanall-timehighinIndia,jumping13%abovethelevelin2020whencoalgenerationhaddeclinedby3.7%.Thiswasinpartbecausethegrowthofrenewablesslowedtoone-thirdofitsaveragerateofthepreviousfiveyears.GlobalEnergyReview:CO2Emissionsin2021PAGE9IEA.Allrightsreserved.Figure5CO2emissionsinselectedemergingandadvancedeconomies,2000-2021IEA.Allrightsreserved.Globaleconomicoutputinadvancedeconomiesrecoveredtopre-pandemiclevelsin2021,butCO2emissionsreboundedlesssharply,signallingamorepermanenttrajectoryofstructuraldecline.CO2emissionsintheUnitedStatesin2021were4%belowtheir2019level.IntheEuropeanUnion,theywere2.4%lower.InJapan,emissionsdroppedby3.7%in2020andreboundedbylessthan1%in2021.Acrossadvancedeconomiesoverall,structuralchangessuchasincreaseduptakeofrenewables,electrificationandenergyefficiencyimprovementsavoidedanadditional100MtofCO2emissionsin2021comparedwith2020.PercapitaCO2emissionsinChinanowexceedtheaverageinadvancedeconomies2468101220002005201020152021GtCO2ChinaIndiaUnitedStatesEuropeanUnionJapanEmergingeconomies2468101220002005201020152021GtCO2AdvancedeconomiesOnapercapitabasis,CO2emissionsinadvancedeconomieshavefallento8.2tonnesonaverageandarenowbelowtheaverageof8.4tonnesinChina.However,theoverallaverageforadvancedeconomiesmaskssignificantdifferences:percapitaemissionsaverage14tonnesintheUnitedStates,6tonnesintheEuropeanUnion,and3.2tonnesinMexico.GlobalEnergyReview:CO2Emissionsin2021PAGE10IEA.Allrightsreserved.Figure6CO2emissionspercapitabyregion,2000-2021IEA.Allrightsreserved.WithbothglobalCO2emissionsandGDPrisingbyaround6%in2021,theaverageemissionsintensityofglobaleconomicoutputstayedconstantat0.26tonnesofCO2perUSD1000.TheemissionsintensityofGDPdeclinedinChina,fallingbymorethan3%to0.45tonnesofCO2perUSD1000ofGDP.ChinanonethelesshasthehighestemissionsintensityofGDPamongmajoreconomies.ThisisaresultofthedominantroleofcoalinChina’senergymix(60%comparedwiththeglobalaverageof27%)andthehighshareofindustryinChina’sGDP(39%comparedwiththeglobalaverageof30%).TheemissionsintensityofChina’sGDPhasnonethelessdeclinedby40%sincetheyear2000.Inadvancedeconomies,theemissionsintensityofGDPtickedupslightlyin2021butnonethelessremainedonadecliningtrend.TheUnitedStatesandtheEuropeanUnionhaveaveragedanannualimprovementrateofaround3%since2010.2468101220002005201020152021tCO2/capitaAdvancedeconomiesChinaOtheremergingmarketanddevelopingeconomiesGlobalEnergyReview:CO2Emissionsin2021PAGE11IEA.Allrightsreserved.Figure7CO2emissionsintensityofGDP,1990-2021IEA.Allrightsreserved.Thejumpinfossilfuelusepushesgreenhousegasemissionstoanewpeak0.20.40.60.81.01.21.41990200020102021tCO2per$1000ChinaUnitedStatesEuropeanUnionIndiaJapanWorldTheriseinenergy-relatedCO2emissionspushedoverallgreenhousegasemissionsfromenergytotheirhighesteverlevelin2021.Totalgreenhousegasemissionsreached40.8GtofCO2equivalent(CO2eq)in2021whenusinga100-yearglobalwarmingpotentialtimehorizon(see“Datasourcesandmethod”forGWPvalues),surpassingthepreviousall-timehighin2019.CO2emissionsfromenergycombustionandindustrialprocessaccountedforcloseto89%ofenergysectorgreenhousegasemissionsin2021.CO2emissionsfromgasflaringaccountedforanother0.7%.BeyondCO2,fugitiveandcombustion-relatedmethaneemissionsrepresentedalmost10%ofthetotal,andcombustion-relatedemissionsofnitrousoxide0.7%.Methaneemissionsfromtheenergysectorrosebyjustunder5%in2021butremainbelowtheir2019level.GlobalEnergyReview:CO2Emissionsin2021PAGE12IEA.Allrightsreserved.Figure8Energy-relatedgreenhousegasemissions,2000-2021IEA.Allrightsreserved.Datasourcesandmethod5101520253035404520002005201020152021GtCO2eqCO2fromflaringNitrousoxideMethaneIndustrialprocessesWasteNaturalgasOilCoalTheIEAdrawsuponawiderangeofrespectedstatisticalsourcestoconstructestimatesofenergydemand,CO2emissionsandotherenergy-relatedgreenhousegasemissionsfortheyear2021.SourcesincludethelatestmonthlydatasubmissionstotheIEAEnergyDataCentre(includingNovemberandDecember2021,whenavailable),real-timedatafrompowersystemoperatorsacrosstheworld,otherstatisticalreleasesfromnationaladministrations,andrecentmarketdatafromtheIEAMarketReportseriesthatcoverscoal,oil,naturalgas,renewables,electricityandenergyefficiency.Wheredataarenotavailableonanannualormonthlybasis,estimatesmaybeused.CO2emissionsincludeemissionsfromallusesoffossilfuelsforenergypurposes,includingemissionsfromthecombustionofnon-renewablewaste.Thescopeofemissionscoveredinthisyear’sGlobalEnergyReviewhasbeenexpandedtoalsoincludeCO2emissionsfromindustrialprocessessuchascement,ironandsteel,andchemicalsproduction.Estimatesofindustrialprocessemissionsdrawuponthelateststatisticaldataonclinkerproductionforcementandsteelproduction,andrelevantchemicalsdata.CO2emissionsfromthecombustionofflaredgasesarealsoincludedforthefirsttime.Non-CO2greenhousegasemissionsincludedwithinthescopeoftheGlobalEnergyReviewforthefirsttimethisyearincludefugitivemethaneemissionsfromoil,gasandcoalsupply.Methaneandnitrousoxideemissionsrelatedtoenergycombustionarealsoevaluated,basedontypicalemissionsfactorsforgivenend-usesandregions.Whenconvertingnon-CO2greenhousegasemissionstoCO2GlobalEnergyReview:CO2Emissionsin2021PAGE13IEA.Allrightsreserved.equivalentquantities,aglobalwarmingpotentialovera100-yearperiodisused,withglobalwarmingpotentialvaluesof30formethane,and273fornitrousoxide.EconomicgrowthratesusedforthisanalysisarethoseoftheInternationalMonetaryFund’sJanuary2022updatetotheWorldEconomicOutlook.AllmonetaryquantitiesareexpressedinUSD2020,inPPPterms.GlobalEnergyReview:CO2Emissionsin2021PAGE14IEA.Allrightsreserved.ThispublicationreflectstheviewsoftheIEASecretariatbutdoesnotnecessarilyreflectthoseofindividualIEAmembercountries.TheIEAmakesnorepresentationorwarranty,expressorimplied,inrespectofthepublication’scontents(includingitscompletenessoraccuracy)andshallnotberesponsibleforanyuseof,orrelianceon,thepublication.Unlessotherwiseindicated,allmaterialpresentedinfiguresandtablesisderivedfromIEAdataandanalysis.Thispublicationandanymapincludedhereinarewithoutprejudicetothestatusoforsovereigntyoveranyterritory,tothedelimitationofinternationalfrontiersandboundariesandtothenameofanyterritory,cityorarea.IEA.Allrightsreserved.IEAPublicationsInternationalEnergyAgencyWebsite:www.iea.orgContactinformation:www.iea.org/about/contactTypesetinFrancebyIEA–March2022Coverdesign:IEA