全球太阳能光伏应用趋势2022(英)-IEAVIP专享VIP免费

Task 1 Strategic PV Analysis and Outreach
PVPS
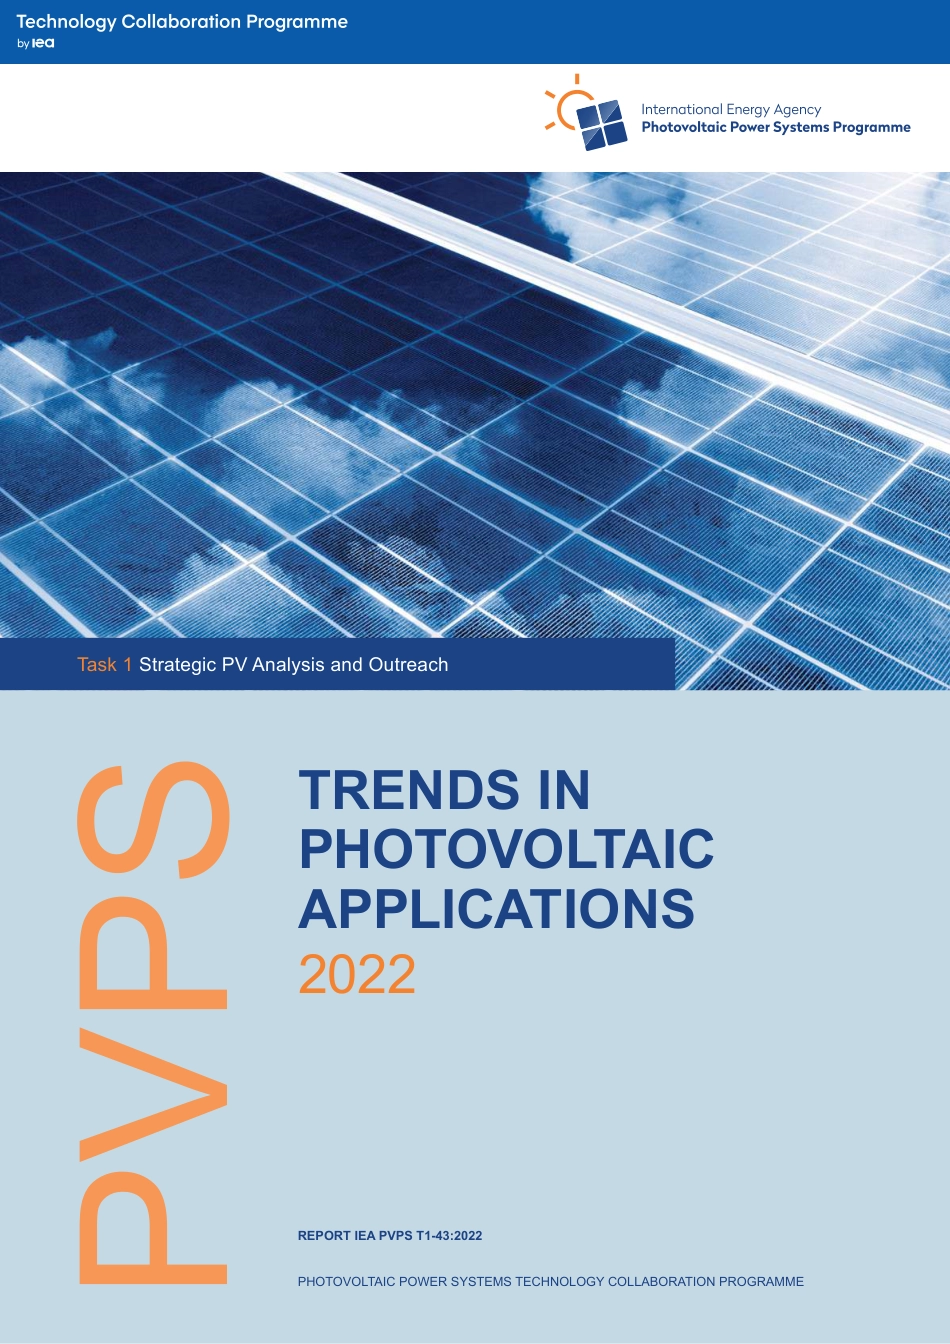
TRENDS IN
PHOTOVOLTAIC
APPLICATIONS
2022
REPORT IEA PVPS T1-43:2022
PHOTOVOLTAIC POWER SYSTEMS TECHNOLOGY COLLABORATION PROGRAMME
WHAT IS IEA PVPS TCP?
The International Energy Agency (IEA), founded in 1974, is an
autonomous body within the framework of the Organization
for Economic Cooperation and Development (OECD).
The Technology Collaboration Programme (TCP) was created
with a belief that the future of energy security and sustainability
starts with global collaboration. The programme is made
up of thousands of experts across government, academia,
andindustry dedicated to advancing common research and the
application of specific energy technologies.
The IEA Photovoltaic Power Systems Programme (IEA PVPS)
is one of the TCP’s within the IEA and was established in 1993.
The mission of the programme is to “enhance the international
collaborative efforts which facilitate the role of photovoltaic solar
energy as a cornerstone in the transition to sustainable energy
systems.” In order to achieve this, the Programme’s participants
have undertaken a variety of joint research projects in PV power
systems applications. The overall programme is headed by an
Executive Committee, comprised of one delegate from each
country or organisation member, which designates distinct ‘Tasks,’
that may be research projects or activity areas. This report
has been prepared under Task 1, which deals with market and
industry analysis, strategic research and facilitates the exchange
and dissemination of information arising from the overall IEA
PVPSProgramme.
The IEA PVPS participating countries are Australia, Austria,
Canada, Chile, China, Denmark, Finland, France, Germany,
Israel, Italy, Japan, Korea, Malaysia, Mexico, Morocco, the
Netherlands, Norway, Portugal, South Africa, Spain, Sweden,
Switzerland, Thailand, Turkey, and the United States of
America. The European Commission, Solar Power Europe, the
Smart Electric Power Alliance (SEPA), the Solar Energy Industries
Association and the Solar Energy Research Institute of Singapore
are also members.
Visit us at: www.iea-pvps.org
AUTHORS
Main Authors: Gaëtan Masson (Becquerel Institute), Izumi Kaizuka (RTS Corporation).
Analysis: Izumi Kaizuka (RTS Corporation), Elina Bosch, Gaëtan. Masson (Becquerel Institute), Caroline Plaza (BecquerelInstitute
France), Alessandra Scognamiglio (ENEA), Arnulf Jäger-Waldau (EU-JRC), Johan Lindahl (Becquerel Institute Sweden),
EddyBlokken (SERIS).
Data: IEA PVPS Reporting Countries, Becquerel Institute (BE), RTS Corporation (JP) and Arnulf Jaeger-Waldau (EU-JRC),
Forthe non-IEA PVPS countries UNEF (ES). For the other European Union countries: EU-JRC. For floating PV data: SERIS(SG).
For the non-IEA PVPS countries: BSW, UNEF.
Editor: Gaëtan Masson, IEA PVPS Task 1 Manager.
Design: Boheem
DISCLAIMER
The IEA PVPS TCP is organised under the auspices of the International Energy Agency (IEA) but is functionally and legally
autonomous. Views, findings and publications of the IEA PVPS TCP do not necessarily represent the views or policies of the
IEA Secretariat or its individual member countries Data for non-IEA PVPS countries are provided by official contacts or experts
in the relevant countries. Data are valid at the date of publication and should be considered as estimates in several countries
due to the publication date.
ISBN ISBN 978-3-907281-35-2: Trends in Photovoltaic Applications 2022.
1
IEA PVPS TRENDS IN PHOTOVOLTAIC APPLICATIONS 2022
REPORT SCOPE AND OBJECTIVES
The Trends report’s objective is to present and interpret
developments in the PV power systems market and the
evolving applications for these products within this market.
These trends are analysed in the context of the business, policy
and nontechnical environment in the reporting countries.
This report is prepared to assist those who are responsible for
developing the strategies of businesses and public authorities, and
to support the development of medium-term plans for electricity
utilities and other providers of energy services. It also provides
guidance to government officials responsible for setting energy
policy and preparing national energy plans. The scope of the
report is limited to PV applications with a rated power of 40 W or
more. National data supplied are as accurate as possible at the
time of publication. Data accuracy on production levels andsystem
prices varies, depending on the willingness of the relevant national
PVindustry to provide data. This report presents the results of the
25th international survey. It provides an overview of PV power
systems applications, markets and production in the reporting
countries and elsewhere at the end of 2021 and analyses trends in
the implementation of PV power systems between 1992 and 2021.
Key data for this publication were drawn mostly from national
survey reports and information summaries, which were supplied by
representatives from each of the reporting countries. Information
from the countries outside IEA PVPS are drawn from avariety of
sources and, while every attempt is made to ensure their accuracy,
the validity of some of these data cannot be assured with the same
level of confidence as for IEA PVPS member countries.
ACKNOWLEDGMENT
This report has been prepared under the supervision by Task 1 participants. A special thanks to all of them. The report authors also
gratefully acknowledge special support of Eddy Blokken fromSERIS.
Task1StrategicPVAnalysisandOutreachPVPSTRENDSINPHOTOVOLTAICAPPLICATIONS2022REPORTIEAPVPST1-43:2022PHOTOVOLTAICPOWERSYSTEMSTECHNOLOGYCOLLABORATIONPROGRAMMEWHATISIEAPVPSTCP?TheInternationalEnergyAgency(IEA),foundedin1974,isanautonomousbodywithintheframeworkoftheOrganizationforEconomicCooperationandDevelopment(OECD).TheTechnologyCollaborationProgramme(TCP)wascreatedwithabeliefthatthefutureofenergysecurityandsustainabilitystartswithglobalcollaboration.Theprogrammeismadeupofthousandsofexpertsacrossgovernment,academia,andindustrydedicatedtoadvancingcommonresearchandtheapplicationofspecificenergytechnologies.TheIEAPhotovoltaicPowerSystemsProgramme(IEAPVPS)isoneoftheTCP’swithintheIEAandwasestablishedin1993.Themissionoftheprogrammeisto“enhancetheinternationalcollaborativeeffortswhichfacilitatetheroleofphotovoltaicsolarenergyasacornerstoneinthetransitiontosustainableenergysystems.”Inordertoachievethis,theProgramme’sparticipantshaveundertakenavarietyofjointresearchprojectsinPVpowersystemsapplications.TheoverallprogrammeisheadedbyanExecutiveCommittee,comprisedofonedelegatefromeachcountryororganisationmember,whichdesignatesdistinct‘Tasks,’thatmayberesearchprojectsoractivityareas.ThisreporthasbeenpreparedunderTask1,whichdealswithmarketandindustryanalysis,strategicresearchandfacilitatestheexchangeanddisseminationofinformationarisingfromtheoverallIEAPVPSProgramme.TheIEAPVPSparticipatingcountriesareAustralia,Austria,Canada,Chile,China,Denmark,Finland,France,Germany,Israel,Italy,Japan,Korea,Malaysia,Mexico,Morocco,theNetherlands,Norway,Portugal,SouthAfrica,Spain,Sweden,Switzerland,Thailand,Turkey,andtheUnitedStatesofAmerica.TheEuropeanCommission,SolarPowerEurope,theSmartElectricPowerAlliance(SEPA),theSolarEnergyIndustriesAssociationandtheSolarEnergyResearchInstituteofSingaporearealsomembers.Visitusat:www.iea-pvps.orgAUTHORSMainAuthors:GaëtanMasson(BecquerelInstitute),IzumiKaizuka(RTSCorporation).Analysis:IzumiKaizuka(RTSCorporation),ElinaBosch,Gaëtan.Masson(BecquerelInstitute),CarolinePlaza(BecquerelInstituteFrance),AlessandraScognamiglio(ENEA),ArnulfJäger-Waldau(EU-JRC),JohanLindahl(BecquerelInstituteSweden),EddyBlokken(SERIS).Data:IEAPVPSReportingCountries,BecquerelInstitute(BE),RTSCorporation(JP)andArnulfJaeger-Waldau(EU-JRC),Forthenon-IEAPVPScountriesUNEF(ES).FortheotherEuropeanUnioncountries:EU-JRC.ForfloatingPVdata:SERIS(SG).Forthenon-IEAPVPScountries:BSW,UNEF.Editor:GaëtanMasson,IEAPVPSTask1Manager.Design:BoheemDISCLAIMERTheIEAPVPSTCPisorganisedundertheauspicesoftheInternationalEnergyAgency(IEA)butisfunctionallyandlegallyautonomous.Views,findingsandpublicationsoftheIEAPVPSTCPdonotnecessarilyrepresenttheviewsorpoliciesoftheIEASecretariatoritsindividualmembercountriesDatafornon-IEAPVPScountriesareprovidedbyofficialcontactsorexpertsintherelevantcountries.Dataarevalidatthedateofpublicationandshouldbeconsideredasestimatesinseveralcountriesduetothepublicationdate.ISBNISBN978-3-907281-35-2:TrendsinPhotovoltaicApplications2022.1IEAPVPSTRENDSINPHOTOVOLTAICAPPLICATIONS2022REPORTSCOPEANDOBJECTIVESTheTrendsreport’sobjectiveistopresentandinterpretdevelopmentsinthePVpowersystemsmarketandtheevolvingapplicationsfortheseproductswithinthismarket.Thesetrendsareanalysedinthecontextofthebusiness,policyandnontechnicalenvironmentinthereportingcountries.Thisreportispreparedtoassistthosewhoareresponsiblefordevelopingthestrategiesofbusinessesandpublicauthorities,andtosupportthedevelopmentofmedium-termplansforelectricityutilitiesandotherprovidersofenergyservices.Italsoprovidesguidancetogovernmentofficialsresponsibleforsettingenergypolicyandpreparingnationalenergyplans.ThescopeofthereportislimitedtoPVapplicationswitharatedpowerof40Wormore.Nationaldatasuppliedareasaccurateaspossibleatthetimeofpublication.Dataaccuracyonproductionlevelsandsystempricesvaries,dependingonthewillingnessoftherelevantnationalPVindustrytoprovidedata.Thisreportpresentstheresultsofthe25thinternationalsurvey.ItprovidesanoverviewofPVpowersystemsapplications,marketsandproductioninthereportingcountriesandelsewhereattheendof2021andanalysestrendsintheimplementationofPVpowersystemsbetween1992and2021.Keydataforthispublicationweredrawnmostlyfromnationalsurveyreportsandinformationsummaries,whichweresuppliedbyrepresentativesfromeachofthereportingcountries.InformationfromthecountriesoutsideIEAPVPSaredrawnfromavarietyofsourcesand,whileeveryattemptismadetoensuretheiraccuracy,thevalidityofsomeofthesedatacannotbeassuredwiththesamelevelofconfidenceasforIEAPVPSmembercountries.ACKNOWLEDGMENTThisreporthasbeenpreparedunderthesupervisionbyTask1participants.Aspecialthankstoallofthem.ThereportauthorsalsogratefullyacknowledgespecialsupportofEddyBlokkenfromSERIS.IEAPVPSTRENDSINPHOTOVOLTAICAPPLICATIONS20222FOREWORDTheannualPVmarketreached175GWworldwidein2021.Whiletheworldwasfacingthesecondyearofapandemicanddespitetheend-of-yeardisruptionsinAsia,thephotovoltaicmarketcontinuedgrowing.Withoutthesedrawbacks,itprobablycouldhavereached200GW.Thisisanexceptionalresult:945,7GWofPVpowerplantswereproducingelectricityworldwideattheendoftheyear,ofwhicharound70%havebeeninstalledduringthelastfiveyears.Overtheyears,anincreasingnumberofmarketshavestartedcontributingtoglobalPVinstallations,and2021closedwitharecordnumberofnewcountriesinstallingsignificantnumbersofPV.Theupwardtrendinmodulepricesobservedatthegloballevelattheendof2021,relatedtostressonseveralrawmaterialsmarkets,hasnotaffectedthecompetitivenessanddevelopmentofthemarket.PV’sroleintheglobaltransitiontolow-carbonenergyisconfirmed.1200TWhareproducedannuallybyPVplants,theequivalentofthecombinedannualconsumptionofGermany,France,Spain,andBelgium.ThePVcapacitygloballyavoidednolessthanonebilliontonsofCO2,equatingroughlyto3%ofannualglobalemissions,whichreached33Gtin2021.PVisthusalreadyakeydecarbonizationpowersource.TherapiddeclineinPVpricesoverthepastyears,despitetheconjecturalrecentpriceincrease,hasenabledPVsystemstoachievecompetitivepricesinseveralcountries.Thepossibilityofdevelopingphotovoltaicsystemswithlimitedornofinancialincentivesisnowanobservablereality.Long-termprivatecontracts(PPA)andthesaleofelectricityonwholesalemarketshavebeenobservedinanincreasingnumberofcountriesin2021.ThisgrowingcompetitivenesshasalsoboostedtheshareofPVinstallationsoperatingunderself-consumptionwithoutanyfinancialsupportmechanism.Ifelectricitypricesshouldremainatthehighlevelexperiencedin2022inseveralplacesaroundtheworldin2022,especiallyinEurope,thequestionofcompetitivenesswouldchangecompletely:withoutanysupportschemelimitations,thepotentialofthePVmarketseemsvirtuallyunlimited.Withthisbroaderintegration,thequestionofaccess,management,andfinancingofthegridwillbecomeakeychallenge.Theelectrificationofthetransportsector,aswellasstoragecapacitiesandtheproductionofgreenhydrogen,willincreasethedemandforlow-carbonelectricity.Thecompetitivenessalsopavesthewayforfurtherintegrationinbuildings,vehicles,infrastructure,andcross-cuttingapplicationswithnearlyeveryenergy-consumingsector.OneofthemostpromisinghybridsegmentsiscalledAgriPV,whichcombinesagriculturewithenergyproduction.Whilestillanichemarketatthispoint,AgriPVshowssignificantdevelopmentpotential.ThesocialacceptanceoftheenergytransitionisamajorissueandisbecomingakeysubjectforthedevelopmentofPV.Itismultifaceted:economic,social,societal,andenvironmental,butalsoaesthetic.PVisamajorcontributorontheroadtosustainability:thenatureoftheenergytransformation,andtheacceptanceofchangeareessentialelementsinthesuccessofthisrevolution:dealingwiththenumberofjobsconcerned,theimpactontheenvironmentandthesocialaspectslinkedtothedevelopmentofPVhasbecomeunavoidable.EnsuringalocaldevelopmentofthePVindustryandimprovingtheuseofresourcesispartoftheresponsetotheneedforPVtobemorevirtuousthantheenergysourcesthatitreplaces.In2022,photovoltaictechnologyhasbecomeincreasinglyasourceofaffordable,local,andlow-carbonenergy.Inthecontextofgeopoliticaltensionsandresourcescarcity,PVcouldbecomeastabilizationelement,promotingpeacethroughreducedtensionsinenergymarketswhileacceleratingthedevelopmentoftheworld.GaëtanMassonManagerTask1IEAPVPSProgrammeDanielMugnierChairIEAPVPSProgramme3IEAPVPSTRENDSINPHOTOVOLTAICAPPLICATIONS2022TABLEOFCONTENTSFOREWORD2INTRODUCTIONTOTHECONCEPTSANDMETHODOLOGY5PVTECHNOLOGY5PVAPPLICATIONSANDMARKETSEGMENTS6METHODOLOGYFORTHEMAINPVMARKETDEVELOPMENTINDICATORS8PVMARKETDEVELOPMENTTRENDS9THEGLOBALPVINSTALLEDCAPACITY9PVMARKETSEGMENTS16EMERGINGPVMARKETSEGMENTS19OFF-GRIDMARKETDEVELOPMENT22PVDEVELOPMENTPERREGION22POLICYFRAMEWORK31PVMARKETDRIVERSANDSUPPORTSCHEMES33PROSUMERSANDENERGYCOMMUNITIES’POLICIES38ENERGYTRANSITIONPOLITICS40INDUSTRIALANDMANUFACTURINGPOLICIES42TRENDSINPVINDUSTRY43THEUPSTREAMPVSECTOR43THEDOWNSTREAMPVSECTOR53SOCIETALIMPLICATIONSOFPVANDACCEPTANCE55ACCEPTANCEOFPVDEPLOYMENT55CLIMATECHANGEMITIGATION57VALUEFORTHEECONOMY58AESTHETICSANDLANDSCAPE64COMPETITIVENESSOFPVELECTRICITYIN202165MODULEPRICES65SYSTEMPRICES68COSTOFPVELECTRICITY70PVINTHEENERGYSECTOR75PVELECTRICITYPRODUCTION75PVINTEGRATIONANDSECTORCOUPLING79ANNEXES81LISTOFFIGURES84LISTOFTABLES854TRENDSINPHOTOVOLTAICAPPLICATIONS//2022PHOTOVOLTAICPOWERSYSTEMSPROGRAMMEWWW.IEA-PVPS.ORGTOTALBUSINESSVALUEINPVSECTORIN2021$190BILLIONUSDTOP5CHINAEUUSAINDIAJAPAN54.9GW28.7GW26.9GW13.4GW6.6GWPVCONTRIBUTIONTOELECTRICITYDEMAND5%ShareofPVintheglobalelectricitydemandin2021CLIMATECHANGEIMPACTS1060milliontonsofCO2savedin2021GLOBALPVCAPACITYENDOF2021PVPENETRATIONPERCAPITAIN202110110orNAPVpenetration(Wp/capita)506YEARLYPVINSTALLATION,MODULEPVPRODUCTIONANDMODULEPRODUCTIONCAPACITY2011-2021(GW)010020030040050060020212020201920182017201620152014201320122011GWTotalmoduleproductioncapacityTotalmodulePVproductionYearlyPVinstallationsPVMARKETSIN202142COUNTRIESREACHEDATLEAST1GWpIN202118COUNTRIESINSTALLEDATLEAST1GWpIN2021SOURCEIEAPVPS&OTHERSPVPOWERPERCAPITA1.AUSTRALIA(1011Wp/cap)2.THENETHERLANDS(818Wp/cap)3.GERMANY(718Wp/cap)4.JAPAN(622Wp/cap)5.BELGIUM(620Wp/cap)174GW772GW946GW2021GLOBALPVCAPACITYENDOF2020(GW)ANNUALINSTALLEDCAPACITYIN2021(GW)5oneINTRODUCTIONTOTHECONCEPTSANDMETHODOLOGYPVTECHNOLOGYPhotovoltaic(PV)devicesconvertlightdirectlyintoelectricityandshouldnotbeconfusedwithothersolartechnologiessuchasconcentratedsolarpower(CSP)orsolarthermalforheatingandcooling.ThekeycomponentsofaPVpowersystemarevarioustypesofphotovoltaiccells(oftencalledsolarcells)interconnectedandencapsulatedtoformaphotovoltaicmodule(thecommercialproduct),themountingstructureforthemoduleorarray,theinverter(essentialforgrid-connectedsystemsandrequiredformostoff-gridsystems),thestoragebatteryandchargecontroller(foroff-gridsystemsbutalsoincreasinglyforgrid-connectedones).CELLS,MODULESANDSYSTEMSPhotovoltaiccellsrepresentthesmallestunitinaphotovoltaicpowerproducingdevice.Wafersizes,andthuscellsizeshaveprogressivelyincreased,asitiscommonlyconsideredbyindustrialactorsasaneasywaytoimprovecellandmoduleswattage.Nowadays,wafersizesrangefrom156,75x156,75squaremm(namedM2)upto210x210squaremm(namedM12).Tothisdate,thereisnostandardinthewafersize.Nevertheless,M10wafers(182x182squaremm)andM12havegainedalotoftractioninthelastyear.Ingeneral,cellscanbeclassifiedaseitherwafer-basedcrystallinesiliconc-Si(mono-andmulti-crystalline),compoundsemiconductor(thin-film),ororganic.Currently,c-Sitechnologiesaccountformorethan95%oftheoverallcellproduction.MonocrystallinePVcells,formedwithwafersmanufacturedusingasinglecrystalgrowthmethod,featurecommercialefficienciesbetween20%and25%(singlejunction).Theyhavegainedthebiggestmarketshareinrecentyears,over85%ofthec-Sishare.Multicrystallinesilicon(mc-Si)cells,alsocalledpolycrystalline,areformedwithmulticrystallinewafers,manufacturedfromacastsolidificationprocess.Theyarestillinproductionduetotheirlowerproductionprices.Nevertheless,theyarelessefficient,withanaverageconversionefficiencyofaround18%-21%inmassproduction(single-junction).Thin-filmcellsareformedbydepositingextremelythinlayersofphotovoltaicsemiconductormaterialsontoabackingmaterialsuchasglass,stainlesssteelorplastic.III-VcompoundsemiconductorPVcellsareformedusingmaterialssuchasGalliumArsenide(GaAs)onGermanium(Ge)substratesandhavehighconversionefficienciesfrom25%upto30%(notconcentrated).Duetotheirhighcost,theyaretypicallyusedinconcentratedPV(CPV)systemswithtrackingsystemsorforspaceapplications.Thin-filmmodulesusedtohavelowerconversionefficienciesthanbasiccrystallinesilicontechnologies,butthishaschangedinrecentyears.Theyarepotentiallylessexpensivetomanufacturethancrystallinecellsthankstothereducednumberofmanufacturingstepsfromrawmaterialstomodules,andtoreducedenergydemand.IEAPVPSTRENDSINPHOTOVOLTAICAPPLICATIONS20226Thin-filmmaterialscommerciallyusedarecadmiumtelluride(CdTe),andcopperindium-(gallium)-diselenide(CIGSandCIS).Amorphous(a-Si)andmicromorphsilicon(μ-Si)usedtohaveasignificantmarketsharebutfailedtofollowboththepriceofcrystallinesiliconcellsandtheefficiencyincreaseofotherthinfilmtechnologies.Organicthin-filmPV(OPV)cellsusedyeororganicsemiconductorsasthelight-harvestingactivelayer.Thistechnologyhascreatedincreasinginterestandresearchoverthelastfewyearsandiscurrentlythefastest-advancingsolartechnology.Despitethelowproductioncosts,stableproductsarenotyetavailableforthemarket,neverthelessdevelopmentanddemonstrationactivitiesareunderway.Tandemcellsbasedonperovskitesareresearchedaswell,witheitheracrystallinesiliconbaseorathinfilmbaseandcouldhitthemarketsoonerthanpureperovskitesproducts.In2021,perovskitesolarcellachieved28,0%efficienciesinsilicon-basedtandemand23,26%efficienciesinCIGS-basedtandems.Photovoltaicmodulesaretypicallyratedfrom290Wto600W,dependingonthetechnologyandthesize.SpecializedproductsforbuildingintegratedPVsystems(BIPV)exist,sometimeswithhighernominalpowerduetotheirlargersizes.CrystallinesiliconmodulesconsistofindividualPVcellsconnectedandencapsulatedbetweenatransparentfront,usuallyglass,andabackingmaterial,usuallyplasticorglass.Thin-filmmodulesencapsulatePVcellsformedintoasinglesubstrate,inaflexibleorfixedmodule,withtransparentplasticorglassasthefrontmaterial.Theirefficiencyrangesbetween9%(OPV),10%(a-Si),17%(CIGSandCIS),19%(CdTe),25%GaAs(non-concentrated)andabove40%forsomeCPVmodules.APVsystemconsistsofoneorseveralPVmodules,connectedtoeitheranelectricitynetwork(grid-connectedPV)ortoaseriesofloads(off-grid).Itcomprisesvariouselectricdevicesaimedatadaptingtheelectricityoutputofthemodule(s)tothestandardsofthenetworkortheload:inverters,chargecontrollersorbatteries.AwiderangeofmountingstructureshasbeendevelopedespeciallyforBIPV;includingPVfacades,slopedandflatroofmountings,integrated(opaqueorsemi-transparent)glass-glassmodulesandPVtiles.Singleortwo-axistrackingsystemshaverecentlybecomemoreandmoreattractiveforground-mountedsystems,particularlyforPVutilizationincountrieswithahighshareofdirectirradiation.Byusingsuchsystems,theenergyyieldcantypicallybeincreasedby10-20%forsingleaxistrackersand20-30%fordoubleaxistrackerscomparedwithfixedsystems.PVAPPLICATIONSANDMARKETSEGMENTSWhenconsideringdistributedPVsystems,itisnecessarytodistinguishBAPV(buildingappliedphotovoltaics)andBIPV(buildingsintegratedphotovoltaics)systems.BAPVreferstoPVsystemsinstalledonanexistingbuildingwhileBIPVimposestoreplaceconventionalbuildingmaterialsbysomewhichincludePVcells.AmongstBIPVsolutions,PVtiles,orPVshingles,aretypicallysmall,rectangularsolarpanelsthatcanbeinstalledalongsideconventionaltilesorslatesusingatraditionalrackingsystemusedforthistypeofbuildingproduct.BIPVproductscantakevariousshapes,coloursandbemanufacturedusingvariousmaterials,althoughavastmajorityuseglassonbothsides.Theycanbeassembledinawaythattheyfillmultiplefunctionsusuallydevotedtoconventionalbuildingenvelopesolutions.BifacialPVmodulescollectlightonbothsidesofthepanel.Dependingonthereflectionofthegroundunderneaththemodules(albedo),theenergyproductionincreaseisestimatedtoamaximumof15%withafixedstructure,andpossiblyupto30-35%withasingle-axissystem.Bifacialmoduleshaveagrowingcompetitiveadvantagedespitehigheroverallinstallationcosts.Indeed,recentcompetitiveprojectsindesertareasboostedthemarketconfidenceinbifacialPVperformanceandproductionlinesareincreasinglymovingtowardsbifacialmodules.Theadditionalfactorsaffectingbifacialperformanceintotheirmodelsarealsobetterunderstoodandintegratedinthedownstreamindustry.BifacialPVpanelshavegainedtractionagainin2021andareexpectedtotakegrowingmarketsharesinthecomingyearsforutility-scaleapplications.PVTECHNOLOGY/CONTINUED7IEAPVPSTRENDSINPHOTOVOLTAICAPPLICATIONS2022FloatingPVsystemsaremountedonastructurethatfloatsonawatersurfaceandcanbeassociatedwithexistinggridconnectionsforinstanceinthecaseofdamvicinity.ThedevelopmentoffloatingPVonman-madewaterareasisasolutiontolandscarcityinhighpopulationdensityareasandcanbecombinedwithhydropower.AgriculturalPVcombinecropsandenergyproductiononthesamesite.Thesharingoflightbetweenthesetwotypesofproductionpotentiallyallowsahighercropyield,dependingontheclimateandtheselectionofthecropvarietyandcanevenbemutuallybeneficialinsomecases,asthewaterwhichevaporatesfromthecropscancontributetoareductionofPVmodulesoperatingtemperature.PVthermalhybridsolarinstallations(PVT)combineasolarmodulewithasolarthermalcollector,therebyconvertingsunlightintoelectricityandcapturingtheremainingwasteheatfromthePVmoduletoproducehotwaterorfeedthecentralheatingsystem.Italsoallowstoreducetheoperatingtemperatureofthemodules,whichbenefitstheglobalperformancesofthesystem.VIPVorvehicleintegratedPV.Theintegrationofsolarcellsintotheshellofthevehiclesallowforemissionsreductionsinthemobilitysector.Thesolarcelltechnologicaldevelopmentsallowtomeetbothaestheticexpectationsforcardesignandtechnicalrequirementssuchaslightweightandresistancetoload.VAPVrelatestotheuseofPVmodulesonvehicleswithoutintegration.VariousSolarHomeSytems(SHS)orpicoPVsystemshaveexperiencedsignificantdevelopmentinthelastfewyears,combiningtheuseofefficientlights(mostlyLEDs)withchargecontrollersandbatteries.WithasmallPVpanelofonlyafewwatts,essentialservicescanbeprovided,suchaslighting,phonechargingandpoweringaradioorasmallcomputer.ExpandableversionsofsolarpicoPVsystemshaveenteredthemarketandenablestartingwithasmallkitandaddingextraloadslater.Theyaremainlyusedforoff-gridbasicelectrification,mainlyindevelopingcountries.GRID-CONNECTEDPVSYSTEMSIngrid-connectedPVsystems,aninverterisusedtoconvertelectricityfromdirectcurrent(DC)asproducedbythePVarraytoalternatingcurrent(AC)thatisthensuppliedtotheelectricitynetwork.Thetypicalweightedconversionefficiencyisintherangeof95%to99%.MostinvertersincorporateaMaximumPowerPointTracker(MPPT),whichcontinuouslyadjuststheloadimpedancetoprovidethemaximumpowerfromthePVarray.Oneinvertercanbeusedforthewholearrayorseparateinvertersmaybeusedforeachstringofmodules.PVmoduleswithintegratedinverters,usuallyreferredtoas“ACmodules”,canbedirectlyconnectedtotheelectricitynetwork(whereapprovedbynetworkoperators),theyofferbetterpartialshadingmanagementandinstallationflexibility.Similarly,micro-inverters,connectedtouptofourpanelsalsoexist,despitetheirhigherinitialcost,theypresentsomeadvantageswherearraysizesaresmallandmaximalperformanceistobeachieved.Grid-connecteddistributedPVsystemsareinstalledtoprovidepowertoagrid-connectedcustomerordirectlytotheelectricitynetwork,morespecificallythedistributionnetwork.Suchsystemsmaybeon,orintegratedinto,thecustomer’spremisesoftenonthedemandsideoftheelectricitymeter,onresidential,commercialorindustrialbuildings,orsimplyinthebuiltenvironmentonmotorwaysound-barriers,etc.Sizeisnotadeterminingfeature–whilea1MWPVsystemonarooftopmaybelargebyPVstandards,thisisnotthecaseforotherformsofdistributedgeneration.Grid-connectedcentralizedPVsystemsperformthefunctionsofcentralizedpowerstations.Thepowersuppliedbysuchasystemisphysicallynotassociatedwithanelectricitycustomer,andthesystemisnotlocatedtospecificallyperformfunctionsontheelectricitynetworkotherthanthesupplyofbulkpower.Thesesystemsaretypicallyground-mountedandfunctioningindependentlyofanynearbydevelopment.HybridsystemscombinetheadvantagesofPVanddieselgeneratorinminigrids.Theyallowmitigatingfuelpriceincreases,deliveroperatingcostreductions,andofferhigherservicequalitythantraditionalsingle-sourcegenerationsystems.Thecombiningoftechnologiesprovidesnewpossibilitiestoprovideareliableandcost-effectivepowersourceinremoteplacessuchasfortelecombasestations.Large-scalehybridscanbeusedforlargecitiespoweredtodaybydieselgeneratorsandhavebeenseen,forinstanceincentralAfrica,oftenincombinationwithbatterystorage.IEAPVPSTRENDSINPHOTOVOLTAICAPPLICATIONS20228OFF-GRIDPVSYSTEMSForoff-gridsystems,astoragebatteryisrequiredtoprovideenergyduringlow-lightperiods.NearlyallbatteriesusedforPVsystemsareofthedeepdischargelead-acidtype.Othertypesofbatteries(e.g.NiCad,NiMH,Li-Ion)arealsosuitableandhavetheadvantagethattheycannotbeoverchargedordeep-discharged.Thelifetimeofabatteryvaries,dependingontheoperatingregimeandconditions,butistypicallybetween5and10yearsevenifprogressesareseeninthatfield.Achargecontroller(orregulator)isusedtomaintainthebatteryatthehighestpossiblestateofcharge(SOC)andprovidetheuserwiththerequiredquantityofelectricitywhileprotectingthebatteryfromdeepdischargeorovercharging.SomechargecontrollersalsohaveintegratedMPPtrackerstomaximizethePVelectricitygenerated.IfthereisarequirementforACelectricity,a“stand-aloneinverter”cansupplyconventionalACappliances.Off-griddomesticsystemsprovideelectricitytohouseholdsandvillagesthatarenotconnectedtotheutilityelectricitynetwork.Theyprovideelectricityforlighting,refrigerationandotherlowpowerloads,havebeeninstalledworldwideandareincreasinglythemostcompetitivetechnologytomeettheenergydemandsofoff-gridcommunities.Off-gridnon-domesticinstallationswerethefirstcommercialapplicationforterrestrialPVsystems.Theyprovidepowerforawiderangeofapplications,suchastelecommunications,waterpumping,vaccinerefrigerationandnavigationalaids.Theseareapplicationswheresmallamountsofelectricityhaveahighvalue,thusmakingPVcommerciallycostcompetitivewithothersmallgeneratingsources.METHODOLOGYFORTHEMAINPVMARKETDEVELOPMENTINDICATORSThisreportcountsallPVinstallations,bothgrid-connectedandreportedoff-gridinstallations.Byconvention,thenumbersreportedrefertothenominalpowerofPVsystemsinstalled.TheseareexpressedinW(orWp).SomecountriesarereportingthepoweroutputofthePVinverter(deviceconvertingDCpowerfromthePVsystemintoACelectricitycompatiblewithstandardelectricitynetworks).ThedifferencebetweenthestandardDCPower(inWp)andtheACpowercanrangefromaslittleas5%(conversionlosses)toasmuchas40%(forinstancesomegridregulationslimitoutputtoaslittleas65%ofthepeakpowerfromthePVsystem,butalsohigherDC/ACratiosreflecttheevolutionofutility-scalePVsystems).ConversionofACdatahasbeenmadewhennecessary,tocalculatethemostpreciseinstallationnumberseveryyear.Globaldatashouldbeconsideredasindicationsratherthanexactstatistics.DatafromcountriesoutsideoftheIEAPVPSnetworkhavebeenobtainedthroughdifferentsources,someofthembasedontradestatistics.AsanincreasingshareoftheglobalinstalledPVcapacityisattainingacertainlifetime-theveryfirstwavesofinstallationsdatingbacktothenineties-performancelossesanddecommissioningmustbeconsideredtocalculatethePVcapacityandPVproduction.Forthisreport,thePVpenetrationwasestimatedwiththemostrecentglobaldataaboutthePVinstalledcapacity,theaveragetheoreticalPVproductionandtheelectricitydemandbased.Ingeneral,PVpenetrationisamongstoneofthebestindicatorstoreflectthemarketdynamicsinaspecificcountryorregion.IfaglobalPVpenetrationleveldoesnotreflecttheregionaldisparities,itgivesanindicationabouttheabilityofthetechnologytokeepupwiththeglobaldemandgrowth.Hence,regardingclimategoalsforinstance,thePVpenetrationisabetterindicatorthantheabsolutemarketgrowth.PVAPPLICATIONSANDMARKETSEGMENTS/CONTINUED9IEAPVPSTRENDSINPHOTOVOLTAICAPPLICATIONS2022twoPVMARKETDEVELOPMENTTRENDSSincetheearlybeginningsofthePVmarketdevelopment,over945,4GWofPVplantshavebeeninstalledglobally,ofwhicharound70%hasbeeninstalledinthepastfiveyears.Overtheyears,agrowingnumberofmarketshavestartedtocontributetoglobalPVinstallations,andtheyear2021closedwitharecordnumberofnewcountriesinstallingsignificantPVnumbers.AlargemajorityofPVinstallationsaregrid-connectedandincludeaninverterwhichconvertsthevariabledirectcurrent(DC)outputofsolarmodulesintoalternatingcurrent(AC)tobeinjectedintotheelectricalgrid.PVinstallationdataisreportedinDCbydefaultinthisreport(seealsoChapter1).WhencountriesarereportingofficiallyinAC,thisreportconvertsinDCtomaintaincoherency.WhenofficialreportingisinAC,announcedcapacitiesarementionedasMWacorMWdcinthisreport.Bydefault,MWimpliescapacitiesmentionedinDC.FormoreinformationonregisteringPVinstallations,downloadtheIEAPVPSreportonregisteringPVinstallationspublishedrecently.GlobalPVinstalledcapacity(GW)+22%YoYgrowthDownloadthe“dataModelforPVSystem”reports:THEGLOBALPVINSTALLEDCAPACITYAttheendof2021,theglobalPVinstalledcapacityrepresented945,4GWofcumulativePVinstallations.Presentlyitappearsthat173,5GWrepresentedtheminimumcapacityinstalledduring2021withareasonablyfirmlevelofcertainty.ThislevelisthehighesteverrecordedforPVinstallations,despitethepandemicrelatedperturbationswhichhavedelayedmarketdevelopmentinseveralcountries.Therealimpactofthepandemicisdifficulttoestimate,sincethedelaysobservedinthefirstpartoftheyearweresometimescompensatedinthesecondpart.However,itseemsreasonablethatmanyprojectsmighthavebeendelayed.Inaddition,pricesincreasedandlogisticissuespossiblyreducedtheinstallationsinthelastpartoftheyear2021.Hencethemarketresultscouldhaveprobablybeenevenhigher,reflectingthesectormood.ThegroupofIEAPVPScountriesrepresented753GWoftheglobalinstalledcapacity.TheIEAPVPSparticipatingcountriesin2021areAustralia,Austria,Belgium,Canada,Chile,China,Denmark,Finland,France,Germany,Israel,Italy,Japan,Korea,Malaysia,PhotobyDenisSchroeder,NREL55200IEAPVPSTRENDSINPHOTOVOLTAICAPPLICATIONS202210Mexico,Morocco,theNetherlands,Norway,Portugal,SouthAfrica,Spain,Sweden,Switzerland,Thailand,Turkey,andtheUnitedStatesofAmerica.TheotherkeymarketsthathavebeenconsideredandwhicharenotpartoftheIEAPVPSProgramme,representedatotalcumulativecapacityof154,3GWattheendof2021.Amongstthem,Indiacoveredaroundonethirdofthatcapacitywith61GW.Vietnamreached18,4GWafterthreeyearsofimportantPVdevelopment(inparticularover11GWinstalledin2020).TheremainingpartofPVcapacitiesismainlylocatedinEurope,andpartlyrelatedtohistoricalinstallationsaswellastothecontributionofemergingmarkets:UKwith14,6GW,Polandwith7,7GW,Ukrainewithover6GW,Greecewith5GW,theCzechRepublicwith2,0GWinstalled,Romaniawith1,6GW,andBulgariaalmost1,3GW.Theothermajorcountriesthataccountedforthehighestcumulativeinstallationsattheendof2021andthatarenotpartoftheIEAPVPSprogrammeare:Brazilwith13,7GW,andTaiwanwith7,7GW.NumerouscountriesallovertheworldhavestartedtodeployPV,butfewhaveyetreachedasignificantdevelopmentlevelintermsofcumulativeinstalledcapacityoutsidetheonesmentionedabove.NewdevelopmentsoccurredinAfrica(Egypt,SouthAfrica)andintheMiddleEast(UAE)whichledtoGW-scaleinstallationlevels:4,6GWinSouthAfrica,3,5GWintheUAEand3,4inEgyptforinstance.FIGURE2.1:EVOLUTIONOFCUMULATIVEPVINSTALLATIONSGWIEAPVPScountriesOthercountries010020030040050060070080090010002021202020192018201720162015201420132012201171,0100,8138,6178,7228,2306,0408,9513,5626,4771,8945,4SOURCEIEAPVPS&OTHERSPVPENETRATIONPERCAPITAInjustafewyears,AustraliahasreachedthehighestinstalledPVcapacityperinhabitantwith1011W/capinIEA-PVPSandsurveyedcountries.TheNetherlandsissecondwith818W/cap.Germanycomesnextwith718W/capfollowedbyJapanwith622W/capandBelgiumwith620W/cap.SwitzerlandandKoreanearlytiedatthe6thplacewithrespectively422W/capand416W/cap.Denmark(399W/cap)andSpain(396W/cap)comenext.ItalyandtheUSAareclosingthetop10(amongIEAPVPScountries)with374and371W/cap.Asacomparison,500WrepresentsthepowerofalargePVmodule,onecansaythatinsomecountriesonemoduleperpersonhavebeeninstalled.AustraliahasreachedthehighestinstalledPVcapacityperinhabitantwith1011W/cap.THEGLOBALPVINSTALLEDCAPACITY/CONTINUED11IEAPVPSTRENDSINPHOTOVOLTAICAPPLICATIONS2022EVOLUTIONOFPVANNUALINSTALLATIONSFIGURE2.2:PVPENETRATIONPERCAPITAIN202110110orNAPVpenetration(Wp/capita)506SOURCEIEAPVPS&OTHERSFIGURE2.3:EVOLUTIONOFANNUALPVINSTALLATIONSGW0204060801001201401601802002021202020192018201720162015201420132012201131,529,837,840,150,576,8102,9104,6112,9145,5173,5JapanUSAOthercountriesOtherIEAPVPScountriesChinaIndiaEuropeanUnionSOURCEIEAPVPS&OTHERSIEAPVPSTRENDSINPHOTOVOLTAICAPPLICATIONS202212TheIEAPVPScountriesinstalledatleast129GWin2021.Whiletheyaremoredifficulttotrackwithahighlevelofcertainty,installationsinnon-IEAPVPScountriescontributedanestimatedamountof44GW.Thenoteworthytrendof2021istheimportantyearonyeargrowthforthesecondyearinarow,oftheglobalPVmarketdespitethesupplychainturmoilwhichcouldhavepausedordelayedmarketdevelopmentinsomecountries.Asin2020,theriseofemergingmarketsinadditiontothegrowthofkeymarketscontributedtothismarketgrowthin2021.Fortheninthyearinarow,Chinawasinthefirstplaceandinstalledalmost55GWin2021,accordingtoChina’sNationalEnergyAdministration;aninstallationlevelthatsurpassedthelevelreachedinthecountryin2017(52,8GW).ThetotalinstalledcapacityinChinareached308,5GW,andbythatthecountrykeptitsmarketleaderpositionintermsoftotalinstalledcapacity.TheChinesemarketrepresented31%oftheglobalinstallationin2021.AnnualPVinstallations(GW)+19%YoYgrowthSecondwastheEuropeanUnion,whichexperiencedgrowthforthethirdyearinarowwith28,7GW,whichexceedsthe23,2GWrecordedin2011.Germany(5,8GW)andSpain(4,9GW)werethekeymarketsthisyearfollowedbyPoland(3,7GW),theNetherlands(3,6GW)andFrance(3,4GW)andseveralothers.ThirdwastheUnitedStateswith26,9GWinstalled,markingasignificantgrowthagaincomparedtothepreviousyearmaking2021thelargestsingleyearincreaseininstallationsintheU.S.Boththeutilitysectorinstallationsandtheresidentialmarketincreasedover2020installationlevels.Attheendof2021,theU.S.reached123GWofcumulativeinstalledcapacity.Indiawasinfourthplacewith13,7GWinstalled,bringingbacktheannualmarkettolevelsclosetothoseobservedin2017,2018and2019.TheofficialnumberhasbeenrecalculatedbasedonofficialACdatausingIEAPVPSassumptionsonAC-DCratio.ThemarketinJapancontractedslightlywith6,6GWin2021,itslowestlevelsince2012.FIGURE2.4:EVOLUTIONOFMARKETSHAREOFTOPCOUNTRIES02040608010020212020201920182017201620152014201320122011stekraMVPlabolG01poTtekraMVPlabolGts1stekraMVPlabolG5poT%19%28%28%27%30%45%52%42%27%33%48%69%71%77%78%83%85%72%58%64%57%86%85%88%88%90%91%85%76%78%32%62%76%SOURCEIEAPVPS&OTHERSTHEGLOBALPVINSTALLEDCAPACITY/CONTINUED13IEAPVPSTRENDSINPHOTOVOLTAICAPPLICATIONS2022Together,thesefiveleadingindividualorblockofcountriesrepresentedaround75%ofallinstallationsrecordedin2021,thesamelevelasin2020.Intermsofcumulativeinstalledcapacity,thesecountriesrepresent76%oftheglobalcapacity.ThisshowsthattheglobalPVmarketconcentrationisagainincreasing,withnewmarketscontributingproportionallylesstoglobalinstallationnumbersthanestablishedones.Behindthetop5,Brazilinstalled5,7GWleadingtoacumulativemarketof13,7GWin2021.AfteryearsoflimitedPVmarketdevelopment,Brazilappearsnowasoneofthekeyglobalplayers,demonstratingitsmuchhigherpotentialthanthelevelsreacheduntilnow.Australiainstalled4,9GWin2021,astablelevelsince2018andatremendouslevelgiventhecountry’spopulation.Forseveralyearsthecountryhasbeenexperiencingaboominutility-scaleapplicationstogetherwitharobustdemandfordistributedPVsystems.ThetotalinstalledPVcapacityreached26GWattheendof2021.Koreainstalled4,2GWin2021withanimportantshareofutility-scaleplants,aslightdecreasecomparedto2020whenthehighestlevelofinstallationseverinthecountrywasrecorded.KoreaisonekeyindustrialactorinthePVsector,withseveralkeyplayerssuchasHanwhaandOCI.Chile’spositioninthetop10countriesforPVinstallationscomesfrom2,7GWinstalledin2021,markingatremendousboominPVmarketdevelopmentinthecountry.InthetenthpositioncomesVietnamwherePVinstallationssignificantlydecreasedafterthemassivegrowthobservedin2020.Intotalaround2GWwereinstalled.Together,these10marketscoveraround76%ofthe2021annualworldmarket,asignthatthegrowthoftheglobalPVmarkethasbeendrivenbyalimitednumberofcountriesagain,andthiseveniftheremainingmarketsarestartingtocontributemoresignificantly.Marketconcentrationhasbeenfuellingfearsforthemarket’sstabilityinthepast,ifoneofthetopthreeortopfivemarketswouldexperienceaslowdown.AsshowninFigure2.4,themarketconcentrationsteadilydecreasedin2019beforegrowingagainin2020andstabilisingin2021,mostlyduetothegrowthoftheChinesePVmarket.Asnewmarketsarestartingtoemerge,theversatilityoftheglobalPVmarketminusChinareduces,andthereforetherisks.However,thesizeoftheChinesePVmarketcontinuestoshapetheevolutionofthePVmarketasawhole.Aswehaveseenin2019,theglobalgrowthwaslimitedduetothedeclineofthefirstmarket,whichalmostwipedouttheglobalgrowth,whilein2021,China’sinstallationsmaximizedtheglobalgrowth.Thelevelofinstallationsrequiredtobeincludedinthetop10(countrywise)hasincreasedsteadilysince2014:from0,78GWto1,6GWin2018,andaround3,5GWin2020and2021.ThisreflectstheglobalgrowthtrendofthesolarPVmarket,butalsoitsvariationsfromoneyeartoanother.ConsideringtheEuropeanUnion(amemberoftheIEAPVPS)asoneentityratherthanacollectionofmarketsisaneditorialchoiceofthewriters.ConsideringtheEuropeanPVMarketsseparately,Germanywouldrankfifth,SpaineighthandPolandtenth.Thisdoesn’tchangethegeneralconclusionsofthischapter;thetenfirstcountrieswouldcover76%oftheglobalPVmarket.TABLE2.1:EVOLUTIONOFTOP10MARKETSRANKING201120122013201420152016201720182019202020211ITALYGERMANYCHINACHINACHINACHINACHINACHINACHINACHINACHINA2GERMANYITALYJAPANJAPANJAPANUSAINDIAINDIAUSAUSAUSA3CHINACHINAUSAUSAUSAJAPANUSAUSAINDIAVIETNAMINDIA4USAUSAGERMANYUKUKINDIAJAPANJAPANJAPANJAPANJAPAN5FRANCEJAPANITALYGERMANYINDIAUKTURKEYAUSTRALIAVIETNAMGERMANYGERMANY6JAPANFRANCEUKSOUTHAFRICAGERMANYGERMANYGERMANYTURKEYAUSTRALIAAUSTRALIABRAZIL7BELGIUMAUSTRALIAROMANIAFRANCEKOREATHAILANDKOREAGERMANYSPAINKOREAAUSTRALIA8UKINDIAINDIAKOREAAUSTRALIAKOREAAUSTRALIAMEXICOGERMANYINDIASPAIN9AUSTRALIAGREECEGREECEAUSTRALIAFRANCEAUSTRALIABRAZILKOREAUKRAINESPAINKOREA10GREECEBULGARIAAUSTRALIAINDIACANADATURKEYUKNETHERLANDSKOREANETHERLANDSPOLANDRANKINGEU11233454222MARKETLEVELTOACCESSTHETOP10426MW843MW792MW779MW675MW818MW944MW1621MW3130MW3492MW3710MWIEAPVPSTRENDSINPHOTOVOLTAICAPPLICATIONS202214OthercountriesthatinstalledseveralGWinthelastyearsorwerefoundinthetop10countries,didn’tsucceedinmaintainingasufficientlyhighlevelofinstallationstostayintherankings:Mexico,Turkey,Franceandmanyothercountries.TheversatilityofthemarketsisafeatureofthePVindustrythat,fromitsinception,hadtodealwithchangesinpoliciesandthereforeinmarketdevelopment.ThisislevelizingprogressivelywithPVreachingcompetitivenessfasterthanmanyexpected.AfterhavingreachedGW-scaleinstallationsin2019and2020,PVdeploymentdeclinedinEgyptin2021,with300MWinstalled.IntheUAE,almost700MWcameonlinein2021throughlarge-scaletenders,amongstthemostcompetitiveglobally.Self-consumptionpoliciesdidn’tcontributemuchbutcouldrepresentacomplementarydriverinthenearfuture.Mexico’sannualinstallationsmaintainedtheir2020levelwith1,6GWin2021,inacomplexpolicyenvironment,whichmightputthebrakesonitsmarketinthecomingyears.Asdetailedabove,theIEAPVPSchoiceconsistsinreportingDCcapacities.AnestimateofACcapacitieswouldputthenewinstalledcapacitiesnumberaround129GWin2021.Thisnumber(inthesamewayastheDCnumber)isanapproximationoftherealityandrepresentsanestimatedvalueofthemaximumpowerthatallPVsystemsgloballycouldgenerateinstantaneously,assumingtheywouldallproduceatthesametime.Thisnumberisindicativeandshouldinnocasebeusedforenergyproductioncalculation.FIGURE2.5:GLOBALPVMARKETIN2021CHINA,31,64%OTHERCOUNTRIES,24,37%USA,15,49%JAPAN,3,77%GERMANY,3,32%AUSTRALIA,2,85%SOUTHKOREA,2,44%INDIA,7,87%SPAIN,2,82%BRAZIL,3,29%POLAND,2,14%SOURCEIEAPVPS,RTSCORPORATIONFIGURE2.6:CUMULATIVEPVCAPACITYEND2021SOURCEIEAPVPS,RTSCORPORATIONCHINA,32,62%OTHERCOUNTRIES,21,99%USA,13,01%JAPAN,8,29%GERMANY,6,31%AUSTRALIA,2,75%SOUTHKOREA,2,28%INDIA,6,45%SPAIN,1,96%VIETNAM,1,95%ITALY,2,39%Othercountriesreachedsignificantinstallationlevelsin2021:Around3,7GWofPVinstallationswereaddedinPolandin2021,mostlyassmalldistributedinstallations.3,6GWwereinstalledintheNetherlands,3,4GWinFrancemarkingasignificantgrowthcomparedtopreviousyearandalso1,9GWinTaiwan,1,5GWinTurkeyand1,2GWinGreece.OthercountriesthatinstalledsignificantamountsofPVbutbelowtheGWmark,wereIsrael(940MW),Italy(944MW),Belgium(850MW),Hungary(800MW),Austria(740MW),theUK(730MW)andDenmark(720MW).ThemarketuptakeintheEuropeanUnionmakesitthesecondlargestmarketglobally.ThetotalinstalledcapacityinmostsurveyedcountriestakesdecommissioningofPVplantsintoaccount.Whilesuchnumbersremainrelativelylimitedforthetimebeing,theystarttoimpactnumbersataverylowlevel,whichcanleadtodiscrepanciesinnationalstatisticsofseveralIEAPVPScountries.Off-gridnumbersaredifficulttotrackandmostnumbersareestimates.Changes(includingrepowering)anddecommissioningarehigherfortheseapplicationsthaninothersegmentsandcanleadtonumericalglitches.Inthisreport,globalannualinstallationsandthecumulativecapacityarecomputedbasedonavarietyofsourcesandcould,despitesallefforts,differfromotherpublications.Thedevelopmentinmanynon-IEAcountriesisanestimate,duetothelackofofficialstatisticsinnumerouscountries.THEGLOBALPVINSTALLEDCAPACITY/CONTINUED15IEAPVPSTRENDSINPHOTOVOLTAICAPPLICATIONS20220100200300400500600700800900100020212020201920182017201620152014201320122011GWRestoftheWorldMiddleEast&AfricaAsia-PacificTheAmericasEuropeFIGURE2.7:EVOLUTIONOFREGIONALPVINSTALLATIONSSOURCEIEAPVPS&OTHERS010020030040050060070080090010002021202020192018GWJapanUSAOthercountriesOtherIEAPVPScountriesChinaIndiaEuropeanUnionFIGURE2.8:2018-2021GROWTHPERREGIONSOURCEIEAPVPS&OTHERSIEAPVPSTRENDSINPHOTOVOLTAICAPPLICATIONS202216PVMARKETSEGMENTSSolarPVexperiencedanothergrowthyearmainlydrivenbyutility-scaleprojectswhichcontinuedtodevelopfastbothinestablishedmarketsandincountrieswhichonlyappearedrecentlyonthePVdevelopmentmap.Althoughtheroleofdistributedgenerationshouldnotbeunderestimated,utility-scalePVislikelytokeepdominatingelectricitygenerationinmanycountries.Themainreasonisthateconomiesofscaleoutweighthesavingsintransmissioncostsandtheself-consumptionpossibilitiesbroughtbyembeddedinstallations.Groundmountedutility-scalePVinstallationsincreasedin2021withmorethan95GW,comparedto86GWin2020and71GWin2019.However,theshareofutility-scalestillrepresentedaround55%ofcumulativeinstalledcapacitybecausedistributedPValsogrewsignificantly,upto78GWin2021comparedto59GWin2020.Off-gridandedge-of-the-gridapplicationsareincreasinglyintegratedinthesetwolargecategories.UTILITY-SCALEPV:THEPVMARKETDRIVINGFORCEUtility-scalePVplantsareingeneralground-mounted(orfloating)installations.Insomecases,theycouldbeusedforself-consumptionwhenclosetolargeconsumptioncentresorindustries,butgenerallytheyfeedelectricitydirectlyintothegrid.Duetothesimplicityofsettinguppoliciestodevelopthem,withorwithouttenders,utility-scaleapplicationsarethrivinginnewPVmarkets.Morecountriesareproposingtenderingprocessestoselectthemostcompetitiveprojects.MerchantPV,wherePVelectricityisdirectlysoldtoelectricitymarketsor(C-)PPAs,whereitisdirectlysoldto(corporate)consumersisexperiencinggrowthinnumerouscountries,butthismarketdriverremainslimitedsofar.Oneofthekeytrendsof2021isthewiderdevelopmentofutility-scaleplantswithoutfinancialincentives(onwholesaleelectricitymarketsorfromprivatecustomers).Suchdevelopmentismostlyindependentfromfinancialincentivesandthereforepolicydecisions,whichmakesitspotentialvirtuallyunlimited.Limitationsarealreadyseenduetogridcongestioninsomeplaces:thishasmodifiedthetenderingapproacheswhichmightleadtobiddingatthelowestpossiblecosttosecureagridconnection.ThishasbeenseeninPortugalforinstance.Newutility-scalePVplantsareincreasinglyusingtrackerstomaximiseproductionandinparallel,theuseofbifacialPVmodulesincreasesrelativelyfastaswell.Theadditionofstoragesystemsalsobecomesatrendinsomecountries,eitherpushedbyspecificrulesintendersorbythewillingnesstobetterservethewholesaleandgridservicesmarkets.In2021,utility-scaleplantsamountedto95GWgloballyandthetotalinstalledcapacityforalloftheseapplicationsamountedto534GW;or56%ofthecumulativeinstalledcapacity.TABLE2.2:TOP10COUNTRIESFORCENTRALIZEDPVINSTALLEDIN2021COUNTRYGWCHINA25,60USA20,26INDIA11,62SOUTHKOREA4,00SPAIN3,50JAPAN2,99NETHERLANDS2,35FRANCE2,22GERMANY2,01AUSTRALIA1,71SOURCEIEAPVPSTABLE2.3:TOP10COUNTRIESFORCUMULATIVECENTRALIZEDPVINSTALLEDCAPACITYIN2021COUNTRYGWCHINA199,94USA80,33INDIA52,90JAPAN30,12SOUTHKOREA18,91SPAIN15,23GERMANY11,10AUSTRALIA9,00NETHERLANDS8,49UK8,35SOURCEIEAPVPS17IEAPVPSTRENDSINPHOTOVOLTAICAPPLICATIONS2022PROSUMERS,EMPOWERINGCONSUMERSProsumersareconsumersproducingpartoftheirownelectricityconsumption.Historicallydrivenbysimplefinancialincentivessuchasnet-metering,prosumerssegmentsincreasinglydevelopthankstovariousschemesbasedontheconceptofself-consumption.Indeed,thenewgenerationofsolarschemesisoftenmakingthedistinctionbetweentheelectricityconsumedandtheelectricityinjectedintothegrid,therebyincentivizingself-consumption.Animportantfactorinthesuccessofself-consumptionschemesistheretailelectricitypricewhichisstillbeingmaintainedartificiallylowinsomecountries.SubsidiesforfossilfuelsarestillarealityandreducetheattractivenessofsolarPVinstallations,alsoinmarketsegmentsinvolvingself-consumption.Conversely,thePVmarkettendstogrowquicklywhenelectricitypricesincrease.Overall,thereisatrendtowardself-consumptionofPVelectricityinmostofcountries,oftenwithadequateregulationsofferingavaluefortheexcesselectricity.ThiscanbedonewithaFiT,afeed-in-premiumaddedtothespotmarketpriceormorecomplexnet-billing.Unfortunately,themovetowardspureself-consumptionschemescancreatetemporarymarketslowdowns,especiallyifthetransitionisabrupt.However,ifthemarketconditionsarefavourableandthemarketregainsconfidence,self-consumptioncanbecomeamarketdriver.FIGURE2.9:CENTRALIZEDPVINSTALLEDCAPACITYPERREGION20210102030405060TheAmericasMiddleEastandAfricaEuropeAsiaPacificGWFIGURE2.10:CENTRALIZEDPVCUMULATIVEINSTALLEDCAPACITYPERREGION2021050100150200250300350TheAmericasMiddleEastandAfricaEuropeAsiaPacificGWSOURCEIEAPVPS&OTHERSSOURCEIEAPVPS&OTHERSThedistributedmarkethasbeenoscillatingaround16-19GWfrom2011to2016,untilChinasucceededindevelopingitsowndistributedmarket:itallowedthedistributedPVmarkettogrowsignificantlytomorethan36GWgloballyin2017to78GWin2021.Severalcountriespromotecollectiveanddistributedself-consumptionasanewmodelforresidentialandcommercialelectricitycustomers.Thismodelallowsdifferentconsumerslocatedinthesamebuildingorprivatearea(collectiveself-consumption),orinthesamegeographicalareawhichrequirestousethepublicgrid(distributedorvirtualordelocalizedself-consumption),tosharetheself-generatedelectricity,therebyunlockingaccesstoself-consumptionforawiderangeofconsumers.Suchregulation,ifwellimplemented,willallowdevelopmentofnewbusinessmodelsforprosumers,creatingjobsandlocaladdedvaluewhilereducingthepriceofelectricityforconsumersandenergycommunities.ThesemodelsofproductioncouldalsopositivelyimpactgridintegrationofPVsystemsbyenhancingadequacybetweenproductionanddemand.Inthecaseof“virtual(ordistributed)self-consumption”,theprosumersarenotgroupedbehindameter.Wewillcall“virtual(ordistributedordelocalized)self-consumption”,thecasewhereproductionandconsumptioncanbecompensatedatacertaindistance,whilepayingafairsharetocoverthegridcosts.IEAPVPSTRENDSINPHOTOVOLTAICAPPLICATIONS202218FIGURE2.11:DISTRIBUTEDPVINSTALLEDCAPACITYPERREGION2021051015202530354045TheAmericasMiddleEastandAfricaEuropeAsiaPacificGWFIGURE2.12:DISTRIBUTEDPVCUMULATIVEINSTALLEDCAPACITYPERREGION2021050100150200250TheAmericasMiddleEastandAfricaEuropeAsiaPacificGWSOURCEIEAPVPS&OTHERSSOURCEIEAPVPS&OTHERSTABLE2.4:TOP10COUNTRIESFORDISTRIBUTEDPVINSTALLEDIN2021COUNTRYGWCHINA29,28USA6,62BRAZIL4,16GERMANY3,75JAPAN3,55AUSTRALIA3,20POLAND2,90INDIA2,04TAIWAN1,59SPAIN1,40SOURCEIEAPVPSTABLE2.5:TOP10COUNTRIESFORCUMULATIVEDISTRIBUTEDPVINSTALLEDCAPACITYIN2021COUNTRYGWCHINA108,22GERMANY48,56JAPAN48,11USA42,68AUSTRALIA16,68ITALY14,55VIETNAM10,46TURKEY9,73BRAZIL9,08FRANCE8,70SOURCEIEAPVPSPVMARKETSEGMENTS/CONTINUED19IEAPVPSTRENDSINPHOTOVOLTAICAPPLICATIONS2022EMERGINGPVMARKETSEGMENTSGlobally,centralizedPVcontinuedtorepresent56%ofthemarketin2021,mainlydrivenbyChina,theUSA,andemergingPVmarkets.Inthesametrendasinpreviousyears,2021sawagainsomenewrecordsintermsofPVelectricitypricesthroughextremelycompetitivetenders.AlthoughrenewedcompetitiveFIGURE2.13:ANNUALSHAREOFCENTRALIZEDANDDISTRIBUTEDGRID-CONNECTEDINSTALLATIONS2011–2021%02040608010020212020201920182017201620152014201320122011Grid-connectedcentralizedGrid-connecteddistributedSOURCEIEAPVPS&OTHERSFIGURE2.14:CUMULATIVESHAREOFGRIDCONNECTEDPVINSTALLATIONS2011–2021%02040608010020212020201920182017201620152014201320122011Grid-connectedcentralizedGrid-connecteddistributedSOURCEIEAPVPS&OTHERStenderscontributedtotheutility-scalemarket,distributedPValsoincreasedsignificantlyin2021,witharound78GWinstalled;with29,3GWfromChinaalone.Remarkably,thedistributedsegmenttookoffintheMiddleEastduetoadequatepoliciesinIsraelandJordan.IEAPVPSTRENDSINPHOTOVOLTAICAPPLICATIONS202220WiththeexceptionoftheEuropeanmarketwhichincentivizedresidentialsegmentsfromthestart,initiallymostofthemajorPVdevelopmentsinemergingPVmarketsarecomingfromutility-scalePV.Thisevolutionhaddifferentcauses.Utility-scalePVrequiresdevelopersandfinancinginstitutionstosetupplantsinarelativelyshorttime.ThisoptionallowsthestartofusingPVelectricityinacountryfasterthanwhatdistributedPVrequires.Moreover,tendersaremakingPVelectricityevenmoreattractiveinsomeregions.However,bothtrendsarecompatibleassomepolicieswereimplementedrecentlyinemergingmarketstoincentivizerooftopinstallationsandtendersforrooftopinstallationsarebeingorganizedinseveralhistoricalmarkets.FLOATINGPV:AGROWINGMARKETSEGMENTTheinstalledcapacityofFloatingPV(FPV)systemsworldwidehassurpassed3GWpin2021,accordingtodatafromtheSolarEnergyResearchInstituteofSingapore(SERIS)attheNationalUniversityofSingapore(NUS).SERISmaintainsaglobaldatabaseofcloseto700projectsinoperationandmorethan300projectsunderplanning,development,orconstruction.ApartfromsomeinstallationsinEurope,especiallyintheNetherlands,France,andtheUK,FloatingSolarissofarmostlylocatedinAsiawithmorethan85%deployedinEastandSouth-EastAsia.Indenselypopulatedareastheproximityofwaterbodiestoloadcentersisoftenanadvantage.Traditionalland-basedsolarsystemsfaceeithercompetinguseswithindustrial,oragriculturalactivitiesormaynotbeeconomicallyviableduetohighcostofland.ThisisalsowhyJapanwasoneoftheearlyadoptersofFloatingPVandstillhasthehighestnumberofFPVprojects(~200).FloatingPVisevenpossibleincitystatessuchasSingapore,whichinaugurateda60MWpFPVplantinJune2021andhascalledforastudyforanother140MWp.ThehighestinstalledFPVcapacityto-dateisdeployedinChina(atotalof1,3GWp)wheredeveloperslargelytookadvantageofwaterbodiesthatwerecreatedwhenformercoalminesfilled-upwithgroundwater.Theseso-calledsubsidenceareasarealmostidealastheyareconsideredasunstableterritories(hencenotsuitableforindustrialoragriculturalactivities)andoftenhavelittlebioactivities(leadingtominimalenvironmentalimpacts).AnothergreatopportunityforFloatingSolaristhecombinationwithexistinghydropowerdams.Thisisevenmoresowhenconjointlyoperatingthesolarandhydropowergeneration(ratherthanpurecolocationoftheFPVplantonthereservoir).Apartfromthediurnalcycle(i.e.,generatingsolarpowerduringthedayandsavingwaterforhydropowergenerationatnight),thereisalsoapossibleseasonalbenefitinareaswithdryandwetseasons.Dependingontheturbinesandtheirreactiontimes,itisalsopossibletocloudsomeoftheshort-termvariabilityfromsolar(duetocouldmovements)andhenceusethereservoirsasa“giantbattery”.ManyoftheannouncedFloatingSolarprojectsareonhydropowerreservoirs,forexampleinThailand(3,5GWp),Korea(2,1GWp)andLaos(1,2GWp).Anotherareaofincreasinginterestarenear-shoreandoff-shoremarinefloatingPVprojects.Suchprojectswillseeadditionalchallengesbutalsoalmostendlessopportunities.Thechallengesarethemuchmoredemandingenvironments,wheretidalcurrents,richermarinelife,wind,wavesandthepresenceofsaltwaterallneedtobeconsidered.Buttheopportunitiesinnear-shoreareasaloneareenormous:significantunusedspacecanbeactivatedforenergyharvestingclosetoloadcentersincoastalsettlementsandharbours.Goingfurtheroff-shoreaggravatesthechallengesandcostbutstillhaspossibleapplications,especiallyforpoweringoil&gasplatformsorforutilisingthevastoceanspacesbetweenthetowersinoff-shorewindfarms.Inthosecases,theFPVprojectwouldtakeadvantageoftheexistingtransmissioninfrastructureandalsoofthefactthatsolarandwindgenerationareoftencomplementaryintheirresourceavailability.ThefirstsuchtestbedsarebeingsetupintheNetherlandsandBelgium.Intermsoffloatingstructures,thevastmajorityoftheFPVinstallationsinoperationuseHDPEplasticfloats,forwhichCiel&TerreandSungrowtogetherhavemorethan50%marketshare.Thereisanincreasingnumberofplayers,however,whichfollowdifferentdesigns,rangingfromacombinationoffloatsandmetalstructures(e.g.Zimmermann)tomembranesthatareheldinplacebylargeplasticrings(e.g.OceanSun).Foroff-shoreapplications,morerobustdesignsarebeingtest-bedded,forexamplebyOceansofEnergyorSolarDuck.AGRI-PV:DUALUSEISEXPECTEDTOEMERGEFASTThedevelopmentofPVonagriculturallandhadexistedsincethebeginningofutility-scalePVbut,insomecases,cropshavebeenreplacedbyphotovoltaicsandthustheuselandwasmostlyshiftedfromagriculturetowardselectricityproduction.Agri-PVproposesadifferentperspectivewiththepossibilitytouselandforbothpurpose:foodandenergyproduction.WithhigherPVpenetrationrates,competitionforlandcanlimitPVdevelopmentinacertainnumberofcountries.Dualuseoflandisanoptiondeeplyinvestigatedaroundtheworldtoaddressthistopic.EMERGINGPVMARKETSEGMENTS/CONTINUED21IEAPVPSTRENDSINPHOTOVOLTAICAPPLICATIONS2022PVpotentialonagriculturallandandhowitcancontributetoachievingrenewableenergytargetshavebeenhighlightedinsomeregions,andinterestbutalsoreluctanceincreased.Ononehandtheagri-PVmarketpotentialisunsurpassed.Anexampleofthepotentialrelativeweightofthissegment,inJapanamappingofallagriculturallandsuitableforPVconcludedthatjust10%couldhold440GWofPV,while6,5GWhavebeeninstalledin2021forallthesegmentsreaching78,2GWcumulativeinstalledcapacity.SouthKorea’sperspectiveofagri-PVdevelopmentis10GWin2030,whichishalfofthecumulativeinstalledcapacityattheendof2021(21,5GW).InFrance,between5and10GWcouldbeinstalledusing0,1%oftheagriculturalland(agriculturallandcovershalfoftheFrenchterritory)whileannualinstallationsachieved3,4GWin2021.Thepotentialof1%oftheEuropeanUnion’sagriculturallandshadbeencalculatedat410GWwhile29,3GWwereinstalledintheEuropeanUnioninstalledin2021.EvenifPVpotentialishuge,otherstrongconsiderationsmustbetakenintoaccount.Foodproductionsecurityandsufficiencyarethefirstpriority.Thevariouscrisesin2020and2021highlightedhowcrucialtheseaspectsare.Theagriculturalsector’seconomicbalance,environmentalevaluation,socialacceptanceandwatermanagementmustbeassessedandshapefutureregulationstoensuresustainabledevelopment.FollowingpioneercountriessuchasJapan,where“solarsharing”hasbeendefinedsince2003,andreferstoPVinstallationabove2mwhere80%ofagriculturalyieldsaremaintained,France,GermanyandItalyhavepublishedframeworksorguidelinesin2022.Cross-sectorialgroupshavebeenworkingonframeworks.Defining“agrivoltaic”,or“agrovoltaic”,“agri-PV”ischallengingbutatrendisclear:noteveryPVinstallationsetupinanagriculturalenvironmentisconsideredanagrivoltaicinstallation,andmostexistingplantsonagriculturallandcouldhardlyqualifyassuch.Alongthepublicationsofthedifferentframeworksandsupportmechanisms,inmostcountriesagriPVorPVinagriculturallandissegmented:•PVsystemsabovethecropsorplants.Thesystemallowsraisingdifferentkindsofcropswithreducedsolarinsolation,allowingbetterdevelopmentinsunnyregions,andpossiblynewbusinessmodels-suchasrecoveryofdamagedcropsforinstance-orgrowingdifferentcropsthatwouldnothavebeenprofitableinsomeregions.ThisdualuseimposesadifferentkindofPVsystems,whichcaninsomecaseschangetheirposition,fromhorizontaltoverticalandbedesignedeithertomaximizePVproductionormaximizecropproductiondependingontheweatherconditions.Trackingsystemsarenottheonlycomponentthatcanhelpmaintainorenhanceagriculturalproductionwhichisaprerequisitetobelabelledasagri-PV.Agriculturalproductionprofitabilitymustdominate,andenergyproductionisanaddedvalue.•Crops,grassland,animalhusbandrybetweenPVsystems.Thesystemsmustenablethelandtomaintainitsagriculturalpurpose.Thespacebetweentherowsortheheightsisadapted.Thesesystemsareeconomicallyperformantandcosteffective.Energeticproductiondominatesbutagriculturalproductionmustbemaintained.Systemcostsandprofitabilityvarydependingontheimportancegiventoagriculturalproductioncomparedtoenergyproduction.Supportmechanismsandfinancialaidintensitycanalsovaryaccordingly.PVsystemsfallingunderthemostrestrictivedefinitionofagri-PVtypicallyreceivehigherincentivesor,insomecountries,areeventheonlytypeofPVplantallowedtobedevelopedinagriculturalareas.Fornow,agriPVisstillanemergingmarket.Japanhasseenmorethan1800agriPVfarmsrealised,mostofthemaresmallsystems.Between2013and2018,approximately150MWwereinstalled,andbetween500to600MWin2021.Chinahasalsoanimportantcapacityinstalledbutthissegmentdoesn’tappeartobemonitoredseparately.Italyannouncedamajorfundingpackagesupportfor2GW,includingtheso-calledagriPVonroofsofruralareas.Specificcallsfortenderhavebeensetforagri-PVinnumerouscountries:inFranceforaround300MW,inGermanyfor150MW,inIsraelfor100MW,andintheNetherlandsfor45MW.BIPV:WAITINGFORTHEUPTAKETheBIPVmarketremainsanichewhichisdifficulttoestimate.Withmultiplebusinessmodels,differentincentives,manykindsofbuildingsandinfrastructures(includingroads),fromtilesandshinglesforresidentialroofstoglasscurtainwallsandmoreexoticfaçadeelementsincaseofcommercialbuildings,BIPVcoversdifferentsegmentswithalargevarietyofproducts.Dependingonthedefinitionconsidered,theBIPVmarketrangedfrom200MWto400MWperyearinEuropelastyearandprobablyreached1GWglobally.Indeed,thedifferencesbetweencustom-madeelementsandtraditionalglass-glassmodulescanbedifficulttoassess.Inthatrespect,simplifiedBIPV,usingconventionalPVmoduleswithdedicatedmountingstructures,experiencedpositivedevelopmentsinnumerousEUcountriesin2021,andisleadingtheBIPVmarket.Themarketisalsosplitbetweensomeindustrialproductssuchasprefabricatedtiles(foundintheUSAandmultipleEuropeancountriesforinstance),tocustom-madearchitecturalproductsfabricatedondemand.IEAPVPSTRENDSINPHOTOVOLTAICAPPLICATIONS202222OFF-GRIDMARKETDEVELOPMENTNumbersforoff-gridapplicationsaregenerallynottrackedwiththesamelevelofaccuracyasgrid-connectedapplications.Theoff-gridandedge-of-the-gridmarketcanhardlybecomparedtothegrid-connectedmarketbecausetherapiddeploymentofgrid-connectedPVdwarfedtheoff-gridmarket.Nevertheless,off-gridapplicationsaredevelopingmorerapidlythaninthepast,mainlythankstoruralelectrificationprogramsessentiallyinAsiaandAfricabutalsoinLatinAmerica.InsomecountriesinAsiaandinAfrica,off-gridsystemswithback-uprepresentanalternativetobringingthegridintoremoteareasorasananticipationofgridconnection.Twotypesofoff-gridsystemscanbedistinguished:•Mini-grids,alsotermedasisolatedgrids,involvesmall-scaleelectricitygenerationwithacapacitybetween10kWand10MW.Thisgridusesoneormorerenewableenergysources(solar,hydro,wind,biomass)togenerateelectricityandservesalimitednumberofconsumersinisolationfromnationalelectricitytransmissionnetwork.Back-uppowercanbebatteriesand/ordieselgenerators.•Stand-alonesystems,forinstancesolarhomesystems(SHS)thatarenotconnectedtoacentralpowerdistributionsystemandsupplypowerforindividualappliances,householdsorsmall(production)business.Batteriesarealsousedtoextendthedurationofenergyuse.ThistrendisspecifictocountriesthathaveenoughsolarresourcesthroughouttheyeartomakeaPVsystemviable.Insuchcountries,PVhasbeendeployedtopoweroff-gridcitiesandvillagesorforagriculturalpurposessuchaswaterpumpinginstallations.PVincreasinglyrepresentsacompetitivealternativetoprovidingelectricityinareaswheretraditionalgridshavenotyetbeendeployed.Inthesamewayasmobilephonesareconnectingpeoplewithoutthetraditionallines,PVisexpectedtoleapfrogcomplexandcostlygridinfrastructure,especiallytoreachthe“lastmiles”.Thechallengeofprovidingelectricityforlightingandcommunication,includingaccesstotheinternet,willseetheprogressofPVasoneofthemostreliableandpromisingsourcesofelectricityindevelopingcountriesinthecomingyears.SpecificbusinessmodelsaredevelopedinAfricaforinstanceandlargeenergygroupssuchasEngieEnergyaccessforinstancearetargetingmillionsofpeoplewithsuchproducts.InmostdevelopedcountriesinEurope,AsiaortheAmericas,thistrendremainsunseen,andthefuturedevelopmentofoff-gridapplicationswillmostprobablyonlybeseenonremoteislands.PVDEVELOPMENTPERREGIONTheearlyPVdevelopmentsstartedwiththeintroductionofincentivesinEurope,particularlyinGermany,andcausedamajormarketuptakeinEuropethatpeakedin2008.Whiletheglobalmarketsizegrewfromaround200MWin2000toaround1GWin2004,themarketstartedtogrowveryfast,thankstoEuropeanmarketsin2004.In2008,SpainfuelledmarketdevelopmentwhileEuropeasawholeaccountedformorethan80%oftheglobalmarket:aperformancerepeateduntil2010.Fromaround1GWin2004,themarketdoubledin2007andreached8GWand17GWin2009and2010.From2011onward,theshareofAsiaandtheAmericasstartedtogrowrapidly,withAsiatakingthelead.Thisevolutionisquitevisibleandstilltruetoday,withtheshareoftheAsia-Pacificregionstabilizingaround54%in2021.Sincethen,AsiacontinuestoleadPVdevelopment,withtheotherregionsfollowing.DetailedinformationaboutmostIEAPVPScountriescanbefoundintheyearlyNationalSurveyReportsandtheAnnualReportoftheprogramme.IEAPVPSTask1representativescanbecontactedformoreinformationabouttheirownindividualcountries.%0102030405060708090100MiddleEastandAfricaEuropeTheAmericasAsiaPacificFIGURE2.15:ANNUALGRID-CONNECTEDCENTRALIZEDANDDISTRIBUTEDPVINSTALLATIONSBYREGIONIN2021SOURCEIEAPVPS&OTHERSGrid-connectedcentralizedGrid-connecteddistributed23IEAPVPSTRENDSINPHOTOVOLTAICAPPLICATIONS2022THEAMERICASTheAmericasrepresented40GWofinstallationsandatotalcumulativecapacityof164GWin2021.WhilstmostofthesecapacitiesareinstalledintheUSA,severalcountrieshavestartedtoinstallPVinthecentralandsoutherncountriesofthecontinent:firstinChileandHondurasandmorerecentlyinMexicoandBrazil.PVisdevelopingintheAmericasmostlythroughtendersexceptintheUSA.Distributedapplicationsstarttodevelopinseveralcountries.NexttotheUSAmarketthatdominatesbyfar,instabilityhascharacterizedthedevelopmentofPVinmostAmericancountriesinthelastyears,withstop-and-gopoliciesinCanada,HondurasorMexicoforinstance.Themarketwasdynamicin2021inChileandBrazil,tomentionthesetwo,withprospectsfordevelopmentinseveralcentralAmericancountries,suchasCostaRica,Guatemalaandmore.OutsideoftheIEAPVPSmembership,Brazilremainsthemostimportantmarket:itfinishedtheyear2021with13,7GWofcumulativePVinstalledcapacitywithmostofthenewlyinstalledcapacitycomingfromdistributedgeneration.PVinstallationsinChilegrewin2021reachingacumulativeinstalledcapacityof6,2GW.Inothercountries,suchasArgentina,developmentisstartingtotakeoff,witharound960MWcumulativeinstalledcapacityinthecountryattheendof2021and200MWinstalledin2021.Othermulti-MWinstallationshavebeenreportedinPeruinrecentyears,inHondurasorinColombia.SeveralothercountriesinCentralandLatinAmericahaveputsupportschemesinplaceforPVelectricity,andanincreasingnumberofpowerplantsareconnectedtothegridmainlyinDominicanRepublic,EcuadorandElSalvador,closelyfollowedbyUruguayandPanamawhichcouldindicatethatthetimehascomeforPVintheAmericas.Incountrieswithahighhydroelectricitycontributiontotheelectricitymix,suchasVenezuela,PVcouldbecomeanalternativetothevariableproductionduetochangesinrainpatterns.FIGURE2.16:EVOLUTIONOFPVINSTALLATIONSINTHEAMERICASPERSEGMENT%02040608010020212020201920182017201620152014201320122011Grid-connectedcentralizedGrid-connecteddistributedOff-gridSOURCEIEAPVPS&OTHERSIEAPVPSTRENDSINPHOTOVOLTAICAPPLICATIONS202224ASIA-PACIFICTheAsia-Pacificregioninstalledcloseto93GWin2021andthetotalinstalledcapacityreachedmorethan540GW.ThemarketwasdynamicinallpartsofAsia,(inIndiaaswellthisyearcomparedto2020),andsignificantgrowthwasrecorded.In2021theregionrepresented57%oftheglobalPVinstallations.Asthemostpopulatedcontinent,AsiawaspoisedtobecomethelargestPVmarketgloballyandthishappenedrelativelyfast.ApartfromthedynamismofChinaandJapanforseveralyearsnow,AsiaishometoseveralIEA-PVPSadditionalGW-scalemarkets:Australia,Korea,andalsoThailand.ThesizeoftheChinesePVmarketmakesitadominantplayerintheAsianandglobalPVmarkets,whileallothermarketsarelagging.OutsideoftheIEA-PVPSnetwork,thelargestmarketintermsofinstallationsandpotentialisIndia.Giventhepopulationofthecountry,itspotentialwouldbeatleastatthelevelofChina,ormore,giventheneedforelectrification.TheIndianmarketdevelopedinthelastyearsbutplateauedaroundthe10GWmarkonanannualbasis,beforegoingdownto4,4GWin2020duetoaseriesofadministrativeissuesanddifficulties.Somepolicychangessuchastariffceilingsandsafeguarddutiesincombinationwithafallingcurrencyalsoimpactedthetenderingprocedures.In2018and2019,severaltenderproceduresfoundveryfewbiddersandevennotenoughtakersinsomecases.ThesupportofthefederalgovernmentinIndiaforPVisobvious,especiallynowthatthegovernmentraiseditsrenewablesambitionto225GWtowards2022(and100GWforPV),buttheroadtoafastdevelopmentimpliesadditionalpolicychanges.In2021,thePVmarketinIndiawasreinvigoratedwith13,7GWinstalledleadingtoacumulativecapacityof61GW.TheInternationalSolarAlliance(ISA)initiatedbyIndiaandFranceandsupportedbymorethan120countriesaimstoinstall1000GWinitsmember(emerging)countriesby2030.InVietnam,afterasolarmarkettakeoffin2019withover5,2GWinstalled(andatotalinstalledcapacityof5,3GW)andaboomin2020withatleast11,1GWinstalled(mostlyrooftopapplicationsbutalsoofutility-scaleplants(includingfloatingPVapplications)),themarkershrunkto2GWin2021pushingthetotalinstalledcapacityto18,4GW.Thegovernmenttargetfor2030,12GW,isalreadyreached,muchfasterthanexpected,whilethecountry’selectricitydemandisexpectedtosoarinthecomingyears.In2021,Taiwan(ChineseTaipei)installedabout1,9GWasteadygrowthcomparedtopreviousyears.Itnowreachesaround7,7GWofcumulativecapacity.ThemarketissupportedbyaFiTschemeguaranteedfor20years.Largersystemsandground-mountedsystemsmustbeapprovedinacompetitivebiddingprocess.TheFiTlevelishigherforfloatingPVandtheprojectsemployinghigh-efficiencyPVmodules.InadditiontothesethreecountrieswhereinstallationsreachedGW-scalelevels,themarketisdynamicinseveralotherAsiancountries,withthemarketbeingdrivenbyutility-scaleapplicationsundertendersforinstanceinIndonesia,thePhilippines,NepalorKazakhstan.TheGovernmentofBangladeshhasbeenemphasizingthedevelopmentofsolarhomesystems(SHS)andsolarmini-gridssinceabouthalfofthepopulationhasnoaccesstoelectricity.Thankstothedecreaseinpricesofthesystemsandawell-conceivedmicro-creditscheme,off-gridPVdeploymentexplodedinrecentyears.Thecountrytargets3,2GWofrenewablesby2021,outofwhich1,7GWofPV.Themarketisgrowinginseveralothercountries,atadifferentspeed,suchasinPakistan,wherethegovernmenthaspublishedatargetof5GWofsolarpowerby2022,therefore,moreprojectsareexpectedtocomeonlineinthecomingyears.Lastbutnotleast,inSingapore,thetotalPVinstalledcapacitywas630MWattheendof2021.Asiaisacontinentsodiverse,thatitcanbedifficulttoderivetrendsfromPVmarketdevelopment:however,thedynamicsarepositiveandwhilethechallenges,asseeninIndia,arenumerous,amassivePVmarketsuitableforenergytransitiongoalsiscoming.Inthatrespect,AsiawillcontinuetodominatethePVchartsandpavethewayforlargeradoptionofPVglobally.25IEAPVPSTRENDSINPHOTOVOLTAICAPPLICATIONS2022EUROPEInthefirstyearsofthiscentury,EuropeledPVdevelopmentforyearsandrepresentedmorethan70%oftheglobalcumulativePVmarketuntil2012.From2013to2017,EuropeanPVinstallationsdecreasedwhiletherehasbeenrapidgrowthintherestoftheworld,mainlyinAsiaandtheAmericas.ThefastdevelopmentofPVledtoastrongoppositionfrommanystakeholdersfromtheenergysector,andthemarketdeclinedrapidlyinseveralcountries.Inaddition,severalcountriesimplementedmeasuresaimingatdecreasingthecostofPVinstallationsforthecommunitybyretroactivelychangingtheremunerationlevelsorbyaddingtaxes.ThisphenomenonhappenedmostlyinEurope,wherethefastdevelopmentofPVtookplacebeforeotherregionsoftheworld:Spain,Italy,CzechRepublic,Belgium,Franceandotherstooksomemeasureswithaconsequentimpactontheconfidenceofdevelopersandprosumers.Butsincethen,thesituationimprovedgraduallyinmostcountriesandPVinstallationsroseinEurope.Thiswasthecaseagainin2021.EuropesawitsPVmarketgrowingagainin2021,with30,9GWinstalled,whichaccountedfor18%oftheglobalPVmarket.Europeancountrieshadcloseto198GWofcumulativePVcapacitybytheendof2021,thesecondlargestcapacityglobally.ItisimportanttodistinguishtheEuropeanUnionanditscountries,whichbenefitfromacommonregulatoryframeworkforpartoftheenergymarket,andotherEuropeancountrieswhichhavetheirownenergyregulationsandarenotpartoftheEuropeanUnion.MostEuropeancountriesusedFeed-inTariffsschemestostartdevelopingPVandmovedinthelastyearstoself-consumption(orvariants)fordistributedPVwhiletendersbecamethestandardforutility-scalePV.ThesetrendsarenottypicaltoEurope,butself-consumptiondevelopedfasterherethaninotherlocations.Collectiveanddelocalizedself-consumptionaredevelopinginseveralcountries.BIPVhasbeenincentivizedmorethaninanyotherlocationinthepastbutremainsanichemarketafterseveralGWofinstallations.SimplifiedBIPVseemstodevelopwellinsomecountries.Merchantutility-scalePVdevelopedinSpainandGermanyandcouldleadtoasignificantmarketshareinanearfuture.Portugalsawcompetitivetendersbelowareasonablepricein2020,signofspeculationongridconnections.Ingeneral,PVdevelopmentinEuropehasexperiencedasignificantacceleration,andrisingelectricitypricesin2022areincreasingthecompetitivenessofPVelectricity.FIGURE2.17:EVOLUTIONOFPVINSTALLATIONSINASIAPACIFICPERSEGMENT%02040608010020212020201920182017201620152014201320122011Grid-connectedcentralizedGrid-connecteddistributedOff-gridSOURCEIEAPVPS&OTHERSIEAPVPSTRENDSINPHOTOVOLTAICAPPLICATIONS202226EuropeanUnionPolicyFrameworkTheEuropeanUnionhasastronginfluenceonclimateandenergypoliciesandhashistoricallysupportedhighrenewableenergydevelopmentstotackleclimatechange.Inrecentyears,theEUhassetincreasinglyambitiousgoals,whichhavebeenaugmentedseveraltimes:InDecember2018,therevisedEuropeanRenewableEnergyDirective(REDII)seta32%renewableenergytargetby2030,upto20%incomparisonwith2020.Sincethen,thetargethasbeenincreased:theshareofrenewablesintheEU’sfinalenergyconsumptionhasbeensetto45%by2030.In2019theEuropeanGreenDealwasintroduced,anactionplantoboosttheefficientuseofresourcesbymovingtoaclean,circulareconomyandtorestorebiodiversityandreducepollution.OneofthepillarsoftheEuropeanGreenDealisacommitmenttobeclimateneutralby2050.TheEuropeanCommissionraisedthe2030climatetargetsto55%GHGreductionby2030.InMay2021,theEuropeanCouncilreceivedaformalnotificationabouttheapprovaloftheRecoveryandResilienceFacility(RRF)byallMemberStates.Togetherwiththenextlong-termbudget,thisrepresentsEUR2,02trillionofspendingbetween2020and2027whichcanbepartiallyusedtodeveloprenewablesincludinglocalmanufacturing:Eachrecoveryandresilienceplanhastoincludeaminimumof37%ofexpenditureearmarkedforactionstofightclimatechange.Therecoveryandresilienceplansdonotthemselvessetnewtargetsforthedeploymentofrenewablesatanationallevel.Rathertheydefineapackageofstrategicprojects,rangingfromtechnologicaltosocio-economicandadministrative.MostnationalrecoveryandresilienceplansincludemeasurestosupporttheinstallationofsolarPVsystemsandtargetsforgreenhydrogenfromrenewableenergysources.Thiscomprisestheelectrificationoftransportmentionedinvariousplansthatwillrequireadditionalrenewableelectricitycapacities.Rooftopinstallationsarementionedbyseveralcountries,oftenwithregardtobuildingrenovation.However,totalnumbersareoftendifficulttoderiveasPVandwindareoftenbundled.In2022,theREPowerEUhasbeenproposedasajointEuropeanactionformoreaffordable,secure,andsustainableenergy:ithasbeendeemedasnecessarybothtoacceleratetheenergytransitionandtosecuretheEU’senergysupplyanddisconnectEuropefromRussiangasandoilimports.REPowerEUincludesshortandmedium-termmilestoneswhichaimatafullindependencefromallRussianenergyimportsby2027.Theplanwouldbringthetotalrenewableenergygenerationcapacitiesto1236GWby2030,incomparisontotheoriginal“Fitfor55”1067GWplannedby2030.Also,aspartoftheREPowerEUplan,theEUSolarEnergyStrategy’saimistoboosttheroll-outofphotovoltaicenergy.Thisstrategyaimstobringonlineover320GWofsolarPVcapacityby2025,andalmost600GWby2030.ThisplanwillbeFIGURE2.18:EVOLUTIONOFPVINSTALLATIONSINEUROPEPERSEGMENT%02040608010020212020201920182017201620152014201320122011Grid-connectedcentralizedGrid-connecteddistributedOff-gridSOURCEIEAPVPS&OTHERS27IEAPVPSTRENDSINPHOTOVOLTAICAPPLICATIONS2022pavingthewayforaneraofrenewableenergyataffordablepriceswhileacceleratingtheirdevelopment.Itaimsatachievingenergysavings,producecleanenergyanddiversifytheEU’senergysupplysources.TheCypriotRecoveryPlanincludesinvestmentsintoan“EuroAsiaInterconnector”intheterritoryofCyprus.TheEuroAsiaInterconnectorisacrossborderinterconnectorbetweenCrete,Cypriot,andIsraelipowergrids.Therealisationofthis1208kmlonginterconnectionwouldallowmorePVelectricitycapacitywithoutadditionalstorage.InMarch2021,Cyprus,GreeceandIsraelsignedamemorandumofunderstandingfortheinterconnectorwithapowercapacitybetween1000to2000MWac.Itisexpectedthattheconnectionwillbecompletedby2024,withoperationsstartingin2025.TheimplicationsfornewPVcapacityinthethreepartneringcountriesaresignificant.DifferenttoitspartnersCyprushasnotyetrevealedtheplannedadditionalrenewableelectricitycapacity.Israelannouncedthattheinterconnectionwouldallowanadditionalinstallationof12to15GWPVcapacityby2030.Greecedecidedtophaseoutcoalby2028andaddanadditional5GWofPVcapacityby2030.Todoso,astronginterconnectionaswellastheannouncedenergystorageframeworkarecrucial.InMarch2021,Hungaryannouncedtocloseitslastcoalfiredpowerplant5yearsearlierin2025.ThiscouldleadtoanincreaseofPVdeployment,meaningthatthe2030targetof6,5GWcanbereachedearlier.Towhatextendthe2040targetof12GWofPVsystemswillbebroughtforwardisnotyetclear.ThePolishrecoveryplanmentionsrooftopPVbutincludesnoconcretetarget.However,togetherwiththePolishhydrogenstrategy,whichaimsfor2GWofelectrolysersandtheaimtoreplacecoalheatingsysteminresidentialbuildingswithheatpumps,willdrivethedemandforrenewableelectricity.ThePolishInstituteofRenewableEnergy,responsiblefortrackingthecapacityadditionsinthecountry,forecaststhatthecumulativeinstalledcapacitywillexceedtheNECPtargetin2022andcouldreach15GWby2025andover20GWby2030.InTurkey,systemsbelow1MWfallunderthecategoryof“nonlicencedplants”whichallowedthemarkettotakeoff.Attheendof2020,thecumulativecapacityhadexceeded9,5GW,mostofitinthecategoryof“non-licenced”accordingtotheTurkishtransmissionoperator.InMay2019,theTurkishEnergyMarketRegulatoryAuthority(EPDK)publishednewrulesfornetmeteringofPVsystemswithacapacitybetween3and10kW.Also,inMay2019,theTurkishGovernmentamendedtherulesfor“nonlicencedplants”increasingtheprojectsizeupto5MW.However,onlypublicinstallationsusedforagriculturalirrigation,watertreatmentplantsorwastetreatmentfacilitiesareeligibleasgroundmountedprojects.StateofPlayAttheendof2021,thetotalinstalledPVpowercapacityintheEuropeanUnionhadsurpassed170GW.Almost55%ofthiswereresidentialandcommercialrooftopinstallations.ThePVmarketintheEuropeanUnionwasdecliningforsixyearsbeforethetrendreversedin2018.Thistrendcontinuedin2021whentheEuropeanUnionaddedupwardof28,7GWofnewPVpowercapacity.Spain(4,9GW),Germany(5,8GW),Poland(3,7GW),theNetherlands(3,6GW)andFrance(3,4GW)canbementionedasleadingcountries.Greeceaddedover1GWwhileeightcountriesaddedmorethan500MW,namelyHungary,Austria,Denmark,Belgium,Italy,Portugal,SwitzerlandandSweden.Overthelastfewyears,thenumberofEuropeanMemberStatesconductingauctionsforsolarenergyhascontinuouslyincreasedanddrivendownpricestothecurrentaveragelevelofEUR35/MWhandEUR70/MWhacrosstheEuropeanUnion.In2020,thesecondPortugueseauctionattractedthelowestbids.ThewinningprojectsofferedelectricitybetweenEUR11,2/MWh.OtherEuropeanCountriesOutsideoftheIEA-PVPSnetwork,UKinstalled730MWin2021,stillfarfromtheGW-scalemarketitusedtobeafewyearsago.Thecountryhadmorethan14GWofPVattheendoftheyear2021,withamarketmostlyfocusedonsmall-scaleapplications.PPA-drivenutility-scalePVcoulddevelopinthecomingyears.IntheRussianFederationthe“EnergyStrategyofRussiaforthePeriodUpto2035”setatargetshareofrenewableenergyintotalelectricityproductionat4.5%by2024.Furthermore,theRussiangovernmentsetatargetof25GWfortheinstallationofrenewableelectricitycapacitiestowards2030.In2021about200MWofnewPVcapacitywasinstalledinRussia,increasingthetotalcapacitytoslightlyabove2GW(includingca400MWinCrimea).IEAPVPSTRENDSINPHOTOVOLTAICAPPLICATIONS202228MIDDLEEASTANDAFRICAOverthepastdecade,manycountries,especiallyintheMiddleEasthavestartedtoconnectlarge-scalePVpowerplantsandmoreareinthepipeline.SeveralcountriesaredefiningPVdevelopmentplansandtheprospectsontheshorttomediumtermarepositive.TheMiddleEastisamongstoneofthemostcompetitiveplacesforPVinstallations,withPPAsgrantedthroughtenderingprocessesamongthelowestintheworld.In2021,around6GWhavebeeninstalledintheregion,representing3,5%oftheglobalmarket.InMEA(MiddleEastandAfrica)countries,thedevelopmentofPVremainsmodestcomparedtothelargermarkets,especiallyintheAfricancountries.However,almostallcountriessawasmalldevelopmentofPVinthelastyearsandsomeofthemasignificantincrease.ThereisacleartrendinmostcountriestoincludePVinenergyplanning,tosetnationaltargetsandtopreparetheregulatoryframeworktoaccommodatePV.NexttoIEA-PVPScountrieswithadynamicmarketsuchasIsraelandmorerecentlyMorocco,theregion’sPVdevelopmentisextremelydiversewithEgypt,SaudiArabiaandtheUEAleadinginstallations.InthemiddleEast,themarkethasbeendrivenmostlyforcompetitivetendersforyearsanddistributedapplicationsstartedtodeveloponlyrecently(netmeteringpolicieshavebeenimplementedinIsrael,Jordan,SaudiArabiaandTunisia).Often,energypricesaresupportedbygovernmentspending,whichlimitedforyearstheabilityofPVtocompete.Thissituationischangingslowly,withnewdistributedschemesbeingproposedsuchasinDubai(UAE).TendersarestillcompetitiveandSaudiArabiabecameearly2021thecountrywiththemostcompetitivetender:thelowestacceptablebidreached10,4USDperMWh,thelowestonrecord.Anothertrendinthefast-developingregionisthewillingnessforgovernmenttodevelopbrandnewcitiesorneighbourhoods,whichaimatbecomingshowcasesofrenewableenergies.ThiswasthecaseforMasdarCity(UAE)orSparkandNeom(SaudiArabia).ThesituationissimilarinnorthernAfrica,withtendersdrivingPVmarketdevelopmentinEgypt(evenifthedevelopmentwasslowerthanexpected),Algeria,andMorocco.Inseveralcountries,thequestionoflocalmanufacturingisessentialevenifnotyetvisibleincurrentpolicies.ThewillingnesstomanufacturelocallyanddevelopamanufacturingindustryispresentandwillinfluencePVdeploymentinthecomingyears,especiallyinMoroccoandSouthAfrica.FIGURE2.19:EVOLUTIONOFPVINSTALLATIONSINAFRICAANDTHEMIDDLEEASTPERSEGMENT%02040608010020212020201920182017201620152014201320122011Grid-connectedcentralizedGrid-connecteddistributedOff-gridSOURCEIEAPVPS&OTHERS29IEAPVPSTRENDSINPHOTOVOLTAICAPPLICATIONS2022IntheMiddleEast,countriessuchasSaudiArabia,Bahrain,Jordan,OmanandtheUnitedArabEmirateshavedefinedtargetsforrenewableandsolarenergyforthecomingyears.TendersareanintegralpartoftheplansforPVdevelopmentintheshortorlongtermintheregion,whileseveralwereorganizedagainin2019and2020andmorehavebeenannounced.Almost3GWdchavebeeninstalledintheUAEthroughseveralplantsandmoreisexpectedtocome.Jordanisaimingfor1GWofPVin2030andalreadylaunchedseveraltendersandinstalledseveralhundredsofMW.Qatarpublishedtheresultsofitsthirdtenderfor800MWinJanuary2020.SaudiArabialaunchedaseriesoftendersinthepastandhasagainin2020,withaninitialobjectivetotalling3,3GW.Bahrainhasannouncedthedevelopmentof225MW;Omanhaslaunchedseveraltenders,eachforatleast500MWandplanstoreach4GWofREScapacityby2030,Tunisialaunchedatenderfor500MWandfor70MW,Libya100MW.Lebanonplans180MWtowards2020andisinvestigatingaplantof500MWaswell.InSub-SaharanAfrica,withthenotableexceptionofSouthAfrica,themarkethasbeenslowertodevelop.DevelopmentAidisoftenakeytoolforfinancinghybridPVsystemsandelectrifydirectlythroughnewgridconnection.EgyptisthenewAfricanmarketleaderwithcloseto300MWinstalledinoneyear.Thepoliciesengagedforseveralyearsnowhavestartedtoproducepositiveeffectsandthemarketispoisedtodevelopfurther.SouthAfricawasthefirstmajorAfricanPVmarket,underseveraltendersthatledto4,6GWcumulativelyinstalledattheendof2021.Whilealargepartofthemarketwasdrivenbytenders,themarketshouldrebalancetowardsrooftopapplicationsinthecomingyearsundergovernmentsupport.InAfrica,besidestheabove-mentionedcountries,AlgeriahasinstalledseveralhundredsofMW.ReunionIsland,Senegal,Kenya,Mauritania,NamibiaandGhanahavealreadyinstalledsomecapacity.Asthecostsaredecreasing,theinterestinPVisgrowinginotherAfricancountries.However,themarkethasnotreallytakenoffdespitethehugepotentialandthegrowingcompetitivenessofsolarPV,especiallyinoff-gridapplications.ThemainbarrieristhefinancialaspectasthehigherupfrontinvestmentcostsremainsabarrierdespitelowerLCOE.ThemostcompetitivesegmentforthedevelopmentofsolarinAfrica,especiallyinremoteareas,isPVplantstoreplaceorcomplementexistingdieselgenerators.SuchkindsofhybridplantshavebeendevelopedinDemocraticRepublicofCongo,Rwanda,Ghana,Mali,IvoryCoast,BurkinaFaso,Cameroon,Gambia,Mauritania,Benin,SierraLeone,Lesothoandothers.Pay-as-you-gomodelsareusedtoleveragefinancingdifficultiesforresidentialconsumers,differentpricingformatsexisttofosteraccesstocleanandreliableelectricity.Severallarge-scalePVplantshavebeenannouncedorareunderconstructioninseveralcountriesinAfrica:BurkinaFaso(20MWand30MW),Namibia(45MWand30MW),Nigeria(100MW),Cameroon(30MWand25MWprojectsongoing)andKenya(severalprojectsrangingfrom30MWto80MW)tonamejustafew.ThequestionofAfricanpowermarketsisessentialsincemanycountrieshaveasmall,centralizedpowerdemand,sometimesbelow500MW.Inthisrespect,thequestionisnotonlytoconnectPVtothegridbutalsotoreinforcetheelectricitygridinfrastructureandinterconnectionwithneighbouringcountries.However,concerningremoteareas,micro-gridsandoff-gridPVapplications,suchaswaterpumpinginstallations,areexpectedtoplayagrowingroleinbringingaffordablepowertotheconsumers,inacontinentwith700millionpeoplestilllackabasicaccesstoelectricity.IEAPVPSTRENDSINPHOTOVOLTAICAPPLICATIONS202230TABLE2.6:2021PVMARKETSTATISTICSINDETAILCOUNTRY2021ANNUALCAPACITY(MW)2021CUMULATIVECAPACITY(MW)DECENTRALIZEDCENTRALIZEDTOTALDECENTRALIZEDCENTRALIZEDTOTALAUSTRALIA32311713494417037899826035AUSTRIA6588173926791042783CANADA118304421153326024135CHILE125014312681132348426165CHINA292802560054880108580199940308520DENMARK27144771815148302344FINLAND9551004085413FRANCE1133221933508734771616450GERMANY375320085760485591110359661ISRAEL668267935193914103349ITALY8905494414546804822594JAPAN355329926545482923012178413KOREA2283997422526401890821548MALAYSIA3016937072816032330MEXICO8258011625204061598199MOROCCO--493--699NETHERLANDS1287234536325861848814349NORWAY450452050205PORTUGAL10246957156910791647SOUTHAFRICA58400458105835724630SPAIN14003500490032771522618503SWEDEN5762359916901081798SWITZERLAND6156868334312263656THAILAND25025050090031784078TURKEY84564714929735118210917UNITEDSTATES661820255268734267780327123004IEAPVPS5879769978129267335552417642753891NON-IEAPVPS19319253734420075802116697191801TOTAL7811695351173467411354534339945692SOURCEIEAPVPS&OTHERS31IEAPVPSTRENDSINPHOTOVOLTAICAPPLICATIONS2022threePOLICYFRAMEWORKIntheearlyphaseofPVdevelopment,mostmarketshavebeenpoweredbyabroadspectrumofsupportpolicies,fromfeed-intariffsanddirectsubsidiestocompetitivecallsfortenderandpremiums.ThefirstaimwastoreducethegapbetweenPV’scostofelectricityandthepriceofconventionalelectricitysourcesthankstofinancialsupport.TherapidpricedeclinethatPVexperiencedinthelastyearshasenabledPVsystemstoreachcompetitivepricesinseveralsegmentsandcountries(formoredetail,seeChapter6,competitivenessofPVelectricity).ThepossibilitytodevelopPVsystemsinmanylocationswithlimitedornofinancialincentivesisnowanobservablereality.Directlong-termprivatecontractsbetweenPVplantownersandoff-takersfortheelectricityproduced(PPAs),andthesaleofelectricityonwholesalemarkets(merchantPV),haveseeninanincreasingnumberofcountriesin2021(alargepartofground-mountedPVplantsinstalledcapacityinSpainin2021wasdevelopedthroughPPAs).ThegrowingcompetitivenessofPVelectricityhasalsoboostedtheshareofnon-incentivizedself-consumptionPVinstallations,whichhavereached6%in2021.Moreover,theincreaseinenergycostsin2021and2022,andspecificallyelectricityprices,haveenhancedPVcompetitivenessinnumerouscountries.Ifhighmarketpricesforelectricityremain,thequestionofcompetitivenesswillchangecompletelyaswillthewaytoconceivePVmarketsupportandpolicyframework.Withoutanysupportschemelimitation,thePVmarketpotentiallooksvirtuallyunlimited.However,thecompetitivenessofPVisnotyetguaranteedinallsegmentsandlocations.Therefore,targetedfinancialincentivesmightstillbeneededforsomeyearstoovercomecostsorinvestmentbarriersinspecificcountries.Supportschemesareevolvingaccordingtomarketmaturity,PVelectricitycompetitivenessandinvestorconfidence.Predefinedfeed-in-tariffsthatsupportcentralizedPVarebeingreplacedinmanycountriesbyauctionswithcallsfortenderstoproposethemostcompetitivePVelectricity.Thismechanismcanbeadapted,settingthesameauctionsbutforavariablepremium,givenontopofthewholesalemarketpricewheretheelectricityissold.Whennomoreincentiveisneeded,PVplantssellingelectricitythroughPPAscanbesetupfollowedbyplantsthatsellelectricitydirectlytothemarket.SupportforthedistributedPVmarketoftenbeginsbysettingfeed-intariffstoo,whichstillsupporthalfofthesesegmentsin2021(54%),evenifthetrendleanstowardslowertariffs.Inplaceswhereself-consumptionisincentivized,supportedinitiallybynet-meteringmechanismsturningtonet-billingmechanisms,premiumsorFiTtariffsfortheexcesselectricityfedintothegridbeforecompetitiveself-consumptionwithoutanyincentivescantakeplace.SincethequestionofthecompetitivenessofPVislesspressing,alargepartofnewpoliciesisalsofocussedonself-consumptionschemes,citizencommunitiesandinnovatingformsofcollectiveanddelocalisedself-consumption.Policiessupportingself-consumptionmightbeconsideredasnon-financialincentivessincetheysetuptheregulatoryenvironmenttoallowconsumerstobecomeprosumersoranenergycommunity.EvenifelectricityprocurementcanbecompensatedbyPVproduction,taxesandthefinancingofdistributionandtransmissiongridsarestillanimatingthedebate,shapingtheregulatoryframeworkandimpactingthebusinessmodelsandthepriceforPVelectricitytocompete.PhotobyDenisSchroeder,NREL60075IEAPVPSTRENDSINPHOTOVOLTAICAPPLICATIONS202232InadditiontodirectpoliciessupportingPVdevelopment,otherindirectpolicieshaveatremendouseffectonPVdevelopment.Sustainablebuildingrequirements,forinstance,willbecomeincreasinglyessentialtosupportalong-lastingPVmarketdevelopmentevenifmostofthetimetherequirementsaretechnologyagnostic.Electricvehicledevelopmentroadmapswillalsohaveadirectimpactonelectricitydemand,aswellashydrogenproduction.Cross-sectoralaspectsofPVdevelopmentwillalsoimplythatPVwillbesubmittedtoadditionalregulationsandpolicies,inthebuildingandtransportsector,butalsoinagriculture,theurbanenvironment,waterareas(includingtheseas),industrialprocessandmore...WiththeshareofPVelectricitygrowingintheelectricitysystemofseveralcountries,thequestionofintegrationtotheelectricitygridisbecomingmoreacute.Simplificationofinadequateandcostlyadministrativebarriersandstreamliningofpermitproceduresisalsoadriverandprogresshasbeennotedinmostcountriesinthelastyears.Today,climatepolicieshaveanindirecteffectbutareshiftingthecompetitivenessofrenewableenergysourcesupwards.FIGURE3.1:EVOLUTIONOFMARKETINCENTIVESANDENABLERS:2010,2015,2021TRADINGOFGREENCERTIFICATESORSIMILARRPS-BASEDSCHEMES,3%FEED-INTARIFF85%DIRECTSUBSIDIESORTAXBREAKS,11%TRADINGOFGREENCERTIFICATESORSIMILARRPS-BASEDSCHEMES,2%FEED-INTARIFFTHROUGHTENDERSORPPA,7%FEED-INTARIFF60%NON-INCENTIVIZEDSELF-CONSUMPTION,0,2%DIRECTSUBSIDIESORTAXBREAKS,16%INCENTIVIZEDSELF-CONSUMPTIONORNET-METERING,15%TRADINGOFGREENCERTIFICATESORSIMILARRPS-BASEDSCHEMES,3%FEED-INTARIFFTHROUGHTENDERSORPPA,20%NONINCENTIVIZED,17%FEED-INTARIFF28%NON-INCENTIVIZEDSELF-CONSUMPTION,6%DIRECTSUBSIDIESORTAXBREAKS,16%INCENTIVIZEDSELFCONSUMPTIONORNETMETERING/NETBILLING,10%20102015202133IEAPVPSTRENDSINPHOTOVOLTAICAPPLICATIONS2022PVMARKETDRIVERSANDSUPPORTSCHEMESThequestionofmarketdriversisacomplexonesincethemarketisalwaysdrivenbyacombinationofseveralregulationsandincentives.Inthesefigures,thefocusisputonthemajordriverforeachmacro-segment(distributedorcentralized),whileotherdriversareplayingakeyrole.ThisshouldberegardedasageneralindicationofthemainPVdrivers.FEED-INTARIFFSGlobally,about28%ofthePVinstallationsarereceivingapredefinedtariffforpartoralloftheirproduction;respectively54%and6%forthedistributedandthecentralizedsegments.Thereisaglobaltrendtowardslowertariffs.ThisdecreasingFiTsareinlinewiththepricedecreaseofthePVtechnology.Theincreaseseenin2021,althoughpossiblytemporary,mightputthebrakesonthetariffsdecline.TheconceptofFiTisquitesimple.ElectricityproducedbythePVsystemandinjectedintothegridispaidatapredefinedpriceandguaranteedduringafixedperiod.FiTarepaidingeneralbyofficialbodiesorutilitiesinordertoset-upaPVmarketsegment.Intheory,thepricecouldbeindexedontheinflationrate,butthisisrarelythecase.TheFiTmodelgenerallyassumesthataPVsystemproduceselectricityforinjectingintothegridratherthanforlocalconsumption.However,aFiTcanbeusedtoincentivizeself-consumptionprojectsthrougharemunerationfortheexcesselectricityinjectedintothegrid.FIGURE3.2A:MAINDRIVERSOFTHEDISTRIBUTEDPVMARKETIN2021TRADINGOFGREENCERTIFICATESORSIMILARRPS-BASEDSCHEMES,0,3%FEED-INTARIFF54%NON-INCENTIVIZEDSELF-CONSUMPTION,14%DIRECTSUBSIDIESORTAXBREAKS,9%INCENTIVIZEDSELF-CONSUMPTIONORNET-METERING,23%78GWSOURCEIEAPVPS&OTHERSFIGURE3.2B:MAINDRIVERSOFTHECENTRALIZEDPVMARKETIN202195GWTRADINGOFGREENCERTIFICATESORSIMILARRPS-BASEDSCHEMES,6%NONINCENTIVIZED,31%FEED-INTARIFF,6%DIRECTSUBSIDIESORTAXBREAKS,21%FEED-INTARIFFTHROUGHTENDERSORPPA,36%SOURCEIEAPVPS&OTHERSAmongsttheIEAPVPSmembersmanycountrieshadaFiTschemein2021,inmostcasestosupporttheresidentialmarket(Australia,Canada,China,France,Germany,Japan,Portugal,Switzerland)TheattractivenessofFiThasbeenslightlyreducedcomparedtotheearlydevelopmentsofPVbutsofaritstillrepresentsamajordriverofPVinstallation,althoughsomecountriesannouncedaphase-out(suchasAustriain2021,Kenyain2022).Dependingonthecountryspecifics,FiTcanbedefinedatthenationallevelandattheregional,countyorcitylevel(Australia,Canada,China,etc.)withsomeregionsoptingforitandothersnot,orwithdifferentcharacteristics.FiTcanalsobegrantedbyutilitiesthemselves(Switzerland),outsideofthepolicyframeworktoincreasecustomerfidelity.FiTremainsaverysimpleinstrumenttodevelopPV,butitneedstobefine-tunedonaregularbasistoensureastablemarketdevelopment.Indeed,themarketcangrowoutofcontrolifthereisanimbalancebetweentheleveloffthetariffsandtheeffectivecostofPVsystems,especiallywhenthebudgetavailablefortheFiTpaymentsisnotlimited.MostmarketboomsincountrieswithunlimitedFiTschemeswerecausedbytheunpredictablesteeppricedecreaseofPVsystems,whiletheleveloftheFiTwasnotadaptedfastenough.Thissituationcausedthemarkettogrowoutofcontrol,mainlyinearlymarketsinEuropeancountries.ThemarketboomsoccurredincountriessuchasSpainin2008,CzechRepublicin2010,Italyin2011,Belgiumin2012,toacertainextentinChinain2015,2016and2017,andtoalesserextenttoothercountries.Unfortunately,theseboomshavestrainedthebudgetandnegativelyaffectedthepublicperceptionofPV,mostofthesemarketstookyearstorecoverandreexperiencegrowth.IEAPVPSTRENDSINPHOTOVOLTAICAPPLICATIONS202234Therefore,manycountriesadoptedtheprincipleofdecreasingFiTlevelsovertimeorintroducedlimitedbudgets.InGermany,theleveloftheFiTcanbeadaptedmonthlytoreducetheprofitabilityofPVinvestmentsifthemarketisgrowingfasterthanthetargetdecidedbythegovernment.InFrance,theFiTdecreaseisdependentonbothinstallationratesandoneconomicindicators.TheeconomicindicatorsandgovernmentinterventionalsoallowsforincreasedFiTifeconomicconditions(suchascostincreases)requireit-andhasbeenputinplaceretroactivelyinJuly2022.ImpactofcompetitivetendersonthemarketTendershavedrivenPVdevelopmentinthelastyearsandcontinuedtobegrantedinseveralplacesintheworldwithextremelycompetitiveprices,wellbelow20USD/MWhinthesunniestplaces.Winningbidsdowntoalmost10USD/MWhhavebeenreportedintheMiddleEast,whilesometenderswithpricesbelow14USD/MWhhavebeenrecordedinEurope(butthesecanbequestioned).Thedecreasingpricetrendhaltedin2021duetomodulepricehikes,andmostexpertsbelievethatpriceswillhardlycontinuetogodowninthecomingyears,atleastuntiltherawmaterialcrisiscanbesolved.Sincebiddersmustcompetewithoneanother,theytendtoreducethebiddingpricetotheminimumpossibleandshrinktheirmargins.Thisprocessiscurrentlyshowinghowlowthebidscangoundertheconstraintofcompetitivetenders.However,manyexpertsbelievesuchlowbidsareonlypossiblewithextremelylowcapitalcosts,lowcomponentcostsandreducedriskhedging.Theshrinkingprofitmargins,especiallyinsuper-competitivetenders,couldbecomeathreattothelong-termstabilityofsomemarketactors,hencecreatingmoremarketconcentration.Thisisalreadyvisiblein2021withthemajorincreaseofpricesduetotheimpactofthepandemic,whichresultsinhugedifficultiesforsomedeveloperstoremaincompetitiveonalreadygrantedtenders.Therefore,itisconceivablethattheydonotrepresenttheaveragePVpriceinallcasesbutareshowcasesforsuper-competitivedevelopers.TrendsoftechnologyneutraltendersandpremiumforlocalcontentTendersareoftentechnology-specific,however,technology-neutraltendersarespreading.Inthiscase,PVisputincompetitionwithothergenerationsources.SomecountriessuchasCanada,France,Germany,SpainandItalyareexperimentingwithmixedauctionsbasedonsolarandwindinparallelwithsometechnology-specifictenders.TendercanalsobesettoreachacapacityasithasbeenexperimentedinMexico.Insomecountries,cost-basedtendersevolvetowardsmultiple-factorstenders.Environmentalorindustrialconstraintsareintroducedtogiveanadvantagetolocalcompaniesortofavourabetterenvironmentalfootprintoftheproducts.Competitivetenderscanbeusedtopromotespecifictechnologiesorimposeadditionalconstraintssuchaslocalmanufacturingtoboostthelocalindustry.Inseveralcountries,alocalcontentparameterhasbeendiscussedandactsasanadditionalprimaryorsecondarykeyinthegrantFiTremainsthemostpopularsupportschemeforgrid-connectedPVsystems;especiallyforsmallhouseholdrooftopsapplications.TheeaseofimplementationcontinuestomakeitthemostusedregulatoryframeworkforPVglobally.FEEDINTARIFFANDPREMIUMTHROUGHTENDERSCallsfortendersareanotherwaytograntFiTschemeswithanindirectfinancialcap.Thissystemhasbeenadoptedinmanycountriesaroundtheworld,withtheclearaimofincreasingthecompetitivenessofPVelectricity.Around36%ofutility-scaleplantsweredevelopedthroughtenders:thisisasignificantincreasewhichstartedafewyearsago.Therelevanceofthisschemeforadistributedsegmentcanbequestionedandtendersexperimentedinsomecountriesforthesmallestcapacitieshavegenerallynotbeenrenewed,likeinFrance.TendershavegainedsuccessintheentireworldoverthelastfewyearsandEuropeisalignedwiththistrend.InAustralia,solartenderscomefromamixofstateandlocalgovernmentsandelectricityretailers.IntheMiddleEastandNorthAfrica,tenderswereissuedinEgypt,Israel,Jordan,Morocco,SouthAfrica,Qatar,Koweit,andtheUAE.Intherestoftheworld,manyothershavejoinedthelistofcountriesusingcallsfortenders.InLatinAmerica,Argentina,Brazil,Chile,Mexico,andPeru,justtomentionthemostvisible,haveimplementedsuchtenders.InAsia,India,NepalandSriLankaalsostartedtolaunchtenders,whileinSouthernAfrica,Nigeria,Senegal,Tunisia,andMalawicanbecitedamongstthenewcomers.PVMARKETDRIVERSANDSUPPORTSCHEMES/CONTINUED35IEAPVPSTRENDSINPHOTOVOLTAICAPPLICATIONS2022decisionlikeinsomeAfricancountriessuchasAlgeria,MoroccoandSouthAfrica.Thistypeofrequirementaimsatenablingthedevelopmentoflocalsolarmodulemanufacturing.Turkey,forinstance,appliesapremiumforlocalcontent,ontopofthenormalFiT.IntheUSA,ataxrebatebonusisgranted.TheEuropeanUnionisworkingoneco-designandenvironmentalfootprintframeworks.InFrance,amaximumlevelofcarbonfootprintissettoaccessthetendersandlowercarbonfootprintsgainbonuspointstofacilitatewinningcapacity.Evenifitisnotdirectlyalocalcontentspecification,localmanufacturingisindirectlyencouragedbythemeasuresbasedonenvironmentalimpact.Towardsvariablefeed-inpremiumor“contractfordifference”Inseveralcountries,theFiTschemesawardedbyauctionsarebeingreplacedbyfeed-inpremiums.Thepremiumispaidontopofthewholesaleelectricitymarketprice.Fixedandvariablepremiumscanbeconsidered.SwedenandAustriaareusingafixedFiPforsmalldecentralizedsystems.InGermany,France,ItalyandtheNetherlands,theremunerationofsolarPVelectricityisbasedonavariableFeed-inPremium(FiP)thatispaidontopoftheaverageelectricitywholesalemarketpriceforutility-scalesystems.Aso-calledContractforDifferenceschemeisaFiPthatensuresconstantremunerationbycoveringthedifferencebetweentheexpectedremunerationandtheelectricitymarketprice.Italsocangeneratereversedcashflowsbetweengeneratorsandgovernmentssincelate2021andtheexplosioninmarketelectricityprices.INCENTIVIZEDSELF-CONSUMPTIONSelf-consumption,supportedbydifferentmechanismssuchasnet-meteringandnet-billing,represented23%ofthedistributedPVmarket,animportantincreasecomparedtohistoricalinstallations.Variousformsofsupporttoself-consumptionschemesexist.Thefirstsetofpoliciesusedtodevelopthemarketofsmall-scalePVinstallationsonbuildingswerecalled“net-metering”policiesandwereadoptedinalargenumberofcountries,however,withdifferentdefinitions.Onemustbecarefulwhenlookingatself-consumptionschemessincethesamevocabularycanimplydifferentregulationsdependingonthecase.ThebestexampleisintheUSA,withthewording“net-metering”beingusedfordifferentself-consumptionschemesindifferentstates.Genuine“net-metering”whichofferscreditsforPVelectricityinjectedintothegrid,haspreviouslysupportedmarketdevelopmentinBelgium,Canada,Denmark,theNetherlands,Portugal,KoreaandtheUSA,butsuchpoliciesareincreasinglyreplacedbyself-consumptionpoliciesfavouringreal-timeconsumptionofPVelectricity,oftencompletedwithafeed-intariff(orfeed-inpremiumaddedontopofthespotprice)fortheexcessPVelectricityfedintothegrid.ThisisforexamplethecaseinSpainandinFrance.Asaresult,self-consumptionisbecomingamajordriverofdistributedPVinstallations.Althoughnet-meteringisbeingabolishedinhistoricalmarkets,countriessuchasThailand,MalaysiaorEcuadorintroducednet-meteringforresidentialPVownersrecently.SeveralemergingPVcountrieshaveimplementednet-meteringschemesinrecentyears(Chile,Israel,Jordan,UAE(Dubai)andTunisia).Whiletheself-consumptionandnet-meteringschemesarebasedonanenergycompensationofelectricityflows,othersystemsexist.Italyattributesdifferentpricestoconsumedelectricityandtheelectricityfedintothegrid.Tendershavenotyetshowntheirfullpotential.Forthetimebeing,theyaremostlyusedtoframePVdevelopmentandPVcosts.Forregulators,thisimpliesdefiningamaximumcapacityandproposingthecheapestsuitableplantstodevelop.However,itcouldbedevelopedfurtherandbepartofalarger,long-term,roadmaponpowercapacitydevelopment.Byplanningsmartly,togetherwithtransmissiongridoperators,tenderscouldallowtodevelopspecificcapacitiesfordefinedtechnologies,optimizethegridandplansmartlytheenergytransitiontobeaninstrumenttosupportlocalindustry.IEAPVPSTRENDSINPHOTOVOLTAICAPPLICATIONS202236DIRECTSUBSIDIESANDTAXBREAKSWitharound16%globalmarketshare,9%forthedistributedsegmentand21%ofthecentralizedsegment,directsubsidiesarestillacommontypeofsupportforPV,mostofthetimetheycoveronlyapartofthetotalinstallationcost.PVischaracterizedbylimitedmaintenancecosts,nofuelcostsbuthighupfrontinvestment.ThishasledsomecountriestoputpoliciesinplacethatreducetheupfrontinvestmenttoincentivizePV.DirectsubsidieswereimplementedintheearlyphaseofPVdevelopmentincountriessuchasAustria,Australia,Canada,Finland,Italy,Japan,Korea,Lithuania,Norway,andSwedenjusttomentionafew.InmostcountriesthissupportmechanismhasnotdemonstrateditsabilitytosupportandacceleratePVdevelopmentandwasreplacedbyFITs.Inotherscountriesatrendtoreintroducetothismechanismseemstobeobserved.Inotherscountriesatrendtoreintroducethismechanismseemstobeobserved.ForinstanceinCanada,theprovinceofAlbertaintroducedacapitalincentiveprogramforcommercialPVwhilethefederalgovernmentintroducedoneforhomeowners.InAustriain2021,theFITcametoanend,andeitheramarketpremiumoraninvestmentsubsidycansupportaPVsystem.Thisreturntosubsidiescouldbequestioned.SubsidiesareaconstrainttoPVdevelopmentbecausetheydependonpublicfunding,whichis,bynature,limited.However,theyareeasytosetupwhichexplainstheirutilization.Incentivescanbegrantedbyawidevarietyofauthoritiesorsometimesbyutilitiesthemselves.Theycanbeuniqueoradduptoeachother.Theirlifetimeisgenerallyquiteshort,withfrequentpolicychanges,atleasttoadaptthefinancialparameters.Nexttocentralgovernments,regionalstatesorprovincescanproposeeitherthemainincentiveorsomeadditionalones.Municipalitiesaremoreandmoreinvolvedinrenewableenergydevelopmentandcanofferadditionaladvantages.Insomecases,utilitiesareproposingspecificdeploymentschemestotheirowncustomers,generallyintheabsenceofnationalorlocalincentives,butsometimestocomplementthem.Taxcreditshavebeenusedinalargevarietyofcountries,rangingfromBelgium,Canada,Japanandothers.Italyusesataxcreditforsmallsizeplants.ThedebatewasalsointenseintheUSAin2015whenextendingtheITC(InvestmentTaxCredit),wheretaxrebateisthemaindriver.InSweden,thedirectcapitalsubsidyforPVinstallationsexpiredin2020replacedbyataxreductionprogram.InItalyanewtaxcreditinthefieldofbuildingenergyefficiencyinterventionsincludingPVhasbeenintroduced.TRADEOFGREENCERTIFICATESANDSIMILARSCHEMESGreencertificatesandsimilarschemesbasedonRenewablePortfolioStandard”(RPS)representedaround3%ofthemarket,astableandlowsharewhichisexplainedbythegreatercomplexityofthistypeofscheme.GreencertificatetradingstillexistsincountriessuchasBelgium,Norway,RomaniaandSweden.SimilarschemesbasedonRPSexistinAustraliaandKoreaforinstance.TheregulatoryapproachcommonlyreferredtoasRPSaimsatpromotingthedevelopmentofrenewableenergysourcesbyimposingaquotaofREsources.Theauthoritiesdefineashareofelectricitytobeproducedbyrenewablesourcesthatallutilitiesmustadopt,eitherbyproducingthemselvesorbybuyingspecificcertificatesonthemarket.Whenavailable,thesecertificatesaresometimescalled“greencertificates”andallowrenewableelectricityproducerstogetavariableremunerationfortheirelectricity,basedonthemarketpriceofthesecertificates.Thissystemexistsinvariousforms.StateincentivesintheUSAhavebeendriveninlargepartbythepassageofRenewablePortfolioStandards(RPS).DifferentmultipliersareappliedtofloatingPV.InBelgium,allthreeregionsusethetradingofgreencertificatesforcommercialandindustrialsegments.PVDEVELOPMENTWITHOUTFINANCIALINCENTIVESFigure3.1showsthatin2021,around23%(6%and17%)ofthevolumeofthemarketbecameindependentofsupportschemes:thisimpliesinstallationsnotfinanciallysupportedanddevelopedoutsideoftendersorsimilarschemes.ThisisasignofthePVmarketbecominghighlycompetitive.Theincreaseinenergycostsin2021and2022,andspecificallyelectricityprices,haveenhancedPVcompetitivenessinnumerouscountries.PVdevelopmentwithoutfinancialincentivesisanimportantimprovement,asitbecomesindependentofanysupportschemelimitation.PVMARKETDRIVERSANDSUPPORTSCHEMES/CONTINUED37IEAPVPSTRENDSINPHOTOVOLTAICAPPLICATIONS2022PowerPurchaseAgreementsPowerPurchaseAgreements(PPAs)arelong-termprivatecontractsbetweenaPVproducerandoneorseveralconsumersWhileFiTarepaidingeneralbyofficialbodiesorutilities,commercialPPAsarecontractsbetweenthePVplantownerandanoff-takerfortheelectricityproduced,duringadefinedperiod.SuchcontractsallowtoguaranteeacertainlevelofrevenuesandareincreasinglypopularforunsubsidizedPV.Suchcontractsaremainlydeployedinthewindindustryforthemoment,whiletheirpotentialforPVremainslargelyuntapped.TheEuropeanUnionincitesmemberstatestoremoveadministrativebarrierstolong-termPPAandtofacilitatetheiradoption.ElectricitysoldonelectricitymarketsorthroughPPAshasbeenseeninanincreasingnumberofcountriesin2021.Non-subsidizedmodelsaregainingmomentumforutility-scalePV.Thetrendisclear,PVplantssellingtheirproductiontocorporatecustomershaveemerged.SpainisprobablyleadingthePPAmarket,ifnotworldwide,atleastinEurope.Overthelastyears,moreandmorebilateralPPAsweresignedbetweenproducersandconsumersandalargepartoftheground-mountedinstalledcapacityin2021inSpain,3,5GW,wasdevelopedthroughPPAs.ThereducedLCOEallowsnewmarketsegmentdevelopment,morerecentlyunsubsidizedPPAsalsoappearsinKorea,Denmark,Germany,Italy,andSweden.From2022onwards,theutility-scalesegmentisdevelopingunderunsubsidisedmarketconditionsinSweden.TheUSAandAustraliaarealsomarketswherePPAsaregainingmarketshares.InCalifornia,manyPPAs,sometimeswithrecordlowprices,wereapprovedoverthelastyears.PPAsimplysourcingofsolarelectricitywithoutnecessarilybeingphysicallyconnectedtothepowerplant,asolutionfavouredmoreandmorebylargecompanieswillingtodecreasetheirGHGemissions.MerchantPVMerchant-basedPVplantsareexpectedtoplayagrowingroleinthedevelopmentofthePVmarket.TheyarePVplantswherethebusinessmodelreliesonsalesonelectricitymarkets.Thedesignoftheelectricitymarketplaysanimportantrolefortheemergenceofthistypeofbusinessmodelasthemarketshouldprovidebothshorttermandlong-termincentives.Non-incentivizedSelf-consumptionThePVsystemwillbeconsideredfullycompetitivewhentherevenuesfromthesavingsontheelectricitybill(theself-consumedpart)andtherevenuesfromthesalesofexcessPVelectricitywillcoveroverthelong-termthecostofinstalling,financingandoperatingthePVsystem.Inmostcases,thepriceofretailelectricitywillbehigherthanthewholesaleprice.DistributedPVevolvesrapidlytowardsacompetitivemarket,wherenewplayersandespeciallytraditionalutilitiesstarttoplayaleadingroleThequestionofgridcostsforinstancebecomesmoreimportantwithrisingPVpenetrationandisalreadyleadinginsomecountriestospecifictariffswhicharereducingthecompetitivenessofdistributedPVinstallations.Thearrivalofnewschemesbasedontheenergycommunities’conceptscouldenlargethemarketbutalsoincreasescomplexitywhileinsomecountriesthejoinedPVwithstoragetrend(suchasinGermany)alsopavesthewayforadifferentwayoflookingatPVdevelopmentfordistributedinstallations.InnovatingFinancialSolutionSupportAnincreasingnumberofinvestmentsolutionshaveemergedforthefinancingofsolarinstallations,theseareevenmorerelevantinthecaseofunsubsidizedPV.Thehighupfrontcapacityrequirementsarepushingdifferentbusinessmodelstodevelop,especiallyintheUSA,andtoacertainextentinsomeEuropeancountries.PV-as-a-servicecontributessignificantlytotheUSA’sresidentialmarketforinstance,withtheideathatPVcouldbesoldasaservicecontract,notimplyingtheownershiporthefinancingoftheinstallation.ThesebusinessmodelscoulddeeplytransformthePVsectorinthecomingyears,withtheirabilitytoincludePVinlongtermcontracts,reducingtheuncertaintyforthecontractor.Suchbusinessmodelsrepresentalreadymorethan50%oftheresidentialmarketintheUSA,andsomeutilitiesinGermany,Austria,SwedenandSwitzerlandarestartingtoproposethem,aswewillseebelow.However,theUScaseisinnovativebytheexistenceofpureplayersproposingPVastheirmainproduct.Sinceitsolvesmanyquestionsrelatedtofinancingandoperations,aswellasreducingtheuncertaintyinthelong-termfortheprosumer,itispossiblethatsuchserviceswillfurtherdevelop,alongwiththenecessarydevelopmentswhichwillpushupdistributedPV.IEAPVPSTRENDSINPHOTOVOLTAICAPPLICATIONS202238Similarly,thepay-as-you-gofinancialmodelshavebeenverysuccessfulinthedeploymentofSolarHomeSystems(SHS)andsolarkitsinAfricancountriesinthepastyearsandareexpectedtofurtherdrivethedevelopmentofPVintheresidentialandoff-gridsegments.Pay-as-you-gomodelsaredirectlyinspiredfromprepaidmobilepaymentschemes;theuserspayamonthlyfeeoraccordingtotheirneedsandownthesolarkitwhenenoughcreditshavebeenpaid.PROSUMERSANDENERGYCOMMUNITIES’POLICIESSELF-CONSUMPTIONINREGULATORYENVIRONMENTSInrecentyearsself-consumptionregulationsareincreasinglybeingimplementedindifferentcountries;theaimistoempowerprosumerstoplayanimportantroleintheenergytransition.Measuresinfavourofdistributedgenerationarestimulatinggreateruseofrenewablesourceswithfurtherpositiveeffectssuchasastrongerpenetrationofelectricityinfinalconsumption,thereductionoftransmissionanddistributioncostsandnewinvestmentsinintegratedenergymanagementprojects(electricity,heat,efficiency,storage,etc.).Self-consumptionisallowedonewayoranotherinmanycountriesbuttheregulationsinplacediffersignificantly.Sometimeswithanadhoclegalframework,sometimeswithout.Theveryprincipleofself-consumptionisalwaysthesame:theelectricitythatisproducedbythePVsystemandlocallyconsumedreducesmechanicallytheelectricitybilloftheconsumer.Butthisreductionisnotimplementedinthesamewayinallcountries.ItisgenerallyacceptedthatvariablegridcostsonthepartofPVelectricitythatisself-consumedshouldnotbepaid.Inamoregeneralway,severalcountrieshaveeithermodifiedthestructureofthegridtariffs(toincreasethefixedpartandreducethevariablepartlinkedtotheconsumption).InAustraliaandFrance,theshiftfromvariabletofixedgridcostsisdebatedactivelyandcouldleadtoachangeintheelectricitytariffstructurethatcouldbedetrimentaltoPVdevelopment.IntheUSA,anintensedebateonthecostofnet-meteringpoliciesledtosmallgridcostsincreasesforprosumers.ThecaseofIsraelismorespecific,withdedicatedtaxesforbalancingandback-up.Specificgridtaxesarestartingtobeimplementedinsomecountries,withtheaimtocompensateforsavedgridcostsduetonet-meteringpolicies.TheSpanishgridtaxistheonlyexampleofaspecifictaxforpureself-consumers.InseveralregionsinBelgiumagridtaxwillbeimplementedforprosumersbenefittingfromnet-meteringwhichallowsfullcompensationoftheirPVconsumption,gridcostincluded.SomecountriesimposespecificgridcodesonPVsystemownerswhoareself-consumingelectricity.InAustraliaforinstance,gridinjectionlimitsexistinsomestates.Denmarkimposesspecificgridcodes.GermanyrequiresspecificcompliancewithspecificgridcodesforallPVsystems.Othercountrieshaveimposedspecificgridcodesaswell.Inmostcountries,theownershipofthePVsystemcandifferfromtheelectricityconsumer.Thisisacomplexsituationwithnationalregulationsandnoclearpatternappearstodayregardingthird-partyownership.Whilemostcountriesacceptself-consumptionschemesforPVsystemsinstalledonconsumptionsites,somespecificitiesexistinvariouspartsoftheworld.Differentformsofcollectiveself-consumption,bothlocalanddelocalized,arebeingimplemented.COLLECTIVESELF-CONSUMPTIONCollectiveself-consumptionenablesthesharingofelectricitybetweenseveralusers,butalsoundersomeconditions,betweendistinctindividualbuildings.Self-consumptionincollectivebuildingsorsitesallowsoneormoreproductionunitstofeedtheirelectricitytoseveralconsumers,usingapredefinedsplitkey.Thetypicalcaseconcernsamulti-apartmentbuilding,withonesinglePVplantfeedingseveralorallconsumersinthebuilding.Theuseofself-consumptionincollectivebuildingsexistsinPortugal,Spain,Austria,Canada,Sweden,France,Switzerland,GermanyorItalytomentionafew.Decentralizedordistributedself-consumptionisdevelopedwiththeaimofdisconnectingproductionandconsumptionofPVelectricity.ThiswouldallowoneorseveralPVproducers(evenutility-scaleplants)tofeedoneormoreconsumersatareasonabledistancesothattheuseofthepublicgridisminimized.Suchdisconnectionbetweenproductionandconsumptionwouldhelptoalleviatetheconstraintofthelocalself-consumptionratio,andtheconstraintofnon-PVsuitableroofsandallowforbetteruseofavailablespaceonroofsorland.Theseschemesallowself-producedelectricitytoreducethePVsystemowner’selectricitybill,on-siteorevenbetweendistantsites(Mexico,Brazil,France).VariousschemesexistthatallowcompensationforelectricityconsumptionandPVelectricityproduction,somecompensateforrealenergyflows,whileothersarecompensatingforfinancialflows.Whiledetailsmayvary,thebasicsaresimilar.Thesavingsontheelectricitybillcan39IEAPVPSTRENDSINPHOTOVOLTAICAPPLICATIONS2022bedecreasedifgridtaxesorleviesaretobepaidontheself-consumedelectricity.Fixedorcapacity-basedgridtariffscanalsohaveadetrimentaleffectontherevenuesfortheprosumers.InItaly,since2020ameasureallowsconsumersinthesamebuildingorina“energycommunity”toshareelectricityandthereformofthelawisunderway,whichwillmakeitpossibletosetlessstringentlimitsforparticipants.InSweden,ithadbeenallowedin2021formulti-familyhouses.InFrancesince2021,virtualself-consumptionwithinabuilding,a2km,orexceptionally,a20kmgeographicalperimeterisallowedandFITforexcesselectricity.InGermany,buildingownerscanproduceandsellelectricitytotheirtenantswhichmakestheinvestmentmoreattractive.TheUKhasalsoimplementedafavourableframeworkforcollectiveprosumers.Othercountrieshavedefinitionsbutthesearenotyetfullyimplemented.InAustria,collectiveself-consumptionwasintroducedafewyearsago,butbytheendof2021,onlyhundredsofprojectswererecordedasitisfrequentlynotseenasasufficientfinancialbenefitbytheusersasintheotherpioneercountries.Thesetrendswillmaybereverseifhighretailpricesofelectricityremainandwiththeintroductionofenergycommunities.InAustralia,thesupportprogramclosedin2021.CurrentnetworkpricingregulationsinAustraliastipulatethatfullnetworkchargesmustbepaidevenforlocallytransmittedelectricity,whichactsasabarriertocollectiveself-consumptionorvirtualnet-metering.MicrogridsthatincludePVoperateacrossthecountry,particularlyinnewhousingdevelopmentsandinpowersuppliesforremotecommunities.InSwitzerlandcollectiveself-consumptionisallowedbymostDSOs,consumershavetobecontiguous,thepublicgridisnotusedtheinternalmeteringisthenundertheresponsibilityoftheconsortium.IntheUSA,communitymicrogridsareemergingtoreducethecostofelectricityconsumptionandprovidelocalresiliencethroughstorageandbackuppower.ENERGYCOMMUNITIESINTHEEUCONTEXTWhileself-consumptionisallowedinmostEuropeancountries,Europehasdecidedtogoastepfurtherwiththecomprehensiveupdateofitsenergypolicy,the“CleanEnergyPackage”.TheEuropeanUnionintroducednewprovisionsontheenergymarketdesignandframeworksfornewenergyinitiatives.Specifically,theactualrecastsoftherenewableenergydirective(REDII)andtheelectricitymarketdirective(EMDII)providebasicdefinitionsandrequirementsfortheactivitiesofindividualandcollectiveself-consumption.TheEuropeanUnionintroducedtheconceptofRenewableEnergyCommunities(REC)andCitizenEnergyCommunities(CEC).RECshouldallowcitizenstosellrenewableenergyproductiontotheirneighbours,whilesomecrucialcomponentsarethedefinitionoftheperimeterandthetarifficationforgriduse.Thosekeycomponentsaredefinedinthenationalimplementationinthememberstates.ThisconceptofenergycommunitiesislikelytoexpandtheexistingPVmarketsegmentsandallowcostreductionsforconsumersnotabletoinvestinsolarinstallationthemselves.DELOCALIZEDOR“VIRTUAL”SELF-CONSUMPTIONWhileself-consumptioncouldbeunderstoodasthecompensationofproductionandconsumptionlocally,decentralized(or“Virtual”)self-consumptionexpandstodelocalizedconsumptionandproductionandopensawiderangeofpossibilitiesinvolvingadhocgridtariffs.Inthatrespect,prosumersatdistrictlevelwouldpayfewergridcoststhanprosumersataregionalornationallevel.Someutilitiesevenlaunchedpilotprojectsbeforetheregulationswereofficiallypublished(asinAustriaorSwitzerland).Inthiscase,innovativeproductsarealreadymixedwithPVinstallations,PVinvestmentandvirtualstorage.ThisevolutionwillbescrutinizedinthecomingyearssinceitmightopennewmarketsegmentsforsolarPV.Buttheseschemescreatecomplexquestions,especiallyregardingtheuseofthegrid,thelegalaspectsrelatedtocompensatingelectricitybetweenseveralmetersandtheinnovativeaspectofthescheme.Theopportunitiesopenedupbysuchconceptsarewide-ranging.Forinstance,thiscouldallowcharginganelectricvehicleattheofficewithPVelectricityproducedathomeorsharingthePVelectricityinallpublicbuildingsinasmalltownbetweenthemdependingontheconsumptionorinstallingautility-scaleplantinthefieldnearbyavillagetopowerit.Optionsarenumerousandimplyfairremunerationofthegridtobecompetitiveforall.UsingPVelectricityinadecentralizedlocationimpliestheuseofthepublicgrid,distributionoreventransmissionandwouldrequireputtingafairpriceonsuchuse.WithPVbecomingcompetitive,suchideasareemergingandcoulddevelopmassivelyundertherightregulations.Tobettercompareexistingandfutureself-consumptionschemes,theIEAPVPSpublishedacomprehensiveguidetoanalyseandcompareself-consumptionpolicies.This“ReviewofPVSelf-ConsumptionPolicies”proposesamethodologytounderstand,analyseandcompareschemesthatmightbefundamentallydiverse,sometimesunderthesamewording.Italsoproposesananalysisofthemostimportantelementsimpactingthebusinessmodelsofallstakeholders,fromgridoperatorstoelectricutilities.IEAPVPSTRENDSINPHOTOVOLTAICAPPLICATIONS202240ENERGYTRANSITIONPOLITICSSUSTAINABLEBUILDINGREQUIREMENTSThebuildingsectorhasamajorroletoplayinPVdevelopmentandsustainablebuildingregulationsdrivePV’sdeploymentincountrieswherethecompetitivenessofPVisclose.Theseregulationsincluderequirementsfornewbuildingdevelopments(residentialandcommercial)butalso,insomecases,onpropertiesforsale.PVmaybeincludedinasuiteofoptionsforreducingtheenergyfootprintofthebuildingorspecificallymandatedasaninclusioninthebuildingdevelopment.EuropeanUnionadoptedseveralproposalstomaketheEU’sclimate,energy,transportandtaxationpoliciesfitforreducingnetgreenhouseemissionsbyatleast55%by2030.ThepublicationoftheEuropeanCommission’sSolarStrategyin2022ispartoftheRePowerEUpackage.Itpresentsfourinitiativestoovercometheremainingshort-termchallengesandfirstofthemispromotingquickandmassivePVdeploymentviatheEuropeanSolarRooftopsInitiative.ThatcanstronglyinfluencethedecentralizedmarketinEuropeanUnionstates.Forinstance,inFrance,thethresholdformandatorysolarorlivingroofsforcommercialandindustrialbuildingsorcoveredcarparkshavebeendecreased.Actualthermalregulations,andincentivehigh-performancebuildinglabelsencouragephotovoltaicsandself-consumption.InAustria,manycountieshaveregulationsorincentivesforbuildingaPVsystem.UptonowinViennaandStyriaitisobligatorytoinstallaPVsystemundercertainconditions.InKorea,theNREMandatoryUseforPublicBuildingsProgrammeimposesonnewpublicinstitutionbuildingswithfloorareasexceeding1000squaremeterstosourcemorethan10%oftheirenergyconsumptionfromnewandrenewablesources.InBelgium,Flandersintroducedasimilarmeasuresince2014.ThefirstresultsshowthatPVischoseninmorethan85%ofthenewbuildings.InDenmark,thenationalbuildingcodehasintegratedPVtoreducetheenergyfootprint.ELECTRICMOBILITYThedevelopmentofelectricmobilityrepresentsanimportantforthePVsectorastheneedforcleanenergywillincrease.Furthermore,chargingpointscanbecoupledwithsolarPVonparkingsheltersforinstance.InEurope,Nationalandlocal-levelactionsexisttosupportEVdeployment,anoveralltrendistheincreasingnumberofEuropeancitiesplayingaprominentroletoaddressmarketbarrierstoEVuptake.Theaimofthecities’programsismainlytodeploycharginginfrastructureinanintegratedandhomogenouswayandtoincreasethevisibilityofEVsolutions.InAustria,thepurchaseofelectricvehiclesforprivateuseissupported.Theproofoftheuseofelectricityfrom100%renewableenergysourcesisafundamentalpartofthesupportmechanism,whichistheclearlinktoownPVproductionorelectricityconsumedfromhydropower,PV,andwind.HYDROGENPRODUCTIONTherecentinvasionofUkrainebyRussiaandtheinternationalsanctionsthatfollowed,pushedgaspricesupwards.Thismightincreasethedrivetowardsahydrogen-basedeconomyinEurope.Solarfuels,storageandotherhydrogen-basedapplicationswillrequiremassivePV,windandotherRESdevelopment.DistributedHydrogenproductioncouldbedrivenbyDPVaswell,pushingforhigherdemandfordistributedPV-H2production.Thisisstilladistantprospectandsignificantdevelopmentsbefore2025inEuropeareunlikely,butthiscouldstarttobecomeabusinessrealityaround2025.TheCommissionexpectsgreenhydrogentoplayapivotalroleinthedecarbonisationofsectorswhereelectrificationmightbelessfeasibleandtobridgesomeofthegapsforseasonalvariationswhichiscrucialforthefurtherdevelopmentofsolarPV.SeveralfundsareavailabletopromoteresearchandpilotprojectstoincreasethecompetitivenessofgreenhydrogenandtheEUindustryhasdevelopedanambitiousplantoreachbetween15GWand40GW,onalowandhighcasescenariorespectively,ofelectrolysersinEuropeby2030.ELECTRICITYSTORAGEInthecurrentstageofdevelopment,electricitystorageremainstobeincentivizedtodevelop.However,thecostofstorageispursuingitssteepdeclineandstorageisbecomingmoreattractiveinagrowingnumberofmarkets.Duetothecostdeclineofstorage,solarpowerplantswithonsitestorageareincreasinglyattractivefordevelopersasthecombinationwithstorageallowstosmooththepoweroutput,todeliverancillaryservicesortoreduceconnectioncostsifpeakinjectionisreduced.AmongstthecountriesthathaveissuedlawstoincentivizebatterystorageinPVsystemsto2021,Austria,thesubsidiessupporttheconstruction,expansionandcombinationofneworexistingPVsystemswithelectricitystorageifstoragecapacityisatleast0,5kWhperkWpeakisinstalled.InAustralia,moststategovernmentsarenowofferingsometypeofincentiveforsolarplusbatteryinstallationsortoaddabatterytoanexistingsolarsystem.InFrancein2020,atenderwaslaunchedtoprovidelowcarbonflexibilityforthegrid,witharoundtwo-thirdsoftheselectedprojectsbasedonstorage,therestonloadshifting.Thistenderdoubledthe41IEAPVPSTRENDSINPHOTOVOLTAICAPPLICATIONS2022cumulatedinstalledcapacityconnectedtothemedium-voltagegrid.InAustralia,Victoriahasannouncedaplanforcleanenergyincludingthebiggestbatteryinthesouthernhemisphere.In2021,themarketoperatorchangedthesettlementperiodforself-consumptionfrom30minuteto5min,providingabetterpricesignalforinvestmentinfasterresponsetechnologies,suchasbatteriesandgaspeakinggenerators.Therearenumeroustrialsofvirtualpowerplants,demandresponseandbatteryintegration.StorageisakeyelementofacarbonneutralenergysystemrelyingonRESelectricity;therefore,theEuropeanCommissionactivelysupportsenergystoragethroughresearchandinnovationfunds.SomeconsiderthatstoragedevelopmentforPVelectricitywillbemassivelyrealizedthroughelectricvehiclesconnectedtothegridduringalargepartofthedayandtherefore,willbeabletostoreanddeliverenergytoconsumersatalargerscalethansimplebatteries.Thisvehicle-to-gridorV2Gconceptsarebeingexploredandtestedinseveralcountries,withtheNetherlands,SwitzerlandandJapanasfront-runners.GRIDINTEGRATIONWiththeshareofPVelectricitygrowingintheelectricitysystemofseveralcountries,thequestionofintegrationtotheelectricitygridisbecomingmoreacute.Insomecountries,temporaryorpermanentcurtailmentruleshavebeendevisedtoavoidgridreinforcementortoavoidgridcongestioninthemeantime.InChina,theadequacyofthegridremainsoneimportantquestionthatpushedthegovernmenttofavourthedevelopmentofdecentralizedPVinthefutureoverlargeutility-scalepowerplants.ItisinterestingtonotethatmanytransmissionsystemoperatorsareincreasingthepenetrationofPVintheirscenariosandtrytoassesstheimpactofsuchdevelopments.SuchscenariosandcalculationshavebeendonebymanyTSOsandshowhowimportantPVdevelopmentstartstobecome.TheEUalsosetanindicativetargetof15%interconnectiontowards2030and93GWadditionalcross-bordercapacityisneededby2040toachievetheEUGreenDeal.Interconnectionswithneighbouringcountriescombinedwithinternationalelectricitytradecontributetolowerelectricityprices,improvesecurityofsupplyandreducetheneedtobuildnewpowerplantsandflexibilityassetstomanagerenewablepowersourceslikesolarandwind.Despitetheoverallbenefitsofgridexpansion,thecostsofnetworkupgradesmuststillbedistributedbetweentheendusersthroughgridtariffs,alsocallednetworktariffs.Networktariffsaredesignedtorecoverthecostsofinvestingandoperatingelectricitynetworks.Tariffsshouldbeusedtoincentiviseefficiencyinbothnetworkuseandinvestment.Forinstance,gridreinforcementisnotalwaysthemostcost-efficientwaytointegrateRES:insomecases,localstorageordemandsidemanagementmightbeavailableatalowercost.Therefore,gridtariffsshouldincreasinglybetime-variableandlocation-based.Cost-reflectiveratestructuresshouldprovidetherightincentivestodeveloplocalstorageorloadcontrol.Tariffsareeffectivetoolstodriveinvestments,however,someobjectivesmayrequiredifferenttypes,sometimesincompatible,pricesignalsorsomeobjectivesmayevolveovertime.Furthermore,despitetherolethatgridtariffscanplaytogivepricesignalstoconsumers,othertoolsexistandcanberequiredtoachievecertaingoals.Therefore,thepriorityofgridtariffsshouldbetoaccuratelyreflectcostwhilealsokeepingtheoverallrationaletransparent,future-proofandsimpleforconsumerstounderstandandimplement.Acoherencybetweendistributionandtransmissiongridtariffsisneededtoavoidconflictingpricesignals,hencemarketresponsesthatcanceleachotheroutforinstance.BysubmittingPVapplicationstostrictergridcodesandregulations,connectingPVsystemstothegridbecomesmorecomplexandthereforemorecostly.Theincreasedneedtoprovideancillaryservicestothegrid,includingfrequencyresponseforinstance,andcurtailment,changesthenatureoftheconnectionforthePVsystemandcanincreasepricesorreducerevenues.ThisinfluencesthecompetitivenessofPVsolutions.GridcodeshavebeenreviewedintheEuropeanUnioninanattempttoharmonisegridcodesbetweenmemberstatesandwillleadtoadditionalconstraintsforPVsystems.InAustralia,specificgridcodeshavebeenadaptedforPVandmorewillcome.InMexico,specificgridrequirementshaveinsomecasesbeenimposedtobiddersintenderingprocesses.Inanycase,gridintegrationpolicieswillbecomeanimportantsubjectinthecomingyears,withtheneedtoregulatePVinstallationsindenselyequippedareas.IEAPVPSTRENDSINPHOTOVOLTAICAPPLICATIONS202242Gridcostsareanotheressentialelement,whichdealswithPVcompetitiveness,especiallyfordistributedPVapplicationsunderself-consumption.Sincethecompetitivenessofthesolutiondependsontheabilitytoreducetheelectricitybilloftheconsumer,thegridcostsmightaffecttheoutcometremendously.Inparticular,severalcountriesdiscusstheshiftofgridcostsfromanenergy-basedstructuretowardsacapacity-basedstructure:thiswouldaffectsignificantlytheprofitabilityofdistributedPVplantsifallgridcostswouldhavetobepaid,evenwithlargesharesoftheenergyproducedonsite.Thereasonbehindthisoriginatesfromthelossofincomesofgridoperatorswhoseetheirrevenuesandthereforetheircapacitytoinvestandmaintainthegrid,beingreducedsignificantlyifprosumersorsemi-independentenergycommunitieswouldbecomethenewnormal.Theexampleofdecentralizedself-consumptionindicateshowimportantitwillbeforthegridstoknowtheirrealcostsandinvoiceprosumerswithafairtariffdependingontherealuseofthegrids.Thechangingelectricitylandscapewiththefastdevelopmentofelectricmobilityinseveralcountries,thedevelopmentofdistributedstorageandtheexpectedelectrificationofheating,woulddeservealong-termanalysistofindtherightbalancebetweenthedifferentincentivesthatgridtariffsultimatelyprovide.INDUSTRIALANDMANUFACTURINGPOLICIES2021hasseennumerousinitiativesfavouringlocalmanufacturingatvariousstepsofthePVvaluechain.TheincreasingimportanceofPVintheenergysector,anditsexpectedgrowtharepushingnumerousgovernmentstosupportlocalmanufacturingthroughpolicies,subsidiesandregulations.Whiletradeconflictshavediminishedinintensityinthelastyears,thewillingnesstosupportlocalproductionhasincreasedwithinitiativesinEurope,theUSA,India,MoroccoorSaudiArabia.ThisreflectsthegrowingperceptionoftheimportancethatPVcouldtakeinthecomingyearsandthewillingnesstosecurestrategicproductioninsomecountries.Thistrendisincreasingglobally,oftenwithoutaclearunderstandingoftheindustrydynamicsandthecomplexitiesofPVmanufacturing,whichwillleadtofewerrealprojectsthanwhatsomegovernmentswouldliketosee.Inadditiontothis,thegrowingshareofPVintheproductionofsomecomponents,likeglasssheetsforinstance,startstorepresentagrowingshareofthetotalproduction,withlocalandglobalimpactsincaseofshortageasseeninChinain2021.Inthatrespect,localmanufacturingwillimplyaccesstoglobalvaluechainsandtheroleofalreadyexistingglobalactorsshouldn’tbeneglected.TheEUSolarEnergyStrategyispartoftheREPowerEUplan.BylaunchingaEuropeanSolarPVIndustryAlliancethataimstofacilitateinnovation-drivenexpansionofaresilientindustrialsolarvaluechainintheEU,particularlyinthePVmanufacturingsector.43IEAPVPSTRENDSINPHOTOVOLTAICAPPLICATIONS2022fourTRENDSINPVINDUSTRYThischapterprovidesabriefoverviewoftheupstreamanddownstreamsectorsofthePVindustry,intendingtosummarisehighlightsfrom2021andthefirsthalfof2022.ThefirstpartcoversmanufacturingactivitiesoftheupstreamsectorofthePVindustryfromfeedstocks(polysilicon,ingots,blocks/bricks,andwafers)toPVcellsandmodulesasdescribedinfigure4.1andactivitiesofthebalance-of-systems(BOS).Thesecondpartcoversactivitiessuchasprojectdevelopmentandoperationandmaintenance(O&M).Throughout2021,anincreaseofthepricesofPVmodulesandothercomponentswasobserved.Thisaffectedplannedprojects.ThepricelevelofPVmoduleswasmostlydrivenbythehighpolysiliconprice.Thespeedofpolysilicondemandincreasewashigherthanthatofcapacityenhancements.Thissituationcontinuedinthefirsthalfof2022.Otherfactors,suchasthesilverandaluminumpriceincrease,whicharerespectivelyusedforelectrodesandframes,alsoaffectedthepricehikeofPVmodules.Inaddition,highlogisticcostsalsocontributedtothepriceincrease.Theshortageofsemiconductorsalsoimpactedinverterssupply.In2021,Chinaremainedtheworld’slargestproduceralongthePVsupplychainandfurtherenhancementofmanufacturingcapacitywasreported.WhilePVpowergenerationisexpectedtotakeasignificantroleinenergytransition,risksofheavyconcentrationofmanufacturinglocationshavebeenpointedout.Policyandmeasuresoflocalmanufacturinghavestartedinvariousregions.Tradeconflictandpoliticalstanceoverforcedlaboralsobackedthesetrends.THEUPSTREAMPVSECTORPOLYSILICONPRODUCTIONWafer-basedc-SitechnologyremainsdominantforproducingPVcells.Inthatrespect,thissectionfocusesonthewafer-basedproductionprocess.Theglobalpolysiliconproduction(includingsemiconductorgradepolysilicon)in2021wasabout644100tonnes.Polysiliconusedforsolarcellsincreasedfrom497300tonnesin2020toapproximately.604812tonnesin2021,while39300tonnesofpolysiliconwereusedforthesemiconductorindustry.Theproductionvolumeofpolysiliconforsolarcellsaccountedforabout94%oftotalproductionofpolysiliconin2021.Figure4.2showstheshareofpolysiliconproductionbycountry.IEAPVPSTRENDSINPHOTOVOLTAICAPPLICATIONS202244IEAPVPSmembercountriesproducingpolysiliconareChina,Germany,USA,Malaysia,Korea,NorwayandJapan.Chinacontinuedtobethelargestproducerandconsumerofpolysiliconintheworld,Chinaproduced623000tonnesofpolysiliconin2021,79%oftheglobalproduction.China’spolysiliconproductioncapacityaccountedfor78%oftheglobalproductioncapacityin2021,anincreaseof3,%comparedto75,%in2020.Aswasmentioned,mostofnewcapacityadditionisplannedinChinaincludingnewpolysiliconfactoriesbynewentrants.Theproductioncapacityin2022isexpectedtoreach992000tonnes/yearinChinaifalltheannouncedplanswouldbeimplemented.ThesecondlargestproducerisGermany,where65000tonnesofpolysiliconwereproducedinwhichalmost60000canbeconsideredtohavebeenconsumedforPVproduction.Malaysiaisthethirdlargestproducerwithacapacityof,with30000tonnes/year.IntheUSA,mostoftheproductionwasusedbythesemiconductorindustryFIGURE4.1:PVSYSTEMVALUECHAIN(EXAMPLEOFCRYSTALLINESILICONPVTECHNOLOGY)DOPINGMATERIALCASTSILICONFURNACESINGLECRYSTALGROWINGFURNACESLICINGEQUIPMENTTEXTURETREATMENTEQUIPMENTDIFFUSIONFURNACEDEPOSITIONEQUIPMENTSCREENPRINTINGEQUIPMENTFIRINGFURNACELAMINATORQUARTZCRUCIBLEWIRE(FORWIRESAWSLICING)ABRASIVEGRAIN,SLURRY(FORWIRESAWSLICING)ETCHING&TEXTURINGSOLUTIONANTIREFLECTIVEFILMMETALLIZATIONMATERIALTEDLAR/PETEVAINTERCONNECTORWHITETEMPEREDGLASSALUMINUMFRAMEJUNCTIONBOXINVERTERBATTERYMOUNTSTRUCTUREEQUIPMENTFORGRIDCONNECTIONVARIOUSTYPESOFLOAD,DEPENDINGONAPPLICATIONSDESIGN,INSTALLATIONTECHNOLOGIESWAFERSILICONFEEDSTOCKPVSYSTEMMONO-CRYSTALLINESiMULTI-CRYSTALLINESiCELLMODULESOURCEIEAPVPS&OTHERS.FIGURE4.2:SHAREOFPVPOLYSILICONPRODUCTIONIN2021CHINA,79%GERMANY,10%OTHER,2%USA,5%MALAYSIA,4%SOURCEIEAPVPS,RTSCORPORATIONINCLUDINGPOLYSILICONFORSEMICONDUCTORSTHEUPSTREAMPVSECTOR/CONTINUED45IEAPVPSTRENDSINPHOTOVOLTAICAPPLICATIONS2022asinthepreviousyear,duetotheChinesegovernmenttariffsimposedontheUS-madepolysilicon.Norwayreportedactivitiesofpolysiliconmanufacturersadoptingthemetallurgicalprocessaimingatloweringtheproductioncost.InNorway,approx.6500tonnesofpolysiliconareestimatedtohavebeenproducedin2021.InJapanandKorea,polysiliconproductionismainlydedicatedtothesemiconductorindustry.Asupplyanddemandgapofpolysiliconwasforeseenin2021.Thepolysiliconpriceincreasedfrom10,USD/kgbytheendofDecember2020to29USD/kgbytheendofMay2021.InJune,theChinesePhotovoltaicIndustryAssociation(CPIA)issuedastatementurgingthenationalgovernmenttotakeappropriateactioninresponsetothesoaringpolysiliconprices.Afterwards,thepolysiliconpriceshowedashortdropduringJulyandAugust2021However,duetotheelectricitycrunchthatoccurredandtheshutdownofsomepolysiliconplants,thepricesreached33USD/kgbytheendofSeptember.In2022,thehighpricesmaintainedforpolysiliconduetothedemandgrowthandtotheshutdownofseveralplants,becauseoftheelectricityshortageinChina.Bytheendof2022,theglobalmanufacturingcapacityofpolysiliconisexpectedtoreachmorethan1650000tonnes/year,morethandoubleofthepreviousyear.Ifthenewpolysiliconplantswouldstartoperationsasscheduled,astabilizationofthepolysiliconpricesisexpectedafterthesecondhalfof2022.Inthefirsthalfof2022,Chinaproduced365000tonnesofpolysilicon,a53%increasefromthesameperiodin2021.Thepolysiliconpriceremainedhighduetothedemandgrowthandthegapbetweensupplyanddemand.InJuly2022,onepolysiliconplantshutdownduetoanaccidentandseveralplantshaltedoperationforregularinspection.ThereportedspotpriceofpolysiliconasoftheendofJuly2022reached38USD/kg.WiththeimprovementofconversionefficiencyofPVcellsandmodulesandtheeffortstoreducetheuseofmaterials(thinningofwafers),theamountofpolysiliconusedfor1Wofwafer(consumptionunitofpolysilicon)hasbeendecreasingyearafteryear.In2021,itisestimatedthataverage3,1g/Wofpolysiliconwasusedforasolarcell,anditdecreasedtoaverage2,7g/Win2021.Comparedto6,8g/Win2010,theconsumptionunitofpolysilicondecreasedatapaceof~9%annually.MostofmajorpolysiliconmanufacturersusetheSiemensprocess,whichhasbeenconceivedasamanufacturingprocessofpolysiliconforthesemiconductorindustry.ItisestimatedthattheSiemensprocesspolysiliconaccountedfor98%ofthetotalproduction.Reportedproductionefficiencyhasimproved,andtheenergyconsumptionofthewholeprocesstoproducepolysilicondecreasedfrom66,5kWh/kgin2020to63kWh/kgin2021.Thedecreaseofelectricityconsumptionunderthereductionprocesshasbeenachievedbytheeffortsincludingthefollowing:1.thedevelopmentandcommercializationoflarge-scalereductionfurnaces;2.theimprovementoftheinnerwallmaterialsofthefurnace;3.thereplacementoftheconventionalsilicontubewithasiliconcoreand4.theadjustmentofthegasmix.Ithasbeensaidthatelectricityconsumptioncanbefurtherreducedbyadditionalprocessoptimizationandtheeconomyofscale.Itisassumedthatitwouldcontributetothereductionofpolysiliconprices.BesidestheSiemensprocess,fluidizedbedreactor(FBR)isusedtoproducepolysilicon.Theadvantageoftheprocessisalowerenergyconsumptionandgranularshapedproducts,whichcanbefullypackedinthecrucibles.InJuly2022,GCLTechnologyinChinastartedoperationsoftwonewFBRprocessplantsinJiangsuandLeshanwith30,000tonnes/yearand100000tonnes/yearcapacity,respectively.AccordingtoGCL,thetotalelectricityconsumptionofthisprocessis14,8kWh/gandthequalitymeetstherequirementforn-typesc-Siwafers.In2021,theUSAdecidedtobanUSimportsofmaterialfromChinese-basedHoshineSiliconIndustrythatproducesmetallicsilicon,abasematerialofpolysilicon,.Withthismeasure,futureproductionlocationsmightchangebutforthetimebeing,Chinaisassumedtoremaintheglobaltopproducerofpolysilicon.Then,inJuly2021,theUSadministrationestablishedUyghurForcedLaborPreventionAct(UFLPA)andstartedtoenforcethebanonsolarproductsmadeinXinjianUyghur.Becauseofthismeasure,newpolysiliconplantsareplannedinInnerMongoliaandotherregionsoutsideofXinjianUyghur.Themeasureisexpectedtoacceleratethetraceabilityoftheproduct’sorigins.ItisalsoexpectedtotriggeranincreaseoftheUSpolysiliconproductionforthePVsectorwiththeBidenadministration’seffortstorecovertheUSPVmanufacturing.INGOTS&WAFERSToproducesc-Siingotsormc-Siingots,thebasicinputmaterialconsistsofhighlypurifiedpolysilicon.Theingotsneedtobecutintobricksorblocksandthensawnintothinwafers.Conventionalsiliconingotsareoftwotypes:sc-Siingotsandmc-Siingots.Thefirsttype,althoughwithdifferentspecificationsdependingonpurityandspecificdopants,isalsoproducedformicroelectronicsapplications,whilemc-SiingotsareonlyusedinthePVindustry.Ingotmanufacturersareinmanycasesalsowafermanufacturers.IEAPVPSTRENDSINPHOTOVOLTAICAPPLICATIONS202246Inadditiontomajoringot/wafermanufacturers,somePVcell/modulemanufacturersalsopartlymanufacturesiliconingotsandwafersfortheirownin-houseuse.Duetothecostpressure,someofthesemajorPVmodulemanufacturersthatestablishedverticallyintegratedmanufacturingareshiftingtoprocuringwafersfromspecializedmanufacturersbecauseofthecostandqualityadvantages.Theglobalwaferproductionamountedto233GWin2021,a39%increasefrom2020.Theproductioncapacityofwafersasoftheendof2021reached415GW/yearfrom218GW/yearin2020.Itisnotablethatproductioncapacityandthevolumeformc-Siwafersdecreasedwhilethoseofsc-SiwafersincreasedduetothedemandforhigherefficiencyPVmodules.AsshowninFigure4.3,Chinahasmorethan97%oftheglobalproductionofwafers.In2021,Chinaproduced226,6GWofwafers,a40%year-on-yearincrease.Amongthem,around22,6GWofwafersareexportedtootherPVcellmanufacturingcountriessuchasMalaysia,Vietnam,Thailand,Korea,TaiwanandIndia.FIGURE4.3:SHAREOFPVWAFERPRODUCTIONIN2021CHINA,97%OTHER,3%SOURCEIEAPVPS,RTSCORPORATIONInthefirsthalfof2022,Chinamanufactured152,8GWofwafers,a45,5%increaseofthepreviousyear.In2022,furtherincreaseoftheshareoflarger-sizedwafersisexpected.Tungstenwiresareusedinsteadofdiamondwires,inordertoreducethewaferthickness.Thespotpriceofc-Siwafersgenerallyfollowsthepriceofpolysilicon.InJanuary2021,thepriceofsc-Siwafer(158,75mm/161,75mm)was0,34USD/pieceandincreasedto0,74USD/pieceinNovember2021.InJuly2022,thereportedpriceofthesamesizewas0,779USD/piece.Lagerwafers(182mm)werepricedat0,969USD/piece.OutsideofChina,wafermanufacturingcapacitieswerereportedinMalaysia,Vietnam,NorwayandTaiwan.Newcapacitieswereannouncedinseveralcountriesin2021andlater.InIndia,EmmveePhotovoltaicPowerisplanningverticalproductionfromwaferstoPVmodules.CompaniessuchasCILSolarPVareplanningwaferproductioninIndiautilizingthegovernmentsubsidy.AstrasunSolarinHungaryisplanningtoestablish1,8GW/yearlineinaverticalproductionplant.Frenchcompany,CarbonisplanningtoincludewafercapacityinFrance.InRussia,HevelSolarisplanning1,3GW/yearofproductioncapacityasapartofHJTPVcell/moduleproduction.RussianUnigreenEnergyalsoworkedon1,3GW/yearproductionlineofn-typeingotsandwafers.InSpain,GreenlandGigafactoryannouncedaplantoestablishawaferproductionfactoryinSevillaaspartofaplantoestablishverticallyintegratedPVfab.InTurkey,KalyonSolarTechnologiesestablisheda500MW/yearPVmanufacturingplantincludingthewaferprocess.InIndia,wafermanufacturingisplannedbyseveralcompaniesasapartofPVmanufacturingplanscombinedwiththeutility-scaleprojectsrights.ChinesecompaniesalsoplantohavewafercapacityproductionoutsideofChina.Forexample,ETSolarisplanningtobuilda5GW/yearwaferplantinVietnam.JinkoSolarannouncedaplantobuilda7GW/yearingot/waferplantinVietnamin2022.StartupcompaniesintheUSAandEuropearedevelopingakerflessmanufacturingprocesstomanufacturewaferswithoutusingconventionalingotgrowthorwire-sawingprocesses.CubicPVintheUSAestablishedbythemergerof1366TechnologiesandHuntPerovskiteTechnologiesisplanningtoestablisha2-GWwafermanufacturingfacilityinIndiawiththedirectwaferprocess.Nexwafe(Germany)financedseveralmillionEurosforthecommercializationofitsEpiwaferstechnologytoestablisha500MW/yearfactoryby2024.OthercompaniesworkingonnewtechnologiesincludeLeadingEdgeCrystalTechnologies(USA)andCrystalSolar(USA).In2021,itwasnotablethattheshareoflarge-sizedwafersincreased.158,75to166mmsizedwafersaccountedforaround50%ofthetotalproductionandtheshareoflarge-sized182(M10)to210(M12)mmwafersincreasedfrom4,5%in2020to45%.Itisexpectedthattheshareoflarge-sizedwaferswillincreasefurtherandthattheywillbecomemajorproductsby2030.Areductionofthewaferthicknesswasreportedin2021.In2020,thethicknessof158,75-166mmwaferswere175to180μm.Itdecreasedto160μmin2021duetotheeffortstoreducepolysiliconusage.Thethicknessoflargerwafersin2021was165μmandisexpectedtobe155μmin2022.THEUPSTREAMPVSECTOR/CONTINUED47IEAPVPSTRENDSINPHOTOVOLTAICAPPLICATIONS2022SOLARCELLANDMODULEPRODUCTIONSolarCellProductionTheglobalsolarcell(c-Siandthin-filmsolarcell)productionreachedaround241GWin2021,a35,4%increasefrom2020(178GW).Theglobalmanufacturingcapacityasoftheendof2021isaround441GW/year.Asinthepreviousyear,Chinawastheworld’slargestproducingcountryofsolarcells.Chinaproducedaround198GWofsolarcellsin2021,a46,8%increasefrom135GWin2021.China’sreportedsolarcellmanufacturingcapacityis360GW/yearintheendof2021.160GW/yearhavebeenaddedfrom2020onwards.AsshowninFigure4.4,China’ssolarcellproductionvolumeaccountsfor82,2%ofthetotalglobalproduction.AsshowninTable4.1,thetop5solarcellmanufacturersareChinesecompanies.FIGURE4.4:SHAREOFPVCELLPRODUCTIONIN2021CHINA,81,2%MALAYSIA,5,4%VIETNAM,3,6%SOUTHKOREA,2,3%INDIA,0.9%EUROPE,1,3%SINGAPORE,0,5%TAIWAN,0,9%USA,1,0%THAILAND,2,1%OTHER,0,6%JAPAN,0,2%SOURCEIEAPVPS,RTSCORPORATIONThecountriesbesidesChinawhichhavereportedproductionofsolarcellsareMalaysia(13,1GW),Vietnam(8,8GW),Korea(5,5GW),andThailand(5GW).Europe,USA,IndiaandJapanalsoreportedproduction.Figure4.4showstheproductionshareofsolarcellbycountryin2021.ThailandandVietnamarenotsubjecttothesafeguardtariffsbytheUSAandtheproductioncapacitiesareincreasinginthesecountries.Asof2021,Malaysiahad18,6GW/yearofsolarcellcapacity.VietnamandThailandhad17GW/yearand9,7GW/year,respectively.IntheUSA,thesolarcellproductionismainlyconductedbyFirstSolarwiththeirCdTethin-filmPVtechnology.Asforc-Sisolarcells,thedemandforhighefficiencysolarcellshascontinuedincreasing.Theshareofsc-Sisolarcellsincreasedto89%andthemc-Sishareisaround7,7%in2021.AccordingtotheITRPV2021report,theshareofPERC/PERT/PERL/TOPContechnologiesreachedaroundTABLE4.1:GLOBALTOPFIVEMANUFACTURERSINTERMSOFPVCELL/MODULEPRODUCTIONANDSHIPMENTVOLUME(2021)RANKSOLARCELLPRODUCTION(GW)PVMODULEPRODUCTION(GW)PVMODULESHIPMENT(GW)1TONGWEISOLAR32,9LONGIGREENENERGYTECHNOLOGY38,9LONGIGREENENERGYTECHNOLOGY38,52LONGIGREENENERGYTECHNOLOGY29,6TRINASOLAR26,2JASOLARTECHNOLOGY25,53JASOLARTECHNOLOGY21,2JASOLARTECHNOLOGY25,9TRINASOLAR24,84SHANGHAIAIKOSOLARENERGY19,5JINKOSOLAR21,4JINKOSOLAR22,25TRINASOLAR18,9CANADIANSOLAR16,7CANADIANSOLAR14,5SOURCERTSCORPORATION(WITHSOMEESTIMATES)NOTE:PRODUCTIONVOLUMESAREMANUFACTURERS’OWNPRODUCTION,WHEREASSHIPMENTVOLUMESINCLUDECOMMISSIONEDPRODUCTIONANDOEMPROCUREMENT.85%from76%in2020.TheBSFtechnologysharedecreasedtolessthan10%.TheshareofhigherefficiencytechnologiessuchasSi-heterojunction(SHJ)andbackcontacts,includingmetalwrapthrough,remainedaround5%.Asinthepreviousyears,investmentinthesetechnologieshasbeenactivethroughout2021.Morethan20companiesareplanningtoproduceandcommercializeSHJtechnologies.InChina,theshareofn-typeSihighefficiencytechnologiesin2021remainsat3%.Itisexpectedtoincreaseto13%in2020.Asmentionedinthewafersection,thesizeofsolarcellshasbecomelarger,adoptingM10orM12wafers.In2021,itisnotablethattheshareofbifacialsolarcellsintheglobalmarketreached50%.Itisexpectedtoreachmorethan60%in2022.OneofthereasonsofthisgrowthisthatbifacialproductsareexemptedoftheUSsafeguardduties.Also,theoutputincreasewithsingleaxistrackercontributedtothemarketgrowth.IEAPVPSTRENDSINPHOTOVOLTAICAPPLICATIONS202248Asforwaferprices,cellpriceswerealsoaffectedbythepolysiliconprice.InJanuary2021,themono-PERCcellspotpricewasbetween0,12to0,14USD/Wdependingonthewafersize.Thepricelevelincreasedto0,15to0,19USD/WinNovember2021.Afterthat,thepricechangedaccordingtothedemandandasofJuly2022,thepricerangeis0,155to0,18USD/W.Inthefirsthalfof2022,Chinaproduced135,5GWofc-Sisolarcells,a46,6%increasefromthepreviousyear(123,6GW).Announcementsofcommercializationofn-typeSisolarcellhavebeenobserved,theseaccountforonethirdofannouncedproductionenhancements.InChina,majorutilitycompaniesconductedtendersusingn-typetechnologies.Thedemandforn-typetechnologieswasmorethan4GW.Amongthematerialsusedforsolarcells,thepriceofsilversoaredin2021.AccordingtotheSilverInstitute,thesilverpriceincreasedbyaround22%in2021.Forthisreason,solarcellmanufacturesaremakingeffortstoreducesilverconsumptionintheelectrodes.Thereplacementofsilverbycopperoraluminumisalsobeingconsideredbymanufacturersandsuppliers.SOLARMODULEPRODUCTIONGlobalPVmoduleproduction(c-SiPVmoduleandthin-filmPVmodule)showedanincreasefollowingtheglobaldemandforPVsysteminstallationfrom178,5GWin2020to242GWin2021.AsshowninFigure4.5,asin2020,ChinacontinuedtobethelargestproducerofPVmodulesintheworld.Chinaproduced181,8GWofPVmodulesin2021with359GW/yearofproductioncapacity.In2021,theamountofexportedPVmodulesfromChinaachieveditshighestrecordinhistoryaccordingtoCPIA,ChinesePVIndustryAssociation.About98,5GWofPVmoduleswereshippedtooverseasmarkets.AsshowninTable4.1,thetop5PVmodulemanufacturersareChinesecompanies.Asin2020,thesecondlargestPVmoduleproducingcountryin2021wasVietnamwith16,4GW,a13,8%increasefromthepreviousyear(14,13GW).Malaysia(9,1GW)rankedthirdandKorearankedfourthwith8GWofPVmoduleproduction.TheUSArankedfifthwith6,6GWofPVmoduleproduction.IncaseoftheUSA,itspolicytoguarddomesticmanufacturerswithimportduties,PVmoduleproductioncapacityhasbeenincreasinganditisexpectedthatitsproductionwillincreaseasPresidentBidenannouncedtoincreasetheUSproductioncapacityto22,5GW/yearby2024andincentivesforproductionwillbeimplementedundertheInflationReductionActenforcedinAugust2022.LocalproductionofPVmodulesisbeingpromotedinIndiaandEuropeaswell.Itisexpectedthathigherlogisticcostsandthedemandforalowercarbonfootprint,theeconomicstimulationandtheriskmitigationdependingonspecificproductionlocationswilldiversifythemanufacturingsitesinthecomingyears.ThePVmodulepricesalsokepthigherlevelsin2021,mainlyduetothehigherpolysiliconprices.InJanuary2021,theaveragespotpriceofatypicalsc-SiPVmodulewas19,2USDcents/W.Itincreasedto26USDcents/WinOctober2021.BytheendofDecember2021,itdroppedto24,7USDcents/W.InJuly2022,thepricelevelremainedhighat25,6USDcents/W.Besidespolysilicon,glassandpolymermaterialsalsohadimpactsonthePVmoduleprices.AccordingtoastatementissuedinSeptember2021bythefivemajorChinesePVmodulemanufacturers(LONGiGreenEnergyTechnology,JinkoSolar,andTrinaSolar,JASolarTechnologyandRisenEnergy),thepriceofglassforPVmodulesincreasedby18,2%fromAugust2021andtheEVApricesoared35%inAugustin2021.Thetightsupplycausedbyhigherdemandandelectricityconsumptioncontrol,resultedinthepricesofthesecomponentsshowingariseandfluctuations.ItisexpectedthattheexpansionofthemanufacturingcapacityofthesematerialswillstabilizethepricesandthereplacementofEVAtopolyolefinwillbeadvanced.FIGURE4.5:SHAREOFPVMODULEPRODUCTIONIN2021CHINA,75%SOUTHKOREA,3,3%VIETNAM,6,8%MALAYSIA,3,7%USA,2,7%CANADA,0,2%JAPAN,0,9%TAIWAN,0,9%THAILAND,1,2%EUROPE,0,9%OTHER,1,9%SINGAPORE,0,5%INDIA,2,1%SOURCEIEAPVPS,RTSCORPORATIONTHEUPSTREAMPVSECTOR/CONTINUED49IEAPVPSTRENDSINPHOTOVOLTAICAPPLICATIONS2022SOLARMODULETECHNOLOGYFIGURE4.6:PVMODULEPRODUCTIONPERTECHNOLOGYINIEAPVPSCOUNTRIESIN202105010015020025030020212020201920182017201620152014201320122011Thin-filmsc-Simc-SiGWSOURCEIEAPVPS,RTSCORPORATIONIn2021,asshowninFigure4.6,theshareofc-SiPVmodulewas96,6%,aslightincreasefrom96,4%inthepreviousyear.Amongc-Sitechnologies,sc-Siincreaseditssharefrom81,9%to88,9%in2021.Asmentionedinthesectiononwafersandcells,theadoptionoflarger-sizedsolarcellsincreased.PVmodulesadoptinghalf-cutc-Sisolarcellshavemorethan80%shareofthetotalin2021.TheshingledPVmoduletechnology(overlappingtheedgesofsolarcellswithoutribbons)andtheseamlesssolderingtechnologywerealsoadopted.Thin-filmsilicontechnologiesslightlylosttheirsharefrom3,6%to3,4%.About8,2GWofthin-filmPVmoduleswereproducedin2021.Amongthem,7,9GWwereCdTePVmodulesproducedbyFirstSolar(USA).Otherthin-filmtechnologiesproducedin2021wereCIGSwithlessthan500MWandamorphous-siliconPVmodules.In2021,SolarFrontier,aJapaneseCISthin-filmPVmodulemanufacturerdecidedtowithdrawfrommanufacturinginordertoshifttothePVsysteminstallationbusinessutilizingc-Sitechnologies.Thin-filmPVmodulesweremainlyproducedinMalaysia,USA,Japan,Germany,andChina.InmanyoftheIEAPVPSmembercountries,R&DandcommercializationeffortsonCIGSthin-filmPVmodulesfocusontheimprovementofconversionefficiencyandthroughputaswellastheenlargementofmodulesize.Applicationforatandemsolarcellusingc-siliconandperovskitetechnologiesisalsostudied.Theshareofthin-filmPVmodulesinthissegmentisexpectedtogrowforspecificapplicationsforcurvedsurfaces,windows,orskylightswithlighttransmittingfunctions,applicationsrequiringlightweightmodules.High-efficiencymulti-junctionPVcells/moduleshavebeenproduced,mainlyusingIII-Vmaterialsforspaceapplications.R&Dactivitiesforhigh-efficiencymulti-junction(MJ)PVhavebeenactiveintheUSA,EuropeandJapan.R&Dfortandemsolarcellsusingc-SiandMJcellsisalsocontinuedinthesecountries.Hydrogensynthesisusinghigh-efficiencycellsisalsostudiedanddemonstrated.ApplicationofCPVforagriculturalPVisdemonstrated.DemonstrationofMJPVforEVisconductedinJapan.Followingtherapidimprovementofconversionefficiencyinashorttime,effortsonthecommercializationofPVcells/moduleswerereportedin2021and2022.InChina,severalcompaniesareworkingoncommercialization.HangzhouMicroquantaSemiconductorannouncedthatitshipped5000piecesofperovskitePVmodulesinJuly2022.ShenzhenInfiniteSolarEnergyTechnologysuccessfullysecuredfinancing,targetingtoestablishapilotproductionlinein2022.GCLOptoelectronicsannounceditinstalledperovskitePVmodulesinthefacilitiesusedfortheWinterOlympicgamesin2022.InadditiontotheseChinesecompanies,WonderSolarstartedtoestablisha200MW/yearpilotlineaimingatdevelopinga1GWfactoryin2022.OutsideofChina,SauleTechnologies(Poland)completedamanufacturingfacilityforflexibleperovskitesolarcellsinMay2021.IntheUK,PowerRollstartedaroll-to-rollpilotproductionlineinFebruary2022.IntheUSA,SwiftSolarisworkingonflexiblePVmodules.Commercializationoftandemtechnologiesusingperovskiteandc-Sisolarcellisalsogloballyactive.OxfordPVintheUKcompleteda100MW/yearproductionlineforperovskite/c-SitandemPVinJuly2021.Whileannouncementsofeffortshavebeenreported,itremainstobeseenifperovskitetechnologycouldreplacesomeofthemarketsharesofconventionalc-Siorthin-filmPVmoduletechnologies.IEAPVPSTRENDSINPHOTOVOLTAICAPPLICATIONS202250FIGURE4.7:YEARLYPVINSTALLATION,MODULEPVPRODUCTIONANDMODULEPRODUCTIONCAPACITY2011-2021(GWp)010020030040050060020212020201920182017201620152014201320122011GWTotalmoduleproductioncapacityTotalmodulePVproductionYearlyPVinstallationsSOURCEIEAPVPS,RTSCORPORATIONNOTE:REVISEDBASEDONCPIADATAANDRTSSURVEYPRODUCTIONCAPACITYEVOLUTIONFigure4.7andTable4.2showtheevolutionofglobalannualinstalledcapacity,PVmoduleproductionamountandPVmoduleproductioncapacity.In2021,theproductioncapacityincreasedfrom327GW/yearin2020to483GW/yearin2021.Itshouldbenotedthattheproductioncapacityfiguresincludethecapacitiesofagingfacilitiesandidlefacilitiesthatarenotcompetitiveanymore:hencetherealeffectiveproductioncapacityisassumedtobeatthelevelofabout380GW/yearin2021.ThespeedofcapacityenhancementisfasterthanthemarketdevelopmentsothepricelevelofPVmodulesisexpectedtobestabilizedifthesupplyforpolysiliconeasedinthecomingyears.THEUPSTREAMPVSECTOR/CONTINUED51IEAPVPSTRENDSINPHOTOVOLTAICAPPLICATIONS2022TABLE4.2:EVOLUTIONOFACTUALMODULEPRODUCTIONANDPRODUCTIONCAPACITIES(MWp)ACTUALPRODUCTIONPRODUCTIONCAPACITIESYEARIEAPVPSCOUNTRIESOTHERCOUNTRIESTOTALYEARIEAPVPSCOUNTRIESOTHERCOUNTRIESTOTAL19935252808065%199400000%1995565610010056%199600000%199710010020020050%199812612625025050%199916916935035048%200023823840040060%200131931952552561%200248248275075064%200366766795095070%2004116011601600160073%2005153215322500250061%2006206820682900290071%2007377820039787200500770052%2008660045070501170010001270056%200910511750112611830020002030055%2010197001700214003150033003480061%2011340002600366004800040005200070%2012337872700364875300050005800063%2013373992470398695539451006049466%2014437992166459656199352666725968%2015583044360626648757461009367467%20167386441967806097960690010486074%20179794272001051421446431025015489368%201810627097031159731659391790518384463%2019123124171731402971906572853021918764%2020156430230441794742895813709532667656%2021213032293462423784105007150048272750%SOURCEIEAPVPS&RTSCORPORATIONNOTE:ALTHOUGHCHINAJOINEDIEAPVPSIN2010,DATAONCHINA’SPRODUCTIONVOLUMEANDPRODUCTIONCAPACITIESIN2006ONWARDSAREINCLUDEDINTHESTATISTICS.IEAPVPSTRENDSINPHOTOVOLTAICAPPLICATIONS202252BALANCEOFSYSTEMCOMPONENTMANUFACTURERSANDSUPPLIERSBalanceofsystem(BOS)componentmanufacturersandsuppliersrepresentanimportantpartofthePVvaluechain.BOScomponentsareaccountingforanincreasingportionofthesystemcostasthePVmodulepriceisfalling.Accordingly,theproductionofBOSproductshasbecomeanimportantsectoroftheoverallPVindustry.Originally,thesupplychainofPVinverterswasaffectedbynationalcodesandregulationssodomesticorregionalmanufacturerstendedtodominatedomesticorregionalPVmarkets.However,withthegrowthoftheChinesemarket,thedominanceofChineseproductshasbeenvisibleinbothutility-scaleanddistributedPVmarkets.AccordingtoCPIAandothersources,thetotalproductionofinvertersinChinawasabout155GWac,a55%increasefromthepreviousyear(100GWac),excludingOEMproductionforthecompaniesheadquarteredoutsideofChina.CPIAalsoreportedthat63GWacofinverterswereexported.China’sshareininvertershipmentsisestimatedtobearound72%in2021,aslightyear-on-yearincrease.Generally,invertersarecategorizedintothreetypes:centralinverters,stringinverters,andmicro-inverterscalled“MLPE,module-levelpowerelectronics”.In2021,theshareofcentralinvertersusedforlarge-scaleutilityorindustrialapplicationsisabout34%andthemarketshareofstringinvertersusedforresidentialandsmalltomedium-scalecommercialPVsystemsis64%.TheshareofMLPEsremainslow,about1%mainlyusedforresidentialandsmall-scalecommercialapplications.Recently,thesizeofinvertersincreasedduetothepressureforLCOEreduction.Thelargestcentralinvertercapacityis5MWandthemaximumcapacityofstringinvertersincreasedto350kWlevel.Animprovementininverterefficiencyhasbeenobservedandrecentproductshave98%efficiencyandhigher.Larger-sizedPVmodulesusinglarger-sizedsolarcellshavealsodriventechnologyimprovementofinverters,astheyarerequiredtosynchronizehigher-wattpeakPVmodules.InvertersneedtomeethighercurrentsfromPVmodules,whichincreasedfrom9Ato11Ato11,5A.InthecaseofPVmodulesusing210mmsolarcells,17Aofelectricalcurrentisgenerated.Advancedsemiconductors(SiCorGaN)contributetotheseimprovementsandhaveachievedcompactdesignswithlighterweight,allowing1500VmaximumDCstringvoltage.Itshouldbenotedthattheglobalsupplygapofsemiconductorsalsoresultedindelaysofinvertershipmentsorareductionofproduction.Thissituationshouldbeeasedwiththeenhancementofthesemiconductormanufacturingcapacityinthecomingyears.TheinvertertechnologyhasbecomemoreandmoreimportantsinceitisincreasinglyconsideredasthecoreofthePVsystem,supportinggridstabilitywithnewgridcodes.NewgridcodesrequiretheactivecontributionofPVinverterstoensuregridmanagementandgridprotection,newinverterswithsophisticatedcontrolandinteractivecommunicationsfeatureswithdigitaltechnologiesarecurrentlyunderdevelopment.Withthegrowthoftheself-consumptionmarket,functionsareequippedtooptimizeself-consumptionwithanenergymanagementsolutioncombiningstoragebatteriesandEVswithsmartmonitoring.ApplicationofAIandmachinelearningforfailuredetectionoroptimizationofelectricitygenerationcontributedtoloweringthecostofO&M.Inaddition,invertermanufacturersenteredtheO&MbusinessandtherepoweringbusinesswhereagingPVpowerplantsexist,mainlyinEurope.Inadditiontotheconventionalinvertersmentionedabove,themarketofMLPEisgrowinginspecificmarkets.MicroinvertersandDCoptimizers(workingatmodulelevel)aremainlyadoptedintheUSresidentialmarketduetorapidshutdownrequirementsimposedbytheNationalElectricityCode(NEC).MLPEcanhelpachieveahigheroutputforPVsystemsthatareaffectedbyshading.Amoreefficientrapidshutdowncanberealizedincaseoffire.SuchrequirementswereadoptedfirstintheUSA.ThailandandthePhilippinesalsoadoptedthem.Chinaisalsoconsideringtheintroductionofrapidshutdownrequirements,therefore,themarketsizeforMLPEisexpectedtogrowinthefuture.AmongotherBOSsegments,themarketofsingle-axistrackershasbeengrowing.Themarketsizeof2021reachedaround55GW,a21%increasefrom2020.ThelargesttrackermarketistheUSA,wherethemajorityofutilityprojectsarebuiltwithsingle-axistrackers.ThemarketforPVtrackersisexpandingtoChina,India,Brazil,Mexico,Chile,Argentina,SouthAfrica,SaudiArabiaandtheUnitedArabEmirates.In2021,thepriceriseofsteelwasreportedtoaffectthepriceanddelaysoftheshipments.Besidesutility-scaleapplications,trackersusedforagriPVprojectsaredevelopedandcommercializedwithaspecificdesigntosharesolarenergywithagriculturalcrops.THEUPSTREAMPVSECTOR/CONTINUED53IEAPVPSTRENDSINPHOTOVOLTAICAPPLICATIONS2022THEDOWNSTREAMPVSECTORInthePVindustry,anoverviewofthedownstreamsectorcanbedescribedasinFigure4.8(exampleofutility-scaleprojects).PVdevelopershavebeenactiveinthecountrieswherepowerpurchaseagreements(PPAs)areguaranteedunderauctions,andwheretheFeed-inTariff(FIT)programandothermechanismsareimplemented.WhiledeveloperssellPVpowerplantstoIndependentPowerProducers(IPPs)orinvestors,somedevelopersownPVpowerplantsastheirownassets.ThecompaniesprovidingEngineering,ProcurementandConstructionforPVsystems(mainlyutility-scaleapplicationsbutlargercommercialorindustrialapplicationsalsofallintothiscategory)arecalledEPCs.EPCsincludepure-playerscompaniesandgeneralconstructioncompaniesofferingservicesforinstallingPVsystems.IntegratedPVdeveloperssometimesconductatthesametimeEPC,operationandmaintenance(O&M)servicesbythemselves.SomecompaniesdevelopPVpowerplantsandownthem,whileothersprovideEPCandownPVpowerplantsaswelluntiltheysellthePVpowerplantstoIPPs.Generally,utility-scaleprojectsareownedbyIPPs(togetherwithequityinvestors),whosellthepowertoutilitiesunderlong-termPPAs.EquityinvestorsorotherfinancialinstitutesalsoplayanimportantroleforthePVprojectdevelopmentasequityorloanproviders.FIGURE4.8:OVERVIEWOFDOWNSTREAMSECTOR(UTILITYPVAPPLICATION)CPE/REPOLEVEDDETARGETNISELUDOMVPTAXEQUITYINVESTORREPOLEVED/PPIM&OSRELLATSNI/CPESREILPPUSOTHERBOSsCPEVPSRETREVNIOPERATIONMONITORINGDEVELOPER/IPPFINANCIALINSTITUTESUPPORTSTRUCTURES/TRACKERINSTALLERSYIELDCOSTSOURCEIEAPVPS&OTHERS.Companiesdoingbusinessinthedownstreamsectorhavevariousorigins:subsidiariesofelectricutilities,subsidiariesofPVmoduleorpolysiliconmanufacturers,companiesinvolvedintheconventionalenergyoroil-relatedenergybusiness.MajorPVprojectdevelopersareacceleratingtheiroverseasbusinessdeploymentandareactiveinthebusinessdeploymentinemergingmarketssuchasAfrica,theMiddleEast,ASEANregionandLatinAmerica.Thenumberofprojectdevelopersactiveintheinternationalbusinessisincreasing.Itshouldbenotedthatseveralverticallyintegratedcompaniesarepresentinthedownstreamsector.ThesecompaniesproducePVmodulesorpolysilicon,developPVprojectsandprovideEPCandO&Mservices.c-SiPVmodulemanufacturerssuchasJinkoSolar,CanadianSolar,andHanwhaSolutions(Korea)arealsoactiveinthedownstreamsector.NotablepolysiliconmanufacturersinvestingintheinternationaldownstreambusinessareGCL-PolyEnergyandOCI.Oilandothermajorenergycompaniesalsoenteredintotherenewableenergymarket.Especially,Europeancompaniesareactiveinthisfield.Forexample,BP(UK)isshiftingtoanintegratedoilcompany(IOC)toanintegratedenergycompany(IEC).Total(France)isfocusingongasandlowcarbonelectricityanddevelopsPVprojectsglobally.Shell(UK/Netherlands)announcedtosetoutitsstrategytoaccelerateitstransformationintoaproviderofnet-zeroemissionsenergyproductsandservices.In2021,investmentsinrenewableenergycompanies,settingupJVsandacquisitionofrenewableenergybusinessofthesecompanieswerefrequentlyreported.IEAPVPSTRENDSINPHOTOVOLTAICAPPLICATIONS202254Inthedownstreamsectors,businessmodelshavebeenchangingwiththedemandforrenewableelectricityfromusersseekingtoprocure100%renewablepowerfortheirbusinessoperations.Especiallyincountrieswheretheelectricitymarketisliberalized,PVelectricityissolddirectlytothecompanyusersbyIPPsThesecasesarecalledCorporatePPA(CPPA).BNEFreportedthatthetotalvolumeofglobalCPPAsignedin2021reached31.1GWincreasedby24%from25.1GWin2020.AccordingtoBNEFanalysis,mostoftheprojectswerePVgeneration,andalmostone-thirdofthetotal,20,3GWwascontractedintheAmericas.EuropeanPVmarketsarealsogrowing,andahistoricrecordof8,7GWwascontracted.Aspreviouslymentioned,becauseofthepriceincreaseofPVmodulesandothercomponents,LCOEofPVprojectsisexpectedtoincrease.However,energypricesbasedonfossilfuelsarealsorising,especiallyaftertheRussianinvasionofUkraine.Aslongasthegapexists,businesscasesofCPPAsareexpectedtogrowmoreandmoreindiverselocations.PVplusstoragebatteriesprojectsareannouncedunderauctionsandothermechanismsintheUSA,Australia,Europe,Africa,Chile,India,etc.VariousgreenhydrogenprojectsusingPVpowerwerealsoannouncedin2021.Variouscountrieshaveestablishedhydrogensocietyroadmapsandhavestartedgreenhydrogenprojects.GreenhydrogenisexpectedtoplayanimportantroleintheenergytransitionandinR&D.Developmentforcostreductionhasbeenpromoted.IndistributedPVsystemssegmentforresidential,commercialandindustrialapplications,thedemandforself-consumptionandresilienceisincreasing.Inadditiontothese,obligationstoinstallPVfornewhousesorbuildingsarebeingadoptedatnationalandregionallevels.ThesemandatorymeasuresandtighterenergyefficiencycodeswilldrivethedistributedPVmarket.IncountrieswithanestablishedPVmarket,wherethedistributedmarketwasestablishedsuchastheUSA,Australia,Japan,GermanyandotherEuropeancountries,thedemandfordistributedstoragebatteriesisincreasing.Subsidiesforstoragebatteriesareavailableinsomecountries.PPAmodelsareusedtointroducePVsystemsintoresidential,commercialorindustryfacilities.ItshouldbenotedthatthefastdevelopmentofEVsmightchangethelandscapeofdistributedPVsystemsaslocalstoragebatteries.THEDOWNSTREAMPVSECTOR/CONTINUED55IEAPVPSTRENDSINPHOTOVOLTAICAPPLICATIONS2022fiveSOCIETALIMPLICATIONSOFPVANDACCEPTANCEThePVsectorhassignificantimplicationsfortheeconomy,forthesocietyandfortheenvironment.ThepositiveimpactsgeneratedinthesethreeareasshowthatPVisamaincontributoronthepathtowardssustainability.Duetothenatureoftheenergytransformation,theacceptanceofchangeisanessentialelementofthesuccessofthisrevolution:thenumberofjobsinvolved,thecreationofnewcompaniesandthedisappearanceortransformationofothers,theimpactontheenvironmentandthesocialaspectsrelatedtothedevelopmentofPVarebecomingessential.ThischapteraimsatprovidingkeyelementsthatcanbeusedtopromotealargeracceptanceofPVdevelopment,whilehighlightingessentialaspects.SocialacceptanceisbecomingakeytopicwhenitcomestoPVdevelopmentinacertainnumberofcountriesaroundtheworld.Particularly,incountrieswithahistoricallypredominantdistributedPVmarket,whereground-mountedPVneedstodevelopinordertoachieverenewableenergytargetsorincountriesexperiencingamarketboom,thequestionofsocialacceptanceisbecomingcentral.Thequestionofacceptanceanditsassociatedchallengesisnotlimitedtoground-mountedPVsystems,eveniftheselaterconcentratethemostresistance.ACCEPTANCEOFPVDEPLOYMENTAcceptancecanbedefinedasthewillingnessofstakeholderstoapprove,support,andengagethemselvesintheenergyrevolution.Thisacceptanceisfuelledbyapositiveperceptionofthechangesanddecreasedbynegativeinputs.InthecaseofPV,incontrasttootherrenewablesourcesandespeciallywind,theinitialacceptanceofPVwaspositive.Mostcountriesstartedbydevelopingsmall-scalePVinstallations,mostlyonroofs,anduntil2006-2007,thegeneralperceptionofPVwaspositiveasitsimpactwasmarginal.ThefirstmajordrawbackcamefromthemassivestartinSpainin2007-2008whenthelocalfeed-intariffwassopopularthatPVdevelopedfast,totheextentithadtobestoppedbyauthorities,infearofeconomicandbudgetconsequencesforthecountry.AllothercountriesthatsteppedintotheFiTpoliciesexperiencedamajormarketdevelopmentfollowedbyarapidhalt.Inmostcases,thereasonwasclear:traditionalutilitiesfeltthreatened,unabletojumpfastintothisrapidlydevelopingbusinessandpushedpoorlyinformedauthoritiestoputthebrakeatPVdevelopment.WhiletheimageofPVwaspositive,itsoonbecamepollutedbytheperceptionofextravagantprofits,dramaticimpactonelectricitypricesorqualityissues.AllsubjectswereusedmassivelybyPVopponentstoreducedramaticallythesocialacceptanceofPV.ThisIEAPVPSTRENDSINPHOTOVOLTAICAPPLICATIONS202256happenedinSpain,France,Belgium,CzechRepublic,Greece,Bulgaria,Romaniatomentionafew.TheseareEuropeancountriesandtheEUwastheepicentreofPVdevelopmentuntil2011-2012.WhilethePVcommunityforgotsomehowtheneedforsocialacceptance,thereactionfrompolicymakerswasdisproportionateandhaltedoftenalmostcompletelythePVdynamics.InsomecountrieslikeBelgiumforinstance,PVstillsuffersfromapoorimageandfrightenspolicymakers.Moreover,imagesofdamageinflictedtoPVsystemsby,forexampletyphoonsinJapan,butalsofireoutbreaks,candeterioratetheacceptanceofPVconveyingtheideaofpoorreliabilityandavulnerabletechnology.Inthelastyearsacceptancehasgraduallyincreased,andtheinherentcompetitivenessofPVcontributedtoincreasethegeneralacceptance.SOCIO-POLITICALANDCOMMUNITYACCEPTANCEItcanbedifferentiatedbetweennationalsocio-politicalacceptanceandcommunityacceptance.Theseareassociatedwithrelativelydifferentconcernsandshouldthereforebeaddressedseparately.Nationalsocio-politicalacceptancereferstotheacceptanceofatechnologybypoliticians,policymakers,keystakeholdersandthepublic.Itinvolvesconsiderationsaboutthelegalandregulatoryframework.Itresonateswithconcernsrelatedtojobs,industryandlocalcontent.Inmultiplecountries(Turkey,Morocco,India),somepolicymakerswereputtingaholdonPVdevelopmentuntilitwascoupledwithlocalvaluecreation.InFrance,indirectlocalcontentrequirement(basedonanevaluationofmodulecarbonfootprints)havebeenintroducedintenders.HigheracceptancelevelscouldbeachievedbydemonstratingtheaddedvalueofPVintermsofjobcreation,revenuegeneration,economyandactivitydevelopment,whichcouldpositivelyinfluenceregionswithindustrialdeclineforexample.Communityacceptanceisrelatedtotheacceptancebylocalstakeholders.Itincludesconcernsoverdistributionaljustice(costsandbenefits),proceduraljustice,andtrust;wheretheNIMBYism(NotInMyBackyard)sometimesoccurs.Itcoversconsiderationofeconomicaspects:gridcosts,RESfees,unequalaccesstoPV,concentrationofrevenuesbetweenalimitednumberofbigcompanies;socialaspects(environmental,aestheticalimpact),andspecificopposition(e.g.,farmers,hunters,lobbyist…).Higheracceptancelevelscouldbeachievedbytransferringvalue,partofthedecisionprocessoratleastdiscussionstothecitizensandlocalstakeholdersatlarge.InSpain,distributedPVwithsizesbelow5MWcanparticipateintendersprovidedthattheyrespectcertainconditions(securinglocal(<60km)partners,demonstratingproximitytoconsumptioncentres)aimingatincreasingPVacceptance.Ingeneral,thetargetistoovercomeignoranceandmisconception(e.g.,aboutthelandthatisactuallyneededtomeetthetargets).ChallengesrelatedtotheacceptanceofPVeveniftheyaredirectlyinfluencedbythepolitical,economic,geographical,socialcontextinwhichPVinstallationsarebeingdeployed,arefairlysimilaracrossdifferentregionsandcountries.Thiscallsforahighercollaborationbetweencountriesonthistopicbasedonthesharingofexperienceandexchangeofgoodpractices.INVOLVEMENTTheinvolvementofstakeholdersintheenergytransformationisoftenconsideredasawaytoeasetheacceptanceandacceleratethedeployment.ForexampleincountrieslikeFrance,individualself-consumptionisgainingmomentumthesetwolastyears,indeedconsumersarebecomingprosumerswichimprovessolarPVimage.SuchisthecaseforenergycommunitiesandtheCommunitySolarinitiativeintheUSA,whichallowthefightagainstpovertyandenergyprecariourness.Suchinvolvementcanbeseenundervariousangles:•ProsumersareconsumersproducingpartoralloftheirelectricitywithPVwhilemaintaininggridconnection.Prosumerspolicies,especiallyself-consumptiononesaredescribedinchapter3.•Energycommunities,andthespecificcaseofsolarcommunitiesareinvolvingcommunitiesinproducingandmanagingenergy,allowingahigherinvolvementofstakeholders.•Energyaccessisemergingcountrieshasshownforalongtimethattheimplicationofthepopulationssignificantlyincreasestheadoptionofdecentralizedenergysources.•CompaniesandespeciallyutilitiesinvolvedinthePVbusinessareknowntobecomeadvocatesoftheenergytransition.TheparagraphsbelowhighlightsomekeyfactualelementsthatcanbeusedtoimprovetheperceptionofPVingeneral,oneconomic,socialandenvironmentalaspects.ACCEPTANCEOFPVDEPLOYMENT/CONTINUED57IEAPVPSTRENDSINPHOTOVOLTAICAPPLICATIONS2022CLIMATECHANGEMITIGATIONClimatechangehasbecomeoneofthekeychallengesthatoursocietieshavetoovercomeandPVisoneofthemainsolutionsforreducingourgreenhousegasemissions.TheenergysectorisresponsibleforamajorpartoftheglobalCO2emissions,withenergy-relatedemissionsevaluatedat33GtCO2eqin2021.1IncreasingthePVshareinthegridmixcansignificantlyreducetheemissionsfrompowergeneration.Theglobalaveragecarbonintensityofelectricitywasaround475gCO2/kWhin2019whereasfor1kWhproducedbyPVtheemittedCO2,consideredonalifecyclebasis,canbeaslowas15gdependingontechnologyandirradiationconditions(datafromIEAPVPSTask12onsustainabilityandthedatabasesmadeavailablebythegroups’researchers).ThetotalCO2emissionsthatareavoidedbyPVonayearlybasiscanbecalculatedconsideringtheamountsofelectricitythatcanbeproducedannuallybythecumulatedPVcapacitiesinstalledattheendof2020andconsideringthattheseamountsreplaceequalamountsofelectricitythatwouldbegeneratedbytherespectivegridmixesofthedifferentcountrieswherethesePVcapacitiesareinstalled.TheannuallyproducedPVelectricityiscalculatedbasedoncountry-specificyieldsdependingontheaverageyieldsofPVinstallationsandirradiationconditionsineachcountry.Thecountry-specificlifecycleCO2emissionfactors(gCO2/kWh)ofbothPVelectricityandgridmixelectricityaretakenfromtheIEAPVPSTask12databases.CO2avoided1060MTCO2,eqUsingthismethodology,calculationsshowthatthePVinstalledcapacitytodayavoidsupto1060milliontonnesofCO2eqannually.Thus,itavoidsmorethan3%oftheenergysectoremissions.ThisisessentiallyduetothefactthatPVisbeingmassivelyinstalledincountrieshavinghighlycarbonintensivegridmixes,suchasChinaandIndia.Figure5.1givesaviewoftheavoidedCO2emissionsinthefirst30countriesinrankingofavoidedCO2emissionsandwhichrepresentintotalaround98%oftheglobalavoidedemissions.ThisfiguredisplayingthecountriesasafunctionoftheirinstalledPVcapacitiesandgridmixcarbonintensitiesclearlyshowstheirdifferentialcontributiontotheglobalavoidedemissionsandthehighimpactoftheirrespectivegridmixcompositions.ThemoreCO2thepowermixinacountryemits,themorepositivelyPVinstallationswillcontributetoavoidingemissions.FIGURE5.1:CO2EMISSIONSAVOIDEDBYPV[MTCO2,EQ]10001000010000010000000,00,20,40,60,81,01,21,41,6PVcumulatedinstalledcapacity(MW)GridmixCO2emissionfactor(MTCO2eq/TWh)TheAmericasMiddleEastandAfricaEuropeAsia-PacificAvoidedCO2emissions(MTCO2)China,503Brazil,3,0Hungary,1,8Chile,5,5UnitiedArabEmirates,1,9Mexico,11Netherlands,8,5Thailand,4,6Belgium,1,7Spain,14Turkey,14,8Korea,25UK,7,8Italy,15Poland,4,5Australia,40India,121Greece,4,8Germany,34Japan,61USA,84SouthAfrica,7,9Israel,3,6Ukraine,3,0Vietnam,15Egypt,3,3Malaysia,2,1Taiwan,7,5Pakistan,2,7FOOTNOTES1www.iea.org/reports/global-energy-review-2021/co2-emissionsIEAPVPSTRENDSINPHOTOVOLTAICAPPLICATIONS202258VALUEFORTHEECONOMYTheturnoverofthePVsectorin2021amountedtoaround190BillionUSD.ThisnumberhasbeencalculatedbasedonthesizeofthePVmarket(annualinstallationsandcumulativecapacities)andtheaveragepricevalueforinstallationandOperation&Maintenance(O&M)specifictothedifferentmarketsegmentsandcountries.Giventhevarietyofexistingmaintenancecontractsandcost,theturnoverspecificallylinkedtoO&Mhasnotbeenconsideredindetail.However,theglobalturnoverrelatedtoO&Mwasestimatedataround8,1BillionUSDperyear.Thisestimatecanbeconsideredasalowerrangevalue,duetotheassumptionsmadeforitscalculations.Itdoesnottakeintoaccounteitherthematerialcostofreplacementandrepowering,whichishardlyvisible,orthevalueofrecycling.O&McostshavedecreasedovertimeandapartofPVsystemsarenotmaintainedthroughregularcontracts(especiallyresidentialroof-topsystems,unlesstheyaremonitored).TherealvalueofO&Misprobablyhigherthanthis,above10BillionUSDperyear,ifalloperationscouldbeincluded.FIGURE5.2A:AVOIDEDCO2EMISSIONSASPERCENTAGEOFELECTRICITYSECTORTOTALEMISSIONSFIGURE5.2B:AVOIDEDCO2EMISSIONSASPERCENTAGEOFENERGYSECTORTOTALEMISSIONS024681012141618%UnitedStatesTurkeyChinaKoreaIndiaItalyGermanyJapanAustraliaVietnamEnergysectoremissionsEmissionsavoidedbyPVEnergyrelatedCO2emissionsfromfuelcombustion33GTCO2,eq1,06GTCO2,eqSOURCEIEAPVPS&OTHERSTurnoverPV190BillionUSDO&M8,1BillionUSDGlobalbusinessvalue+19%in2021CLIMATECHANGEMITIGATION/CONTINUED59IEAPVPSTRENDSINPHOTOVOLTAICAPPLICATIONS2022Comparedtolastyearandinparalleltothegrowthoftheannualmarket,theglobalbusinessvalueofPVinstallationshasincreasedbyaround30%andsodidtheglobalvalueforO&Maswellaccordingtoourestimates.ThispartofthePVeconomyisboundtogrowfurther,poweredbyagingplantsandrepoweringoperations.ThechoicewasmadetoassessthevalueofthePVsectorfortheeconomybasedonthenumberofinstallationsratherthanbyevaluatingallthecontributionsofthecompletevaluechain.CONTRIBUTIONTOTHEGDPFIGURE5.3:BUSINESSVALUEOFTHEPVMARKETIN20210.00.10.20.30.40.50.60.70.80.91.0NORWAYCANADAFINLANDITALYSWITZERLANDTHAILANDFRANCEMALAYSIASWEDENUNITEDSTATESMEXICOJAPANPORTUGALGERMANYAUSTRIADENMARKBELGIUMKOREATURKEYISRAELSPAINCHINAAUSTRALIANETHERLANDSCHILEBusinessvalueofPVinstallationBusinessvalueofPVOperationsandMaintenanceShareofGDP(%)SOURCEIEAPVPS&OTHERSFigure5.3showstheestimatedbusinessvalueofthePVsectorinIEAPVPSreportingcountriesascomparedtotheirnationalGDPs.ThesevaluesweredeterminedbasedontheinternalPVmarketsineachcountry,asdescribedabove,andhencetheydonottakeimportsorexportsintoaccount.SomecountriesbenefitedfromexportsthatincreasedthebusinessvaluetheyobtainedthroughtheinternalPVmarketwhilehugeimportsinothercountrieshadtheoppositeeffect.However,asalreadymentioned,themarketisintegratedtothepointthatitwouldbeextremelycomplextoassessthecontributionfromeachpartofthePVvaluechain.AsshownbyFigure5.3,thebusinessvalueofPVcomparedtoGDPrepresentedlessthan0,4%inalmostallconsideredcountries(withtheexceptionofChileforwhichthisshareamountsto0,9%)andmorethan0,05%inmostofthem,arangeverysimilartolastyear.Onaglobalscale,PVbusinessvaluerepresentsaround0,2%oftheGDPcomparedtoaround2,3%forenergyinvestments.Onageneralperspective,thenumberspresentedasashareofGDPshowthattheinvestmentintheenergytransition,evenifthesenumberswouldbemultipliedbyafactorof10,wouldstayinareasonablerangeandwouldnotsignificantlychangetheavailabilityoffinancialresources.Theassessmentofthebusinessvalueoftheindustryisingeneralmorecomplex,duetothedecentralizedproductionandtheexistenceoftransnationalcompanies.However,aspecificapproximationoftheindustrialbusinessvalueofPVwasperformedforIEAPVPSmajorPVmanufacturingcountriesandispresentedinaspecificsectionbelow.IEAPVPSTRENDSINPHOTOVOLTAICAPPLICATIONS202260INDUSTRIALVALUEOFPVEventhoughassessingthedetailedcontributionsofthedifferentpartsofthewholePVvaluechainishardlypossibleinthisreportduetothelevelofintegrationofthemarket,anapproximatedevaluationoftheindustrialbusinessvalueofPVhasbeenperformedandtheresultsdetailedforIEAPVPSmajorPVmanufacturingcountries.Theevaluationwasmadebasedontheproductionvolumesandmanufacturingsharesofcountriesforpolysilicon,wafers,cellsandmodules,includingthinfilmtechnologies,asdetailedinChapter4,aswellasonanaverageestimatedpriceforeachofthesefoursegments.Thepricestakeintoaccountarebasedonaveragepricesreportedbymembercountries.Weconsiderthatequipmentandmaterialsareincludedinthiscomputedvalue.BoS,includinginvertersarenotconsideredhere.TheestimatedglobalindustrialvalueofPVestablisheditselfaround74BillionUSDin2021Figure5.5A,5.5B,5.5CshowforIEAPVPSmajorPVmanufacturingcountriestheestimatedcontributionofeachstepofthevaluechaininthePVindustrialvalueforeachcountryinabsoluteandrelativetermsaswellasthecomparisonofthisvaluetotheirGDP.TABLE5.1:TOP10RANKINGOFPVBUSINESSVALUESRANKCOUNTRYBILLIONUS$1CHINA422UNITEDSTATES293JAPAN84GERMANY7,35AUSTRALIA5,56SPAIN4,77FRANCE3,98NETHERLANDS3,79KOREA3,510CHILE2,8SOURCEIEAPVPS&OTHERSFIGURE5.4:CONTRIBUTIONTOGLOBALGDPOFPVBUSINESSVALUEANDENERGYSECTORINVESTMENTSPVbusinessvaluePowersectorInvestmentinthepowersector,fuelsupplyandend-use&efficiency2,29%0,22%0,96%investmentEnergyinvestmentSOURCEIEAPVPS&OTHERSFIGURE5.5A:ABSOLUTEPVINDUSTRIALBUSINESSVALUEIN20210100002000030000400005000060000OtherJapanEuropeUSAMalaysiaSouthKoreaChinaPolySiWafersCellsModulesIndustrialbusinessvalueofPV(MillionUSD)SOURCEIEAPVPS&OTHERSVALUEFORTHEECONOMY/CONTINUED61IEAPVPSTRENDSINPHOTOVOLTAICAPPLICATIONS2022ChinaisbyfarthepredominantmanufacturingcountryinallstepsofthePVvaluechain,showsanapproximateshareof0,3%ofitsGDPrepresentedbythePVIndustry(polysilicon,wafers,cellsandmodules).Remarkably,whilehavingmuchlowerproductionvolumes,thePVindustryinMalaysiarepresentsasignificantlyhighershareofthecountry’sGDPcomparedtoChina,exceeding0,7%.Koreashowsanapproximate0,1%share,whileremainingcountriesdonotexceed0,03%.FortheBoS,theindustryissignificantlymoredistributed,andproductionoccursinmanycountries.Itisnotcountedassuchhere,butsuchananalysiswouldmakesensetograsptheextentofthePVindustryimpactonthecountries’economiclandscape.SOCIALIMPACTSEMPLOYMENTINPVFigure5.4givesanoverviewofthetotaljobsinIEAPVPScountriesandIndia.ReportednumbershavebeenestablishedbasedontheIEAPVPSNationalSurveyReportsandadditionalsourcessuchastheIRENAjobsdatabase.Itshouldbenotedthatthesenumbersarestronglydependentontheassumptionsandfieldofactivitiesconsideredintheupstreamanddownstreamsectorsandrepresentanestimateinthebestcase.FIGURE5.5B:PVINDUSTRIALBUSINESSVALUEALONGTHEVALUECHAININ20210102030405060708090100OtherJapanEuropeUSAMalaysiaSouthKoreaChinaPolySiWafersCellsModulesShareofcountrytotalPVindustrialvalue55,5BNUSD1,7BNUSD2,9BNUSD3,3BNUSD4BNUSD0,5BNUSD6,6BNUSDFIGURE5.5C:PVINDUSTRIALBUSINESSVALUEASSHAREOFGDPIN20210.00.10.20.30.40.50.60.70.8JapanEuropeUSAMalaysiaSouthKoreaChinaPolySiWafersCellsModulesShareofGDP(%)SOURCEIEAPVPS&OTHERSSOURCEIEAPVPS&OTHERSThemethodologythatwasusedstartedfromthedataprovidedbyreportingcountriesontheupstream(industrial)anddownstream(installationandO&M)jobnumbers,whichwerethenextrapolatedtoothermarketsdependingontheirrespectiveworkmarketspecifics.Adistinctionwasthereforemadebetweencountriesindevelopedeconomieshavingacostly,lowintensityworkmarketandtheemergingeconomieswithanaffordableworkforce.Manufacturingnumbersarebasedonindustryreportsandadditionalsourcesandsplitaccordingtothesamemethodology.Whennumbersdifferedfromofficialjobnumbers,officialnumberswerealwaysconsidered.Installationnumbersarealwaysanapproximation.ThisreportestimatesthatthePVsectoremployedanestimated4,3millionpeoplegloballyattheendof2021.Anestimated1,2millionwereemployedintheupstreampart,includingmaterialsandequipment,while3,1millionwereactiveinthedownstreampart,includingO&M.IEAPVPSTRENDSINPHOTOVOLTAICAPPLICATIONS202262PVsectoremployedanestimated4,3millionpeoplein2021AstheleadingproducerofPVproductsandtheworld’slargestinstallationmarket,ChinaismarkedlyleadingPVemploymentwitharound2,5millionjobsin2021,whichcorrespondstoasignificantlyhigherjobintensitythanalmostanywhereelse.Lowerbyoneorderofmagnitude,theUSAshowsatotalPVemploymentofabout255000FTE.TheEuropeanUnioncomesthirdintheFIGURE5.6:GLOBALEMPLOYMENTINPVPERCOUNTRYSOURCEIEAPVPS&OTHERS00.050,100,150,20,252,5FINLANDNORWAYPORTUGALSWEDENDENMARKAUSTRIASOUTHAFRICASWITZERLANDISRAELCANADABELGIUMMOROCCOITALYNETHERLANDSFRANCETHAILANDSPAINAUSTRALIAMEXICOTURKEYCHILEKOREAMALAYSIAGERMANYJAPAN(EU)UNITEDSTATESCHINAMillionjobsrankingofIEAPVPScountrieswithabout185000jobs,followedbyJapanwhichtakesfourthplacewitharound90000FTE.Generally,ingoodcorrelationwiththemarketevolutions,PVemploymentexpandedwherethemarketdeveloped:installationjobsareoftentemporaryones,dependingonthemarketdynamics.EmploymentdynamicsinthePVsectorareevolvinginlinewiththechangesinthePVmarketsandindustry.PVlabourplacetrendsreflectthestatusofthePVindustrylandscapedevelopmentandhowthesupplychainisbecomingmoreglobalisedandgeographicallydifferentiated.Whenspecificallyfocusingonthedevelopmentandinstallationactivities,whicharemorelabourintensivethanmanufacturing,itcanbeobservedthattheaverageFTEintensityperinstalledMWisaround15.However,thesenumbersvaryconsiderablyfromonecountrytoanotherandadditionallyfromonemarketsegmenttoanother.Small-scalePVgeneratesmorejobsthanutility-scalePVingeneral.VALUEFORTHEECONOMY/CONTINUED63IEAPVPSTRENDSINPHOTOVOLTAICAPPLICATIONS2022O&MgeneratesmanymanualjobswhiletheentirePVvaluechaincreatesgoodqualityjobs,fromresearchcentrestomanufacturing.Insummary,theupstreampartgeneratesaround5FTEperMWproducedwhilethedownstreampartgeneratesaround15FTEperMWinstalled.Withanestimatedtotalof4,3millionjobsinthesolarPVsectorworldwidein2021,PVemploysaroundonethirdofthetotalrenewableenergyworkforceandremainsnumberoneintheemploymentrankingoftheglobalrenewableenergysector.LOCALMANUFACTURINGTheemergenceofPVasamainstreamtechnologywokeupappetitesforlocalmanufacturingandjobcreationatalllevelsofthevaluechain.LookingatIEAPVPSmembercountriesonly,severalcountrieshavepushedthroughdifferentschemesforlocalmanufacturinginrecentyears,namelyCanada,France,Morocco,TurkeyandtheUSA.OthercountrieshavesucceededinbringingmanymanufacturerstoproducePVcomponentsintheircountry,suchasMalaysia,whichisthemostsuccessfulexampletodate.Others,suchasChileandSouthAfrica,areeyeingpossibilities.WiththedisruptionsinthePVvaluechaincausedbythepandemicsandtheincreasescostofshipment,thequestionoflocalmanufacturinghasgainedtractionin2021and2022.Whilelocalproductionrequiresinvestments,skillsand,ideallyastablelocalmarket,thisperspectiveisfacingasignificantlyhigherinterestfrompolicymakers.CountriessuchasIndiaorSaudiArabia,tonameafew,arepushinghardtodevelopalocalindustryandincreasetheirpartialindependence.IMPACTONELECTRICITYBILLSWhilemanyfocusedforyearsontheincreaseofelectricitybillsduetotheincentivesthatwerespenttodevelopPV(seechapter3),fewmentionthemerit-ordereffect.NumerousstudiesinvariouscountrieshaveshownthatPVreduceswholesalemarketpricesforelectricityatthetimeofproduction.Insomecases,negativepriceshavebeenseenattimesofhighPVpenetration,evenifthisisn’tthesolecause.Thesavingsforelectricityconsumersandthesociety,ingeneral,isdifficulttocomputebutmoststudiesconcludeonsignificantsavingsandadditionally,costdecreaseinthedistributiongriduptoacertainpenetrationofPV.TheargumentthatPV(andwind)mightrequireadditionalgaspeakersorcoal-firedpowerplantsisawrongunderstandingofthedynamicsofthebalancebetweensupplyanddemandofelectricity.However,muchremainstobedonetoexplaincarefullytheadvantagesofPVinreducingtheenergycostofend-consumers,eventhosewithoutPVplants,andcounterthefalsestatementsthatreducetheconfidenceofthepopulationintheenergytransformation.PVFORSOCIALPOLICIESBesidesitsdirectvaluefortheeconomyandthejobsthatitcreates,bothmakingcontributiontotheprosperityofthecountriesinwhichitisbeinginstalledandproduced,PVentailsadditionalpositiveimplicationsonthesociallevelifleveragedwithappropriatepolicies.Severalexamplescanbehighlighted.Asshownthroughtheoff-gridPVmarketdevelopmentinAfricaandAsia(seeChapter2),PVcanbeacompetitivealternativetoincreaseenergyaccessinremoteruralareasnotconnectedtopowergrids.Improvedenergyaccesscanbenefitruralbusinessperformance,freeupworkers’time,providemorestudyinghoursforchildren,improvehealththroughcleanercooking,andcreateorenhancejobsasaresult.Electrificationisakeyfactortoreducepovertyandincreaseeducation,withadirectimpactonwomen’sandchildren’slifestandardsinmanyregionsintheworld.Inthatrespect,PVwoulddeserveasignificantattentionforelectrification.InChina,sincetheendof2015,100%electrificationofthecountryhasbeenreached.So,therearenogovernmentsupportedprojectsforoff-gridruralelectrificationanymoresince2016.However,amassiveprogramforpovertyalleviationleaningonPVwaslaunched.Itaimedtoenhancethelifestandardsofaround2millionhouseholds,especiallyinthemostimpoverishedpartsofeasternChinabyinstallingaround5kWofPVperhousehold.Thispolicywashaltedin2021.InMalaysia,ruralelectrificationisstillapriorityofthegovernment,withaprojected100%electrificationrateby2025.Ruralelectrificationisdonetogetherwithutilitiesasaformofpublic-privatepartnership.InremoteSarawak,theSarawakAlternativeRuralElectrificationScheme(SARES)haselectrifiedalmost5000householdsin192villagessinceitslaunchin2016andhasreceivedregionalrecognitionin2019.SolarPVandhybridsystemsareoftenusedinthisscheme,aswellasmicrohydro-technologies.InKorea,inSeoul,withthefinancialaidfromSeoulMetropolitangovernment,anon-profitorganization,EnergyPeaceFoundation,andSolarTerracecompanyinstalled30kWmini-PVsystemsfor100energy-vulnerablehouseholds(300W/household).Thistypeofmini-PVinstallationsisbecomingpopularinKoreatoreducetheelectricitybillburdenduringthesummer.IEAPVPSTRENDSINPHOTOVOLTAICAPPLICATIONS202264InItaly,theMunicipalityofPortoTorres(SardiniaRegion),withthecollaborationoftheenergyservicesoperator,introducedin2017anenergyincomeproject.ThemunicipalityallocatedpublicresourcestopurchasePVsystems,soldonloantofamiliesinenergypovertyconditions,tomakethembenefitfromPVself-consumptionandthusreducetheirenergybills.Therevenuesofthenet-billingfeedapublicfund,inordertofinancethemaintenanceoftheplantsorpossiblythepurchaseofotherplantsforotherfamilies.Afterthisproject,someothermunicipalitiesand/orsomeRegionsareplanningandcarryingoutsimilarinitiatives.InAustralia,anumberofmeasureswereannouncedbyStateGovernmentsin2020andhavebeenmaintainedin2021goingfrominterestfreeloanstorebates(subsidyofupto50%ofthetotalcost)orevencompletesubsidies(SolarforLowIncomeHouseholdsforsystemswithaninstalledcapacityupto3kW).Additionalmeasurestacklingruralelectrificationincludeabudgettosupportfeasibilitystudieslookingatmicrogridtechnologiestoreplace,upgradeorsupplementexistingelectricitysupplyandtofinancethedeploymentofPVtoreducetheuseofdiesel.InFrance,ruralelectrificationisaddressedinoverseasterritoriesandisolatedalpineareasthroughbudgetsavailableforoff-gridelectricityproduction(1MEURbudgetin2021),electricvehiclechargingpointsorgrid-connectionfinancing.Ingeneral,thelowcostofPVelectricitycouldreachmorehouseholdstoalleviatepoverty,bothindevelopedanddevelopingcountries.Itoffersopportunitiesforsocialprograms,andespeciallytofightenergypoverty,whichhasnotbeenwidelyusedyet.WhilethereputationofPV,especiallyintheEuropeancountriesthatstartedtofunditsdevelopment,isoneofacostlyenergysource,increasingelectricityprices,therealityofPVin2021isthatitrepresentsatremendousopportunitytoreduceenergypricesforthepoorestcitizens,aswellastoreduceenergycostsforsocialhousing,publicbuildings,fromschoolstoretirementhomes,andincreasetheaccesstoelectricityforeveryone.Theenergycrisisof2022hasincreasedthecompetitivenessofPVtotheextentthatitcouldreducetheelectricitybilloffamiliesandcompanies,withorwithoutasuitableroof,usingsmartlythepossibilitiesofferedbydelocalized(orvirtual)self-consumption.AESTHETICSANDLANDSCAPEAsthelarge-scaleintegrationofphotovoltaicsintoourenergysystemisnecessaryforachievingtheenergytransition,largeareasofphotovoltaicmoduleswillbecomepartofourlandscapes.Veryoftenlandscapepreservationissuesarealreadyabarriertotheimplementationofthelarge-scaleimplementationofphotovoltaics,asthesocialacceptanceofsuchlandscapetransformationisingenerallow.Inordertosupportthediffusionofphotovoltaicsthisconditionrequiresaparadigmshifttoanenlargeddesignvisionthatincludesnotonlytechnical,engineeringconsiderations,butalsolandscapedesignones.Buildingabridgebetweenthelarge-scaledeploymentofphotovoltaicsandthelandscapedesign,pavingthewaytothedesignofsustainable,beautifulphotovoltaiclandscapesisnotoptionableanymore.Integratedphotovoltaicsolutionshaveabigpotentialintermsofpenetrationofphotovoltaics,asingeneralintegrationisatoolfordiffusingnewtechnologiesintoconservativeenvironments.Amongtheexistingintegratedsolutions,thesocalled“agrivoltaics”offerasolutiontoaddressingconcernsaboutenergyvs.agriculturallanduse,astheymaximizethelandusebygeneratingbothenergyandfoodsimultaneously.Atthesametimethesesystemsofferapossibilityforexperimentingwithavariedsetofsolutions,whichcanbeadaptedtodifferentlandscapefeatures.VALUEFORTHEECONOMY/CONTINUED65IEAPVPSTRENDSINPHOTOVOLTAICAPPLICATIONS2022sixCOMPETITIVENESSOFPVELECTRICITYIN2021TherapidpricedeclinethatPVexperiencedinthelastyearshasalreadyopenedpossibilitiestodevelopPVsystemsinmanylocationswithlimitedornofinancialincentives.However,theroadtofullcompetitivenessofPVsystemswithconventionalelectricitysourcesdependsonansweringmanyquestionsandbringinginnovativefinancialsolutions,especiallytoemergingchallenges.ThissectionaimsatdefiningwherePVstandsregardingitsowncompetitiveness,startingwithasurveyofmoduleandsystempricesinseveralIEAPVPSreportingcountries.Giventhenumberofparametersinvolvedincompetitivenesssimulations,thischapterwillmostlyhighlightthecomparativesituationinkeycountries.Pricesareoftenaveragedandshouldalwaysbelookedatassegmentrelated.Thequestionofcompetitivenessshouldalwaysbecontemplatedinthecontextofamarketenvironmentcreatedforconventionaltechnologiesandsometimesdistortedbyhistoricalorexistingincentives.Thefastdevelopmentofnuclearinsomecountriesinthelast40yearsisaperfectexampleofpolicy-driveninvestments,wheregovernmentsimposedthewaytogo,ratherthanlettingthemarketdecide.Theoilandgasmarketsarealsoperfectexamplesofpolicy-drivenenergieswhicharedeemedtooimportantnottobecontrolled.PVcompetitivenessshouldthereforebeconsideredinthissamerespect,ratherthanthesimpleideathatitshouldbeconsideredcompetitivenesswithoutanyregulatoryorfinancialsupport.Therearealsofurtherbarriers,otherthaneconomic,forPVtobecometheobviousalternativetocoal(ratherthangas)forutilities.Currently,manyalreadyunprofitablecoalpowerplantsarestillinoperationbecausetheregulatoryandfinancialstructureisnottailoredforsomanycoalunitstobecomestrandedassets.Inaddition,thechoiceofalternativestocoalisfrequentlynotmotivatedbypureeconomicsbutisbiasedtowardsanelectricitypriceandmarketdesignthatfavourgas-fuelledelectricity.Sinceallsourcesofelectricityhavebenefitedatsomepointfromsuchsupport,thequestionofthecompetitivenessofPVshouldbeconsideredcarefully.Hereunder,wewilllookatthekeyelementsdrivingthecompetitivenessofPVsolutions.MODULEPRICESTheveryfirstperiodofPVmarketdevelopmentcanbeconsideredstartingfromthefirstprototypestosmallscaleproductionleadingtoatotalPVinstalledcapacityofaround2GW.Duringthisfirstphase,pricesreductionscorrespondingtoalearningrateof18%wereachieved:thisallowedthetotalPVinstalledcapacitytocontinuegrowingfurther.Atthatpoint,pricesstabilizeduntilthetotalcapacityreachedaround10GW:thisperiodisknownasthetimeoflowavailabilityofpolysiliconthatmaintainedpricesatahighlevel.Then,athirdperiodstartedwhichisstillthecasetoday,beginningwiththemassproductionofPV,especiallyinChina.Duringthisperiodrangingfrom10GWtocurrentlevels,significanteconomiesofscaleledtoanimpressive41%learningrateoverthelastdecade.Figure6.2illustratesthepricesrangeforPVmodules:itshowsthatpricesgloballystabilizedin2020andincreasedslightlyin2021undertheimpactofconjuncturaleffectasaconsequenceofCovid19.PhotobyWernerSlocum,NREL65320IEAPVPSTRENDSINPHOTOVOLTAICAPPLICATIONS202266FIGURE6.1:PVMDOULESSPOTPRICESLEARNINGCURVE(1992-2021)0,1100,0Modulespotprice(USD/W)00010010111.00SmallscaleproductionPolysiliconshortageMassproductionLR=21%1,010,0TotalPVinstalledcapacity(GW)100,0LR=41%LR=18%SupplychaindisruptionFIGURE6.2:EVOLUTIONOFPVMODULESPRICESRANGEINUSD/W012345202120202019201820172016201520142013201220112010PriceofPVmodules(USD/W)SOURCEIEAPVPS&BECQUERELINSTITUTESOURCEIEAPVPS&OTHERSMODULEPRICES/CONTINUED67IEAPVPSTRENDSINPHOTOVOLTAICAPPLICATIONS2022Onaverage,thepriceofPVmodulesin2021(showninFigure6.2)accountedforapproximatelybetween40%and50%ofthelowestachievablepricesthathavebeenreportedforutilityscalesystems.In2021,thelowestpriceofmodulesinthereportingcountrieswasslightlyabove0,30USD/W,asignificantincreasecomparedtooneyearbefore,duetodisruptionintheglobalsupplychain.Itisassumedthatsuchpricesarevalidforhighvolumesandlatedelivery(notforinstallationsin2021).However,modulepricesforutility-scaleplantshavebeenreportedbelowtheaveragevalues,anywayuptoaround0,25USD/Wattheendof2021.TheChinesedecisioninMay2018ledtoanewimbalancebetweenproductionanddemand,withdozensofGWofnewproductioncapacitiesaddedin2017and2018inallsegmentsofthevaluechainwhiletheglobalPVmarketwasstagnating.Thepricedecreasethatfollowedacceleratedsomeprojectdevelopmentandcanbeconsideredatleastpartiallyresponsibleforthemarketgrowthin2020.Theyear2021hasseentheriseofmultiplerawmaterialprices.Inparticular,PVpolysiliconaveragespotpricessignificantlyduringtheyear,upfromaround10USD/kginearly2021.OtherkeyrawmaterialssuchasPVglass,copperoraluminiummaintainedtheirhighpricesreachedattheendof2020.Inaddition,thewholePVvaluechainsufferedfromtheimportantincreaseintransportcosts.Pricesbelow0,25USD/Wcanhardlygeneratebenefitsanditisgenerallyadmittedthatmostcompaniesarenotsellingalargepartoftheirproductionattheselowlevels.Itisalsoclearthatsuchpricescanbeconsideredbelowtheaverageproductioncostsofmanycompanies,evenifproductioncostsaredecliningaswell.Lookingindepthattherevenuesofsomemanufacturersamongthemostcompetitive,itappearsthataveragesalesareabovetheselowprices.Itcanalsobeassumedthatsuchpricesareobtainedwithnewproductionlinesinwhichproductioncostsaresignificantlylowerthanpreviouslyexistingones.Itcanalsobeassumedthatthemostcompetitivethinfilmtechnologiescanoutperformtraditionalcrystallinesiliconones.ThedecreaseinpolysiliconandwafercostsalsoledtosomePVmodules’pricedecreaseswithoutcostimprovementsatcellsandmoduleslevels.Highermodulepricesarestillobserveddependingonthemarket.Forinstance,thepricesinJapanareconsistentlyhigherthaninGermanyandtheUnitedStates,whileaveragesellingpriceswereingeneralstillinthe0,4USD/Wrangeformostproducers.FIGURE6.3:INDICATIVEMODULEPRICESINREPORTINGCOUNTRIES0.00.10.20.30.40.50.60.70.8AnnualPVmarket2021[GW]55GW5GW0.5GWUSD/WSOURCEIEAPVPS&OTHERSIEAPVPSTRENDSINPHOTOVOLTAICAPPLICATIONS202268SYSTEMPRICESReportedpricesforPVsystemsvarywidelyanddependonavarietyoffactorsincludingsystemsize,location,customertype,connectiontoanelectricitygrid,technicalspecifications,andtheextenttowhichend-userpricesreflecttherealcostsofallthecomponents.Formoredetailedinformation,thereaderisdirectedtoeachcountry’snationalsurveyreportontheIEAPVPSwebsite(www.iea-pvps.org/national-survey-reports).Figure6.4showstherangeofsystempricesintheglobalPVmarketin2021.Itshowsthataround65%ofthePVmarketconsistsofpricesbelow1USD/W.LargedistributedPVsystemsstartaround0,75USD/Wwhileutility-scalePVsawpricesaslowas0,55USD/W.BIPVcanbeseenasaseriesofsegmentswherethepricescansignificantlydiverge.Off-gridapplicationssufferfromasimilarsituation,withtotallydifferentcasesillustratedatdifferentprices.Ingeneral,thepricerangedecreasedfromthepreviousyearforallapplications.Onaverage,systempricesforthelowest-pricedoff-gridapplicationsaresignificantlyhigherthanforthelowest-pricedgrid-connectedapplications.Thisismainlyattributabletotherelativelyhighertransportcoststoaccessthesites.Indeed,large-scaleoff-gridsystemsareofteninstalledinplacesfarfromthegridbutalsofarfrommajortownsandhighways.Higherpricesaskedforsuchinstallationsalsodependonhighercostsforthetransportofcomponents,andtechnicians,withoutevenmentioningthehighercostsofmaintenance.In2021,thelowestsystempricesintheoff-gridsector,irrespectiveofthetypeofapplication,typicallyrangedfromabout2USD/Wto6USD/Wbutpricesforsomespecificapplicationscanbehigher.ThelargerangeofreportedpricesinFigure6.5isafunctionofthecountryandproject-specificfactors.Thehighestpriceshaven’tbeenincludedinthefiguresgiventheverylowlevelofinstallations:ingeneral,off-gridpriceshavebeenaveragedinthefiguresforreadabilityreasons.In2021,anincreasednumberoffloatingPVprojectshavebeenrealized,inparticularinSoutheastAsiaandEurope.Nevertheless,floatingPVwouldrequiresomefurtherdevelopmentstoidentifyreal-lifeprices.AdditionalinformationaboutthesystemsandpricesreportedformostcountriescanbefoundinthevariousNationalSurveyReports;excludingVAT.Moreexpensivegrid-connectedsystempricesareoftenassociatedwithroof-integratedslates,tiles,buildingintegrateddesignsorsingleprojects:BIPVsystemsingeneralareconsideredmoreexpensivewhenusingdedicatedcomponents,evenifpricesarealsoshowingsomedecline.ResidentialPVsystemspricerangedfrom1,8USD/Wto3USD/Win2021whileutility-scalePVsystemspricesrangedfrom0,35USD/Wto2,1USD/Win2021accordingtothedatacollected.FIGURE6.4:2021PVMARKETCOSTSRANGES012345678910USD/W100002000030000400005000060000700008000090000100000110000120000130000140000150000InstalledcapacityinMW1600001700000Utility-scalePVGround-mountedFloatingPVOff-GridPVDistributedPVasBuildingIntegratedDistributedPVonRooftops69IEAPVPSTRENDSINPHOTOVOLTAICAPPLICATIONS2022FIGURE6.5:EVOLUTIONOFRESIDENTIALANDGROUND-MOUNTEDSYSTEMSPRICERANGE2012-2021(USD/W)0,00,51,01,52,02,53,03,54,04,55,02021202020192018201720162015201420132012TypicalrangeforresidentialsystemsLowrangeresidentialsystemsPriceofPVsystems(USD/W)LowrangegroundmountedsystemsTypicalrangeforgroundmountedsystemsFIGURE6.6:INDICATIVEINSTALLEDSYSTEMPRICESINSELECTEDIEAPVPSREPORTINGCOUNTRIESIN20210.00.51.01.52.02.53.03.54.0Distributed-ResidentialDistributed-CommercialDistributed-IndustrialCentralizedUSD/WOff-gridAnnualPVmarket2021[GW]20GW2GW0.2GWSOURCEIEAPVPS&OTHERSSOURCEIEAPVPS&OTHERSIEAPVPSTRENDSINPHOTOVOLTAICAPPLICATIONS202270Thelowestachievableinstalledpriceofgrid-connectedsystemsin2021alsovariedbetweencountriesasshowninFigure6.6.Theaveragepriceofthesesystemsistiedtothesegment.Largegrid-connectedinstallationscanhaveeitherlowersystempricesdependingontheeconomiesofscaleachieved,orhighersystempriceswherethenatureofthebuildingintegrationandinstallation,degreeofinnovation,learningcostsinprojectmanagementandthepriceofcustom-mademodulesmaybeconsideredasquitesignificantfactors.Insummary,systempricesincreasedin2021,followingthetrendsofmodulepricesandthebalanceofthesystemwhilesoftcostsandmarginsremainedstable.Yet,systempricesbelow0,6USD/Wforlarge-scalePVsystemswerecommoninverycompetitivetenders,andsomereportpricesdownto0,35USD/WpinIndia.Thepreviouslyobservedtrendofpricerangestendingtoconverge,withthelowestpricesdecreasingatareducedratewhilethehighestpricesarereducingfasterwasbrokenin2021.Finally,thequestionofthelowestCAPEXisnotalwaysrepresentativeofthelowestLCOE:thecaseofutility-scalePVwithtrackersillustratesthis,withadditionalCAPEXtranslatingintoasignificantlyhigherLCOE.Bifacialcostsarenotvisibleinasystemcostfigure.COSTOFPVELECTRICITYInordertocompeteintheelectricitysector,PVtechnologiesneedtoprovideelectricityatacostequaltoorbelowthecostofothertechnologies.Obviously,powergenerationtechnologiesareprovidingelectricityatdifferentcosts,dependingontheirnature,thecostoffuel,thecostofmaintenanceandthenumberofoperatinghoursduringwhichtheyaredeliveringelectricity.ThecompetitivenessofPVcanbedefinedsimplyasthemomentwhen,inagivensituation,PVcanproduceelectricityatacheaperpricethanothersourcesofelectricitythatcouldhavedeliveredelectricityatthesametime.Therefore,thecompetitivenessofaPVsystemislinkedtothelocation,thetechnology,thecostofcapital,andthecostofthePVsystemitselfwhichhighlydependsonthenatureoftheinstallationanditssize.However,itwillalsodependontheenvironmentinwhichthesystemwilloperate.Off-gridapplicationsincompetitionwithdiesel-basedgenerationwillnotbecompetitiveatthesamemomentasalargeutility-scalePVinstallationcompetingwiththewholesalepricesonelectricitymarkets.ThecompetitivenessofPVisconnectedtothetypeofPVsystemanditsenvironment.GRIDPARITYGridParity(orSocketParity)referstothemomentwhenPVcanproduceelectricity(theLevelizedCostofElectricityorLCOE)atapricebelowthepriceofelectricityconsumedfromthegrid.Whilethisisvalidforpureplayers(theso-called“gridprice”referstothepriceofelectricityonthemarket),thisisbasedontwoassumptionsforprosumers(producerswhoarealsoconsumersofelectricity):•ThatPVelectricitycanbeconsumedlocally(eitherinreal-timeorthroughsomecompensationschemesuchaslocalordelocalizednetmetering);•ThatallthecomponentsoftheretailpriceofelectricitycanbecompensatedwhenithasbeenproducedbyPVandlocallyconsumed.Technicalsolutionswillallowforincreasesintheself-consumptionlevel(demand-sidemanagementincludingEVchargingordirectusetoheatwaterwithheatpumps,localelectricitystorage,reductionofthePVsystemsize,delocalizedself-consumption,energycommunities,etc.).Ifonlyapartoftheelectricityproducedcanbeself-consumed,thentheremainingpartmustbeinjectedintothegridandshouldgeneraterevenuesofthesameorderasanycentralizedproductionofelectricity.TodaythisisoftenguaranteedforsmallsizeinstallationsbythepossibilityofreceivingaFiT(orsimilar)fortheinjectedelectricity.Nevertheless,ifweconsiderhowPVcouldbecomecompetitive,thiswillimplydefiningawaytopricethiselectricitysothatsmallerproducerswillreceivefairrevenues.Thesecondassumptionimpliesthatthefullretailpriceofelectricitycouldbecompensated.Thepricepaidbyelectricityconsumersiscomposedingeneraloffourmaincomponents:•Theprocurementpriceofelectricityonelectricitymarketsplusthemarginsofthereseller;•Gridcostsandfees,partiallylinkedtotheconsumption,partiallyfixed;thekeychallengeistheirfutureevolution;•Taxes;•Levies(usedamongotherthingstofinancetheincentivesforsomerenewablesources,socialprogrammes,solidaritybetweenregionsetc.);SYSTEMPRICES/CONTINUED71IEAPVPSTRENDSINPHOTOVOLTAICAPPLICATIONS2022Iftheelectricityprocurementpricecanbecompensated,thetwoothercomponentsrequireconsideringthesystemimpactofsuchameasure;withtaxlossononesideandthelackoffinancingofdistributionandtransmissiongridsontheother.Whilethedebateontaxescanbesimple,sincePVinstallationsaregeneratingFIGURE6.7:LCOEOFPVELECTRICITYASAFUNCTIONOFSOLARIRRADIANCE&RETAILPRICESINKEYMARKETS800900100011001200130014001500160017001800050100150200250300350400450500550DENMARKUSATURKEYJAPANGERMANYBELGIUMSWEDENITALYAUSTRALIAPORTUGALFRANCEFINLANDSPAINAUSTRIANORWAYNETHERLANDSCHINAPriceofElectricityinUSD/MWhLCOEat2USD/WpLCOEat1USD/WpLCOEat0,5USD/WpYIELDkWh/kW/yearSWITZERLANDSOURCEIEAPVPS&OTHERSNOTE:THECOUNTRYYIELD(SOLARIRRDIANCE)HERESHOWNMUSTBECONSIDEREDASANAVERAGETHELOWESTELECTRICITYPRICES(RESPECTIVELYTHEHIGHEST)DISPLAYEDPERCOUNTRYSHOULDBESEENASANAVERAGEVALUEFORINDUSTRIALCONSUMERS(RESPECTIVELYRESIDENTIALCONSUMERS).Figure6.7showshowgridparityhasalreadybeenreachedinseveralcountriesandhowdecliningelectricitycostsarepavingthewayformorecountriesbecomingcompetitiveforPV.In2021,risingretailelectricitypriceshavefurtherstrengthenedthecompetitivenessofPVinanumberofcountries.ThefigureshowstherangeofretailpricesinselectedcountriesbasedontheiraveragesolarresourceandtheindicativePVelectricitythresholdforthreedifferentsystemprices(0,5,1and2USD/W,convertedintoLCOE).GreendotsarecaseswherePViscompetitiveinmostofthecases.Bluedotsshowwhereitreallydependsonthesystempricesandtheretailpricesofelectricity.taxesaswell,theoneongridfinancingismorecomplex.Evenifself-consumedelectricitycouldbefullycompensated,alternativewaystofinancethegridshouldbeconsideredgiventhelossofrevenuesforgridoperatorsorabetterunderstandingofPVpositiveimpactsonthegridshouldbeachieved.ThespecificcaseofBIPVconsists,forneworrenovatedroofs,toassessthecompetitivenessfortheBIPVsolutionminusthecostsofthetraditionalroofing(orfaçade)elements.Therestoftheassessmentissimilartoanybuildingunderself-consumptionusingastandardBAPVsolution.Ofcourse,iftheBIPVsolutionhastobeinstalledonabuildingoutsideofanyplannedworks,thisdoesn’tapply.Metricsusedforbuildingscanalsobedifferent,sincetheintegrationofPVcomponentsmightbejustifiedbynon-economicfactorsortheperspectiveofanaddedvalue.Forsuchreasons,BIPVcompetitivenessisingeneralassessedagainstthetraditionalbuildingcosts.IEAPVPSTRENDSINPHOTOVOLTAICAPPLICATIONS202272COMPETITIVENESSOFPVELECTRICITYWITHWHOLESALEELECTRICITYPRICESIncountrieswithanelectricitymarket,wholesaleelectricitypriceswhenPVproducesareonebenchmarkofPVcompetitiveness.Thesepricesdependonthemarketorganisationandthetechnologymixusedtogenerateelectricity.Inordertobecompetitivewiththeseprices,PVelectricityhastobegeneratedatthelowestpossibleprice.Thisisalreadyachievedwithlargeutility-scalePVinstallationsthatallowreachingthelowestsystempricestodaywithlowmaintenancecostsandalowcostofcapital.PlantshavebeencommissionedinrecentyearsinSpain,GermanyorChilewhichrelyonlyonremunerationfromelectricitymarkets.Itishighlyprobablethatenergy-onlymarketswillbecompletedbygridservicesandsimilaradditionalrevenues.However,suchplantsarealreadyviableandcalculationsshowthatmostofwesternEuropeancountriesforinstance,fromPortugaltoFinland,wouldbesuitableforsuchPVplantswith2020electricityprices.Underrisingelectricityprices,suchbusinessmodelshaveallowedtotakefulladvantageoftheshort-termconjuncturalfavourablesituationandthisinspiteofthePVsystemspriceincreaseobservedin2021.Suchbusinessmodelsremainhoweverriskierthanconventionalonesthatguaranteepricespaidtotheproducerover15yearsormore.Thekeyriskassociatedwithsuchbusinessmodelsliesintheevolutionofwholesalemarketpricesonthelongterm:itisknownthatPVreducespricesduringthemiddaypeakwhenpenetrationbecomessignificant.Ithasalsobeenshowninrecentyearsthatsuchinfluenceonpricesstillhasamarginalimpactonpricesduringtheentireyear.Withhighpenetrationandtheshifttoelectricityoftransportandheating,theinfluenceofPVelectricityonthemarketpriceisnotyetpreciselyknownandcouldrepresent(ornot)anissueinthemediumtolongterm:eitherpricesduringPVproductionwillstaydownandimpairtheabilitytoremuneratetheinvestmentorlowpriceswillattractadditionaldemandandwillstabilisethemarketprices.Atthispoint,bothoptionsremainpossiblewithoutpossibilitiestoidentifywhichonewilldevelop.Whenawholesalemarketdoesn’texistassuch,(inChinaforinstance),thecomparisonpointistheproductioncostofelectricityfromcoal-firedpowerplants.FUEL-PARITYANDOFF-GRIDSYSTEMSOff-gridsystemsincludinghybridPV/dieselcanbeconsideredcompetitivewhenPVcanprovideelectricityatacheapercostthantheconventionalgenerator.Forsomeoff-gridapplications,thecostofthebatterybankandthechargecontrollershouldbeconsideredintheupfrontandmaintenancecostswhileahybridsystemwillconsiderthecostoffuelsavedbythePVsystem.ThepointatwhichPVcompetitivenesswillbereachedforthesehybridsystemstakesintoaccountfuelsavingsduetothereductionofoperatinghoursofthegenerator.Fuel-parityreferstothemomentintimewhentheinstallationofaPVsystemcanbefinancedwithfuelsavingsonly.ItisassumedthatPVhasreachedfuel-parity,basedonfuelprices,innumerousSunbeltcountries.Otheroff-gridsystemsareoftennotreplacingexistinggenerationsourcesbutprovidingelectricityinplaceswithnonetworkandnoorlittleuseofdieselgenerators.Theyrepresentacompletelynewwaytoprovideelectricitytohundredsofmillionsofpeopleallovertheworld.PRODUCINGCOMPETITIVEGREENHYDROGENWITHPVThedecliningcostofPVelectricityopensthedoorforotherapplicationsandespeciallythepossibleproductionof“green”hydrogendirectlyfromPV(possiblyincombinationwithwind).Whilethebusinessmodelbehindisbeingexplored,inparticularinAustralia,Chile,China,France,Japan,Korea,PortugalandSpain,thecostofPVelectricityshouldreachlowerlevels,whilethecostofelectrolysersshoulddecreaseaswelltomakegreenhydrogencompetitive.Thisperspectiveisnotsofaraway,andsomestarttoenvisageapossiblecompetitivenessinthecomingyearsforspecificusesofhydrogen.Whilethecompetitivenesswith“black”hydrogenseemsstillunreachableforthetimebeing,otherusesintransport,someindustrialapplicationsandpossiblyagriculture(throughammonia),mightcreateatremendousopportunityforPVtoproducehydrogenwithoutbeingconnectedtothegrid.SuchadevelopmentwouldincreasepossiblythePVmarketsignificantlyoutsideoftheconstraintsitexperiencesforthetimebeing.COSTOFPVELECTRICITY/CONTINUED73IEAPVPSTRENDSINPHOTOVOLTAICAPPLICATIONS2022FIGURE6.8.A:NORMALISEDLCOEFORSOLARPVBASEDONLOWESTPPAPRICES2016-Q42021USD/MWh0102030405060708090100H22021H12021H22020H12020H22019H12019H22018H12018H22017H12017H22016H12016WithYield=2000kWh/kWpWithYield=1000kWh/kWpOriginalTendersMEXICOUNITEDARABEMIRATESINDIAMEXICOBRAZILINDIAINDIAPORTUGALQATARPORTUGALSAUDIARABIACHILEFIGURE6.8.B:NORMALISEDLCOEFORSOLARPVBASEDONRECENTPPAPRICES2021USD/MWh050100150200250300Dec2021Nov2021Oct2021Sep2021Aug2021Jul2021Jun2021May2021Apr2021Mar2021Feb2021Jan2021GREECETURKEYUZBEKISTANFRANCEGERMANYSPAINMALTAMALAYSIASAUDIARABIARUSSIAINDIAINDIACHILEFRANCEHUNGARYPOLANDARMENIAINDIAKOREABELGIUMWithYield=2000kWh/kWpWithYield=1000kWh/kWpOriginalTendersSOURCEIEAPVPS&OTHERSSOURCEIEAPVPS&OTHERSBASEDONLOWESTPPAPRICESPERSEMESTERRECORDLOWTENDERSIEAPVPSTRENDSINPHOTOVOLTAICAPPLICATIONS202274WithseveralcountrieshavingadoptedtendersasawaytoallocatePPAstoPVprojects,thevalueofthesePPAsachievedrecordlowlevelsin2020andsomelowpriceswereagainreachedin2021.Theselevelsaresufficientlylowtobementionedsincetheyapproach,orinmanycasesbeat,thepriceofwholesaleelectricityinseveralcountries.WhilethesetendersdonotrepresentthemajorityofPVprojects,theyhaveshowntheabilityofPVtechnologytoprovideextremelycheapelectricityundertheconditionofalowsystemprice.(below0,5USD/W)andalowcostofcapital.Thequestionofcompetitivenesswithwholesalemarketprices(incountrieswheresuchmarketforelectricityexists),dependshighlyontheaveragemarketpricesseen.InEurope,2022hasexperiencedsuchaninsanemarketpriceincrease(upto1000%increasecomparedtoearly2021)thatPVpricesvariationshavenoimpactatallonthecompetitivenessofPV:whiletheLCOEofPVcanbeestimatedforutility-scaleplantsinEuropebetween20and60EUR/MWh,marketpricesrangingfrom200to650EUR/MWhhavebeenseeninnumerouscountries(spotprice).Whilethesepricesarehighlyinfluencedbythe2022highgaspricesresultingfromthewarinUkraineandthesanctionsagainstRussia,theyconstituteanywayarecordlevelthatmakesPVcompetitiveinallcases.TABLE6.1:TOP10LOWESTWINNINGBIDSINPVTENDERSFORUTILTYSCALEPVSYSTEMREGIONCOUNTRY/STATEUSD/MWHYEARMIDDLEEASTSAUDIARABIA10,42021EUROPEPORTUGAL13,22020LATINAMERICACHILE13,32021MIDDLEEASTUNITEDARABEMIRATES13,52020MIDDLEEASTQATAR14,52020MIDDLEEASTSAUDIARABIA14,82021EUROPESPAIN15,02021EUROPEPORTUGAL17,52019LATINAMERICABRAZIL17,52019ASIAUZBEKISTAN17,92021SOURCEIEAPVPS&OTHERSTABLE6.2:LOWESTWINNINGBIDSINPVTENDERSFORUTILTYSCALEPVSYSTEMPERREGIONREGIONCOUNTRY/STATEUSD/MWHYEARASIAUZBEKISTAN17,92021AFRICATUNISIA24,42019EUROPEPORTUGAL13,22020LATINAMERICACHILE13,32021MIDDLEEASTSAUDIARABIA10,42021NORTHAMERICAMEXICO20,62017SOURCEIEAPVPS&OTHERSCOSTOFPVELECTRICITY/CONTINUED75IEAPVPSTRENDSINPHOTOVOLTAICAPPLICATIONS2022sevenPVINTHEENERGYSECTORPVELECTRICITYPRODUCTIONTRACKINGOFPVINSTALLEDCAPACITYANDMONITORINGOFPVPRODUCTIONTrackingPVinstallationsinalltheregionsoftheworldcanbechallengingasmanycountriesdonotaccuratelykeeptrackofthePVsystemsinstalledordonotmakethedatapubliclyavailable.Furthermore,PVelectricityproductioniseasytomeasureatapowerplantbutmuchmorecomplicatedtocompileforanentirecountry.First,theinstalledcapacitymustbeaccuratelytracked,whichrequiresaneffectiveandconsistentapproach,especiallyfordistributedandoff-gridsegments.Second,theelectricityproductioncannotaccuratelybederivedfromtheinstalledPVcapacityatacertainpointintime.Indeed,asysteminstalledattheendoftheyearwillhaveproducedonlyasmallfractionofitstheoreticalannualelectricityoutput.Forthesereasons,theelectricityproductionfromPVpercountryinthisreportisanestimatethatwewillcall“averagetheoreticalproduction”.TocalculatetheaveragetheoreticalPVproduction,theaveragesolaryieldinthecountryisused.ThenumberhasbeenprovidedthroughNationalSurveyReports,aswellasadditionalsourcesandisanapproximationofthereality.Asareminder,PVproductioncannotbecalculatedbasedontheACvaluebutrequirestheDCvalueandthecharacteristicsofthePVplant.DECOMMISSIONINGAsanincreasingshareoftheglobalinstalledPVcapacityisattainingacertainlifetime-withtheveryfirstwavesofinstallationsdatingbacktothenineties-decommissioningmustbeconsideredtoestimatethePVcapacity.However,theeffectmightstillbelimitedattheglobalscaleaslessthan0,1%ofthecumulativecapacityhasbeeninstalledbeforetheyear2000andonly6%beforetheyear2010.Furthermore,whenavailable,officialnumbersshouldtakedecommissioningintoaccount,whichisthecaseformostIEAPVPScountries.Inthatrespect,off-gridnumbersinseveralcountrieshavedecreasedduetodecommissioning.Recyclingnumbersareunderestimatingdecommissioningduetoavivid(andsometimesbarelylegal)second-handmarket,especiallytowardsAfrica.IEAPVPSTRENDSINPHOTOVOLTAICAPPLICATIONS202276PVPERFORMANCELOSSESThecalculationoftheevolutionofaPVsystemperformanceiscrucialtoprovidemoreaccuratevaluestobeusedinyieldassessmentsnotonlyintermsofabsolutevalue.Inordertobeabletojudgeasystemperformance,theperformanceloss(PL)mustbecalculated.ThecalculationofPLinPVsystemsisnottrivialasthe“true”valueremainsunknown.Severalmethodologieshavebeenproposed,howeverthereisnoconsensusandthusastandardizedapproachtothecalculation.ThecombinationoftemperaturecorrectedPRwiththeuseofYearonYearorSTLperformsverywellcomparedtoothers.WithintheIEAPVPSTask13,agroupofexpertsrepresentingseveralleadingR&Dcenters,universitiesandindustrycompanies,isdevelopingaframeworkforthecalculationofPerformanceLossRates(PLR)onalargenumberofcommercialandresearchPVpowerplantsandrelatedweatherdatacomingfromvariousclimaticzones.VariousmethodologiesareappliedforthecalculationofPLR,whicharebenchmarkedintermsofuncertaintiesand“true”values.TheaimoftheinternationalcollaborationistoshowhowtocalculatethePLRonhighqualitydata(hightimeresolution,reliabledata,irradiance,yield,etc.)andonlowqualitydata(lowtimeresolution,onlyenergydataavailable).Variousalgorithmsandmodels,alongwithdifferenttimeaveragingandfilteringcriteria,canbeappliedforthePLRcalculation,eachofwhichcanhaveanimpactontheresults.Theapproachconsidersthreepathwaystoensurebroadcollaborationandincreasethestatisticalrelevanceofthestudyandthecombinationofmetrics(PRorpowerbased).Furthermore,methodologiesarebenchmarkedintermsofdeviationfromtheaveragevalueandintermsofstandarddeviation.PVPENETRATIONPVelectricitypenetrationistheratiobetweenPVelectricityproductioninacountryandtheelectricitydemandinthatcountryandisexpressedasapercentage.ElectricitydemandisobtainedviapubliclyavailabledatabasesandviatheIEAPVPSexperts.Manyothercountrieshavelowerproductionnumbers,butintotal36countriesproducedatleast1%oftheirelectricitydemandfromPVin2021.Realfiguresmightbelowersincesomeinstallationsdidn’tproduceelectricityduringtheentireyear,butalsosincesomeplantsmighthaveexperiencedproductionissues,duetotechnicalproblemsorexternalconstraints(e.g.,inFrance,PVpenetrationasreportedbyRTE(FrenchTSO)liesaround3%).TherealPVproductioninacountryisdifficulttoassess,especiallywhenself-consumptionandstorageenterintoconsideration.IEAPVPSadvocatesforgovernmentsandenergystakeholders,includinggridoperatorstocreateaccuratedatabasesandmeasurepreciselyPVproduction.ConcerningglobalPVpenetration,witharound946GWinstalledworldwide,PVcouldproducealmost1229TWh(seeTable7.1)ofelectricityonayearlybasis.Thisrepresentsaround5%oftheglobalelectricitydemandcoveredbyPVaspresentedinfigure7.1.PerformancelossesduetoagingofPVplantsarenotconsideredatthispoint.PVELECTRICITYPRODUCTION/CONTINUED77IEAPVPSTRENDSINPHOTOVOLTAICAPPLICATIONS2022TABLE7,1:2021PVELECTRICITYSTATISTICSINIEAPVPSCOUNTRIESCOUNTRYFINALELECTRICITYCONSUMPTION2021HABITANTS2021GDP2021SURFACEAVERAGEYIELDPVCUMULAIVEINSTALLEDCAPACITY2021PVANNUALINSTALLEDCAPACITY2021PVELECTRICITYPRODUCTIONANNUALCAPACITYPERCAPITACUMULATIVECAPACITYPERCAPITACUMULATIVECAPACITYPERKM2THEORETICALPVPENETRATIONTWHMILLIONBUSDKM2KWH/KWPMWMWTWHW/CAPW/CAPKW/KM2%AUSTRALIA26726154376900001400260354944361921011313,6%AUSTRIA6694778400010502783739383313334,4%BELGIUM82116003368892571238507746202118,0%CANADA56238199199850001150413542151110900,8%CHILE791931775609616996165268110140321813,3%CHINA7714140017734963400013003085205488040139220325,2%DENMARK3763974400097523447182122399536,2%FINLAND8162993909088754131000187510,4%FRANCE44167293754396511801645033501950245304,4%GERMANY503834223357170978596615760586971816711,6%ISRAEL689482207701750334993561013601618,6%ITALY3185921003013361137225949442616374758,1%JAPAN78312650653779751050784136545825262220710,5%KOREA553521799100401113721548422524814162154,4%MALAYSIA15433373330621131423303703117172,0%MEXICO2911301293196438017088199162514126344,8%NETHERLANDS115181018415009941434936321420781834612,4%NORWAY127548238517888220545083810,1%PORTUGAL47102509222516131647571355159185,6%SPAIN2334714255059901646185034900301053963713,1%SWEDEN14010627407284950179859925717241,2%SWITZERLAND589813412859853656683479422896,2%SOUTHAFRICA19760351121909017334630458887744,1%THAILAND19070506121909215224078500675833,3%TURKEY2848581578356015001091714921618128145,8%USA393033222996914728114161230042687317481371134,4%WORLD25000783796100134325435130017353494535412292212174,9%SOURCEIEAPVPS&OTHERSIEAPVPSTRENDSINPHOTOVOLTAICAPPLICATIONS202278FIGURE7.2:SHAREOFRENEWABLEINTHEGLOBALELECTRICITYPRODUCTIONIN2021FOSSIL&NUCLEAR,71%HYDROPOWER,15%OTHERRES,2%WIND,7%PV,5%SOURCEREN21,IEAPVPSFIGURE7.3:NEWRENEWABLEINSTALLEDCAPACITYIN2021PV,55%OTHERRES(HYDRONOTINCLUDED),4%HYDROPOWER,8%WINDONSHORE,26%WINDOFFSHORE,6%SOURCEREN21,IEAPVPSFIGURE7.1:PVCONTRIBUTIONTOELECTRICITYDEMAND2021NorwayFinlandCanadaSwedenMalaysiaSlovakiaSloveniaThailandBrazilCzechRepublicTaiwanRomaniaSouthAfricaUSAKoreaAustriaFranceMexicoChinaBulgariaPortugalTurkeySwitzerlandDenmarkIndiaBelgiumIsraelJapanGermanyHondurasNetherlandsGreeceSpainChileAustraliaWorldPVPScountriesNon-PVPScountries0246810121416UkItaly%SOURCEIEAPVPS&OTHERSPVELECTRICITYPRODUCTION/CONTINUED79IEAPVPSTRENDSINPHOTOVOLTAICAPPLICATIONS2022PVINTEGRATIONANDSECTORCOUPLINGPVcouldmakeEVsgreenerfaster.Theshiftfromfossilfuelstoelectricityforindividualtransportationandespeciallycarsandlight-dutyvehiclesisanecessarysteptowardsthedecarbonizationofthetransportsector.However,therealemissionsofGHGforEVsdependonthepowermixusedtochargecars.Incountrieswithapowermixheavilyrelyingonfossilfuels,theemissionswillremainhigherthanincountrieswitharenewableorcarbon-freemix.Inthatrespect,someinitiativespoppedupintherecentmonthsinEuropetoconnectthefastdevelopmentoftheEVmarkettorenewablesandespeciallyPV.Theideatoproposetotheautomotiveindustrytodecarbonizecompletelyelectricvehicleswouldimplytosellrenewableenergycontractsor,easier,sharesinPVplants,whenanEVisbroughttothemarket.FromPVtoVIPVandVAPVWithitsdistributednature,PVfitsperfectlywithEVchargingduringthedaywhencarsarestationedintheofficesparkingorathome.Suchslowchargingisalsohighlycompatiblewithdistributiongridconstraints.Finally,theintegrationofPVinthevehiclesthemselves,theso-calledVIPV,alsooffersopportunitiestoalleviatetheburdenonthegrid,increasetheautonomyofEVsandconnectstheautomotiveandPVsectors.2021showedannouncementsfromseveralmanufacturers,especiallyinJapanandKorea,butalsoGermanyandtheNetherlands,forVIPVsystemsintegratedinEVs.Recently,somefirsthigh-endcommercialproductshavebecomeavailableinEurope.TheIEAPVPSTask17dealswiththisfastemergingsubject.THEENERGYSTORAGEMARKETIngeneral,batterystorageisseenbysomeasanopportunitytosolvesomegridintegrationissueslinkedtoPVandtoincreasetheself-consumptionratioofdistributedPVplants.Despitetheirdecreasingcosts,suchsolutionsarenotyeteconomicallyviableinallcountriesandmarketsegments.However,theadoptionofbatteriesisontherisebothintheresidentialsegmentsandinthecommercialsegmentsasmoreandmoreconsumersarewillingtomaximisetheirself-consumptionandtooptimizetheirconsumptionprofile.Morelarge-scalePVplantsarebeingbuiltincombinationwithbatteries,whichcanbeusedtostabilizegridinjection,reducecurtailment,and,insomecases,toprovideancillaryservicestothegrid.ThedisplacementofenergytowardstheeveningpeakallowsbenefitingfromhigherwholesalemarketpricesandchangestheinjectionpatternofPV.AnincreasingnumberoftendersarerequiringPVtobeinstalledwithstorage.Globally,thelargestpartofbatteriessoldareusedfortransportationinEVs,stationarystorageremainstheexceptionandvolumesremainsmall.However,therapiddevelopmentofelectricmobilityisdrivingbatterypricesdownmuchfasterthananycouldhaveexpectedinthestationarymarketalone.ThiscouldgiveahugepushtothedevelopmentofstorageasatooltoeasePVinstallationsinsomespecificconditions.Inaddition,newrequirementsforgridintegrationintenderstendtofavourtheuseofstationarybatteriesinutility-scaleplantstosmooththeoutputoftheplant,reducecurtailmentorreducetheneedforgridcapacityreinforcement,howeverthistrendwouldrequiresomemoreyearstobeconfirmed.THEELECTRIFICATIONOFTRANSPORTTheroleofPVasanenablerofthatenergytransitionismoreandmoreobviousandtheideaofpoweringmobilitywithsolarisbecomingslowlyarealityasanincreasingnumberofcommercialpartnershipscombineEVchargingstationstosolarsystemsforprivateandpublicuse.IEAPVPSTRENDSINPHOTOVOLTAICAPPLICATIONS202280THEELECTRIFICATIONOFHEATINGANDCOOLINGTherecentdevelopmentofPVself-consumptionespeciallyinEuropehascreatednewopportunitiestousesolarelectricityforspecificbuildingsappliances.Amongothers,evenifthesolarproductionisnotdirectlylinkedtoconsumptionloadinthecaseofspaceheating,itisbecomingarealsourceofinteresttousesolarPVelectricitytofeedelectricdomestichotwatertanksforinstance.Hotwatertankscanalsoserveasstorageandcanbesuccessfullycombinedwithaheatpump.SeveralEuropeanmanufacturersofelectricdomestichotwatertanksarenowofferingspecificelectronicdevicestodirectlylinkextraPVproductiontoanelectricboiler.Hotwatertanksallowtoincreasetheself-consumptionandtostorethePVproduction.MoresinglehouseholdownerswithPVsystemstakeaninterestinthoseinordertoincreaseself-consumption.SpecificrecommendationsexistforconnectionandmeteringofstoragesystemsinSwitzerlandforinstance.AnotherverypromisingsegmentintheuseofsolarPVelectricityistheuseforcooling.BeyondEurope,alotofcountriesareveryinterestedinthelinkbetweenaddressingtheveryrapidlyincreasingenergyneedforairconditioningduetotheveryattractivepresentandfuturecostofPVelectricity.ChinaisattheforefrontworldwideforthesupplyofPVairconditioningsolutions,mainlyinthedomestichouseholdsegment.Forlargercoupling,norealcommercialproductsareavailable.Nevertheless,moreandmoredesignofsolarPVsystemsbasedonself-consumptionarelinkedtosomespecificuseofadaptedwaterchillersincludingcoldwaterstorage.ThisaxisofinnovationtoconvertgreenelectricityincoolingandcoldstorageisthereforeseenbytheIEAPVPSTasksasaverypromisingwaytoabsorbthepeakproductionofPV,especiallyinsunnyemergingeconomies.Indeed,placeswheregridstressisverypresentinsummertime,benefitingfromsolarcoolingandcoolingthermalstoragebasedonlocalPVproductioncanbecomeaverypowerfultool.Theuseofsolarenergy,namelysolarPVandsolarthermal,forcoolingisprofitingfromJuly2020aspecificIEASHCTaskcalledTask65(https://task65.iea-shc.org/)whichwillfocusworldwideoninnovativewaystoadaptanddevelopexistingtechnologies(solarandheatpumps)forsunnyandhotclimates.GREENHYDROGENGreenhydrogenreferstohydrogenproducedfromrenewablesources,oppositelytohydrogenproducedfromfossilfuelsornuclearpower.Hydrogenisincreasinglyseenasapartialanswertodecarbonizesomesectors(especiallythemaritimesectorandlongdistance,heavyweightroadtransport.Inthatrespect,greenhydrogenispartofnumerousresearchprogramsandearlyindustrializationprojectshavebeeninitiatedin2021.ProducedbycompetitivePV,transformedinhydrogenfordirectuse,orunderitsderivatives(ammonia,etc.),itcanalsobestoredandreproduceelectricity,eveniftheoverallefficiencydecreasessignificantly.PVINTEGRATIONANDSECTORCOUPLING/CONTINUED81IEAPVPSTRENDSINPHOTOVOLTAICAPPLICATIONS2022ANNEXESANNEX1:AVERAGE2021EXCHANGERATESCOUNTRYCURRENCYCODEEXCHANGERATEIN2021(1USD=)AUSTRALIAAUD1,332CANADACAD1,254CHILECLP760,36CHINACNY6,452DENMARKDKK6,29EUROZONEEUR0,846ISRAELILS3,232JAPANJPY109,817KOREAKRW1144,883MALAYSIAMYR4,144MEXICOMXN20,284MOROCCOMAD8,995NORWAYNOK8,598SOUTHAFRICAZAR14,789SWEDENSEK8,584SWITZERLANDCHF0,914THAILANDTHB31,997TURKEYTRY8,904UNITEDSTATESUSD1SOURCEIRSIEAPVPSTRENDSINPHOTOVOLTAICAPPLICATIONS202282ANNEX2:CUMULATIVEINSTALLEDPVCAPACITY(MWp)FROM1992TO2021COUNTRY199219931994199519961997199819992000200120022003200420052006200720082009201020112012201320142015201620172018201920202021AUSTRALIA791113161923252934394652617082105187571137624163226409251095985713211586163992109126035AUSTRIA1111223456101721242628325395187363626785937109612691455170220432783BELGIUM00000000000000624112671110821762870313932453355353538654310512762737123CANADA11223346791012141720263395281559766121118432519266529133130338837134135CHILE00000000000000000000312221576112518372406269434846165CHINA0000000011163444546272921322927923492669217682283224347278022130882175142205440253640308520DENMARK000000111112222334729499698751979106111391254136216262344FINLAND00000000000111223579999203780134214313413FRANCE2223468911141721242638762184401446356249065692683779208636971310755119301309816450GERMANY691218284254701141762964351105205628994170612010566180062591634077367103790039224406794229345181490165390159661ISRAEL0000000000000000122671862723775887718779521358196024143349ITALY81214161617181819202226313750100496127736051314116796181981860718915192971968220108208652165022594JAPAN192431436091133209330453637860113214221708191921442627361849146632135992333934151420404950056162631927186878413KOREA00000000005691436813575246507291024155524813615450258358099126651732321548MALAYSIA0000000000000001112434145213273352401918141719612330MEXICO009910111213141516171819202122253140521121792463114853075500165748199MOROCCO00000000000000000000000000205206206699NETHERLANDS000001115916224043454959691111703907671069153620612914460972251071714349NORWAY000000006666777888899101214264468120160205PORTUGAL000000000122333186810813417524429941845451958567390710771647SOUTHAFRICA00000000000000000000631113921486228023492409287241724630SPAIN0000000002511214312561833513392382942334532463846614707476248975159100751360318503SWEDEN111222233334445689111523427712518426942972012001798SWITZERLAND5678101113141618202224283037498012522343775610611394166419062173249829733656THAILAND000000000000024303233434924338782312981420244630563513352935784078TURKEY00000000000011111111632643581175420673398551942410917UNITEDSTATES00000000000011119029545575311882017393771301207618321258214097351818624987627496131123004RESTOFEUCOUNTRIES00000000001112123344268505222229085039742078208218860089809862117151677723321TOTALIEAPVPS5065901151502062713725727831142156326944106552678891417722191387946823495613130165165604207614274909359002444009527065640989776869TOTALNONIEAPVPS0000000018142333456794178319796281252378449131332161231107498746949299294130830168485TOTAL50659011515020627137257379011561587272741525593798314355225103959071046100850138614178736229225306016408876513502626359771819945354SOURCEIEAPVPS,BECQUERELINSTITUTE&OTHERSANNEXES83IEAPVPSTRENDSINPHOTOVOLTAICAPPLICATIONS2022ANNEXES/CONTINUEDANNEX3:ANNUALINSTALLEDPVCAPACITY(MWp)FROM1992TO2021COUNTRY199219931994199519961997199819992000200120022003200420052006200720082009201020112012201320142015201620172018201920202021AUSTRALIA72223343446678101222833838061039811866101887611474454481346924944AUSTRIA10000011114643225204392176263159152159173186247341739BELGIUM000000000000006188855943710686942691061101803304458171146850CANADA1000111112122345762187277208445633675146249217258325421CHILE00000000000000000000392093555497125692887902681CHINA00000000115191010810204016050027003200109901064015150345505286044260303004820054880DENMARK000000001000000001322470199532288178115109264718FINLAND00000000000000101222000111743538198100FRANCE2001222223343212381432221006211613447861145108371610771042117511683350GERMANY6336101412164462120139670951843127119504446744079108161263311901324145516142888383548855760ISRAEL0000000000000000121451198610521118310675406602454935ITALY8422011111245713503967812328953636551402409308382385426758785944JAPAN19571216324275122123184223272290287210225483991129617186968974010811788974606662703086766545KOREA00000000005135224527616712779295531926113488713332265456646584225MALAYSIA000000000000000000123411167617849517499543370MEXICO0090111111111111136912606767651742590192615731625MOROCCO0000000000000000000000000020510493NETHERLANDS00000000438618423101042592203773024675258531695261634923632NORWAY000000006000000100001122111825514045PORTUGAL0000000001001001450402641695511936656688234170571SOUTHAFRICA00000000000000000000630510819479469604631300458SPAIN000000000236103282493273341437404299106234655135262491635284900SWEDEN1000000000000011212481935485985160291480599SWITZERLAND511122222222242712304698214319305333270242267325475683THAILAND00000000000002472110619414443647512210276104561649500TURKEY00000000000000000000526322948183031313312128741492UNITEDSTATES0000000000001117910516029843582919203193494662457500151521084510680137761985726873RESTOFEUCOUNTRIES000000000001010211727437171768621302381400398382380882185350626546TOTALIEAPVPS5016252535566510119921136042111301423142023636288801416603294402738234552354384201067295840938500783057113925135880TOTALNONIEAPVPS00000000176910122127851414772016242232124685847894851876719618298013153737654TOTAL5016252535566510120021836643011401435144123906372815517080314562980537765401235048876780102860104625112858145461173534IEAPVPSTRENDSINPHOTOVOLTAICAPPLICATIONS202284LISTOFFIGURESFIGURE2.1:EVOLUTIONOFCUMULATIVEPVINSTALLATIONS10FIGURE2.2:PVPENETRATIONPERCAPITAIN202111FIGURE2.3:EVOLUTIONOFANNUALPVINSTALLATIONS11FIGURE2.4:EVOLUTIONOFMARKETSHAREOFTOPCOUNTRIES12FIGURE2.5:GLOBALPVMARKETIN202114FIGURE2.6:CUMULATIVEPVCAPACITYEND202114FIGURE2.7:EVOLUTIONOFREGIONALPVINSTALLATIONS15FIGURE2.8:2018-2021GROWTHPERREGION15FIGURE2.9:CENTRALIZEDPVINSTALLEDCAPACITYPERREGION202117FIGURE2.10:CENTRALIZEDPVCUMULATIVEINSTALLEDCAPACITYPERREGION202117FIGURE2.11:DISTRIBUTEDPVINSTALLEDCAPACITYPERREGION202118FIGURE2.12:DISTRIBUTEDPVCUMULATIVEINSTALLEDCAPACITYPERREGION202118FIGURE2.13:ANNUALSHAREOFCENTRALIZEDANDDISTRIBUTEDGRID-CONNECTEDINSTALLATIONS2011–202119FIGURE2.14:CUMULATIVESHAREOFGRIDCONNECTEDPVINSTALLATIONS2011–202119FIGURE2.15:ANNUALGRID-CONNECTEDCENTRALIZEDANDDISTRIBUTEDPVINSTALLATIONSBYREGIONIN202122FIGURE2.16:EVOLUTIONOFPVINSTALLATIONSINTHEAMERICASPERSEGMENT23FIGURE2.17:EVOLUTIONOFPVINSTALLATIONSINASIAPACIFICPERSEGMENT25FIGURE2.18:EVOLUTIONOFPVINSTALLATIONSINEUROPEPERSEGMENT26FIGURE2.19:EVOLUTIONOFPVINSTALLATIONSINAFRICAANDTHEMIDDLEEASTPERSEGMENT28FIGURE3.1:EVOLUTIONOFMARKETINCENTIVESANDENABLERS:2010,2015,202132FIGURE3.2A:MAINDRIVERSOFTHEDISTRIBUTEDPVMARKETIN202133FIGURE3.2B:MAINDRIVERSOFTHECENTRALIZEDPVMARKETIN202133FIGURE4.1:PVSYSTEMVALUECHAIN(EXAMPLEOFCRYSTALLINESILICONPVTECHNOLOGY)44FIGURE4.2:SHAREOFPVPOLYSILICONPRODUCTIONIN202144FIGURE4.3:SHAREOFPVWAFERPRODUCTIONIN202146FIGURE4.4:SHAREOFPVCELLPRODUCTIONIN202147FIGURE4.5:SHAREOFPVMODULEPRODUCTIONIN202148FIGURE4.6:PVMODULEPRODUCTIONPERTECHNOLOGYINIEAPVPSCOUNTRIESIN202149FIGURE4.7:YEARLYPVINSTALLATION,PVPRODUCTIONANDPRODUCTIONCAPACITY2011-2021(GWp)50FIGURE4.8:OVERVIEWOFDOWNSTREAMSECTOR(UTILITYPVAPPLICATION)53FIGURE5.1:CO2EMISSIONSAVOIDEDBYPV[MTCO2,EQ]57FIGURE5.2A:AVOIDEDCO2EMISSIONSASPERCENTAGEOFELECTRICITYSECTORTOTALEMISSIONS58FIGURE5.2B:AVOIDEDCO2EMISSIONSASPERCENTAGEOFENERGYSECTORTOTALEMISSIONS58FIGURE5.3:BUSINESSVALUEOFTHEPVMARKETIN202159FIGURE5.4:CONTRIBUTIONTOGLOBALGDPOFPVBUSINESSVALUEANDENERGYSECTORINVESTMENTS60FIGURE5.5A:ABSOLUTEPVINDUSTRIALBUSINESSVALUEIN202160FIGURE5.5B:PVINDUSTRIALBUSINESSVALUEALONGTHEVALUECHAININ202161FIGURE5.5C:PVINDUSTRIALBUSINESSVALUEASSHAREOFGDPIN202161FIGURE5.6:GLOBALEMPLOYMENTINPVPERCOUNTRY62FIGURE6.1:PVMDOULESSPOTPRICESLEARNINGCURVE(1992-2021)66FIGURE6.2:EVOLUTIONOFPVMODULESPRICESRANGEINUSD/W66FIGURE6.3:INDICATIVEMODULEPRICESINREPORTINGCOUNTRIES67FIGURE6.4:2021PVMARKETCOSTSRANGES68FIGURE6.5:EVOLUTIONOFRESIDENTIALANDGROUND-MOUNTEDSYSTEMSPRICERANGE2012-2021(USD/W)69FIGURE6.6:INDICATIVEINSTALLEDSYSTEMPRICESINSELECTEDIEAPVPSREPORTINGCOUNTRIESIN202169FIGURE6.7:LCOEOFPVELECTRICITYASAFUNCTIONOFSOLARIRRADIANCE&RETAILPRICESINKEYMARKETS71FIGURE6.8.A:NORMALISEDLCOEFORSOLARPVBASEDONLOWESTPPAPRICES2016-Q4202173FIGURE6.8.B:NORMALISEDLCOEFORSOLARPVBASEDONRECENTPPAPRICES202173FIGURE7.1:PVCONTRIBUTIONTOELECTRICITYDEMAND202178FIGURE7.2:SHAREOFRENEWABLEINTHEGLOBALELECTRICITYPRODUCTIONIN202178FIGURE7.3:NEWRENEWABLEINSTALLEDCAPACITYIN20217885IEAPVPSTRENDSINPHOTOVOLTAICAPPLICATIONS2022LISTOFTABLESTABLE2.1:EVOLUTIONOFTOP10MARKETS13TABLE2.2:TOP10COUNTRIESFORCENTRALIZEDPVINSTALLEDIN202116TABLE2.3:TOP10COUNTRIESFORCUMULATIVECENTRALIZEDPVINSTALLEDCAPACITYIN202116TABLE2.4:TOP10COUNTRIESFORDISTRIBUTEDPVINSTALLEDIN202118TABLE2.5:TOP10COUNTRIESFORCUMULATIVEDISTRIBUTEDPVINSTALLEDCAPACITYIN202118TABLE2.6:2021PVMARKETSTATISTICSINDETAIL30TABLE4.1:GLOBALTOPFIVEMANUFACTURERSINTERMSOFPVCELL/MODULEPRODUCTIONANDSHIPMENTVOLUME(2021)47TABLE4.2:EVOLUTIONOFACTUALMODULEPRODUCTIONANDPRODUCTIONCAPACITIES(MWp)51TABLE5.1:TOP10RANKINGOFPVBUSINESSVALUES60TABLE6.1:TOP10LOWESTWINNINGBIDSINPVTENDERSFORUTILTYSCALEPVSYSTEM74TABLE6.2:LOWESTWINNINGBIDSINPVTENDERSFORUTILTYSCALEPVSYSTEMPERREGION74TABLE7.1:2021PVELECTRICITYSTATISTICSINIEAPVPSCOUNTRIES77ANNEX1:AVERAGE2021EXCHANGERATES81ANNEX2:CUMULATIVEINSTALLEDPVCAPACITY(MW)FROM1992TO202182ANNEX3:ANNUALINSTALLEDPVCAPACITY(MW)FROM1992TO202183IEAPVPSTRENDSINPHOTOVOLTAICAPPLICATIONS202286

1、当您付费下载文档后,您只拥有了使用权限,并不意味着购买了版权,文档只能用于自身使用,不得用于其他商业用途(如 [转卖]进行直接盈利或[编辑后售卖]进行间接盈利)。
2、本站所有内容均由合作方或网友上传,本站不对文档的完整性、权威性及其观点立场正确性做任何保证或承诺!文档内容仅供研究参考,付费前请自行鉴别。
3、如文档内容存在违规,或者侵犯商业秘密、侵犯著作权等,请点击“违规举报”。

碎片内容

碳中和
已认证
内容提供者

碳中和

确认删除?
回到顶部
微信客服
  • 管理员微信
QQ客服
  • QQ客服点击这里给我发消息
客服邮箱