全球太阳能光伏市场回顾2022(英)-IEAVIP专享VIP免费

fc
Snapshot of
Global PV Markets
2022
Report IEA-PVPS T1-42: 2022
Task 1 Strategic PV Analysis and Outreach
PVPS
Task 1 Strategic PV Analysis and Outreach 2020 Snapshot of Global PV Markets
What is IEA PVPS TCP?
The International Energy Agency (IEA), founded in 1974, is an autonomous body within the framework of the Organization
for Economic Cooperation and Development (OECD). The Technology Collaboration Programme (TCP) was created with
a belief that the future of energy security and sustainability starts with global collaboration. The programme is made up of
6000 experts across government, academia, and industry dedicated to advancing common research and the application
of specific energy technologies.
The IEA Photovoltaic Power Systems Programme (IEA PVPS) is one of the TCPs within the IEA and was established in
1993. The mission of the programme is to “enhance the international collaborative efforts which facilitate the role of
photovoltaic solar energy as a cornerstone in the transition to sustainable energy systems.” In order to achieve this, the
Programme’s participants have undertaken a variety of joint research projects in PV power systems applications. The
overall programme is headed by an Executive Committee, comprised of one delegate from each country or organisation
member, which designates distinct ‘Tasks,’ that may be research projects or activity areas.
The IEA PVPS participating countries are Australia, Austria, Belgium, Canada, Chile, China, Denmark, Finland, France,
Germany, Israel, Italy, Japan, Korea, Malaysia, Mexico, Morocco, the Netherlands, Norway, Portugal, South Africa, Spain,
Sweden, Switzerland, Thailand, Turkey, and the United States of America. The European Commission, Solar Power
Europe, the Smart Electric Power Alliance (SEPA), the Solar Energy Industries Association and the Copper Alliance are
sponsor members.
Visit us at: www.iea-pvps.org
What is IEA PVPS Task 1?
The objective of Task 1 of the IEA Photovoltaic Power Systems Programme is promoting and facilitating the exchange
and dissemination of information on the technical, economic, environmental and social aspects of PV power systems.
Task 1 activities support the broader PVPS objectives: to contribute to cost reduction of PV power applications, to increase
awareness of the potential and value of PV power systems, to foster the removal of both technical and non-technical
barriers and to enhance technology co-operation.
Authors
DISCLAIMER
The IEA PVPS TCP is organised under the auspices of the International Energy Agency (IEA) but is functionally and legally autonomous.
Views, findings and publications of the IEA PVPS TCP do not necessarily represent the views or policies of the IEA Secretariat or its
individual member countries Data for non-IEA PVPS countries are provided by official contacts or experts in the relevant countries. Data
are valid at the date of publication and should be considered as estimates in several countries due to the publication date.
COVER PICTURE
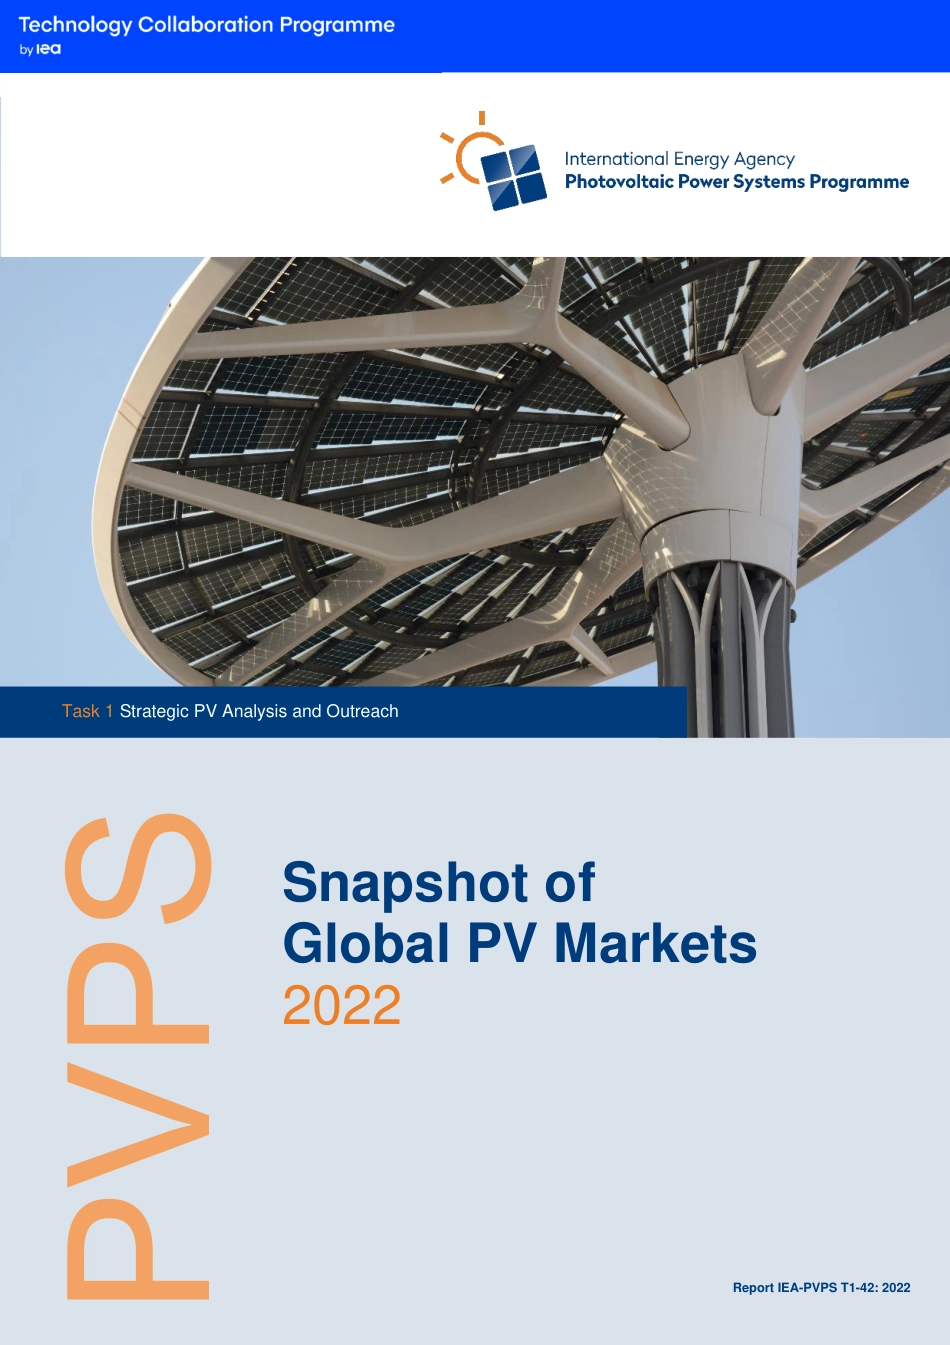
Expo 2020 Dubai, Solar Flowers.
ISBN 978-3-907281-31-4: 2022 Snapshot of Global PV Markets
INTERNATIONAL ENERGY AGENCY
PHOTOVOLTAIC POWER SYSTEMS PROGRAMME
IEA PVPS
Task 1
Strategic PV Analysis and Outreach
Report IEA-PVPS T1-42:2022
April 2022
ISBN 978-3-907281-31-4
fcSnapshotofGlobalPVMarkets2022ReportIEA-PVPST1-42:2022Task1StrategicPVAnalysisandOutreachPVPSTask1StrategicPVAnalysisandOutreach–2020SnapshotofGlobalPVMarketsWhatisIEAPVPSTCP?TheInternationalEnergyAgency(IEA),foundedin1974,isanautonomousbodywithintheframeworkoftheOrganizationforEconomicCooperationandDevelopment(OECD).TheTechnologyCollaborationProgramme(TCP)wascreatedwithabeliefthatthefutureofenergysecurityandsustainabilitystartswithglobalcollaboration.Theprogrammeismadeupof6000expertsacrossgovernment,academia,andindustrydedicatedtoadvancingcommonresearchandtheapplicationofspecificenergytechnologies.TheIEAPhotovoltaicPowerSystemsProgramme(IEAPVPS)isoneoftheTCPswithintheIEAandwasestablishedin1993.Themissionoftheprogrammeisto“enhancetheinternationalcollaborativeeffortswhichfacilitatetheroleofphotovoltaicsolarenergyasacornerstoneinthetransitiontosustainableenergysystems.”Inordertoachievethis,theProgramme’sparticipantshaveundertakenavarietyofjointresearchprojectsinPVpowersystemsapplications.TheoverallprogrammeisheadedbyanExecutiveCommittee,comprisedofonedelegatefromeachcountryororganisationmember,whichdesignatesdistinct‘Tasks,’thatmayberesearchprojectsoractivityareas.TheIEAPVPSparticipatingcountriesareAustralia,Austria,Belgium,Canada,Chile,China,Denmark,Finland,France,Germany,Israel,Italy,Japan,Korea,Malaysia,Mexico,Morocco,theNetherlands,Norway,Portugal,SouthAfrica,Spain,Sweden,Switzerland,Thailand,Turkey,andtheUnitedStatesofAmerica.TheEuropeanCommission,SolarPowerEurope,theSmartElectricPowerAlliance(SEPA),theSolarEnergyIndustriesAssociationandtheCopperAlliancearesponsormembers.Visitusat:www.iea-pvps.orgWhatisIEAPVPSTask1?TheobjectiveofTask1oftheIEAPhotovoltaicPowerSystemsProgrammeispromotingandfacilitatingtheexchangeanddisseminationofinformationonthetechnical,economic,environmentalandsocialaspectsofPVpowersystems.Task1activitiessupportthebroaderPVPSobjectives:tocontributetocostreductionofPVpowerapplications,toincreaseawarenessofthepotentialandvalueofPVpowersystems,tofostertheremovalofbothtechnicalandnon-technicalbarriersandtoenhancetechnologyco-operation.Authors➢Data:IEAPVPSReportingCountries,BecquerelInstitute(BE).Forthenon-IEAPVPScountries:IzumiKaizuka(RTSCorporation),ArnulfJäger-Waldau(EU-JRC),JoseDonoso(UNEF).➢Analysis:GaëtanMasson,ElinaBosch(BecquerelInstitute).➢Editor:GaëtanMasson,IEAPVPSTask1OperatingAgent.➢Design:IEAPVPSDISCLAIMERTheIEAPVPSTCPisorganisedundertheauspicesoftheInternationalEnergyAgency(IEA)butisfunctionallyandlegallyautonomous.Views,findingsandpublicationsoftheIEAPVPSTCPdonotnecessarilyrepresenttheviewsorpoliciesoftheIEASecretariatoritsindividualmembercountriesDatafornon-IEAPVPScountriesareprovidedbyofficialcontactsorexpertsintherelevantcountries.Dataarevalidatthedateofpublicationandshouldbeconsideredasestimatesinseveralcountriesduetothepublicationdate.COVERPICTUREExpo2020Dubai,SolarFlowers.ISBN978-3-907281-31-4:2022SnapshotofGlobalPVMarketsINTERNATIONALENERGYAGENCYPHOTOVOLTAICPOWERSYSTEMSPROGRAMMEIEAPVPSTask1StrategicPVAnalysisandOutreachReportIEA-PVPST1-42:2022April2022ISBN978-3-907281-31-4Task1StrategicPVAnalysisandOutreach–2021SnapshotofGlobalPVMarkets5TABLEOFCONTENTSTableofContents..............................................................................................................5Executivesummary...........................................................................................................61SnapshotoftheGlobalPVMarketin2021............................................................92TheTop10Marketsin2021..................................................................................113ACorDCNumbers................................................................................................134marketSegmentation.............................................................................................145CumulativeInstalledCapacityintheWorld............................................................156ElectricityProductionfromPV...............................................................................187Policy&MarketsTrends........................................................................................197.1CompetitiveTenders&MerchantPV.........................................................197.2ProsumersPolicies.....................................................................................197.3Localmanufacturingpolicies......................................................................208PVintheBroaderEnergyTransition......................................................................218.1PVandOtherRenewableEnergyEvolutions.............................................218.2ImpactofPVDevelopmentonCO2Emissions...........................................228.3PVFosteringDevelopmentofaCleanerEnergySystem............................22Task1StrategicPVAnalysisandOutreach–2021SnapshotofGlobalPVMarkets6EXECUTIVESUMMARYDespiteasecondyearofCOVID-19pandemic,preliminaryreportedmarketdatashowsthattheglobalPVmarketagaingrewsignificantlyin2021.Atleast175GWofPVsystemshavebeeninstalledandcommissionedintheworldlastyearwhichmeansthatthetotalcumulativeinstalledcapacityforPVattheendof2021reachedatleast942GW.Whilethesedatawillhavetobeconfirmedinthecomingmonths,someimportanttrendscanalreadybeextracted:•TheChinesePVmarketgrewagainin2021,despiteshortagesobservedinthevaluechainduringtheyearandwasthelargestmarketintermsofannualinstalledcapacity.In2021,54,9GWofPVwereinstalled,comparedto48,2GWin2020and30,1GWin2019.Chinaremainstheleaderintermsofcumulativecapacitywith308,5GWinstalled,almostonethirdoftheglobalPVinstalledcapacity.•InadditiontoChina,therestoftheglobalPVmarketgrewsignificantlyfrom97GWin2020,toatleast120GWin2021,a24%increaseyearonyear.oTheUSmarketsawitsmarketincreasingto26,9GWwhichallowedittoovertaketheEuropeanUnionthatwasrankedsecondlastyear.Utility-scaleinstallationsaccountedforabout75%ofthenewadditions.oTheEuropeanUnionlostitspositionasthesecondglobalPVmarketandrankedthirdin2021byinstallingcloseto26,8GW.OutsideoftheEU,therestofEuropeaddedaround3GW.ThelargestEuropeanmarketin2021wasagainGermany(5,3GW),followedbySpain(4,9GW),France(3,4GW)theNetherlands(3,3GW),Poland(3,3GW),Greece(1,2GW),Italy(944MW)andBelgium(850MW).oIndiaandJapanrankthirdandfourthwithrespectivelyanestimated13GWand6,5GWannualinstalledcapacity.oSomegrowingkeymarketscontributedsignificantlytonewadditionsin2021,Brazil(5,5GW,fifth),Australia(4,6GW,eighth),Korea(4,2GW,ninth),Mexico(1,8GW).PreliminarynumbersshowthatTaiwan,Pakistaneachhaveinstalledcloseto2GW.oAmongthetop10countries,therearenowfiveAsia-Pacificcountries(Australia,China,India,Japan,Korea),threeEuropeancountries(Germany,SpainandFrance)andtwocountriesintheAmericas(BrazilandtheUSA).•Theleveltoenterthetop10globalmarketsin2021wasaround3,0GW;astablelevelcomparedto2020andtwicethelevelneededin2019.•Thetop10countriesrepresentedaround74%oftheglobalannualPVmarket,aslightdecreasecomparedto2020.Task1StrategicPVAnalysisandOutreach–2021SnapshotofGlobalPVMarkets7•Australia,Spain,Greece,Honduras,theNetherlands,ChileandGermanynowhaveenoughPVcapacitytotheoretically1producemorethan10%oftheirannualelectricitydemandwithPV.PVcoversaround5%oftheglobalelectricitydemand.ThecontributionofPVtodecarbonizingtheenergymixisprogressing,withPVsavingasmuchas1100milliontonsofCO2eq.However,muchremainstobedonetofullydecarbonizeandPVdeploymentshouldincreasebyatleastoneorderofmagnitudetocopewiththetargetsdefinedduringtheCOP21inParis,France.1Basedonend-ofyearPVinstalledcapacity’stheoreticalproductionTask1StrategicPVAnalysisandOutreach–2021SnapshotofGlobalPVMarkets8Task1StrategicPVAnalysisandOutreach–2021SnapshotofGlobalPVMarkets91SNAPSHOTOFTHEGLOBALPVMARKETIN2021IEAPVPShasdistinguisheditselfthroughouttheyearsbyproducingunbiasedreportsonthedevelopmentofPVallovertheworld,basedoninformationfromofficialgovernmentbodiesandreliableindustrysources.This10theditionofthe“SnapshotofGlobalPVMarkets”aimsatprovidingpreliminaryinformationonhowthePVmarketdevelopedin2021.The27theditionofthePVPScomplete“TrendsinPhotovoltaicApplications”reportwillbepublishedinQ42022.Atleast175GWdcofPVsystemshavebeencommissionedintheworldlastyearofwhichtheIEAPVPScountriesrepresented132GWdc.TheIEAPVPScountriesrepresented767GWofcumulativePVattheendof2021,whichisatleast81%oftheglobalPVcapacity.NexttothemembersoftheIEAPVPSprogramme,theothermajormarketsintheworldrepresentatleast175GWcumulativeinstalledcapacityattheendof2021.Atpresent,itappearsthataround922GWrepresentstheminimuminstalledbytheendof2021,withafirmlevelofcertaintyintheIEAPVPScountriesandtheothermajormarkets.Remainingmarketsaccountforanestimatedadditional20GWthatcouldbringthetotalcumulativeinstalledcapacitytoaround942GWdc.Theinstallationsinthirdcountrieswithoutarobustreportingsystemaregrowingsignificantly,leadingtoincreaseduncertaintiesonthetotalinstalledcapacity.In2021,atleast20countriesinstalledmorethan1GW.Fifteencountriesnowhavemorethan10GWoftotalcumulativecapacity,fivehavemorethan40GW.Chinaalonerepresented308,5GWfollowedbytheEuropeanUnion(asEU27),whichusedtoleadtherankingsforyears,butrankssecondsince2015(178,7GW),theUSAranksthird(123GW)andJapanfourth(78,2GW).IEA-PVPSnumberscomprisetheentireEU,notonlythePVPS-memberstateswhicharepartoftheprogrammedirectly.Source:IEAPVPS0000111268173130384050771031041111451750204060801001201401601802002000200120022003200420052006200720082009201020112012201320142015201620172018201920202021GWpFIGURE1:EVOLUTIONOFANNUALPVINSTALLATIONSNonIEAPVPSCountriesIEAPVPSCountriesJapanUSAEuropeanUnionChinaTask1StrategicPVAnalysisandOutreach–2021SnapshotofGlobalPVMarkets10EvolutionofregionalPVmarketsThemajorityofthegrowthofthePVmarketin2021camefromChina,theUS,Europe,Indiaandemergingcountries.Othermarketssawsomeadditions,too.Figure2belowillustratesthechangingdynamicsoftheglobalPVmarket,andthehugeinfluenceoftheChinesePVmarket.However,thepositivedynamicsoftheothercountriesshowaconstantprogressinthelastyears,despitesomelocalizednegativeeffects,whichhavebeenlimitedin2021comparedto2020.Source:IEAPVPSImpactofinternationaltradedisruptionsIdentifyingtheimpactofthepandemiconthePVmarketin2021isadifficultexercise.Whilethemarketcontinueditsdevelopment,onemightconsiderthatitcouldhavegrownevenmorewithouttheimpactoninternationaltradeandinsomecasesonlocalPVmanufacturing.However,theimpactsseeninChinain2021werenotdirectlycorrelatedtothepandemicitselfandreflectmorethegrowingpartofPVintheeconomy,especiallyregardingrawmaterialconsumption.In2021,polysiliconandglass,butalsoaluminium,sawpricessurges,whichimpactedtheend-userpriceofPVmodules.Thisledtocontractcancellationsandpriceincreasesfordevelopers,andwithapossiblesloweddownmarketdevelopmentinmanylocationsasaresult.Theadditionalshippingcostsincurredin2021duetothepandemicalsocontributedtoPVcomponentspriceincreasesandpossiblyterminatesomeverycompetitivebusinessmodels.Atthesametime,theincreasesincostsofenergy,andspecificallyelectricityprices,haveenhancedthePVcompetitivenessinnumerouscountries.ItisdifficulttodistinguishifthisaccelerationeffectisstrongerorweakerthanthebrakingeffectofhigherPVhardwareprices.Overall,wecanconsiderthattheCOVID-19pandemicdidnotsignificantlyimpactmarketdevelopmentin2021.Thenationalmarketregressionsorstagnationsdiscussedabovecanbelinkedtoregulatoryburdens.Butinanutshell,mostkeymarketsprogressed.TheresiliencyofthePVmarketdespitethemajoreconomicandlogisticdisruptionsisremarkableandshowsthepotentialofthetechnologytolimittheeconomicdownturnandsocialdamagebroughtbytheCOVID-19pandemic.ThisshowsthatnationalgreenrecoveryplansandbetterregulationscouldpropelthePVindustryfarbeyondthecurrentinstallationtrends(whichisneededtoachievetheParisClimateAgreement).Task1StrategicPVAnalysisandOutreach–2021SnapshotofGlobalPVMarkets112THETOP10MARKETSIN2021TheChinesemarketgrewagainwith54,9GWinstalledin2021.Thisrepresented31%oftheglobalmarket.BehindChina,theUSArankedsecondwitharound26,9GWofannualinstallationsin2021.TheEuropeanUnionfollowedwithanincreasedmarketof26,8GW,followedbyIndiawhereanestimated13GWwereinstalled.Japanclosesthetopfivewithanestimated6,5GW.Behindthesecountries,somechangeswerequitevisible:Brazilinstalled5,5GW,sementingitstitleasthemostdynamicmarketinLatinAmerica.Korea(stable)andAustralia(growing)respectivelyinstalled4,2GWand4,6GW.LookingabitmoreindepthatEuropeanUnioncountries,Germanyexperiencedanothergrowthyear,withabout5,3GWofadditionalcapacitiesinstalled,Spaininstalled4,9GW,settinganewannualsolarPVinstalledcapacityrecordwhileFrancesawitsmarketmorethantriplewith3,4GWinstalled.NotablegrowthwasalsoobservedinPortugal(572MWcomparedto151MWin2020),inAustria(720MWcomparedto340MWin2020)andtoalesserextentinItaly(944MWcomparedto785MW2020).TheNetherlandscontinuedtomassivelyinstallPV,with3,3GWafter3GWinthepreviousyearandPolandcontinuesitsGW-scaleexpansion.GreecerestartedPVinstallationsafteryearsofpauseandingeneral,theEuropeanmarketbenefitedfroma,overallgrowth.Asin2020,top10marketsforPVin2021haveinstalledatleast3GWofPVsystems,comparedto1,5GWin2018.Severalcountrieswhichinpreviousyearsinstalledsignificantcapacitieshaveleftthetop10forannualinstalledcapacities,suchasVietnam.Thesecountriesstillexperiencedsignificantmarketdevelopments,however,notenoughtostayinthetop10.Thetop10oftotalcumulativeinstalledcapacitiesshowsmoreinertiaduetopastlevelsofinstallations:ItalyandtheUKhaveleftthetopcountriesintermsofannualinstallationsseveralyearsback.IfItaly’spastdevelopmentsstillallowittostayinthetop10forcumulativeinstalledcapacity,theUKexitedthetop10forcumulativeinstalledcapacitythisyearandwasreplacedbySpain.Asmentionedinthenextsection,capacitiesforafewcountriesthatreportPVinstallationsinACpower,havebeenconvertedintoDCpowertoeasecomparison.ThiscanleadtodiscrepancieswithofficialPVdatainseveralcountriessuchasJapanorIndia.Source:IEAPVPSTheEuropeanUniongrouped27Europeancountriesin2021,outofwhichGermany,Spain,France,theNetherlandsandItalyalsoappearintheTop10,eitherfortheinstalledcapacityTask1StrategicPVAnalysisandOutreach–2021SnapshotofGlobalPVMarkets12ortheannualinstallations.TheEUisamemberofIEA-PVPSthroughitsJointResearchCentre(EU-JRC).Task1StrategicPVAnalysisandOutreach–2021SnapshotofGlobalPVMarkets133ACORDCNUMBERSIEAPVPScountsallPVinstallations,bothgrid-connectedandoff-grid,whennumbersarereported.Byconvention,thenumbersreportedrefertothenominalpowerofPVsystemsinstalled.TheseareexpressedinW(orWp).SomecountriesarereportingthepoweroutputofthePVinverter(thedeviceconvertingDCpowerfromthePVsystemintoACelectricitycompatiblewithstandardelectricitynetworks)orthegridconnectionpowerlevel.ThedifferencebetweenthestandardDCpower(inWp)andtheACpowercanrangefromaslittleas5%(conversionlosses,invertersetattheDClevel)toasmuchas60%.Forinstance,somegridregulationslimitoutputtoaslowas70%ofthepeakpowerfromtheresidentialPVsystemsinstalledinthelastyears.Mostutility-scaleplantsbuiltin2021haveanAC-DCratiobetween1,1and1,6.Forsomecountries,numbersindicatedinthisreporthavebeentransformedtoDCnumberstomaintainthecoherencyoftheoverallreport.Ingeneral,IEAPVPSrecommendsregisteringPVsystemswithboththeDCpowerandtheACvalue.DCpowergivesapreciseideaoftheinstalledcapacity,regardlessofthegridconnection(ifany)andallowsareliablecalculationoftheenergyproduction.Ontheotherhand,ACpowerallowsgridoperatorstobetterunderstandthemaximumpoweroutputofthePVfleet.However,theACvaluemustbedefinedpreciselysincetheACoutputofmanyinverterscanexceedthenominalvalueduringsmallperiodsoftime.Ontheotherside,AClimitsonthegridconnectionsidedonotalwaysreflectthenominalcapacityofPVplants.MoreinformationaboutrecommendationstoproperlyregisterPVplantscanbefoundinthefollowingreport:IEAPVPSReport:DataModelandDataAcquisitionforPVRegistrationSchemesandGridConnection–BestPracticeandRecommendationsDownloadthereport:https://iea-pvps.org/orscantheQRcodeTask1StrategicPVAnalysisandOutreach–2021SnapshotofGlobalPVMarkets144MARKETSEGMENTATIONPreliminarydatashowthattheutility-scalePVmarketincreasedinabsolutenumberscomparedto2020.Thistrendwasobservedinmanycountries,duetotheeasinesstodeveloputility-scalePVcomparedtothedifficultiesorsetting-upsoundregulationsfordistributedPVunderself-consumptionandevenmoreinenergycommunities.Therooftopmarketgrewin2021inabsoluteterms,duegrowthinChina,Australia,Germany,andtheUnitedStates.ImportantgrowthofthedistributedmarketwasalsoobservedinSpain(+100%comparedto2020).However,therelativesharesofrooftopPVandutility-scalePVremainedsimilarin2021comparedtopreviousyear.Source:IEAPVPS,BecquerelInstituteThemarkethasalsostartedtodiversifyintermsoftypeofapplications,withfloatingPVaddingtoutility-scaleandBIPVstartingtocomplementBAPVinthebuiltenvironment.OtheremergingsegmentssuchasagriculturalPVarehardlyvisibleyetbutareattractingagrowinginterestandprogressingfast.Fromatechnologypointofview,someevolutionshavebeennotable,suchasthestartofbifacialPVdevelopment.PVintegratedinvehicles,orVIPV/VAPV,isshowingthepotentialforfurtherdiversificationofPVcomponents,butitscurrentmarketlevelremainstoolowtobeconsideredinthispublication.02040608010012014016018020020112012201320142015201620172018201920202021GWpFIGURE3:SEGMENTATIONOFPVINSTALLATION2011-2021ROOFTOPUTILITYSCALETask1StrategicPVAnalysisandOutreach–2021SnapshotofGlobalPVMarkets155CUMULATIVEINSTALLEDCAPACITYINTHEWORLDAsillustratedinFigure4,thetotalcumulativeinstalledcapacityattheendof2021globallyamountedtoatleast942GW.Chinacontinuestoleadwithacumulativecapacityof308,5GW,followedbytheEuropeanUnion(178,7GW),theUSA(122,9GW),Japan(78,2GW)andIndia(60,4GW).In2021,Australiareached25,4GWcumulativeinstallationsandKorea21,5GW.IntheEuropeanUnion,Germanyleadswith59,2GW,followedbyItaly(22,6GW),Spain(18,5GW),France(14,3GW)andtheNetherlands(13,2GW).Source:IEAPVPSDecommissioning,RepoweringandRecyclingSofar,numberspublishedbyIEAPVPSconsidertheannualinstallationsandtotalinstalledcapacitiesbasedonofficialdatainreportingcountries.SeveralcountriesalreadyincorporatedecommissioningofPVplantsintheirtotalcapacitynumbersbyreducingthetotalcumulativenumber.However,itisbelievedthatmanycountriesdonottrackdecommissioningproperly,andevenmoreproblematic,repowering.Itisassumedthatrealdecommissioningisrelativelyunusualgiventheageoftheoldestinstallations,sincetherealmarketstartedaround2005.Replacementofcomponents,andinparticular,PVmodulesandinvertersarepartoftheusualmaintenanceandoperationbusiness,butingeneralitdoesnotimpactthetotalcapacity.Recyclingnumberscanprovideaglimpseofwhatishappeninginthisfield.However,recyclingschemesarenotyetcommon,andtheavailabilityofdatamustbeimproved.Inthecomingyears,IEAPVPSwillfollowthedynamicevolutionofdecommissioning,repoweringandrecyclingclosely,withtheexpectedimpactontheinstalledcapacity,marketprojectionsforrepoweringandthedeclineinPVperformancesduetoageingPVsystems.4681422397010013717722830440751162276794201002003004005006007008009001.00020052006200720082009201020112012201320142015201620172018201920202021GWpFIGURE4:GLOBALEVOLUTIONOFCUMULATIVEPVINSTALLATIONSNonIEAPVPSCountriesIEAPVPSCountriesTask1StrategicPVAnalysisandOutreach–2021SnapshotofGlobalPVMarkets16EvolutionofRegionalPVInstallationsWhileEuropeplayedakeypioneeringroleintheearlydevelopmentsofPV,Asia’ssharestartedtogrowrapidlyin2012andithasnotstoppedsincethen(seeFigure5).DrivenbyChina,India,Japan,KoreaandmorerecentlyVietnam,Asiarepresentedaround57%ofthetotalcumulativeinstalledcapacityin2021-asimilarsharecomparedtopreviousyear.Intheothercontinentsandregions,PVinstallationsweredistributedsimilarlytopreviousyear.Europerepresented21%oftheglobalcumulativePVmarket(outofwhichtheEuropeanUnionaccountedfor92%)despitetherenewedandsignificantgrowthforthefourthyearinarow.TheAmericasrepresented16%,thankstotheUSAandsomeLatinAmericancountriessuchasBrazil,whiletheremaining6%camefromtheMEAregionandtherestoftheworld(unidentifiedinstallations).Source:IEAPVPSAsiacontinuestodominatetheglobalPVmarket,withChinaasagloballeader.SomealreadyestablishedmajorAsianmarkets,suchasChina,IndiaJapan,Korea,TaiwanorMalaysia,experiencedagrowthin2021.Thedevelopmentinothermarkets,suchasThailand,Singapore,IndonesiaandthePhilippineshasbeensloworintermittentovertheyears.Vietnamnowranksamongstthetopmarketsforthethirdyearinarow,butitisunsurewhethersuchaninstallationlevelwillbesustained,asthesignificantdeclinein2021illustrates.Asianmarketsrepresentedaround52%oftheannualglobalPVmarketin2021,aslightdecreasecomparedtothelevelin2020,butinlinewithpreviousyears.IntheAmericas,themarketincreased,mainlythroughtheUSmarketwhichexperiencedacceleratedgrowth(26,9GW)in2021.Brazilisthesecondmarketwitharound5,5GWinstalledin2021,followedbyMexicowhichinstalledaround1,8GW,Chilewith1,3GWandArgentinainstalledaround200MW,alevelcomparableto2020.ThemarketinCanadagrew01002003004005006007008009001.000200120022003200420052006200720082009201020112012201320142015201620172018201920202021GWpFIGURE5:EVOLUTIONOFREGIONALPVINSTALLATIONSEuropeAsiaPacificAfrica&MiddleEastRoWTheAmericasTask1StrategicPVAnalysisandOutreach–2021SnapshotofGlobalPVMarkets17ataround400MWinstalledcapacityin2021.TheAmericasrepresentedaround21%oftheannualglobalPVmarketin2021.IntheEuropeanUnion,Germanytooktheleadwith5,3GW,asignificantincreaseforthefourthyearinarow.Spaintookthesecondplacewith4,9GW,animportantgrowthcomparedto2020.Francetookthethirdplacethanksto3,4GWinstalledwhichrepresentedaroundathreefoldincreasecomparedtopreviousyear.TheNetherlandsrankedfourthwith3,3GWinstalled,acomparablelevelto2020.TheyarefollowedPolandwith3,3GWandGreece(1200MW).AfewcountrieswerejustbelowtheGWmarksuchasItaly(944MW),Belgium(850MW)andHungary(800MW).TherankingcontinuedwithAustria(720MW),Portugal(572MW),Sweden(500MW),Denmark(312MW)andCzechRepublic(68MW).OutsideoftheEU,Norwayinstalled45MWin2021.OthercountriesinEurope,experiencedinterestingdevelopmentsin2021:onecanciteSwitzerland(616MW).ItisalsoworthmentioningUkrainewhichsawsignificantamountsofPVinstalledinthelastyears.Europerepresentedslightlymorethan17%oftheannualglobalPVmarketin2021.IntheMiddleEastandAfrica,Israelinstalledanadditional935MW,asignificantincreasecomparedtothepreviousyear.IntheUnitedArabEmirates,veryfewprojectscameonlinedespitethetendersinthepreviousyearsbutprospectsforgrowtharepositive.Turkeyinstalledagainaround1GW-astablemarketlevelcomparedto2020.AfricaandtheMiddleEastrepresentedaround3%ofglobalPVinstallationsin2021withoff-gridinstallationsgrowingrapidlyandrooftopPVoutsideofanyregulatoryschemeareprogressinginmanycountriesrapidly.Task1StrategicPVAnalysisandOutreach–2021SnapshotofGlobalPVMarkets186ELECTRICITYPRODUCTIONFROMPVPVelectricityproductioniseasytomeasureforanindividualpowerplantbutmuchmorecomplicatedtocompileforanentirecountry.First,solarirradiationcanvarydependingonthelocalclimateandtheweathercanshowsomesignificantdifferencesfromoneyeartoanother.Furthermore,asysteminstalledinDecember,willhaveproducedonlyasmallfractionofitsregularannualelectricityoutput;systemsinstalledonbuildingsmaynotbeatoptimumorientationormayhavepartialshadingduringtheday.Forthesereasons,theelectricityproductionfromPVpercountry,asshowninFigure6,estimateswhatthePVproductioncouldbebasedonthecumulativePVcapacityattheendof2021,closetooptimumsiting,orientationandlong-termaverageweatherconditions.Figure6showshowPVtheoreticallycontributestomeettheelectricitydemandinkeycountries(IEAPVPSandothers),basedonthePVcapacityinstalledbytheendof2021.Sincethesenumbersareestimatesbasedonthetotalcumulativecapacityattheendoftheyear,theycanslightlydifferfromofficialPVproductionnumbersinsomecountries.Thesenumbersshouldbeconsideredasindicative,theyprovideareliableestimationoftheproductionindifferentcountriesandallowcomparisonbetweencountriesbutdonotreplaceofficialdata.Inseveralcountries,thePVcontributiontotheelectricitydemandhaspassedthe10%markwithAustraliainfirstplacewith15,5%.Spainissecondwithanestimated14,2%andGreecethirdwithatheoreticalpenetrationlevelof13,6%.Intotal,PVcontributionamountstocloseto5%oftheelectricitydemandintheworld.0,0%0,1%0,3%0,8%1,0%2,4%2,8%3,6%3,7%3,8%4,0%4,0%4,0%4,4%4,5%4,6%4,8%5,0%5,0%5,2%5,2%5,6%5,7%6,2%7,2%7,7%8,2%8,9%9,3%9,4%10,9%10,9%11,8%12,9%13,6%14,2%15,5%0%5%10%15%20%SlovakiaNorwayFinlandCanadaSwedenMalaysiaThailandFranceCzechRepublicRomaniaUSAMoroccoSouthAfricaAustriaUKKoreaChinaWorldDenmarkMexicoBulgariaSwitzerlandPortugalTurkeyEUBelgiumIndiaIsraelItalyJapanGermanyChileNetherlandsHondurasGreeceSpainAustraliaFIGURE6:THEORETICALPVPENETRATION2021Task1StrategicPVAnalysisandOutreach–2021SnapshotofGlobalPVMarkets197POLICY&MARKETSTRENDS7.1CompetitiveTenders&MerchantPVTendershavedrivenPVdevelopmentinthelastyearsandcontinuedtobegrantedinseveralplacesintheworldwithextremelycompetitiveprices,wellbelow20USD/MWhinthesunniestplaces.Winningbidsdowntoalmost10USD/MWhhavebeenreportedintheMiddleEast,whilesometenderswithpricesbelow14USD/MWhhavebeenrecordedinEurope(butthesecanbequestioned).Thedecreasingpricetrendhaltedin2021duetomodulepriceshikes,andmostbelievethatpriceswillhardlycontinuetogodowninthecomingyears,atleastuntiltherawmaterialcrisiscanbesolved.Insomecountries,cost-basedtendersevolvetowardsmultiple-factorstenders.Environmentalorindustrialconstraintsareintroducedtogiveanadvantagetolocalcompaniesortofavourabetterenvironmentalfootprintoftheproducts.MerchantPV,withPVelectricitysoldonelectricitymarketsorthroughPPAshasbeenseeninanincreasingnumberofcountriesin2021(e.g.100%oftheground-mountedinstalledcapacityin2021inSpain(3,5GW)wasdevelopedthroughPPAs),withperspectivesforfurtherdevelopmentinthecomingyears,especiallyifhighermarketpricesforelectricityremain,whichwouldchangecompletelythecompetitivenessquestion.Therefore,inadditiontotenders,utility-scalePVstartstodevelopoutsideoftheframedtendersandsimilarpolicies,therebybringingcheapelectricitytotheworld.7.2ProsumersPoliciesTheideathatPVproducerscouldbeconsideredas“prosumers”–bothproducersandconsumersofenergy–isevolvingrapidlyandpoliciesarebeingadaptedaccordinglyinseveralcountries.Thefirstsetofpoliciesusedtodevelopthemarketofsmall-scalePVinstallationsonbuildingswerecalled“net-metering”policiesandwereadoptedinalargenumberofcountries,however,withdifferentdefinitions.Thegenuine“net-metering”whichofferscreditsforPVelectricityinjectedintothegrid,havepreviouslysupportedmarketdevelopmentinBelgium,Canada,Denmark,theNetherlands,Portugal,KoreaandtheUSA,butsuchpoliciesareincreasinglyreplacedbyself-consumptionpoliciesfavouringreal-timeconsumptionofPVelectricity,oftencompletedwithafeed-intariff(orfeed-inpremiumaddedontopofthespotprice)fortheexcessPVelectricityfedintothegrid.ThisisforexamplethecaseinSpain.Asaresult,self-consumptionisbecomingamajordriverofdistributedPVinstallations.Theuseofself-consumptionincollectivebuildingsisnotyetwidespreadbutexistsintheNetherlands,Spain,Austria,Sweden,France,Switzerland,GermanyorItalytomentionafew.Decentralizedordistributedself-consumptionisstartingtodevelopwiththeideatodisconnectproductionandconsumptionofPVelectricity.ThiswouldallowoneorseveralPVproducers(evenutility-scaleplants)tofeedoneormoreconsumersatareasonabledistancesothattheuseofthepublicgridisminimized.Suchdisconnectionbetweenproductionandconsumptionwouldhelptoalleviatetheconstraintofthelocalself-consumptionratioandallowforabetteruseofavailablespaceonroofsorland.France,theNetherlandsandAustraliaallowitunderdifferentforms,mostlyforsmall-scaleinstallations.Task1StrategicPVAnalysisandOutreach–2021SnapshotofGlobalPVMarkets20Inmanycountries,suchpoliciesencounterafierceresistancefrommanydistributionsystemoperatorswhofearfortheirfuturefinancing.Withagrowingshareofdistributedgenerationandself-consumption,thequestionofgridfinanceisakeyissuetoaddress,togetherwithothernewusesofdistributiongridstochargeEVorforheatingthroughheat-pumps.IntheCleanenergyforallEuropeanspackage,theEuropeanUnionintroducedtheconceptofRenewableEnergyCommunities(REC)andofCitizenEnergyCommunities(CEC).RECshouldallowcitizenstosellrenewableenergyproductiontotheirneighbours,whilesomecrucialcomponentsarethedefinitionoftheperimeterandthetarifficationforgriduse.Thosekeycomponentsaredefinedinthenationalimplementationinthememberstates.ThisconceptofenergycommunitiesislikelytoexpandexistingPVmarketsegmentsandtoallowcostreductionsforconsumersnotabletoinvestinasolarinstallationthemselves.7.3Localmanufacturingpolicies2021hasseennumerousinitiativesfavouringlocalmanufacturingatvariousstepsofthePVvaluechain.TheincreasingimportanceofPVintheenergysector,anditsexpectedgrowtharepushingnumerousgovernmentstosupportlocalmanufacturingthroughpolicies,subsidiesandregulations.Whiletradeconflictshavediminishedinintensityinthelastyears,thewillingnesstosupportlocalproductionhasincreasedwithinitiativesinEurope,theUSA,India,MoroccoorSaudiArabia.ThisreflectsthegrowingperceptionoftheimportancethatPVcouldtakeinthecomingyearsandthewillingnesstosecurestrategicproductioninsomecountries.Thistrendisincreasingglobally,oftenwithoutaclearunderstandingoftheindustrydynamicsandthecomplexitiesofPVmanufacturing,whichwillleadtolessrealprojectsthanwhatsomegovernmentswouldliketosee.Inadditiontothis,thegrowingshareofPVintheproductionofsomecomponents,likeglasssheetsforinstance,startstorepresentagrowingshareofthetotalproduction,withlocalandglobalimpactsincaseofshortageasseeninChinain2021.Inthatrespect,localmanufacturingwillimplytheaccesstoglobalvaluechainsandtheroleofalreadyexistingglobalactorsshouldn’tbeneglected.Task1StrategicPVAnalysisandOutreach–2021SnapshotofGlobalPVMarkets218PVINTHEBROADERENERGYTRANSITION8.1PVandOtherRenewableEnergyEvolutionsPVwillplayakeyroleintheenergytransition.ThistrendisalreadyvisiblewhenlookingattheevolutionoftherenewableenergytechnologiesasshowninFigure7.Inthelast15years,PVtechnologyhasshownanever-increasingmarketgrowththankstotechnologyandpricedevelopment.Inthelastthreedecades,PVhasgonefrombeinganichetechnology,mostlyusedforelectricityproductioneitherinspaceorinremoteplaces,toamainstreamenergysource.Sources:compilationofIEAPVPS,BNEF,GWEC,IRENAandestimationsfor2021In2021,solarPVstoodforapproximately40%ofthetotalrenewableelectricityproductionfromnewproductionassets.Thedifferencewiththefigureaboveisduetothedifferentcapacityfactorsofrenewabletechnologies.Whereasbiomassinstallationscanvirtuallyproducealldayandallyear-round,windandsolarinstallations’outputsstronglydependontheavailableresourcesthatcanvarylocally.Sources:IEAPVPS,BNEF,GWECandestimationsfor2021050100150200250300350201020112012201320142015201620172018201920202021GWpFIGURE7:EVOLUTIONOFRENEWABLEENERGYANNUALINSTALLATIONSWindSolarHydroOtherrenewables(nonhydro)FIGURE8:ELECTRICITYPRODUCTIONOFTHERENEWABLEENERGYCAPACITYINSTALLEDIN2021WindoffshoreWindonshoreSolarPVHydroTask1StrategicPVAnalysisandOutreach–2021SnapshotofGlobalPVMarkets228.2ImpactofPVDevelopmentonCO2EmissionsGlobalenergyrelatedCO2eqemissionshavebeenaround33Gtin2021.2Thisrepresenteda7%yearonyeargrowthmainlyduetoeconomicreboundafterthehistoricdecreaseinthepreviousyear.Indeed,theenergyrelatedCO2eqemissionsdecreasein2020wasmainlytobeincurredtotheCOVID-19pandemicwhichseverelyimpactedtheglobalenergydemand,bothintransportasintheindustry.Thetotalemissionsoftheelectricityandheatsectorhavereachedcloseto14,6GtofCO2eqin2021,almost1000MTofCO2eqmorethanthepreviousyear.3TheroleplayedbyPVinthereductionoftheCO2emissionsfromelectricityiscontinuouslyincreasing.BasedonthetotalelectricitygeneratedbythecumulativePVcapacityinstalledgloballyattheendof2021,around1100MtofannualCO2emissionswereavoided.Thisamountiscalculatedbasedontheemissionsthatwouldhavebeengeneratedfromthesameamountofelectricityproducedbythedifferentgridmixesinallcountries,andtakingintoconsiderationlifecycleemissionsofPVsystems.Thisrepresentsaround7,5%ofthetotalelectricityandheatsectoremissionsand3%ofallenergyemissions.8.3PVFosteringDevelopmentofaCleanerEnergySystemInadditiontodirectlyfightingrisingCO2emissionsbyofferinganalternativetofossil-basedelectricityproduction,thedeploymentofPVtechnologycanalsoworkasacatalystforothertechnologieswithapotentialtotackleclimatechange.Indeed,PVisnowthemostcompetitiveelectricitysourceinsomemarketsegments.Theavailabilityofthischeapelectricityisstartingtoallowthebreakthroughof“green”syntheticfuels.Giventheneedforseasonalstorage,onekeytechnologyfortheenergytransition,isprobablygreenhydrogenproduction.Afteryearsofresearchandpilotprojects,thefirstcommercialgreenhydrogenplantsarebeingbuiltallovertheworld.Whilegreenhydrogencanbethefinalproductandbeusedintheindustryinsteadofhydrogenproducedfromfossilfuels,itcanalso2IEA,GlobalEnergyReview,CO2Emissions(https://www.iea.org/reports/global-energy-review-2021/co2-emissions)3IEA,GlobalEnergyReview:CO2Emissionsin2021,March2022(https://www.iea.org/reports/global-energy-review-co2-emissions-in-2021-2)Task1StrategicPVAnalysisandOutreach–2021SnapshotofGlobalPVMarkets23produceotherfuels,whichprovetobetransportableinaneasierway:ammonia,methanol,tolueneorsimilar.AnotherexampleofsynergiesbetweenPVandothersectorsareelectricvehicles(EV).Theelectrificationoftransportisacceleratinginmanycountries;andalmostallofwhichareactiveintheIEAPVPSTechnologyCollaborationProgramme.ThelinkbetweenPVdevelopmentandEVsisnotstraightforwardlyunderstoodyet,butitissimplybecomingarealitywiththegrowthofself-consumptionpolicies.ChargingEVsduringpeakloadhoursimpliestorethinkpowergeneration,whileconceptssuchasvirtualself-consumptioncouldrapidlyprovideaframeworkforrapidPVdevelopment.TheaccelerateddevelopmentoftheEVmarketcouldbecomparedtothedevelopmentofthePVmarket.Withcloseto7millionEVssoldin2021alone,withanincreaseofmorethan100%comparedto2020,thepenetrationofEVsislikelytobreakthroughmorequicklythanPVdidinitially.Source:IEAPVPS&EVVolumes0123456702040608010012014016018020020082009201020112012201320142015201620172018201920202021EVsales(millions)PVinstallation(GW)FIGURE9:EVOLUTIONOFEVANDPVANNUALGROWTHPVinstallation(GW)EVsales(millions)Task1StrategicPVAnalysisandOutreach–2021SnapshotofGlobalPVMarkets24

1、当您付费下载文档后,您只拥有了使用权限,并不意味着购买了版权,文档只能用于自身使用,不得用于其他商业用途(如 [转卖]进行直接盈利或[编辑后售卖]进行间接盈利)。
2、本站所有内容均由合作方或网友上传,本站不对文档的完整性、权威性及其观点立场正确性做任何保证或承诺!文档内容仅供研究参考,付费前请自行鉴别。
3、如文档内容存在违规,或者侵犯商业秘密、侵犯著作权等,请点击“违规举报”。

碎片内容

碳中和
已认证
内容提供者

碳中和

确认删除?
回到顶部
微信客服
  • 管理员微信
QQ客服
  • QQ客服点击这里给我发消息
客服邮箱