全球可再生和低碳气体报告(2021版)-国际煤气联盟VIP专享VIP免费

Global
Renewable and
Low-Carbon
Gas Report
2021 edition
About IGU
The International Gas Union is the global voice of the gas industry. With
more than 160 members in over 80 countries, covering 95% of the global
gas market: from exploration and production of natural gas, low and zero
carbon gas and technologies, to transit, pipelines, and LNG, and through
distribution and use of gas, the IGU is the only international association
covering the entire supply chain across all continents.
3GLOBAL RENEWABLE AND LOW-CARBON GAS REPORT 2021 EDITION
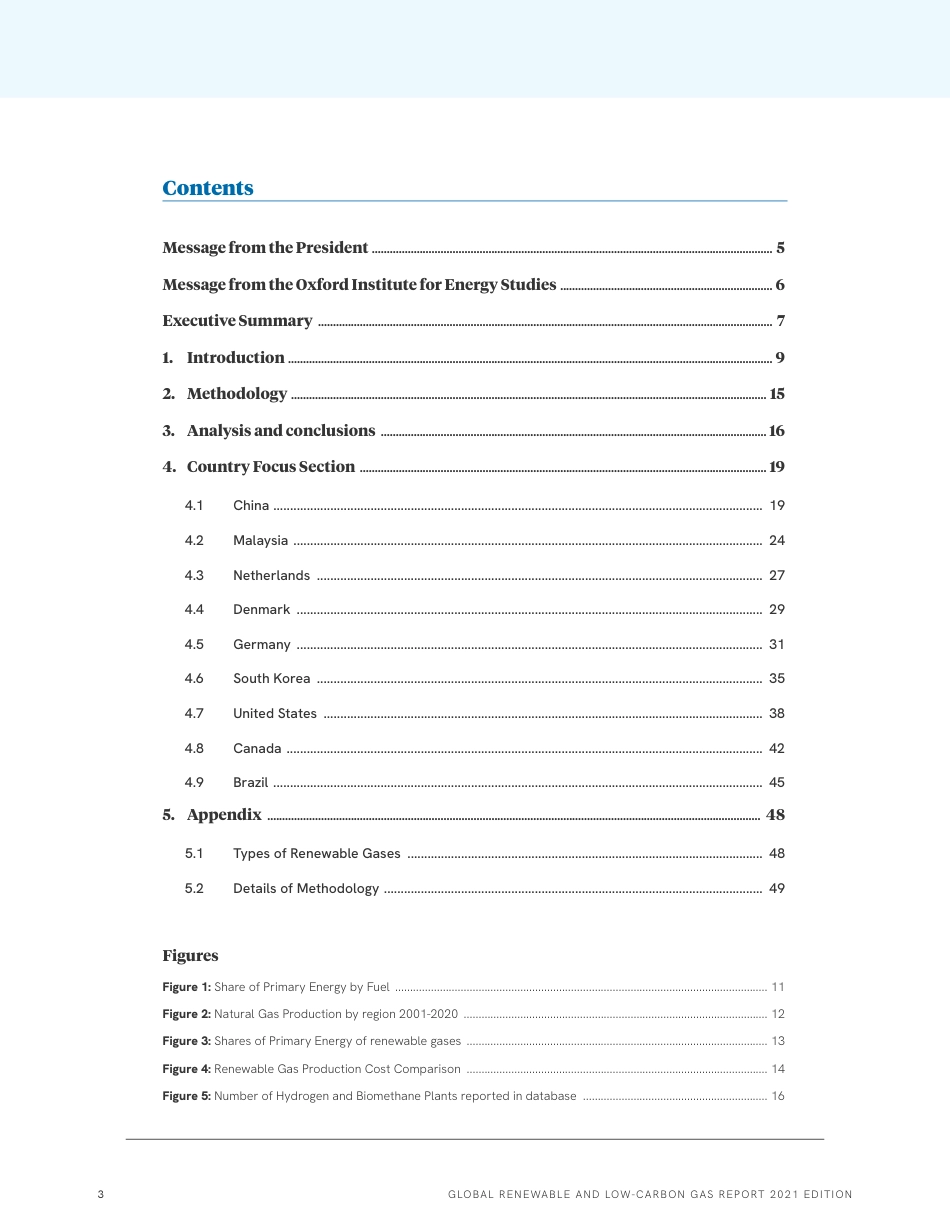
Contents
Message from the President ...................................................................................................................................... 5
Message from the Oxford Institute for Energy Studies ....................................................................... 6
Executive Summary ........................................................................................................................................................ 7
1. Introduction .................................................................................................................................................................. 9
2. Methodology ............................................................................................................................................................... 15
3. Analysis and conclusions ................................................................................................................................. 16
4. Country Focus Section ........................................................................................................................................ 19
4.1 China .................................................................................................................................................. 19
4.2 Malaysia ............................................................................................................................................ 24
4.3 Netherlands ..................................................................................................................................... 27
4.4 Denmark ........................................................................................................................................... 29
4.5 Germany ........................................................................................................................................... 31
4.6 South Korea ..................................................................................................................................... 35
4.7 United States ................................................................................................................................... 38
4.8 Canada .............................................................................................................................................. 42
4.9 Brazil .................................................................................................................................................. 45
5. Appendix ..................................................................................................................................................................... 48
5.1 Types of Renewable Gases .......................................................................................................... 48
5.2 Details of Methodology ................................................................................................................. 49
Figures
Figure 1: Share of Primary Energy by Fuel ............................................................................................................................. 11
Figure 2: Natural Gas Production by region 2001-2020 ...................................................................................................... 12
Figure 3: Shares of Primary Energy of renewable gases ..................................................................................................... 13
Figure 4: Renewable Gas Production Cost Comparison ..................................................................................................... 14
Figure 5: Number of Hydrogen and Biomethane Plants reported in database .............................................................. 16
GlobalRenewableandLow-CarbonGasReport2021editionAboutIGUTheInternationalGasUnionistheglobalvoiceofthegasindustry.Withmorethan160membersinover80countries,covering95%oftheglobalgasmarket:fromexplorationandproductionofnaturalgas,lowandzerocarbongasandtechnologies,totransit,pipelines,andLNG,andthroughdistributionanduseofgas,theIGUistheonlyinternationalassociationcoveringtheentiresupplychainacrossallcontinents.3GLOBALRENEWABLEANDLOW-CARBONGASREPORT2021EDITIONContentsMessagefromthePresident.......................................................................................................................................5MessagefromtheOxfordInstituteforEnergyStudies........................................................................6ExecutiveSummary.........................................................................................................................................................71.Introduction...................................................................................................................................................................92.Methodology................................................................................................................................................................153.Analysisandconclusions..................................................................................................................................164.CountryFocusSection.........................................................................................................................................194.1China...................................................................................................................................................194.2Malaysia.............................................................................................................................................244.3Netherlands......................................................................................................................................274.4Denmark............................................................................................................................................294.5Germany............................................................................................................................................314.6SouthKorea......................................................................................................................................354.7UnitedStates....................................................................................................................................384.8Canada...............................................................................................................................................424.9Brazil...................................................................................................................................................455.Appendix......................................................................................................................................................................485.1TypesofRenewableGases...........................................................................................................485.2DetailsofMethodology..................................................................................................................49FiguresFigure1:ShareofPrimaryEnergybyFuel..............................................................................................................................11Figure2:NaturalGasProductionbyregion2001-2020.......................................................................................................12Figure3:SharesofPrimaryEnergyofrenewablegases......................................................................................................13Figure4:RenewableGasProductionCostComparison......................................................................................................14Figure5:NumberofHydrogenandBiomethanePlantsreportedindatabase...............................................................164GLOBALRENEWABLEANDLOW-CARBONGASREPORT2021EDITIONFigure6:MapofglobalcoverageofIGU’sRenewableGasDatabase..............................................................................17Figure7:EnergyconsumptionbysourceinChina.................................................................................................................18Figure8:NumberofbiomethaneplantsinChinabystatus................................................................................................20Figure9:EstimatedoutputofbiomethaneplantsinChinabystatus...............................................................................20Figure10:NumberofhydrogenprojectsinChinabystatus...............................................................................................21Figure11:EstimatedoutputofhydrogenplantsinChinabystatus..................................................................................21Figure12:PowergenerationbysourceinMalaysia..............................................................................................................24Figure13:BiogasproductioninMalaysia................................................................................................................................25Figure14:CumulativegrowthinnumberofbiogasplantsinMalaysia.............................................................................26Figure15:CumulativegrowthincapacityofbiogasplantsinMalaysia...........................................................................26Figure16:NetherlandsbiomethanePlantsandestimatedoutputbystageofdevelopment......................................28Figure17:Electricitygenerationbysource1990-2019.......................................................................................................29Figure18:DenmarkElectricitygenerationfrombiofuelsandwastebysource1990-2019........................................29Figure19:Germangreenhousegasemissionsbyyear........................................................................................................31Figure20:GermanEnergysystembyfuelandsector2018...............................................................................................32Figure21:GermanyBiomethaneplantsbysourceoffeedstock.......................................................................................33Figure22:GermanyHydrogenPlantsbystageofdevelopment........................................................................................33Figure23:SouthKoreaPrimaryEnergySupply.....................................................................................................................35Figure24:USPrimaryEnergyConsumption1950-2020......................................................................................................37Figure25:USElectricityGeneration1950-2020....................................................................................................................38Figure26:USHydrogenprojectsbystageofdevelopment................................................................................................38Figure27:USbiomethaneprojectsbystageofdevelopment............................................................................................39Figure28:USRenewableGasprojectsbyState....................................................................................................................40Figure29:ExistingHydrogeninfrastructureinUSGulfCoastregion................................................................................41Figure30:CanadaBiogasuseandpotential...........................................................................................................................42Figure31:CanadaHydrogenProjectsbystageofdevelopment.......................................................................................43Figure32:BiomethaneProjectsinCanadabyState.............................................................................................................44Figure33:BrazilBiomethaneprojectbystatus......................................................................................................................45Figure34:BrazilBiomethaneprojectbysizeandstatus.....................................................................................................46Figure35:LocationofBrazilbiomethaneprojectsbystatus..............................................................................................46Table1:Propertiesofbiogasandnaturalgas........................................................................................................................485GLOBALRENEWABLEANDLOW-CARBONGASREPORT2021EDITIONMessagefromthePresidentWelcometotheinauguraleditionoftheInternationalGasUnion’sWorldRenewableandLow-CarbonGasReport.Thisisthefirstreportinwhatistobecomeanewseries.Wemadethechoicetolaunchthisreporttodemonstrateoursupportandappetitefortheacceleratedgrowthoftheglobalrenewableandlow-carbongassector.Developingeffectivegrowthstrategies,requiresanunderstandingofthebaseline,andthatiswhatweaimtoestablishwiththisseries.Itwilltracktheindustry’sprogress,asitgrowsanddevelopsovertime.Renewablegasandlow-carbonhydrogenaretwovitalelementsinanachievableenergytransition.Theywillbecriticalfortheglobalenergysystemtoachievetherequiredlevelsofdecarbonisation,fastenoughtoavoidirreversibleclimatechange.Theclearmessageisthatscaleofprojectedsupplyisgoingtobemoreandmorechallengingtoattain,withoutarapidandsignificantincreaseinproduction.Thecurrentlevelofplannedandinstalledproductioncapacityforrenewableandlow-carbongasesappearsnegligiblecomparedtothestatedplans,andthatmustbechanged.Assuch,thisreportisacalltoactiononallfronts–policy,industry,andthefinancialcommunity.Weallneedtoplayourpartiftherereallywillbeapracticablegaseousenergyrevolution.TheIGUaspiresforthisreporttodevelopintoauthoritativesourceofinformationonglobalrenewableandlow-carbonhydrogengas,asourotherflagshipreportsareonnaturalgas.WewilltapintotheIGU’swide-reachingglobalnetworkandoneofthemostextensivegasindustryknowledgebasesintheworldtomakethatpossible.OverathousandprofessionalsparticipateinIGU’sCommitteesandTaskForces.TheyproduceinsightfulreportsanddesigntheTechnicalProgramofoneofthebiggestglobalenergyevents,theWorldGasConferencewiththenexteditioninDaegu,Korea,inMayof2022.IalsotaketheopportunitytocallonallIGUmembersandpartnerswithrenewablegasandlow-carbonhydrogenprojectstoparticipateinthenextyear’seditionofthissurvey.Formoreinformation,youcanreachouttotheIGUreportstudygroupleaderorIGUPublicAffairs.Ihopethisreportwillbeinformativeandinspireactionintheglobalenergycommunitytoacceleratetheproductionscale-upofthekeyrenewableandlow-carbongastechnologies.Joe.M.KangPresident,IGU6GLOBALRENEWABLEANDLOW-CARBONGASREPORT2021EDITIONMessagefromtheOxfordInstituteforEnergyStudiesTheOxfordInstituteforEnergyStudies(OIES),togetherwithitspartnersinthisprojectfromtheSustainableGasInstitute,ImperialCollege,LondonandtheBureauofEconomicGeology,UniversityofTexas,Austin,hasbeendelightedtoworkwiththeInternationalGasUnionontheproductionofthisrenewablegasdatabasereport.Whilewerecognisethatthisfirsteditionhasonlybebasedonlimiteddata,ithasalreadyproducedsomevaluableinsights,andweexpectthistogrowfurtherasthedatacoverageincreasesinfutureeditions.Wefeltitparticularlyvaluabletolookatbothbiomethaneandhydrogeninonereport,asweseethemplayingcomplementaryrolesindecarbonisationoftheglobalenergysystemandbothareveryrelevanttothenaturalgasindustry.Welookforwardtocontinuingtheco-operationwiththeInternationalGasUnionoverthecomingyears.MartinLambertSeniorResearchFellow,OxfordInstituteforEnergyStudiesOIESProjectTeammembersMartinLambertOxfordInstituteforEnergyStudiesNingLinBureauofEconomicGeology,UniversityofTexas,AustinRobertBrooksRBACYayunChenRBACMeiyanChenRBACGbemiOluleyeCentreforEnvironmentalPolicy,ImperialCollege,LondonIGUInnovationandR&DCommitteeStudyGroupGerardMartinus(ProjectLead)GasTerra,TheNetherlandsVladislavKarasevichRussianGasSociety,RussiaGregCaldwellATCOGas,CanadaMarcoSanjuanPromigas,ColombiaPhilippeBuchetENGIE,FrancePierluigiIonavaleResgas,ItalyRodRinholmGasTechnologyInstitute,USASupportedby:TatianaKhanberg,IGUSeniorManagerofPublicAffairs7GLOBALRENEWABLEANDLOW-CARBONGASREPORT2021EDITIONExecutiveSummaryAswereleasethisfirsteditionoftheGlobalRenewableandLow-CarbonGasReport,theworldisabouttofindoutwhatthepathfromGlasgowtowardthedesiredsuccessofParismaylooklike.Representativesfromover100countriesareabouttomeettonegotiateaglobalconsensusonclimatechangemitigationactions,andwhilethedetailsarenotyetknown–thefactthataraisingofglobalambitionsisrequiredisundeniable.Overtherecentyears,themomentumofsupportivepolicycommitmentstowardreachingthegoalsof2015ParisAgreementshasbeengrowing–including,innosmallpart,plansandstrategiestodeveloplow-or-zerocarbonhydrogenandrenewablegas.Whilenaturalgas,whichcurrentlyprovidesaround25%ofglobalprimaryenergysupply,isthelowestcarbonfossilfuel,thereisgrowingrecognitionoftheimportanceoflow-carbongases,askeydecarbonisationactors.Theseincludebiogas,producedbyanaerobicdigestionandtypicallyusedforcombinedheatandpowernearthepointofproduction;biomethane(alsoknownasrenewablenaturalgas)fromupgradingbiogas,andlow-carbonhydrogen.Akeyquestion,however,iswhethertheselow-carbongaseousfuelscanbedevelopedfastenoughandatareasonablecost.Againstthatbackground,theInternationalGasUnion,withsupportfromtheOxfordInstituteforEnergyStudiesanditspartnersfromImperialCollegeLondonandUniversityofTexas,Austin,startedlaunchedthisglobalrenewablegasdatabaseprojecttotrackdevelopmentoflow-carbonandrenewablegassupplyaroundtheworld.Asmoreprojectsaredeveloped,andscopeandcoverageofthedatabasesincreasesinparallel,thiswillprovidetheabilitytotracktheextenttowhichactualprojectdevelopmentsareconsistentwithambitiousgoalswhichhavebeenset.Forthisfirsteditionofthereport,whileitisrecognisedthatthedatabasecurrentlyhassomegaps,ithasbeenpossibletobenchmarkdata,particularlyforsomeofthekeycountries,toprovideconfidenceintheassessmentofthecurrentstatus.Thesearethekeyconclusionsofthatassessment:•Totalglobalproductionofbothbiogasandbiomethaneisaround400TWh1,oraroundonly1%oftotalglobalnaturalgasproduction.OverhalfofthisproductionisconcentratedinafewcountriesinEurope,withafurther25%inChina.•Anestimateofsustainablebiogaspotentialsuggeststhatthiscouldrisetoaround20timesthatlevel(soaround20%ofglobalnaturalgasdemand)butourdatabasedoesnotindicatethatthereissufficientmomentumofprojectsunderdevelopmentforthispotentialtoberealisedinthenearterm.•Theproductionlevelforlow-carbonhydrogenissimilarlylow,withonlyaround0.5%ofcurrenthydrogenproductionbeingfromlow-carbonsources,thatisonlyabout0.03%ofglobalnaturalgasproduction.Despitesignificantfocusontheroleofhydrogeninthetransitionaroundtheworld,therehasbeenonlyaverysmallincreaseinlow-carbonhydrogenoutputinthelast5years.•Astrongerpolicyfocusonincreasingproductionoflow-carbonhydrogenisapositiveforcetogrowthepipelineofhydrogenprojects,whichweexpecttobereflectedinfutureeditionsofthisreport.1Forconsistency,wehavetriedtonormaliseunitstoTWh,sinceenergycontentistheimportantmetricandvolumetricmeasurescanbeconfusingacrossdifferentgaseswithdifferentenergydensity.Forreadersfamiliarwithbcm,1bcmofnaturalgasisapproximately10.4TWh8GLOBALRENEWABLEANDLOW-CARBONGASREPORT2021EDITION•Greenhydrogenissignificantlymoreexpensivethananyotherformofrenewablegas,butcostsareexpectedtofall,asthecostsofbothrenewableelectricityandelectrolysersdecreaseovertime.Itisintendedthatasthisdatabasedevelops,moreconsistentanalysisofactualtrendsinscaleupofproductionandreductionincostswouldbepossible.•Whilethereismuchstrongerinterestamongpolicymakersinlow-carbonhydrogenthanbiomethane,thecurrentlevelsofproductionandtherelativecostsofbiomethaneandhydrogensuggestthatitisimportanttoraisebiomethaneupthepolicyagenda.•Giventhescaleofthedecarbonisationchallenge,andtheneedforasmanyworkablesolutionsaspossibletoeasethepathtodecarbonisation,allformsofrenewablegasshouldbepursuedasquicklyaspossible.Thiswillrequirestrongandclearpolicysupportfromgovernmentsglobally,robustentrepreneurialinitiativefromtheincumbentindustryplayersanddisruptorsalike,andimportantly–bankabilityandaccesstoprojectfinance.ThisfirsteditionoftheIGUGlobalRenewableandLow-CarbonGasReportisintendedtosetabaselineandtopromoteinterestamongpolicymakers,industrystakeholders,andotherrelevantplayersinallformsofrenewableandlow-carbongas.Thekeyambitionwesetoutforthisseriesistotrackprogressofrenewableandlow-carbongasesfromtheircurrentearlydaysandsmallbeginningstodaytobecomingimportantfuelsinthefuturedecarbonisedenergysystem.9GLOBALRENEWABLEANDLOW-CARBONGASREPORT2021EDITIONIntroductionThepaceoftheEnergyTransitionhasbeenaccelerating,particularlysincetheconclusionofthelandmarkParisAgreementatCOP21inDecember2015.Asthisreportisbeingreleased,amajorreviewpointistakingplaceinGlasgow,attheCOP26meeting.BuildingontheParisAgreement’sambitiontolimitglobalwarmingtowellbelow2°C,atotalof137countries2,includingmanymajoreconomies,made“NetZero”emissionspledges,aimingthattheireconomiesshouldbecarbon-neutralbyaspecificdate,typically2050,althoughby2060inthecaseofChina.KeycountriesandregionstohavemadeNetZerocommitmentsincludetheEuropeanUnion(andindividualmemberstates),UnitedKingdom,Japan,SouthKorea,UnitedStatesandCanada.TotaketheseandothernationalcommitmentsundertheCOPprocessfrompledgetoreality,requiresexceptionalandrapidchangeintheentireglobalenergysystem,includingthegasindustry.Thenaturalgassupplywillneedtoprogressivelydecarbonisebyapplyinglow,zero,andnegativecarbontechnologies–suchascarboncapture,hydrogen,andrenewablegas.Italsogoeswithoutsayingthatthenaturalgasvaluechainmustoperateasefficientlyaspossible,acrosseverysegmentandonallcontinents–methaneemissionsshouldcontinuetobeminimisedandeliminated;end-useappliancesmustperformatthehighestpossibleefficiency;reducedconsumptionthroughconservationandnewtechnologiesshouldbepursued.Againstthatbackgroundtherehasbeenrapidlygrowinginterestinrenewableformsofgas,notablybiomethane(alsoknownasrenewablenaturalgas–RNG–inNorthAmerica)togetherwithlow-carbonhydrogenanditsderivatives,likeammonia.Akeyoutstandingquestioniswhethertheserenewableandlow/zerocarbonformsofgascanbedevelopedfastenough,andatareasonablecost,consistentwithdecarbonisationrequirementsoftheParisAgreement.TheInternationalGasUnionisthereforeundertakingtodevelopaglobaldatabasetotrackthebaselineandcurrentstatusofbiomethaneandlow/zerocarbonhydrogengasproductionprojects,therebygaugingthestateofthisnewgrowingmarket.Thiswillenablearealisticassessmentofthecurrentlevelofproduction,thelikelynear-termadditionsinsupplyfromprojectsunderdevelopment,andtherequiredstepstoachievethescaleofproductionrequiredtomeetdecarbonisationgoals.Itisenvisagedthatovertime,thisreportwillencapsulateatrulyglobalstateofplayinzeroandlow-carbongas.InthisfirsteditionofIGU’sglobalrenewablegasdatabase,thedatathatwewereabletogatheracrossIGU’sglobalnetworkhasshownsomegaps3.Formanycountriescollectingsuchdatacanbechallenging,and,insomecases,therearesimplyveryfewrenewablegasplantstoreporton;however,itisexpectedthatthescopeofcoverageofthedatabasewillexpandovertimeinfutureeditionsofthisreport,asourglobalnetworkbecomesincreasinglyfamiliarwiththedatagatheringprocess4.2https://www.visualcapitalist.com/race-to-net-zero-carbon-neutral-goals-by-country/3Thereareseveralexplanationsforshortageondata,withonebeingrootedinthenascentnatureoftheindustry,andthereforescarcityinsomeplacesordispersednatureofrepositoriesinothers,butthereisalsoaneedforhighertransparency.4Herewewillalsobuildonourexperienceindevelopingthewell-establishedIGUGlobalWholesaleNaturalGasPricingreport,whichalsostartedfromasimilarstatewithpatchydata,andnowcovers98%oftheglobalgasconsumption.Inthetimeofeditingthisreport,theKingdomofSaudiArabiaalsoannounceditspledgetoreachnet-zeroby2060.10GLOBALRENEWABLEANDLOW-CARBONGASREPORT2021EDITIONReportScopeThescopeofthedatabaseandthisreportcoversbiomethaneandlow-carbonhydrogenprojectswhichareoperational,underconstructionoratvariousstagesofdevelopment(asdefinedintheAppendix).Thiseditionisthefirststepinourendeavourtodeveloparealisticassessmentofthebaselinecurrentandexpectedproductionlevelsofbothbiomethaneandlow-carbonhydrogen,aswellasthesefuels’productioncosttrends.Thisworkisintendedtohelpindustryandgovernmentstoformulatetheirstrategiesaroundthegloballow-carbongasmarketdevelopment.Thisfirsteditionofthereportsetsthescene,providingdetailonthebackgroundandcontext(section2),onthemethodologyfordatacollectionandanalysis(section3),analysisofthedata,initialconclusions,andfocussectionsforthosecountrieswherethemostdatahasbeenreceived(Section4).MoredetailsonthemethodologyareprovidedintheAppendix.TypesofRenewableGasesMoredetailsaregivenintheAppendix,butthefollowingarebriefexplanationsoftypesofrenewablegasescoveredbythisreport:Biogas(or“RawBiogas”):Amixtureofgases,predominantlymethaneandcarbondioxideproducedbyanaerobicdigestionofbiomass(typicallyagriculturalwaste,manure,sewage,municipalwaste).Thisprocessmakesuseofthemethanethatwouldhaveotherwisebeenreleasedintotheatmosphere;hence,havingadirectGHGoffsettingvalue.Biomethane(orRenewableNaturalGas):RawBiogasfromanaerobicdigestionwhichhasbeenupgradedtoremoveCO2andotherimpuritiessuchthatitisofacomparablequalitytonaturalgas–thusitcanbeusedasadirectsupplement/substitutefornaturalgasintheexistinginfrastructureandequipment.Biomethanecanalsobemanufacturedfromwoodybiomassinathermalgasificationprocessalthoughthisismuchlesscommonthanproductionviaanaerobicdigestion.BlueHydrogen(orhydrogenfromnaturalgaswithcarboncaptureandstorage):Hydrogenproducedfromnaturalgaswiththeadditionofcarboncaptureandstoragetoremoveemissionsfromtheproductionprocess.GreenHydrogen(orrenewablehydrogen):Hydrogenproducedviaelectrolysis(splittingwaterintohydrogenandoxygen)usingrenewableelectricity.Low-CarbonHydrogen:Thetermusedinthisreportasacollectivetermforblueandgreenhydrogen.Theactualcarbonfootprintofaparticularlow-carbonhydrogensupplydependsonspecificfactorslikethepercentageofCO2capturedandthecarbonfootprintoftheelectricityusedforelectrolysis.11GLOBALRENEWABLEANDLOW-CARBONGASREPORT2021EDITION5BPStatisticalReview(2021):https://www.bp.com/en/global/corporate/energy-economics/statistical-review-of-world-energy.html6IEAOutlookforbiogasandbiomethane(2020):https://www.iea.org/reports/outlook-for-biogas-and-biomethane-prospects-for-organic-growth7EuropeanBiogasAssociation(2021)https://www.europeanbiogas.eu/eba-annual-report-2020/Source:analysisofdatafromBPStatisticalReview2021AsshowninFigure1,naturalgasprovidedaround25%oftotalglobalprimaryenergyin2020(138EJoutofatotalof557EJ)5.Apartfromshort-termdeclinesin2009and2020,naturalgasproductionhasbeengrowingsteadilyandiswellspreadacrossallregionsoftheworld(Figure2).Totalglobalgasdemandin2020was3,850bcm,equivalenttoaround40,000TWh.Bycontrast,totalglobalproductionofbiogasandbiomethane(in2018)isestimatedaround35Mtoe(400TWh,40bcmofnaturalgasequivalent)6sojust1%ofthesizeoftotalnaturalgasproduction.Alittleoverhalfofthatproduction(18.5Mtoe/215TWh)isconcentratedinafewcountriesinEurope,withafurther25%(7.5Mtoe/87TWh)inChina.OfthetotalbiogasproductioninEurope,onlyaround10%(24TWh)isupgradedtobiomethane,suitableforinjectionintothenaturalgasgrid.(Therestisconsumedinsmallvolumesnearthepointofproduction–ofteninruralcommunitiesforcombinedheatandpowerproduction.)7FIGURE1:SHAREOFPRIMARYENERGYBYFUELOilNaturalGasCoalNuclearHydroRenewables31%25%27%4%7%6%12GLOBALRENEWABLEANDLOW-CARBONGASREPORT2021EDITIONWhilecurrentbiogasandbiomethaneproductionisonlyaround35Mtoe,totalsustainableproductionpotentialisestimatedtobeover20timesthatlevelat730Mtoe(8,500TWh).8Atthispotentiallevel,ifallbiogaswereupgradedtogridquality9,biomethanecouldprovidearound20%oftoday’snaturalgasdemand,providingasignificantdecarbonisationbenefitreducingglobalemissionsbyaround1.5GtCO2e.However,thatalsorequiresaveryrapidbuild-upofbiomethaneproductioncapacity.Itisimportanttostressthatthisproductionlevelisconsideredsustainable,largelyfromwastestreams,includingforestresiduesusedforgasification,sodoesnotresultinadditionallandusechange,competitionwithfoodproductionorothernegativeenvironmentalimpacts.4,5004,0003,5002,5002,0001,5001,0005000BillionCubicMetresSource:BPStatisticalReview20218IEAOutlookforbiogasandbiomethane(2020)9AsdetailedfurtherintheAppendix,biogasisamixtureofCO2,methaneandotherimpurities,andcanbeupgradedtoahighpercentageofmethanesuitableforinjectionintothenaturalgasgrid.FIGURE2:NATURALGASPRODUCTIONBYREGION2001-2020NorthAmericaS&CAmericaEuropeCISMiddleEastAfricaAsia-Pacific2001200220032004200520062007200820092010201120122013201420152016201720182019202013GLOBALRENEWABLEANDLOW-CARBONGASREPORT2021EDITIONForhydrogen,currenttotaldemandforpurehydrogenisestimatedtobe70milliontonnesperyear(around2,500TWhenergycontent),mostlyforoilrefining,petrochemicals,andammoniaproduction.Mostofthishydrogenhastypicallybeenproducedfromreformingnaturalgas,inamanufacturingprocesswhichtypicallyemitsaround10tonnesCO2pertonneofhydrogen.Theinterestinlow-carbonhydrogenhasbeengrowing,asitofferssignificantbenefitsasapotentialfutureenergycarrier.AsdetailedintheAppendixtheprincipaltechnologiesforproducinglow-carbonhydrogenare;(a)reformingofnaturalgascombinedwithcarboncaptureandstorage(so-calledbluehydrogen),and(b)splittingwaterintohydrogenandoxygenusingelectrolysiswithrenewableelectricity(so-calledgreenhydrogen).10In2019,totallow-carbonhydrogenproductionwasestimatedat0.36milliontonnesperyear(around13TWhenergycontent)around0.5%oftotalpurehydrogendemand,andnearlyallproducedfromnaturalgasusingcarboncaptureandstorage)anincreaseofonly0.13milliontonnesperyearsince2013.Thislowlevelofproductionisforecast,basedonannouncedprojectstonearlyquadrupleto1.46milliontonnesby2023.11Withaquarteroftheworld’senergydemandtodaymetbygaseousfuels,atpresentpredominantlynaturalgas,itisclearthatthegaseouscomponentoftheworld’senergysystemisfoundational,andforanyrealisticrapidenergytransitiontooccur,thegasnetworkmustcontinuetoplayacriticalrole.Itisalsoclearthatcurrentproductionofrenewable/low-and-zero-carbongases(biogas,biomethaneandlow-carbonhydrogen)isverysmallinthatcontext.Thisunderlinesthescaleofthechallengeinrampingupproductionsignificantlyinthecomingyears.ItisalsonoteworthyfromFigure1thattotalnon-hydrorenewablescontributiontoprimaryenergyisonly6%,sothescaleupchallengealsoappliestoallformsofrenewableenergyandnotjustrenewablegases.Thisbackgroundisoneofthekeydriversforestablishingtheglobalrenewablegasdatabase,whichformsthebasisofthisreport.Overthecomingyearsitwillbeimportanttoformarealisticassessmentofthescale-uprateofrenewablegasproductiontoensurethatsufficientactionisbeingtakenbyindustry,governments,andallrelevantstakeholdersforactualproductiontobeavailabletomeetrequiredtargets.0.30.250.20.150.10.050ShareofPrimaryEnergy%FIGURE3:SHARESOFPRIMARYENERGYOFRENEWABLEGASESSource:Author’sanalysis10Hydrogenpyrolysisisanotherpotentialtechnology,butitiscurrentlyatquiteearlystageofdevelopment.11https://www.iea.org/reports/hydrogenBiomethane2019Low-carbonhydrogen2019Low-carbonhydrogenpotential202314GLOBALRENEWABLEANDLOW-CARBONGASREPORT2021EDITIONInadditiontoscale-upoflow-carbongasproductionvolumes,arelatedchallengeistodrivedownthecostsofthesefuels.Figure4showsanestimateofcostsof“blue”and“green”hydrogenandacomparisonwithtypicalcostsofbiomethaneandwholesalenaturalgasprices.Therearenecessarilybroadrangesaroundsuchestimates,ascostswillvarydependingonspecificcircumstances,butseveralimportantobservationscanbemade.•Allformsofrenewablegasesaremoreexpensivethantheirfossil-derivedcounterparts,sotherewillbeastrongrelianceongovernmentpolicytocreateabusinesscaseforsignificantinvestmentsinrenewablegases.•Ultimatelythecostswillbeborneeitherbyenergyconsumers,ortaxpayers,sotherewillneedtobesufficientcommunityacceptancetomakesuchgovernmentpolicypoliticallyacceptable.•Carboncaptureandstorageaddsarelativelysmallpremiumtothecostofgreyhydrogenandif,asexpected,carbonpricesincreaseovertime,bluehydrogencanbecomemoreeconomicthangreyhydrogen.•Greenhydrogenissignificantlymoreexpensivethananyotherformofrenewablegas,butcostsareexpectedtofall,asthecostsofbothrenewableelectricityandelectrolysersdecreasesovertime.Whilethegraphshowsthecostofgreenhydrogenapproachingthecostofbluehydrogenduringthe2030s,whetherthatactuallyhappenswilldependonwhetherproductionrampsupsufficientlytoenabletheeconomiesofscale–fromabaselinethatiscurrentlyquitefarfromthat.Itisintendedthatasthisdatabasedevelops,moreconsistentanalysisofactualtrendsinscaleupofproductionandreductionincostswillbepossible.Source:OIESanalysisbasedonZeroEmissionPlatformdataFIGURE4:RENEWABLEGASPRODUCTIONCOSTCOMPARISONGrey-lowGrey-highBlue-lowBlue-highGreen-lowGreen-high108642080644832160€/kg$/MMBtu202020302050NaturalGasrangeBiomethanerange15GLOBALRENEWABLEANDLOW-CARBONGASREPORT2021EDITION2.MethodologyDatacollectionwascarriedoutviaasurveytemplatedistributedtotheIGUnetworkineachcountry/region.Datawasrequestedasonerecordforeachproductionfacility/project.Thesurveyrequesteddataonplantsorprojectswithacapacity>1MW,sincetheprimaryfocusisonproductionatscale,whichwillbesignificantintheoverallenergysystem.Smallpilot/demonstrationprojectsarethereforeoutofscope.Thekeydatarequestedwererelatedtothestatusofeachplant(forexamplewhetheroperational,underconstructionoratanearlierstageofdevelopment,theexpectedstart-update,andannualproductionvolume.Inaddition,thesurveysoughttogatheranonymisedcostinformation(insubsequentiterationsofthesurveyweexpectthatthequalityofsuchdatawillincrease).Inthisfirsteditionofthesurvey,datahasbeenreceivedcovering21countries,acrossfivecontinents,andaroundhalfoftheseallowedforrobustanalysisandconclusions.ThesecountriesarereportedinSection4.Wherepossible,wehavealsocross-checkedtheinformationagainstotheravailablepublicsources,includingdatafromtheInternationalEnergyAgency,theEuropeanBiogasAssociation,aswellasindependentresearchbytheprojectteam.Forthosecountrieswhereafocussectionhasbeenincluded,wearereasonablyconfidentthatthedataprovidesarealisticpictureoftherenewablegasproductionsituationinthatcountry.16GLOBALRENEWABLEANDLOW-CARBONGASREPORT2021EDITION3.AnalysisandconclusionsSummaryResultsThechartsbelowsummarisedatareceived,supplementedbydatafromtheanalysisteamasappropriate.Itcanbeseenthatthenumberofbiomethaneplantsandprojectscurrentlyfarexceedsthenumberoflow-carbonhydrogenprojects.Thisisconsistentwiththetotalproductionofbiomethanebeinghigherthantheproductionoflow-carbonhydrogenasnotedinSection1.Themapshowsthegeographicallyextensivecoverageofdatareceived,providingasoundbasisforfurtherrefinementinfutureeditionsofthereport.KeycountryanalysisisincludedinSection4below.Acrossthecountriescoveredinthefocussections,therearesomekeyobservations:•Biogasandbiomethanecurrentlyhaveagreaternumberofplantsandhigherproductionvolumesthanlow-carbonhydrogen.ChinaandEuropearethemajorproducersofbiomethane.•InEurope(e.g.inDenmarkandGermany)anincreasingamountofbiogasisbeingupgradedtobiomethane.Denmarkisnoteworthyforitsambitiontoachieve100%biomethaneinitsgasgridby2040.•Onlylimitedquantitiesofrawbiogasareupgradedtobiomethane.Inthisfirsteditionofthesurveywehadonlyrequesteddataregardingbiomethaneinjectedintothegrid,butsomecountries(e.gMalaysiawithnobiomethaneinjection)reportedrawbiogasanyway.Infutureeditionsofthereport,wewillalsorequestdataforrawbiogastoassessthepotentialforthistobeupgradedtobiomethane.250200150100500NumberofprojectsFIGURE5:NUMBEROFHYDROGENANDBIOMETHANEPLANTSREPORTEDINDATABASEBelarusBrazilCanadaChileChinaDenmarkFranceGermanyIndiaItalyJapanKazakhstanMalaysiaNetherlandsNorwayRussiaSouthKoreaTrinidadandTobagoUkraineUnitedKingdomUnitedStatesHydrogenBiomethane17GLOBALRENEWABLEANDLOW-CARBONGASREPORT2021EDITIONKeyInitialLearningsBiogasandBiomethaneBasedonthesurveydatagatheredandadditionalresearch,inthemainmarketsofChina,EuropeandNorthAmerica,mostbiogasisproducedbyanaerobicdigestionandtypicallyusedforgeneratingelectricityorforcombinedheatandpowergenerationclosetothepointofproduction.Assuch,itprovidesausefulsourceofdispatchablerenewableenergy,butitonlyhasarelativelyindirectlinktothemainstreamnaturalgasbusiness.Inallmarkets,onlyasmallproportionofbiogasisupgradedtogridqualitybiomethanewhereithasamoredirectlinktothenaturalgasbusiness.Thescaleofbiogasandbiomethaneproductionaddedtogetherisonlyaround1%ofglobalnaturalgasproduction.Anestimateofsustainablebiogaspotentialsuggeststhatthiscouldrisetoaround20timesthatlevel(soaround20%ofglobalnaturalgasdemand)butourdatabasedoesnotindicatethatthereissufficientmomentumofprojectsunderdevelopmentforthispotentialtoberealised.HydrogenTheproductionlevelforlow-carbonhydrogenisonlyaround0.5%ofcurrenthydrogenproduction,whichisabout0.03%ofglobalnaturalgasproduction,withonlyaverysmallincreaseinlow-carbonhydrogenoutputinthelastfiveyears.Thestrongerpolicyfocusonincreasingproductionoflow-carbonhydrogen,isapositiveforcetocreateastrongerpipelineofhydrogenprojects,whichweexpecttobereflectedinfutureeditionsofthisreport.FIGURE6:MAPOFGLOBALCOVERAGEOFIGURENEWABLEGASDATABASE18GLOBALRENEWABLEANDLOW-CARBONGASREPORT2021EDITIONInfrastructureIntermsofinfrastructure,biomethanealsohastheadvantagethatitcanbeblendedseamlesslywithnaturalgasinexistinggasnetworks,withoutrequiringanychangestoenduseappliances.12Ithasalsobeendemonstrated(forexampleintheNetherlands)thatnaturalgaspipelinescanbeconvertedtocarry100%hydrogen,butthisrequiressignificantinvestment,around¼ofthecostofbuildingnewhydrogenpipelines.Equipmentandappliancesatthepointofusewouldalsoneedtobehydrogen-ready.Whilethereismuchstrongerinterestamongpolicymakersinlow-carbonhydrogenthanbiomethane,thecurrentlevelsofproductionandtherelativecostsofbiomethaneandhydrogendonotyetprovideconfidencethatlow-carbonhydrogenwillgrowrapidly.Giventhescaleofthedecarbonisationchallenge,andtheneedforasmanyworkablesolutionsaspossibletoeasethepathtodecarbonisation,allformsofrenewablegasshouldbepursuedasquicklyaspossible.Thiswillrequirestrongandclearpolicysupportfromgovernmentsglobally.12Therecanbeminorqualitydifferencesbetweennaturalgasandbiomethanewhichmayrequireadjustmentstometeringsystemsbutthesecanberesolvedrelativelyeasily.19GLOBALRENEWABLEANDLOW-CARBONGASREPORT2021EDITION4.CountryFocusSectionForeachcountrywheresufficientlyconsistentdatawasavailable,wehaveincludedafocussectionbelow.Summaryobservationsfromthefocuscountryanalysis:•Biogasandbiomethanecurrentlyhaveagreaternumberofplantsandhigherproductionvolumesthanlow-carbonhydrogen.ChinaandEuropearethemajorproducersofbiomethane.•InEurope(e.g.inDenmarkandGermany)anincreasingamountofbiogasisbeingupgradedtobiomethane.Denmarkisnoteworthyforitsambitiontoachieve100%biomethaneinitsgasgridby2040.•Onlylimitedquantitiesofrawbiogasareupgradedtobiomethane.Inthisfirsteditionofthesurveywehadonlyrequesteddataregardingbiomethaneinjectedintothegrid,butsomecountries(e.gMalaysiawithnobiomethaneinjection)reportedrawbiogasanyway.Infutureeditionsofthereport,wewillalsorequestdataforrawbiogastoassessthepotentialforthistobeupgradedtobiomethane.4.1ChinaKeyDecarbonisationandRenewableGasTargetsOn12December2020,ChinaupdatedNDCtargetsatthe2020ClimateAmbitionSummit.Astheworld’smostpopulouseconomyandthelargestemitterofgreenhousegases,ChinawillaimtohaveCO2emissionspeakbefore2030(previousNDCsaidpeakaround2030)13andstriveforcarbonneutralitybefore2060.Asthelargestcoalconsumerintheworld(Figure7),fuelswitchingincludinghydrogenandrenewablenaturalgascanbeaveryimportantpathwayforcarbonemissionsreductionandsustainabledevelopment.FIGURE7:ENERGYCONSUMPTIONBYSOURCEINCHINAOilCoalGasNuclearHydropowerWindSolarBiofuelsRenewables13https://www.iea.org/policies/12987-carbon-neutrality-target-before-2060?country=People%27s%20Republic%20Of%20China40,00035,00030,00025,00020,00015,00010,0005,0000TWh19652010201919902000Source:BPStatisticalReviewofWorldEnergy20GLOBALRENEWABLEANDLOW-CARBONGASREPORT2021EDITIONAnalysisofsurveydataBiomethaneTheIGUsurveyshowsthatthereare102large-scalebiomethaneplants,whicharedistributedinvariousprovincesofChina:48operational,30projectsunderconstruction,and24atthefeasibilitystage(Figure8).Morethanhalfofthe48projectsthatwentintoproductionreceivedgovernmentconstructionincentives.Theseprojectsallusebiomass(typically,agriculturalwaste,animalwaste,industrialwastewater)asasource,andanaerobicdigestionasproductiontechnology.Theearliestprojectstarttimereflectedinthesurveywas2011,andthelatestcameonline,asrecentlyas2020,withmoreplannedinthecomingyears.Basedonthedataweobtained,the48operationalplantsareexpectedtoproduce3,650GWhbiomethaneeveryyear,andthetotalexpectedproductionfromplantsinthedatabaseis7,458GWh(around7bcmnaturalgasequivalent).Theactualtotalproductionnumbercoulddiffer,becausesomeoftheprojectsatthefeasibilitystagedonothaveanestimatedvolumeforoutput.However,whethertheseexpectedvolumescanberealisedwilldependonthestrengthofChina’spolicysupportandthematurityoftheprojects’businessmodels.60504030201004,0003,5003,0002,5002,001,5001,005000NumberofplantsEstimatedAnnualOutput(GWh)Source:Author’sanalysisSource:Author’sanalysisFIGURE8:NUMBEROFBIOMETHANEPLANTSINCHINABYSTATUSFIGURE9:ESTIMATEDOUTPUTOFBIOMETHANEPLANTSINCHINABYSTATUSFeasabilityOperationalOperationalUnderConstructionUnderConstructionFeasability21GLOBALRENEWABLEANDLOW-CARBONGASREPORT2021EDITIONHydrogenInthecontextofChina’sgoaltoachievecarbonpeakandcarbonneutrality,Chinaisencouragingthedevelopmentofgreenhydrogen–i.eproductionusingelectrolysiswithwindorsolarpower.Incontrasttobiomethane,thesurveycountsatotalof56low-carbonhydrogenplantsinChina,ofwhichonlytwoareoperational(Figure10).However,thereare21plantsunderconstruction,and22newprojectsannouncedwithsignificantgovernmentinvestment.Manyoftheprojectsunderconstructionwillstartoperatingatthebeginning2022or2023.Althoughthesurveydataoninvestmentarenotcomplete,itsuggestsatotalof150billionCNY(around23billionUSD)investments.Theannualoutputchart(Figure11)isonlyanestimate,calculatedbasedondatareceived,andassuchmaynotpresenttheactualpotentialproduction.Ifallprojects,includingthoseattheveryearlyconceptualstage,cametofruition,totalhydrogenproductionwouldbearound10TWhor1bcmnaturalgasequivalent.ComparedtoChina’sambitiousgoalforhydrogen,theseprojectsmaynotrepresentthefullpicture,buttheyhelpusbetterunderstandtheprogressandplanChinahasbeenmakingtowarditstarget.Source:Author’sanalysisFIGURE10:NUMBEROFHYDROGENPROJECTSINCHINABYSTATUSFIGURE11:ESTIMATEDOUTPUTOFHYDROGENPLANTSINCHINABYSTATUS25201510508,0006,0004,0002,0000NumberofplantsEstimatedAnnualOutput(GWh)Source:Author’sanalysisConceptual/announcementConceptual/announcementfeasabilityfeasabilityDevelopmentDevelopmentUnderConstructionUnderConstructionOperationalOperational22GLOBALRENEWABLEANDLOW-CARBONGASREPORT2021EDITIONEvolutionofPolicyinChinaChinahasbeenapioneerinbiogas,withtheindustry’srootsgoingbacktothe19thcentury.TheStatehasbeeninvestingheavilyinbiogassince2001,withabout23millionbiogasdigestersbuiltbetween2001and2010.Atthesametime,manymedium-andlarge-scalebiogasplantswereconstructed.In2015,Chinabegantotransformandupgraderuralbiogas,andthecentralgovernmentinvestedmainlytosupporttheconstructionoflarge-scalebiogasprojectsandbiomethanepilotprojects.MinistryofAgriculture(MOA)andtheNationalDevelopmentandReformCommission(NDRC)publishedits2015WorkingPlanof“UpgradingandTransformingRuralBiogasProject,”thattargetsbuildinglarge-scalebiogasprojects(withdailyproductionofabove500m3),andtoimplementbiomethanedemonstrationprojects(wherethemethanecontentexceeds95%;1m3biogascanusuallybeupgradedto0.6m3biomethane).Thecentralgovernmentfunded25biomethanedemonstrationprojectsforthefirsttimein2015,whichwasfollowedbytheapprovalof22and18morebiomethaneprojectsin2016and2017,respectively1415.AccordingtotheStatisticsoftheMinistryofAgricultureandRuralAffairsofChina,morethan7,700large-scalebiogasandbiomethaneprojectshavebeenbuiltinChina,withanannualoutputofmorethan1.3billioncubicmeters,supplyinggastonearly500,000households.Amongthem,therearemorethan20large-scalebio-gasprojectswithanannualgasoutputofmorethan300millioncubicmeters.MOAexpectsthenumberofBNGprojectstoincreaseto197,andbiogasproductiontoincreaseto20.7Gm3by20258.Whenitcomestohydrogen,Chinaisalsothelargesthydrogenproducergloballywith25milliontons/yearofproducingcapacity,accordingtotheChinaHydrogenAlliance.In2018,theannualproductionofhydrogenwas21milliontons,whenconvertedtoenergycontentusingheatvalue,thatisaround2.7%ofChina’senergysystem.Basedontheirforecast,by2030therevenueofthecountry’shydrogenenergyindustrywillreach1trillionyuan($152.6Billionin2021equivalent),anddemandforhydrogenwillreach35milliontons,accountingforatleast5%ofChina’senergysystem(Figure2).Chinahasbeenincreasinginvestmentsinhydrogen,especiallylow-carbonhydrogenenergywithcentralandlocalgovernmentpolicyguidancetoexplorethehydrogenindustrywhichhasbeenlinkedinthecountry’s14thFive-YearPlan2021-25asoneofthesixfutureindustriesalongwithrechargeablebatteries16.China’s14thFiveYearPlanlabelshydrogena“frontier”areathatthecountrypledgestoadvance.Eventhoughanationalstrategyforhydrogendevelopmenthasyettobedeveloped,16provincesandcitieshavelaunchedtheirownfive-yearplansthatspecificallyfeaturehydrogen.Forexample,Beijingincludesacceleratedplanningandconstructionofhydrogenrefuellingstations.JiangsuProvince’splanincludesdevelopmentofhydrogenfuelcellvehiclesandhydrogenfuellinginfrastructure17.14https://www.mdpi.com/2071-1050/12/4/149015https://www.mdpi.com/2071-1050/12/4/149016https://www.globaltimes.cn/page/202104/1220923.shtml17https://asia.nikkei.com/Spotlight/Caixin/China-s-hydrogen-roadmap-4-things-to-know23GLOBALRENEWABLEANDLOW-CARBONGASREPORT2021EDITIONConclusion-ChinaAlthoughChinahasbeenutilisingbiogasforalongtime,China’sbiomethaneindustryreliesheavilyonpolicyandmostoftheprojectshavebeenrelyingongovernmentsupport.Biogas-to-biomethaneplantsarecontinuallybeingbuiltandtheproductionofbiomethaneisexpectedtogrowinthefuture.EconomicanalysisbyanIGUanalystinChinahighlightsseveralchallengesthatmustbeovercomeforbiomethanetogrowtoitsfullpotential,namely:•Feedstocksupply(agriculturalwaste,animalwaste,etc.)isamajorchallenge,byavailabilityandpricefluctuations.•Biomethanecanbetooexpensivetobeconnectedtothecitygasgridbecausemostplantsaresituatedinruralareasfarawayfrommajordemandcenters.•Overall,atpresentbiomethaneprojectsarenoteconomicinChinahavingtorelyonagovernmentsubsidytosurvive.Thisholdsbothforplantsinoperation,whichwithoutclearincentivesarestrugglingtorunprofitably,aswellasforprojectsthatareunderconstructionthatarelikelytobehaltedforeconomicreasons.ThereisasignificantpipelineofgreenhydrogenproductionprojectsinChinaandalargeamountofdownstreamhydrogeninvestmenthascontributedtotheplanningandimplementationofmanyprojects.However,uncertaintyremainsregardingtherateofprogressofthemanyearlystageprojectsandthenumberandscaleofactualgreenhydrogenproductionwilllargelyrelyonpolicydevelopment,technologybreakthroughandreductionofproductioncosts.24GLOBALRENEWABLEANDLOW-CARBONGASREPORT2021EDITION4.2MalaysiaKeyDecarbonisationandRenewableGasTargetsMalaysia’sNDCincludesatargetofreducingitsgreenhousegas(GHG)emissionsintensityofGDPby35%by2030relativeto2005,andbyupto45%conditionallytointernationalsupport18.WhiletheshareofrenewablegenerationinMalaysia’selectricitysystem(Figure12),hasbeenincreasingsince2010,sohastheuseofcoalrepresentingtodayaround30%oftotalpowergeneration.TheMinistryofEnergy,GreenTechnologyandWater(KeTTHA),Malaysiasetatargetofnearto18GWofinstalledrenewableenergycapacityby2035,toincreasetheshareofrenewablesto40%ofthenationalpowergenerationmix19.Sourcesthatqualifyasrenewableenergyinclude:biogas,biomass,municipalsolidwaste(MSW),smallhydroandsolarphotovoltaic.ThebiogasindustryinMalaysiaiscurrentlybeingdrivenprimarilybypalmoilmillsandbiogascapturefromlandfills.ThePalmOilMillEffluent(POME)ishighinorganiccarbonloadingandalsoreleasesmethaneintotheatmosphereduringdecomposition.Withthepalmoilindustrygrowingyearonyear,capturingmethanefromthesewastematerialspresentsauniqueopportunityinhighproductioncountrieslikeMalaysia,Indonesia,andThailand.Asoftheendof2018,Malaysiahad451palmoilmillsoperating.Themillsgenerate68millionm3ofPOMEasaresult.Ifallthiseffluentweredigestedanaerobically,itcangenerateover500MWofelectricityforthemills(calculated)9.In2019,Malaysiahad~68MWofinstalledbiogascapacityunderafeed-in-tariffschemewithanadditional73MWapprovedandwaitingcommencement.AccordingtoWorldBiogasAssociation(2019)20,thebiogasindustryinMalaysiahasgrownby400%since2014(Figure13).Atotalcapacityof410MWfrombiogasistargetedby20288.18https://www.iea.org/policies/11766-nationally-determined-contribution-ndc-to-the-paris-agreement-malaysia?country=Malaysia&qs=Malays19OptimalBiomethaneInjectionintoNaturalGasGrid–BiogasfromPalmOilMillEffluent(POME)inMalaysia20http://www.worldbiogasassociation.org/wp-content/uploads/2019/03/WBA-malaysia-4ppa4_v1.pdf200,000160,000120,00080,00040,0000Powergeneration(GWh)Source:UNenergystatisticsFIGURE12:POWERGENERATIONBYSOURCEINMALAYSIARenewableHydroOilNaturalGasCoal1990199219941996199820002002200420062008201020122014201625GLOBALRENEWABLEANDLOW-CARBONGASREPORT2021EDITIONAnalysisofsurveydataThesurveycovered85biogasprojects,whichbecameoperationalmainlybetween2015and2019(Figure14).Theearliestprojectsdatebackto2001,andalltheplantsareoperational,withcapacityvaryingfrom0.064to4.06MW,butnobiomethaneupgradingcapacity.Similartothecumulativenumberofplants,thecumulativecapacityoftheseplantshasbeengrowingrapidlysince2015(Figure15).Thetotalcapacityofbiogasplantswas159.65MWin2019.ThisnumberisclosetowhatwasprovidedinStatista21.Comparedtothe2028targetof410MW,thecapacityneedstobetripled.21https://www.statista.com/statistics/1019463/malaysia-biogas-energy-capacity/250200150100500EnergyGenerated(GWh)Source:WorldBiogasAssociationFIGURE13:BIOGASPRODUCTIONINMALAYSIA201220132014201520162017201826GLOBALRENEWABLEANDLOW-CARBONGASREPORT2021EDITIONConclusion-MalaysiaBiogasplantnumbersandcapacityareexpectedtogrowforthenextdecadetomeetthenationaltarget.Malaysiaisthesecondlargestproducerandexporterofpalmoilintheworld,soPalmOilMillEffluent(POME)bringsauniqueopportunityforMalaysiabiogasdevelopment.Alargeamountoflivestockmanure,agriculturalresidues,foodwasteandsewagealsoprovideanopportunityforbiogasgrowthinMalaysia.However,therearealsochallenges–asmostpalmoilmillsareinremoteareas,theyarenotalwaysconnectedtothegridorarenotconnectedtothehigh-voltagetransmissiongrid.ThisleadstoeitherinabilitytomakeuseoftheFITincentives,orhigherupfrontexpendituretobuildinfrastructure.Thisisbeingaddressedbythegovernment,butinfrastructureupgradesarelongtermprojects.Insufficientfundsforfeedintariffandhighopportunitycostarealsobarriersforthegovernmenttoovercome.Therefore,thegovernmentisworkingonavarietyofprogramsandreformstoachievetheambitioustarget.1008060402001801509060300AccumulativenumberofplantsAccumulativeoutputcapacity(MV)Source:Author’sanalysisSource:Author’sanalysisFIGURE14:CUMULATIVEGROWTHINNUMBEROFBIOGASPLANTSINMALAYSIAFIGURE15:CUMULATIVEGROWTHINCAPACITYOFBIOGASPLANTSINMALAYSIA20012009201020112012201320142015201620172018201920012009201020112012201320142015201620172018201927GLOBALRENEWABLEANDLOW-CARBONGASREPORT2021EDITION4.3NetherlandsKeyDecarbonisationandRenewableGasTargetsThefirstgovernmentsupportforproductionofbiogasintheNetherlandsstartedinthelate1990s.Initially,thefocushadbeenonproductionofbiogascombinedwithdirectconsumption,mostlyinsmallerCHP(combinedheatandpower)units,thuscircumventingtheneedforexpensivebiogasupgradingtogridgradequalityandfittingwiththeDutchenergypolicylandscapeofstrongsupportforCHP.Later,inthe2000stheindustry’sfocusshiftedtowardstheproductionofgridqualitybiomethane.InMay2019,theGovernmentoftheNetherlandspassedtheClimateActwithatargettoreducegreenhousegasemissionsby49%by2030,comparedto1990levelsandby95%by2050.ThiswascloselyfollowedbytheNationalClimateAgreementinJune2019,settingoutmoredetailedplansforeachsector.Achievingthe49%reductionby2030willbechallenging–since2019totalemissionswere184milliontonnesCO2e,onlya17%reductionfrom1990levels.23TheNetherlandsdoesnothavefirmtargetsforbiomethaneproduction,butin2017thebiomethaneindustryformulatedanambitioninthe“RoadmapGreenGas”for1.2bcm(12TWh)biomethaneproductionby2020and3.7bcm(37TWh)by2030.24Later,intheClimateAgreement25anambitionwasformulatedof70PJor2bcm.Bycontrast,totalnaturalgasconsumptionintheNetherlandsisaround330TWh26or34bcm.Forhydrogen,boththeClimateAgreementaswellastheNetherlandsNationalEnergyandClimatePlantargetaninstalledelectrolysercapacityof3-4GWin2030.Thiscapacityshouldrunonrenewableelectricity,andconsequentlyrequiresatleastasimilaramountofadditionalrenewableelectricityproductioncapacitytoberealisedbythattime.Thedocumentalsomentionsbluehydrogen(i.e.producedfromnaturalgaswithCO2capture),butgivesnospecificnumbersforthisoption.AnalysisofsurveydataBiomethaneThesurveyincluded44operationalbiomethaneplants.Unfortunately,thedataonannualproductionwasnotcomplete,butwherenecessaryweestimatedproductionbasedonstatedcapacity(assuming6000operatinghoursperyear).Thisgivesanestimatedannualproductionof2.2TWh.Tovalidatethisdata,wecomparedwiththestatisticalreportoftheEuropeanBiogasAssociationwhichstatesatotalof51biomethaneplantsin2019producing1.5TWh(anincreaseof0.5TWhfrom2018),anddatafromStatisticsNetherlandsgivesanumberof1.8TWh.Thus,itisreasonabletoassumeatotalproductionaround2TWh.Inanycase,however,theseestimatesarestillfarshortofthe12TWhtargetfor2020setinthe“RoadmapGreenGas”in2017(seeabove).Inaddition,thedatabaseincludesafurthersevenplantsunderconstruction,withatotalestimatedoutputof0.7TWh,and16plantsatthe“DetailedEngineering”stagewithatotalestimatedoutputof1.2TWh,bringingtheexpectednear-termproductionpotentialtoaround4TWh(or0.4bcm.)Figure16showsabreakdownofnumberofplantsandoutputbystageofdevelopment.22https://www.klimaatakkoord.nl/documenten/publicaties/2019/06/28/national-climate-agreement-the-netherlands23NetherlandsClimateandEnergyOutlook2020:https://www.pbl.nl/sites/default/files/downloads/pbl-2020-netherlands-climate-and-energy-outlook-2020-summary-4299.pdf24https://www.greengasinitiative.eu/upload/contenu/ggi-biomethane_report_062017_1.pdf25Klimaatakkoord(2019)p.38,seewww.klimaatakkoord.nl26Eurostat(2020)28GLOBALRENEWABLEANDLOW-CARBONGASREPORT2021EDITIONHydrogenTheNetherlandsalreadyhassubstantialproductionofhydrogen,almostexclusivelyforindustrialfeedstockuseandfrommethanereforming.Withaninitialfocusonelectrification,itwasnotuntilthesecondhalfoflastdecadethattheattentionforthepossibilitiesofgreenorlow-carbonhydrogenarose.Thesurveycovers38low-carbonhydrogenprojects,ofwhichonlytwoplantsareoperational(bothsmallpilotplants).WedonotyethavesufficientlyreliabledatatomakeestimatesoffuturehydrogenproductionbyyearfortheNetherlands,butthereareseveralsignificantprojectsatthefeasibility/detailedengineeringstage.Forexample,theH-Visionproject27aimstohaveafirst(methanereformingwithCCS)plantof750MWcapacityoperationalby2026,doublingto1,500MWbefore2030.TheHyNetherlandsProject28isintendingtohave100MWelectrolysisoperationalby2025withanexpansiontoGWscaleatanunspecifiedfuturedate.ThelargestprojectinourdatabaseisNortH229whichclaimstobeEurope’smostambitiouswindtohydrogenproject,withtheambitiontohaveacapacityof1GWofgreenhydrogenby2027,4GWby2030,withapossibleexpansionto10GWby2040.ConclusionWhiletheNetherlandsdoesnothaveofficialtargetsforbiomethaneproduction,in2019theindustrysetatargettoreach2bcm(20TWhoraround6%ofcurrentnaturalgasconsumption)by2030.Itislessthantheoriginallyformulatedtargetof37TWh,possiblyinresponsetomissingtheoriginalintermediatetargetof12TWhby2020byalargemargin,astheactualproductionin2020wasonlyaround0.2bcmor2TWh.Thereisamorepositivepictureforhydrogen,wherethereareseveralprojectsunderdevelopment,andiftheyarealldeliveredascurrentlyplanned,productioncouldexceedthegovernmenttargetof4GWcapacityby2030.Assuming4,000annualrunninghours(whichisfeasibleforoffshorewindprojects)thiscouldresultinhydrogenproductionaround16TWhby2030,whichisasubstantialamountwhencomparedtoDutchhydrogenproductionfromnaturalgassteamreformingof21TWhasreportedfor201330.27https://www.h-vision.nl/en28https://tractebel-engie.com/en/news/2021/hynetherlands-one-of-europe-s-largest-green-hydrogen-plants-to-accelerate-the-journey-to-carbon-neutrality29https://www.north2.eu/en/30Weeda,M.,ProductieroutesDuurzameWaterstof,ECN(2016).504030201002,5002,0001,5001,0005000NumberofplantsEstimatedOutput(GWh)Source:Author’sanalysisDetailedEngineeringDetailedEngineeringOperationalOperationalUnderConstructionUnderConstructionFIGURE16:NETHERLANDSBIOMETHANEPLANTSANDESTIMATEDOUTPUTBYSTAGEOFDEVELOPMENT29GLOBALRENEWABLEANDLOW-CARBONGASREPORT2021EDITION4.4DenmarkKeyDecarbonisationandRenewableGasTargetsDenmarkhastheambitiontoreduceitsgreenhousegasemissionsby70%by2030,relativeto1990levels(aimingfornet-zeroemissionsby2050).Theambitiontoreducegreenhousegasemissionsby70%by2030ishigherthantheEU’s55%targetby2030.Toreachthistarget,newsolutionswillhavetobedevelopedinthepowerandgassectors,inroadtransport,aviationandindustryaswellasintheagriculturalsector.TheDanishgovernmenthasagreedtophase-outallcoal-firedpowerby203031andDenmarkenergymixhasexperiencedadeclineincoaluseandincreaseinalternativefuelsincludingbiofuels(Figure17).Solidbiofuelsstilldominatethebiofuelmix(Figure18).TheshareofbiomethaneinDanishconsumptionisexpectedtoreacharound20%in202132.31NECP(2019),https://kefm.dk/media/7095/denmarks-national-energy-and-climate-plan.pdf32https://energinet.dk/Gas/Biogas60,00050,00040,00030,00020,00010,00007,0006,0005,0004,0003,0002,0001,0000GWhGWhSource:DenmarkEnergyStatisticsSource:EnerginetFIGURE17:ELECTRICITYGENERATIONBYSOURCE1990-2019FIGURE18:DENMARKELECTRICITYGENERATIONFROMBIOFUELSANDWASTEBYSOURCE1990-2019199019921994199619982000200220042006200820102012201420162018199019921994199619982000200220042006200820102012201420162018CoalOilNaturalGasBiofuelsWasteWindSolarPrimarysolidbiofuelsBiogasesMunicipalwaste(renew)30GLOBALRENEWABLEANDLOW-CARBONGASREPORT2021EDITIONAnalysisofsurveydataFromthesurveydata,Denmarkhas67operationalbiomethaneplants.Dataobtainedonannualproductionfrom34oftheseplantsis956GWhoutofatotalofapproximately4417GWh33.Theestimateofbiomethaneisfarshortofthetargetsetfor2020.Thedatabasealsoincludesonepower-to-hydrogenplantwitha6GWhproductioncapacityfroma1.2MWPEMelectrolyser,andonepower-to-methaneplantwitha4GWhproductioncapacityfroma1MWelectrolyser.Theestimateofhydrogenisalsofarshortofthetargetsetfor2030.ConclusionAtapolicylevel,thedifferencebetweentheactualproductionofhydrogenandbiomethaneandthetargetssetshowsaccelerativescale-upisrequiredforrenewablegasesifDenmarkistofulfilitsclimateambition.33Datafromhttps://online.energinet.dk/data/Pages/publicdata.aspx31GLOBALRENEWABLEANDLOW-CARBONGASREPORT2021EDITION4.5GermanyKeyDecarbonisationandRenewableGasTargetsGermanyaimstobegreenhousegasemissionsneutralby2045andhydrogenisseenasanimportanttoolinreachingthisgoal.Germanyhasalsosetthepreliminarytargetsofcuttingemissionsbyatleast65%by2030,comparedto1990levels(Figure3),and88%by204034.Germanysupportstheuseofgreenhydrogen.TheFederalGovernmentseesahydrogendemandofabout90to110TWhuntil2030.Hydrogenproductionplantswithatotalcapacityofupto5GWareexpectedtobebuiltinGermanyby2030toproduceupto14TWhgreenhydrogen35.BasedontheexistingfuelmixforGermany’senergysystem(Figure4),acceleratinguptakeofhydrogenandotherrenewablegasesisrequired.34https://www.cleanenergywire.org/factsheets/germanys-greenhouse-gas-emissions-and-climate-targets35GermanyNationalHydrogenStrategy(2020)https://www.bmwi.de/Redaktion/EN/Publikationen/Energie/the-national-hydrogen-strategy.pdf?__blob=publicationFile&v=61,4001,2001,0008006004002000milliontonsCO2equivalentSource:GermanEnvironmentAgencyFIGURE19:GERMANGREENHOUSEGASEMISSIONSBYYEAREnergyIndustryIndustry(excludingenergyindustry)BuildingsandheatuseTransportationAgricultureWasteTreatment19901995200020052010201120122013201420152016201720182019203032GLOBALRENEWABLEANDLOW-CARBONGASREPORT2021EDITIONGermanyisalsooneofthegloballeadersinbiomethaneproduction(asbiomethanesalesgrewnearly5.5%between2019and2020to10,269gigawatt-hours(GWh)36)eventhoughthereisnofirmpolicytargetforbiomethaneproduction.TheopportunitiesforbiomethaneareincreasingasGermanylookstowardsdecarbonisingtheheatandtransportsectors.Biomethaneisconsideredamedium-tolonger-termoptionfortransportandheatduetohighproductioncostsatpresent.AnalysisofsurveydataBiomethaneFromthesurveydata,thereare194operationalbiomethaneplantswithatotalproductionof8.8TWh.ThetotalproductionalignswithdatafromthestatisticalreportoftheEuropeanBiogasAssociationandisaround10%oftotalrawbiogasproduction.Adiverserangeofsubstratesareusedforbiogasproduction:energycrops(Figure21)(in164plants,producing84%ofthebiomethane),agriculturalresidues(in8plants,producing4%ofthebiomethane),industrialorganicwastefromfoodandbeverageindustries(in6plants,producing3%ofthebiomethane),bioandmunicipalwastein11plantsproducing6%ofthebiomethane),sewagesludge(intwoplantsproducing1%ofthebiomethane).Thesubstratesusedwereunknowninthreeplants.ThehighproportionofenergycropshasraisedconcernsregardingthesustainabilityofbiogasproductioninGermanyandledtoachangeinlegislationtofocusfuturedevelopmentsonbiowastesubstrates.350300250200150100500MtoeSource:IEAFIGURE20:GERMANENERGYSYSTEMBYFUELANDSECTOR2018OilNaturalgasCoalNuclearImportsTransformationandlossesBioenergyandwasteOtherrenewablesElectricityHeatProductionIndustryResidentialTransportCommercialTotalPrimaryEnergySupplyTotalFinalConsumption(byfuel)TotalFinalConsumption(bysector)33GLOBALRENEWABLEANDLOW-CARBONGASREPORT2021EDITIONHydrogenThedatabaselists32hydrogenplantslocatedinseveralpartsofGermany.Basedontheprojectslisted(fromfeasibilitytooperational),theestimatedhydrogenproductioncapacityis3.9TWh.(Figure22).Productionofgreenhydrogendominatesthe32plantswithProtonExchangeMembraneelectrolysisandAlkalineelectrolysisbeingthedominanttechnologies.Only14plantsareoperationalwithatotalproductioncapacityof0.74TWh.Thestatusandproductioncapacityofeightplantswereunknowninthedatabase.16141210864202,0001,5001,0005000NumberofplantsEstimatedOutput(GWh)Source:Author’sanalysisOperationalOperationalUnknownUnknownFeasabilityFeasabilityUnderDevelopmentUnderDevelopmentFIGURE22:GERMANYHYDROGENPLANTSBYSTAGEOFDEVELOPMENT1801501209060300NumberofplantsSource:Author’sanalysisFIGURE21:GERMANYBIOMETHANEPLANTSBYSOURCEOFFEEDSTOCKAgriculturalresiduesEnergycropsIndustrialorganicwastefromfoodandbeverageindustriesBioandmunicipalwasteSewagesludgeOthers34GLOBALRENEWABLEANDLOW-CARBONGASREPORT2021EDITIONConclusionGermanyhasanambitioustargettoreduceGHGemissionsbyatleast65%by2030.Intheearly2010s,GermanyledEuropeindevelopingbiogasproduction,althoughpolicyincentiveswerescaledbackfollowingaconcernregardingthelargequantityofenergycropsbeingusedforbiogasproduction.Germanyupgradesabout10%ofrawbiogasproductiontoproducearound10TWhperyearofbiomethane.FurtherexpansionofbiomethaneinGermanyisfeasible,butdoesnotappeartobeasignificantpolicyfocusatpresent.ProductionofgreenhydrogendoeshaveastrongpolicyfocusinGermany.Existinghydrogenproductioncapacity,shouldalltheprojectsinthedatabasecometofruition,is3.9TWh.Iffurtherprojectsaredevelopedrapidlyandgiventhestrongpolicydrive,meetingthetargetof5GWby2030(producingupto14TWh)maybepossible.35GLOBALRENEWABLEANDLOW-CARBONGASREPORT2021EDITION4.6SouthKoreaKeyDecarbonisationandRenewableGasTargetsInOctober2020,SouthKorea’sPresident,MoonJae-in,announcedthatthecountrywouldaimtoreachcarbonneutralityby2050.InDecember2020,thegovernmentadopteda“carbon-neutralstrategy”.Korea’sParisAgreementNDCtargetfor2030istoreduceGHGemissionsby24.4%comparedto2017levels;37howeverinMay2021,thePresidentannouncedthatamoreambitioustargetwouldbeannouncedattheCOP26conferenceinGlasgowinNovember2021.FIGURE23:SOUTHKOREAPRIMARYENERGYSUPPLYAsshowninFigure23naturalgascontributesaround25%toSouthKorea’sPrimaryEnergySupply,anditstotalfossilfuelshareinprimaryenergyis82.5%(oil37%,coal21.8%).Nuclearprovides11%andrenewablesonly6.4%.38SouthKoreaalreadyproducesaround2milliontonnesofhydrogenperyear–mainlymanufactured(withoutcarboncapture)forownuseinpetrochemicalcomplexesinUlsan,DaesanandYeosu.39HydrogenplaysakeyroleinKorea’scarbon-neutralitystrategy,whichintendsto“expanduseofcleanpowerandhydrogenacrossallsectors”.Biomethaneisnotmentionedinthestrategy,althoughtherearecommitmentstorecovermethanefromlandfillwasteandwastewater/sewagetreatmentfacilities.In2019,KoreapublisheditsHydrogenEconomyRoadmapandtheNationalRoadmapofHydrogenTechnology.40Thefocusofthesedocumentswasonfuelcellvehicles(6.2millionFCEVsby2040)andfuelcellpowergeneration(15GWby2040,plus2.1GWoffuelcellapplicationsinbuildings).Thecarbonneutralstrategyalsoreferstouseofhydrogeninlow-carbonsteel-making.Thestrategydoesnotsetexplicittargetsforlevelsoflow-carbonhydrogenproduction,andindeedinthe2019roadmapitwascontemplatedthatmuchofthehydrogenproductionwouldcomefromexistinggreyhydrogenfacilitiesinrefineriesandpetrochemicalplants.Overthelongerterm,theclimate-neutralstrategycontemplatesbothgreenhydrogen(electrolysisusingrenewablepowergeneration)andbluehydrogen(usingnaturalgaswithCCUS)aslow-carbonformsofhydrogenproduction.37https://www.europarl.europa.eu/RegData/etudes/BRIE/2021/690693/EPRS_BRI(2021)690693_EN.pdf38KoreaEnergyEconomicsInstitute(Feb2021):http://www.keei.re.kr/keei/download/MES2105.pdf#page=2239http://www.drd.wa.gov.au/Publications/Documents/Hydrogen%20Energy%20of%20KOREA.pdf40CarbonNeutralStrategyofRepublicofKorea:https://unfccc.int/sites/default/files/resource/LTS1_RKorea.pdfOilNaturalGasCoalNuclearHydroRenewables36GLOBALRENEWABLEANDLOW-CARBONGASREPORT2021EDITIONAnalysisofsurveydataPerhapsconsistentwiththelackoffocusonbiomethaneinthepolicydocumentsreferredtoabove,thedatabasedoesnotcontainanybiomethaneprojects.Forhydrogen,thedatabasecaptured15projectsofwhich11areunderconstructionand4areatconceptualstage.Totalproductionfromtheseprojectstotals35,000tonnesperyear.Manyoftheseprojects,however,arenotyetlow-carbonhydrogenprojects,althoughtheadditionofcarboncaptureandstoragecouldbecontemplatedatalaterstage.41ConclusionBiomethaneisnotcurrentlyasignificantconsiderationinSouthKoreaalthoughhydrogenisseenasplayinganimportantroleinitsenergyfuture.Hydrogenplanshavefocussedmainlyonthetransportandpowergenerationsectorswithrelativelylittlefocusonscalinguplow-carbonhydrogenproduction.Indeed,nearlyallhydrogenproductionandtheprojectslistedinthedatabasecontinuetorelatetogrey(CO2emitting)hydrogen.Itisexpectedthatagreaterfocusonlow-carbonhydrogenwouldemergeinfuture,tosupporttheambitiousdecarbonisationtargets.41https://www.greencarcongress.com/2021/03/20210305-skh2.html37GLOBALRENEWABLEANDLOW-CARBONGASREPORT2021EDITION4.7UnitedStatesKeyDecarbonisationandRenewableGasTargetsInApril2021PresidentBidenpledgedanewtargetofa50-52%GHGemissionsreductionfrom2005levelsby2030fortheUnitedStates.Thenewnationallydeterminedcontribution(NDC)morethandoublesthecountry’spriorcommitmentunderthe2015ParisClimateagreement.ComparedtotheslowdevelopmentandlackofstrongFederalactionsonclimatechange,U.S.stateshavebecomeanimportanttestinggroundforclimatepolicieswithawiderangeofpolicies,toreducegreenhousegasemission,developcleanenergyresourcesandpromotealternativefuels.Currently,24statesandtheDistrictofColumbiahaveestablishedeconomy-widegreenhousegasemissiontargets42.Whilestatelevelactionsandpolicieshaveproventobeeffective,anassortmentofstate-levelpolicieswillnotbeenoughtofullydecarbonisetheelectricitysectorandtomeettheBidenadministration’sgoalsinthetimeframerequiredtoaddressclimatechange.RoughlyhalfofallgrowthinU.S.renewableelectricity(RE)generationandcapacitysince2000isassociatedwithstateRPSrequirements,thoughthatpercentagehasdeclinedinrecentyears,representing23%ofallU.S.REcapacityadditionsin2019theexceptionoftheNortheastandMid-Atlantic.43In2020,U.S.energyconsumptionbymajorsource(Figure24)shows33%ofnaturalgas,andaround4.8%ofbiomass,ofwhichbiogasislessthan20%(soaround1%oftotalenergyconsumption).42CenterforClimateandEnergySolutions(C2ES)–U.S.StateGreenhouseGasEmissionTargets(March2021)43BerkeleyLab:U.S.RenewablesPortfolioStandards2021StatusUpdate:EarlyRelease120100806040200QuadrillionBtuSource:USEnergyInformationAdministrationJan2021FIGURE24:USPRIMARYENERGYCONSUMPTION1950-2020195019541958196219661970197419781982198619901994199820022026201020142018CoalNaturalGasPetroleumNuclearElectricHydroelectricGeothermalSolarWindBiomass38GLOBALRENEWABLEANDLOW-CARBONGASREPORT2021EDITIONAnalysisofsurveydataHydrogenFromthesurveydata44,thereare15projectsofhydrogengenerationintheUS,ofwhichonlythreeprojectsareeitheroperationalorunderconstruction.Oftheremainingprojects,threeprojectsareunderproof-of-conceptstagewithinnovativetechnologyandnineprojectshaveidentifiedatechnologyproviderandvaluechainsponsorship.44IGUdatasurveydidnotincludeUnitedStatesorCanadadata;theresearchteamhascollectedthedataindependentlyforthisreport.4,5004,0003,5003,0002,5002,0001,5001,0005000BillionkWhSource:USEnergyInformationAdministrationJan2021FIGURE25:USELECTRICITYGENERATION1950-2020195019541958196219661970197419781982198619901994199820022026201020142018CoalNaturalgasNuclearRenewablesPetroleumandother1086420NumberofplantsSource:Author’sanalysisFIGURE26:USHYDROGENPROJECTSBYSTAGEOFDEVELOPMENTAnnouncedOperationalUnderConstructionConceptual39GLOBALRENEWABLEANDLOW-CARBONGASREPORT2021EDITIONSincemanyprojectsareonlyatapilotstage,andnotbuiltforat-scaleuse,itisdifficultinsomecircumstancestoconfirmthecapacityandoutput.Therearelimiteddatapointstoprovideareliableoverviewoftotalhydrogenproductioncapacitiesatthispoint.Thesixprojectsoutofthe16withannouncedenergyoutputtotalled15,400GWh.Therelativelylargeenergyoutputtotaldependsontwoprojectsthatarebothunderdevelopment:theBakkenEnergyprojectinNorthDakota,whichaimstoconvertacoal-gasificationsyngasplanttoa310,000metrictonscapacity(over7,000GWh)bluehydrogenplantthatcouldpotentiallyproduceabout30%ofthetotalcurrenthydrogenproductionoftheUnitedStates,onceitisonlineafter2025,andtheIntermountainPowerProject(IPP)inDelta,Utahthathasanexpectednameplatecapacity840MW.Besidesthesetwolargeprojects,otherprojectsarerelativelysmallinenergyoutput,from8-GWhto260-GWhperyear.BiomethaneInthesurveydata,there13projectsreportedtogeneratebiomethaneasoutputsfromatotalof586biogasprojectsintheUnitedStates,withatotalenergyoutputof890GWhperyear,locatedinsevenstates.Anotherconclusionfromthesurveydataisthatthereareonlyahandfulofstatesthatareactiveinbothrenewablegases,includingCalifornia,Utah,andTexas.1210864201,0008006004002000NumberofplantsEstimatedOutput(GWh)Source:Author’sanalysisOperationalOperationalUnderConstructionUnderConstructionFIGURE27:USBIOMETHANEPROJECTSBYSTAGEOFDEVELOPMENT40GLOBALRENEWABLEANDLOW-CARBONGASREPORT2021EDITIONPolicyGreenhouseGasEmissions:Currently,24statesandtheDistrictofColumbiahaveestablishedeconomywidegreenhousegasemissiontargets45.Besidesstateleveltargets,13U.S.stateshaveadoptedmarket-basedapproachestoreducegreenhousegasemissions.11NortheaststateshavejointlycappedpowersectoremissionsthroughtheRegionalGreenhouseGasInitiative(RGGI)beginningin2009.Californiahasaneconomy-widecap-and-tradesystemadministeredbytheCaliforniaAirResourcesBoard(CARB)andWashingtonstateenactedacap-and-investprogramthatwillgointoeffectin20232.PortfolioStandard:29statesandtheDistrictofColumbiahaveadoptedRenewablePortfolioStandards(RPS),whichrequireacertainpercentageofautility’selectricitytocomefromrenewableenergysources.Andsevenstateshaveadoptedacleanenergystandard(CES),whichrequireselectricutilitiestodeliveracertainamountofelectricityfromrenewableorcleanenergysources.Climateactionplans:32stateshavereleasedaclimateactionplanorareintheprocessofrevisingordevelopingone.Thisincludes23statesthathavereleasedplans,8statesthatareupdatingtheirplans,and1statethatisdevelopingaplan.FIGURE28:USRENEWABLEGASPROJECTSBYSTATE45CenterforClimateandEnergySolutions(C2ES)–U.S.StateGreenhouseGasEmissionTargets(March2021)USStateofBiomethaneProjectUSStateofHydrogenProject41GLOBALRENEWABLEANDLOW-CARBONGASREPORT2021EDITIONConclusion–UnitedStatesWithoneofthelargestnaturalgasmarketsintheworld,therecouldbegreatpotentialforrenewablegases(hydrogenandRNG)intheUnitedStates,whiletherearecurrentlyrelativelyfewprojectscomparedtosomeothercountriesinEurope.WiththecurrentadministrationreturningtotheParisAgreement,andanewgovernment-fundedhydrogenprogram,itisplausibleonecouldobserveanacceleratedpaceinprojectdevelopmentinhydrogenproductioninthenextcoupleofyears.LargescalehydrogenprojectsarestartingtoberealisedintheUnitedStates,manywithproperstoragecapacityanddownstreamdistributionchannelscoupledwiththegenerationplan.TheUnitedStateshasoneofthemostconnectedfossilfuelsnetworks(oil,gasandNGL)intheworld,includingpipelinesandundergroundstorage.ThereisanemergingtrendofconsideringnewwaystoleverageandretrofittheexistingfossilfuelnetworktoscaleupthehydrogeneconomyintheUnitedStatesespeciallyinregionswithalongenergytradition.Texashasbeenactiveinpushingforhydrogenaspartofitsdecarbonizationplan,leveragingitsuniqueadvantage,producingaboutonethirdofU.S.totalhydrogengascurrentlyperyear,andthereareplanstoexpandanetworkofhydrogenproductionplantsandpipelineswithatscalegeologicalstorageinTexasGulfCoast(Figure29).Itremainstobeseentheextenttowhichtheseboldambitionswillberealised,whichwewillmonitorinfutureeditionsofthisreport.Sources:H2Tools,USDOT–PHMSA,AirLiquide,AirProducts,PraxairFIGURE29:EXISTINGHYDROGENINFRASTRUCTUREINUSGULFCOASTREGIONTEXASLOUISIANAHoustonConroeGalvestonBeaumontLakeCharlesLibertyFreeportH2pipelineH2productionunitH2storagecaverns42GLOBALRENEWABLEANDLOW-CARBONGASREPORT2021EDITION4.8CanadaKeyDecarbonisationandRenewableGasTargetsIn2016,CanadareleasedthePan-CanadianFrameworkonCleanGrowthandClimateChange–jointlydevelopedbythefederal,provincial,andterritorialgovernments-whichisdesignedtohelpCanadareachits2030GHGemissionsgoalof511metrictonCO2equivalent,a30%reductionbelow2005levels,underthe2015ParisAgreement.InDecember2020,theGovernmentofCanadareleaseditsstrengthenedfederalclimateplan,AHealthyEnvironmentandaHealthyEconomy,whichbuildsontheeffortsthatarealreadyunderwaytocutmorepollution,createmorejobs,supportahealthiereconomyandenvironmentandexceedCanada’s2030ParisAgreementemissionreductiontarget.Canadianbiogashadadecadeofrapidgrowthfrom2011to2020,withanalmost50%jumpinoperatingbiogasprojectsacrossthecountry,accordingtotheCanadian2020BiogasMarketReport.Canadanowhas279biogasprojectsfromcoasttocoastthatarecapturingmethanefromagriculturalandcommunitywasteandturningitinto196MWofcleanelectricityand6millionGJ(1.7TWh)ofrenewablenaturalgas.InCanada,threecurrentprovincialmodelshighlightdifferentapproachesthatdemonstratethetrade-offspresentedbyRNG,inOntario,BritishColumbiaandQuebec.Itisreasonabletoexpectthatthefederalgovernmentwillcontinuetodevelopsomecreditcreationopportunitiesforlow-carbongaseousfuelslikerenewablenaturalgas,althoughthemostrecentattemptbythefederalgovernmentonlyincludedliquidformofrenewablefuels.Provincialhydrogenannouncementshaveincludedthefollowing:BritishColumbia–Hydrogendevelopmentwaspromotedinthe2018CleanBCplanandthe2019HydrogenStudy,withanemphasisontransportationfuelsincludingfuelcellsandzero-emissionsvehicles.Alberta–Ageneralhydrogenstrategywasincludedinthe2020NaturalGasVisionandStrategy,withafocusonproducinghydrogenusingnaturalgasandcarboncapture,utilisationandstorage(CCUS)andexportinghydrogen.120100806040200PetajoulesSource:CanadaBiogasMarketReportFIGURE30:CANADABIOGASUSEANDPOTENTIALCurrentbiogasultilizedforenergyproductionPotentialbiogasenergyproduction(PJ)AgriculturalADIndustrialADLandfillManufacturingWWTFMunicipalWWT43GLOBALRENEWABLEANDLOW-CARBONGASREPORT2021EDITIONOntario–InNovember2020,theOntariogovernmentpublishedtheOntarioLow-CarbonHydrogenStrategy–DiscussionPaper.Thisdiscussionpaperemphasizesproducinghydrogenthroughelectrolysis,usinghydrogenforelectricitystorageandblendinghydrogenwithnaturalgastomakeOntario’snaturalgascleaner.Québec–Québec’spublicelectricutility,Hydro-Québec,publisheditsStrategicPlan2020-2024inDecember2019.Theplanemphasisessupportingthedevelopmentofhydrogenthroughresearchanddevelopmentandusinghydroelectricitytoproducehydrogenthroughelectrolysis.OnDecember16,2020,Canada’sfederalgovernmentreleaseditsHydrogenStrategyforCanada(theStrategy).TheStrategysetsanambitiousframeworktocementhydrogenasakeypartofCanada’spathtonet-zerocarbonemissionsby2050andmakeCanadaagloballeaderinhydrogentechnologies.AnalysisofsurveydataHydrogenFromthesurveydata,thereare12projectsofhydrogengenerationinCanadafromIGUdatainputs,andfourarecurrentlyoperational.Ifallprojectsarerealised,productioncouldgrowtoatotalof372GWhenergyoutputperyear(Figure31).ItisworthnotingthatShellannouncedalarge-scalecarboncaptureandsequestationinitiativeatitsScotfordrefinerycomplexnearEdmonton,AB.ItisoneofthelargestrecenteffortstointegratehydrogenproductionwithCCS.Thisalsohighlightsonecrucialpieceofthepuzzleofscalinguplow-carbonhydrogenproduction,whichcanbeusedatrefineries,ammoniaplantsandothercarbon-generatingprocesses.HavingtheadequateCCScapacitiesisanecessaryrequirementforbluehydrogen.1086420400350300250200150100500NumberofhydrogenplantsCanadaEnergyOutputbyproject(GWh)Source:Author’sanalysisOperationalOperationalUnderConstructionUnderConstructionFIGURE31:CANADAHYDROGENPROJECTSBYSTAGEOFDEVELOPMENT44GLOBALRENEWABLEANDLOW-CARBONGASREPORT2021EDITIONBiomethaneAsof2021,thereare14projectsoperatingfromIGUdatasurvey,withatotalof1,478GWhenergyoutputperyear(Figure32).InadditiontotheinformationprovidedbyCanadaBiogasAssociation,therearealso26projectscurrentlyunderdevelopment,withtotaloutputcloseto1,580GWhperyear.Conclusion–CanadaCanadianbiogashadadecadeofrapidgrowthfrom2011to2020,withanalmost50%jumpinoperatingbiogasprojectsacrossthecountry,butfuturegrowthappearsmoreuncertain.Theprimarybarrierforfurtherdevelopmentoftherenewablegassectoriscurrentlyweakandas-yet-undefinedpolicy.Canadianlow-carbonhydrogenproductioniscurrentlysmall,butwithseveralprojectsinthepipelineithasthepotentialtogrowinthecomingyears.Thiswilldependonsuitablepolicyincentiveswhichwewillcontinuetomonitorinfutureeditionsofthisreport.141210864202,0001,5001,0005000NumberofbiomethaneprojectsinCanadaOoutputofbiomethaneprojectsinCanadaSource:CanadaBiogasAssociationOperationalOperationalUnderConstructionUnderConstructionFIGURE32:BIOMETHANEPROJECTSINCANADABYSTATEAlbertaBritishColumbiaOntarioQuebec45GLOBALRENEWABLEANDLOW-CARBONGASREPORT2021EDITION4.9BrazilKeyDecarbonisationandRenewableGasTargetsInDecember2020,BrazilupdateditsNationallyDeterminedContribution(NDC)undertheParisAgreement,whereitcommittedtoreducingemissionsrelativeto2005levels:by37%by2025,43%by2030,andby95%by2050.Brazilwillalsotargetzeronetemissionsby2060.Morethan80%ofitselectricityisrenewable–mostlyhydro(60%),aswellaswind,solar,andbiomass.Brazilaccountsforlessthan3%ofglobalcarbonemissions,andthecarboncreditmarkethasapositiveimpactonreducingdeforestationinthatcountry.Brazilhasthelargestpotentialforbiogasintheworld.Therearemorethan520biogasplants(althoughlessthan10%producebiomethane)inBrazilwithcapacitytoproduce2,200m3/dayofgasforelectricorheatgeneration,orupgradingtobiomethane.BasedonthebiogasandbiomethanemarketresearchfromNetherlandsEnterpriseAgency(basedon2019data),theproductionpotentialcansupply36%oftheBrazilianelectricaldemand,orreplace70%ofthedieseldemand.Abiogás(theBrazilianBiogasAssociation)aimstoincreasenationalproductionto30,000m3/dayofbiogasandbiomethaneby2030andenvisagesinvestmentof7billionUSdollarstoreachthetarget.AnalysisofsurveydataBiomethaneFromthesurveydata,thereare62biogastobiomethaneplantsstatedasbecomingoperationalbetween2003and2019,ofwhich44plantsareinthecategoryofindustry,13ofthemarefromagricultureandlivestock.Mostoftheoperationalplantsareinthemicroorsmallsizeandgeographicallylocatedinthesouth-easternstatesofBrazil.50403020100Source:Author’sanalysisFIGURE33:BRAZILBIOMETHANEPROJECTBYSTATUSAgriculture&LivestockIndustrySanitationSucroenergeticInoperationUnderimplementationUnderrenovation46GLOBALRENEWABLEANDLOW-CARBONGASREPORT2021EDITIONSource:Author’sanalysisThetotalestimatedannualbiomethaneproductionbasedonthelistedplantsinthedatabaseis215,466,319Nm3/yr(0.2bcmor2TWh).Almost60%productionisfromindustry,morethan30%productionfromsanitation.Thesugarindustryaccountsfor7%andagriculture,andlivestockaccountsfor2%.Thedatabasedoesnotcurrentlyholdanydataonhydrogenprojects,butgiventherecentpolicyannouncements(seebelow),thismaybeexpectedtochangeinfuture.50403020100NumberofprojectsSource:Author’sanalysisFIGURE34:BRAZILBIOMETHANEPROJECTBYSIZEANDSTATUSMediumMicroSmallInoperationUnderimplementationUnderrenovationFIGURE35:LOCATIONOFBRAZILBIOMETHANEPROJECTSBYSTATUSPortoAlegreFlorianópolisCuritibaSãoPauloRiodeJaneiroBeloHorizonteCampoGrandeCuiabáSalvadorFortazelaBRAZILPARAGUAYBOLIVIAPERUARGENTINAURUGRUAYCHILEInoperationUnderimplementationUnderrenovation47GLOBALRENEWABLEANDLOW-CARBONGASREPORT2021EDITIONPolicyOnMay17,2021,theBrazilianNationalEnergyPolicyCouncil(CNPE)establishedguidelinesforpublicresearch,development,andinnovationfundstoallocateresourcesinpriorityareasthatincludehydrogen.Manypilotprojectshavebeenlaunched,amongstthemoneofthelargestgreenhydrogenprojectshasbeenannouncedbytheGovernmentoftheStateofCeará(tobelocatedintheBrazilianportofPecém),inpartnershipwithAustralianEnegixEnergy.TheinvestmentofthegreenhydrogenhubisestimatedataroundUS$5.4billionanditintendstotransformsolarandwindpowerintomorethan600millionkilogramsofgreenH2annually.Ithastheambitiontobetheworld’sbiggestgreenhydrogenplant,sinceCearáStatehasanideallocationinthenortheastofBrazil,facingthemarketsofEuropeandNorthAmerica.Conclusion-BrazilAlthoughBrazilhasalargepotentialforbiogasproduction,theofficialtargetforbiomethaneandbiogasproductionof30,000m3/dby2030seemstobeanambitiousplan,comparedto2,200m3/dcurrentproduction.It’salmost15timesmorethanthecurrentproductionandasksforover3,000m3/dincrementalcapacityforeachyearfromnowonto2030.Moreover,mostoftheplantsaresmallormicrosize.Toreachthegoal,thekeystrategiesforBrazilwouldbescalingupandseekingforsufficientinvestmenttobuildupthecapacity.Accordingtoouranalysis,26%of2,200m3/disfrombiomethaneatthecurrentlevel;atthetargetof2030withthesameproportionofbiomethane,thepotentialproductionofbiomethaneshouldbe8,000m3/d.Thiswouldrequiresignificantinvestmentinnewbiomethaneplants.Thereareseveralmediumsizebiomethaneprojectsunderdevelopmentwhich,ifdeliveredascurrentlyplanned,couldapproachthegovernmenttargetby2030.Facedwithfrequentdroughts,theamountofavailablehydropowerhasbecomerelativelyunpredictableinBrazil.TheBraziliangovernmentiseagerlyseekingalternativestoreachthetargetandbackupthehydropower.Extendingtheproductionofhydrogen,biogasandbiomethaneisoneofthosealternativeswiththegoaloflowercarbonemissionsby2030andnet-zeroemissionsby2060.48GLOBALRENEWABLEANDLOW-CARBONGASREPORT2021EDITION5.Appendix5.1TypesofRenewableGases:Biogas(or“RawBiogas”):Amixtureofgases,predominantlymethaneandcarbondioxideproducedbyanaerobicdigestionofbiomass(typicallyagriculturalwaste,manure,sewage,municipalwaste).Proportionsofmethaneandcarbondioxidevarydependingonfeedstockandproductionprocess,butacomparisonofthepropertiesofbiogasandnaturalgasisprovidedinTable1Biomethane(orRenewableNaturalGas):RawBiogasfromanaerobicdigestionwhichhasbeenupgradedtoremoveCO2andotherimpuritiessuchthatitisofacomparablequalitytonaturalgas.Suchupgradedbiomethaneisthentypicallyinjectedintothenaturalgasgrid.Biomethanecanalsobemanufacturedfromwoodybiomassinathermalgasificationprocessalthoughthisismuchlesscommonthanproductionviaanaerobicdigestion.GreyHydrogen(orhydrogenfromnaturalgas,withemissionsofcarbondioxide):Hydrogenproducedfromnaturalgasthroughmethanereforming.Mosthydrogentodayisproducedviasteammethanereformingofnaturalgas,whichemitsaround10tonnesofCO2pertonneofhydrogen.(Somehydrogen,particularlyinChina,isproducedfromcoalorligniteandissometimescalledblackorbrownhydrogen).Allofthesetypesofhydrogendonotqualifyaslow-carbon.BlueHydrogen(orhydrogenfromnaturalgaswithcarboncaptureandstorage):Hydrogenproducedfromnaturalgaswiththeadditionofcarboncaptureandstorage.WhileSteamMethaneReformingiscommonlyusedforgreyhydrogenproduction,thealternativeAutoThermalReformingispreferredforbluehydrogenasittypicallyresultsinahigherconcentrationofCO2inthefluegasmoresuitableforcaptureandstorage.GreenHydrogen(orrenewablehydrogen):Hydrogenproducedviaelectrolysisusingrenewableelectricity.(insomecases,particularlyinitially,anelectrolysermayrunongrid-basedelectricitywhichislikelytoalsocontainacomponentoffossilfuelgeneration,butweassumethatinthelongruntheintentionwillbethattheelectrolyserrunsentirelyonrenewableelectricity).TABLE1:PROPERTIESOFBIOGASANDNATURALGASSubstanceBiogasfromanaerobicfermentationNaturalGasMethane50-85%83-98%Carbondioxide15-50%0-1.4%Nitrogen0-1%0.6-2.7%Oxygen0.01-1%-Hydrogentraces-HydrogensulphideUpto4,000ppmv-Ammoniatraces-Ethane-Upto11%Propane-Upto3%Siloxane0-5mg/m3-WobbeIndex4.6-9.111.3-15.449GLOBALRENEWABLEANDLOW-CARBONGASREPORT2021EDITION5.2DetailsofMethodologyScopeofSurveyTheIGUGlobalRenewableandLow-CarbonGasdatabasesurveyaimstocollectdataonproductionfacilitiesforbiomethaneandhydrogen.The2021editionfocusedprimarilyonbiomethaneinjectedintothenaturalgasgrid(eitherdirectlyorafterintermediatetruck/railtransportation),andrenewableorlow-carbonhydrogendata.Thesurveyaskedtoincludedataonprojectswhichareunderdevelopment(infeasibilitystudyorengineeringstage)aswellasunderconstructionorinoperation.Becausethesurveyisfocussedontheproductioncapacityscale-up,itonlyrequesteddataforplantswithcapacityof1MWorgreaterTechnologyTypeOptionsIncludedinSurvey•Anaerobicdigestion(toproducebiogas)•Biomassgasificationtoproducemethane•MP[MethanePyrolysis]•PMP[pulsemethanepyrolysiselectrolysis]•SMR[SteamMethaneReforming]withCCS•ATR[Autothermalreforming]withCCS•Biogasreforming•Bitumengasification+CCS•ALK[Alkalineelectrolysis]•PEM[Protonexchangemembraneelectrolysis]•SOEC[Solidoxideelectrolysis]•HTSE[High-temperaturesteamelectrolysis]•Coalgasification+CCS[Hydrogenproductionfromcoalgasification(alltypesofcoalsandderivatives)coupledwithCO2capture]•Microbialfermentation•Biogaspyrolysis•AEM[AnionExchangeMembrane]•UnknownPtX[power-to-X]•Others(pleasefillincomments)ProductionSourceOptions•Wind•Solar•Nuclear•Gridelectricity•NaturalGas•Coal•Oil•Hydro•BiomassStatusAllowableoptionsforthisfieldare:•Conceptual/Announced•FeasibilityStudy•DetailedEngineering•UnderConstruction•Operational•Mothballed•Other(pleaseexplainincomments)InternationalGasUnionCentrumHouse,36StationRoadTW209LFEgham,Surrey,UnitedKingdomE-mail:info@igu.orgWebsite:www.igu.orgPublishedbytheInternationalGasUnion(IGU)Copyright©2021.TheentireContentofthispublicationisprotectedbycopyright,fulldetailsofwhichareavailablefromthepublisher.Allrightsreserved.Nopartofthispublicationmaybereproduced,storedinretrievalsystemsortransmittedinanyformorbyanymeans–electronic,mechanical,photocopying,recordingorotherwise–withoutthepriorpermissionofthecopyrightowner.

1、当您付费下载文档后,您只拥有了使用权限,并不意味着购买了版权,文档只能用于自身使用,不得用于其他商业用途(如 [转卖]进行直接盈利或[编辑后售卖]进行间接盈利)。
2、本站所有内容均由合作方或网友上传,本站不对文档的完整性、权威性及其观点立场正确性做任何保证或承诺!文档内容仅供研究参考,付费前请自行鉴别。
3、如文档内容存在违规,或者侵犯商业秘密、侵犯著作权等,请点击“违规举报”。

碎片内容

碳中和
已认证
内容提供者

碳中和

确认删除?
回到顶部
微信客服
  • 管理员微信
QQ客服
  • QQ客服点击这里给我发消息
客服邮箱