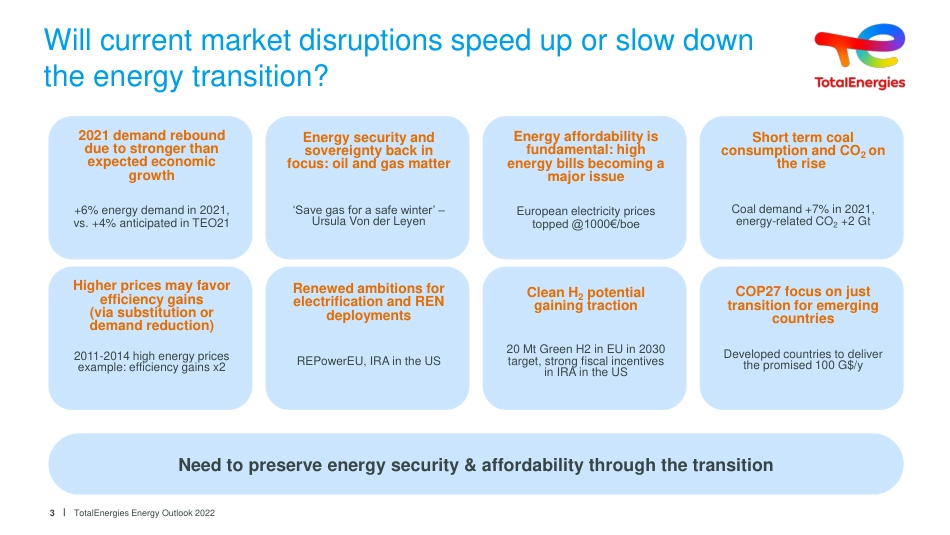
TotalEnergiesEnergy Outlook 2022Energy trends since 2000: transition has startedGDP growth decoupled from total energy demand and CO2 emissions growthTotalEnergies Energy Outlook 20222CAGR 2000/2019Index of key indicators2000=100CO2 emissionsTotal energy demandNatural gas demandRenewables demandCoal demandElectricity demandGDP3,5%3,2%2,7%2,5%2,6%2,0%1,9%1,1%Power fastest growing energy, oil slowest oneCoal growth, triggered by China take-off since 2000, slowing since 2015Natural gas and renewables growing at the same speedEnergy intensity gains explaining most of the decoupling between GDP and emissions growthAs in 2000, fossil fuels still make up 81% of the energy mix in 2019Oil demandEnergy int. gains1,5%90100110120130140150160170180190200200020052010201520202021 demand rebound due to stronger than expected economic growth+6% energy demand in 2021, vs. +4% anticipated in TEO21Energy security and sovereignty back in focus: oil and gas matter ‘Save gas for a safe winter’ –Ursula Von der LeyenWill current market disruptions speed up or slow down the energy transition?TotalEnergies Energy Outlook 20223Renewed ambitions for electrification and REN deploymentsREPowerEU, IRA in the USHigher prices may favor efficiency gains (via substitution or demand reduction) 2011-2014 high energy prices example: efficiency gains x2Energy affordability is fundamental: high energy bills becoming a major issueEuropean electricity prices topped @1000€/boeShort term coal consumption and CO2 on the riseCoal demand +7% in 2021, energy-related CO2 +2 GtClean H2 potential gaining traction20 Mt Green H2 in EU in 2030 target, strong fiscal incentives in IRA in the USNeed to preserve energy security & affordability through the transitionCOP27 focus on just transit...