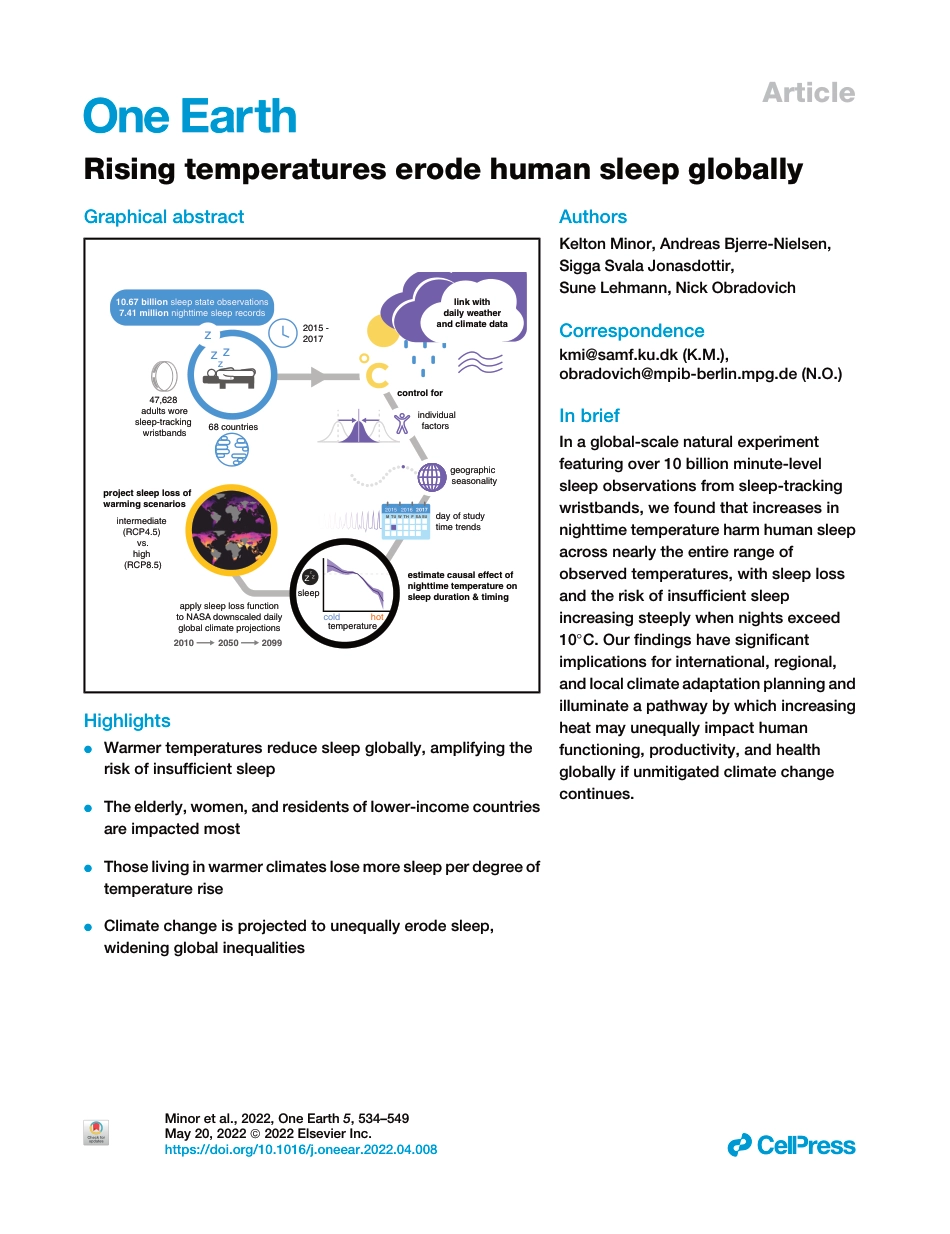
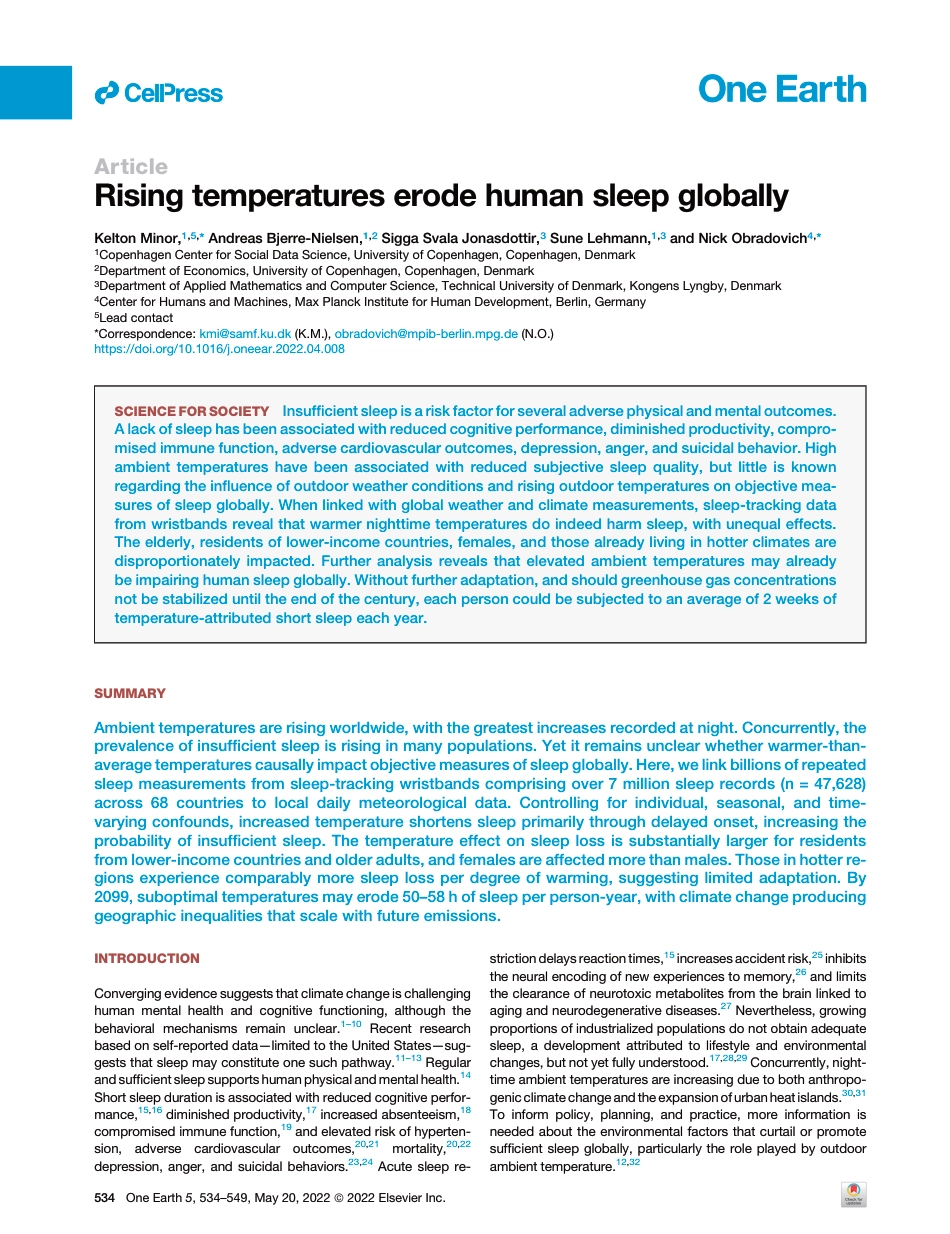
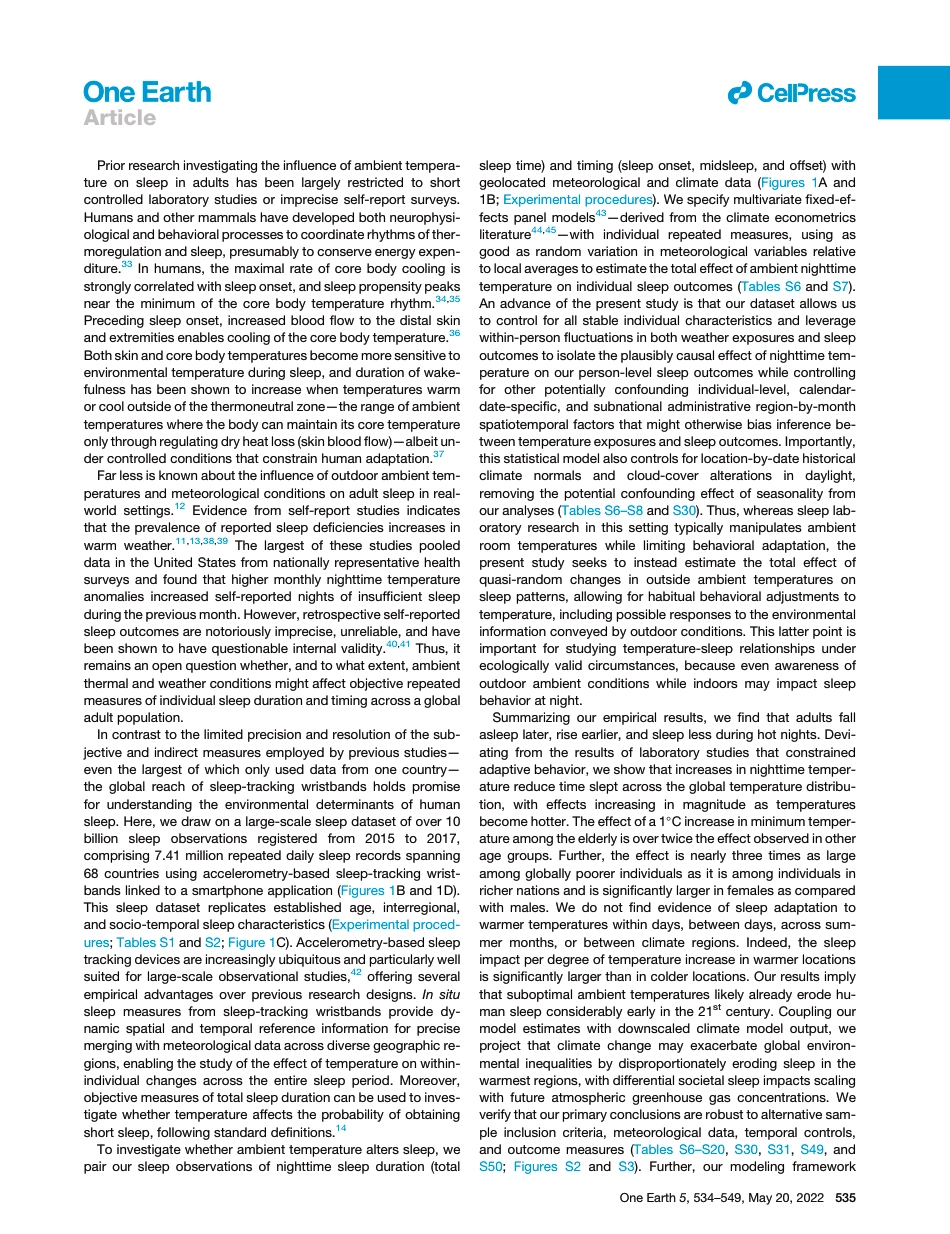
ArticleRisingtemperatureserodehumansleepgloballyGraphicalabstractHighlightsdWarmertemperaturesreducesleepglobally,amplifyingtheriskofinsufficientsleepdTheelderly,women,andresidentsoflower-incomecountriesareimpactedmostdThoselivinginwarmerclimateslosemoresleepperdegreeoftemperaturerisedClimatechangeisprojectedtounequallyerodesleep,wideningglobalinequalitiesAuthorsKeltonMinor,AndreasBjerre-Nielsen,SiggaSvalaJonasdottir,SuneLehmann,NickObradovichCorrespondencekmi@samf.ku.dk(K.M.),obradovich@mpib-berlin.mpg.de(N.O.)InbriefInaglobal-scalenaturalexperimentfeaturingover10billionminute-levelsleepobservationsfromsleep-trackingwristbands,wefoundthatincreasesinnighttimetemperatureharmhumansleepacrossnearlytheentirerangeofobservedtemperatures,withsleeplossandtheriskofinsufficientsleepincreasingsteeplywhennightsexceed10C.Ourfindingshavesignificantimplicationsforinternational,regional,andlocalclimateadaptationplanningandilluminateapathwaybywhichincreasingheatmayunequallyimpacthumanfunctioning,productivity,andhealthgloballyifunmitigatedclimatechangecontinues.10.67billionsleepstateobservations7.41millionnighttimesleeprecordszzz68countries2015-2017estimatecausaleffectofnighttimetemperatureonsleepduration&timingapplysleeplossfunctiontoNASAdownscaleddailyglobalclimateprojections47,628adultsworesleep-trackingwristbandscontrolforindividualfactorsgeographicseasonalityprojectsleeplossofwarmingscenarioszlinkwithdailyweatherandclimatedataMTUWTHFSASU201520162017dayofstudytimetrendstemperaturesleephotcoldzzzintermediate(RCP4.5)vs.high(RCP8.5)205020102099Minoretal.,2022,OneEarth5,534–549May20,2022ª2022ElsevierInc.https://doi.org/10.1016/j.oneear.2022.04.008llArticleRisingtemperatureserodehumansleepgloballyKeltonMinor,1,5,AndreasBjerre-Nielsen,1,2SiggaSvalaJonasdottir,3SuneLehmann,1,3andNickObradovich4,1CopenhagenCenterforSocialDataScience,UniversityofCopenhagen,Copenhagen,Denmark2DepartmentofEconomics,UniversityofCopenhagen,Copenhagen,Denmark3DepartmentofAppliedMathematicsandComputerScience,TechnicalUniversityofDenmark,KongensLyngby,Denmark4CenterforHumansandMachines,MaxPlanckInstituteforHumanDevelopment,Berlin,Germany5LeadcontactCorrespondence:kmi@samf.ku.dk(K.M.),obradovich@mpib-berlin.mpg.de(N.O.)https://doi.org/10.1016/j.oneear.2022.04.008SUMMARYAmbienttemperaturesarerisingworldwide,withthegreatestincreasesrecordedatnight.Concurrently,theprevalenceofinsufficientsleepisrisinginmanypopulations.Yetitremainsunclearwhetherwarmer-than-averagetemperaturescausallyimpactobjectivemeasuresofsleepglobally.Here,welinkbillionsofrepeatedsleepmeasurementsfromsleep-trackingwristbandscomprisingover7millionsleeprecords(n=47,628)across68countriestolocaldailymeteorologicaldata.Controllingforindividual,seasonal,andtime-varyingconfounds,increasedtemperatureshortenssleepprimarilythroughdelayedonset,increasingtheprobabilityofinsufficientsleep.Thetemperatureeffectonsleeplossissubstantiallylargerforresidentsfromlower-incomecountriesandolderadults,andfemalesareaffectedmorethanmales.Thoseinhotterre-gionsexperiencecomparablymoresleeplossperdegreeofwarming,suggestinglimitedadaptation.By2099,suboptimaltemperaturesmayerode50–58hofsleepperperson-year,withclimatechangeproducinggeographicinequalitiesthatscalewithfutureemissions.INTRODUCTIONConvergingevidencesuggeststhatclimatechangeischallenginghumanmentalhealthandcognitivefunctioning,althoughthebehavioralmechanismsremainunclear.1–10Recentresearchbasedonself-reporteddata—limitedtotheUnitedStates—sug-geststhatsleepmayconstituteonesuchpathway.11–13Regularandsufficientsleepsupportshumanphysicalandmentalhealth.14Shortsleepdurationisassociatedwithreducedcognitiveperfor-mance,15,16diminishedproductivity,17increasedabsenteeism,18compromisedimmunefunction,19andelevatedriskofhyperten-sion,adversecardiovascularoutcomes,20,21mortality,20,22depression,anger,andsuicidalbehaviors.23,24Acutesleepre-strictiondelaysreactiontimes,15increasesaccidentrisk,25inhibitstheneuralencodingofnewexperiencestomemory,26andlimitstheclearanceofneurotoxicmetabolitesfromthebrainlinkedtoagingandneurodegenerativediseases.27Nevertheless,growingproportionsofindustrializedpopulationsdonotobtainadequatesleep,adevelopmentattributedtolifestyleandenvironmentalchanges,butnotyetfullyunderstood.17,28,29Concurrently,night-timeambienttemperaturesareincreasingduetobothanthropo-genicclimatechangeandtheexpansionofurbanheatislands.30,31Toinformpolicy,planning,andpractice,moreinformationisneededabouttheenvironmentalfactorsthatcurtailorpromotesufficientsleepglobally,particularlytheroleplayedbyoutdoorambienttemperature.12,32SCIENCEFORSOCIETYInsufficientsleepisariskfactorforseveraladversephysicalandmentaloutcomes.Alackofsleephasbeenassociatedwithreducedcognitiveperformance,diminishedproductivity,compro-misedimmunefunction,adversecardiovascularoutcomes,depression,anger,andsuicidalbehavior.Highambienttemperatureshavebeenassociatedwithreducedsubjectivesleepquality,butlittleisknownregardingtheinfluenceofoutdoorweatherconditionsandrisingoutdoortemperaturesonobjectivemea-suresofsleepglobally.Whenlinkedwithglobalweatherandclimatemeasurements,sleep-trackingdatafromwristbandsrevealthatwarmernighttimetemperaturesdoindeedharmsleep,withunequaleffects.Theelderly,residentsoflower-incomecountries,females,andthosealreadylivinginhotterclimatesaredisproportionatelyimpacted.Furtheranalysisrevealsthatelevatedambienttemperaturesmayalreadybeimpairinghumansleepglobally.Withoutfurtheradaptation,andshouldgreenhousegasconcentrationsnotbestabilizeduntiltheendofthecentury,eachpersoncouldbesubjectedtoanaverageof2weeksoftemperature-attributedshortsleepeachyear.534OneEarth5,534–549,May20,2022ª2022ElsevierInc.llPriorresearchinvestigatingtheinfluenceofambienttempera-tureonsleepinadultshasbeenlargelyrestrictedtoshortcontrolledlaboratorystudiesorimpreciseself-reportsurveys.Humansandothermammalshavedevelopedbothneurophysi-ologicalandbehavioralprocessestocoordinaterhythmsofther-moregulationandsleep,presumablytoconserveenergyexpen-diture.33Inhumans,themaximalrateofcorebodycoolingisstronglycorrelatedwithsleeponset,andsleeppropensitypeaksneartheminimumofthecorebodytemperaturerhythm.34,35Precedingsleeponset,increasedbloodflowtothedistalskinandextremitiesenablescoolingofthecorebodytemperature.36Bothskinandcorebodytemperaturesbecomemoresensitivetoenvironmentaltemperatureduringsleep,anddurationofwake-fulnesshasbeenshowntoincreasewhentemperatureswarmorcooloutsideofthethermoneutralzone—therangeofambienttemperatureswherethebodycanmaintainitscoretemperatureonlythroughregulatingdryheatloss(skinbloodflow)—albeitun-dercontrolledconditionsthatconstrainhumanadaptation.37Farlessisknownabouttheinfluenceofoutdoorambienttem-peraturesandmeteorologicalconditionsonadultsleepinreal-worldsettings.12Evidencefromself-reportstudiesindicatesthattheprevalenceofreportedsleepdeficienciesincreasesinwarmweather.11,13,38,39ThelargestofthesestudiespooleddataintheUnitedStatesfromnationallyrepresentativehealthsurveysandfoundthathighermonthlynighttimetemperatureanomaliesincreasedself-reportednightsofinsufficientsleepduringthepreviousmonth.However,retrospectiveself-reportedsleepoutcomesarenotoriouslyimprecise,unreliable,andhavebeenshowntohavequestionableinternalvalidity.40,41Thus,itremainsanopenquestionwhether,andtowhatextent,ambientthermalandweatherconditionsmightaffectobjectiverepeatedmeasuresofindividualsleepdurationandtimingacrossaglobaladultpopulation.Incontrasttothelimitedprecisionandresolutionofthesub-jectiveandindirectmeasuresemployedbypreviousstudies—eventhelargestofwhichonlyuseddatafromonecountry—theglobalreachofsleep-trackingwristbandsholdspromiseforunderstandingtheenvironmentaldeterminantsofhumansleep.Here,wedrawonalarge-scalesleepdatasetofover10billionsleepobservationsregisteredfrom2015to2017,comprising7.41millionrepeateddailysleeprecordsspanning68countriesusingaccelerometry-basedsleep-trackingwrist-bandslinkedtoasmartphoneapplication(Figures1Band1D).Thissleepdatasetreplicatesestablishedage,interregional,andsocio-temporalsleepcharacteristics(Experimentalproced-ures;TablesS1andS2;Figure1C).Accelerometry-basedsleeptrackingdevicesareincreasinglyubiquitousandparticularlywellsuitedforlarge-scaleobservationalstudies,42offeringseveralempiricaladvantagesoverpreviousresearchdesigns.Insitusleepmeasuresfromsleep-trackingwristbandsprovidedy-namicspatialandtemporalreferenceinformationforprecisemergingwithmeteorologicaldataacrossdiversegeographicre-gions,enablingthestudyoftheeffectoftemperatureonwithin-individualchangesacrosstheentiresleepperiod.Moreover,objectivemeasuresoftotalsleepdurationcanbeusedtoinves-tigatewhethertemperatureaffectstheprobabilityofobtainingshortsleep,followingstandarddefinitions.14Toinvestigatewhetherambienttemperaturealterssleep,wepairoursleepobservationsofnighttimesleepduration(totalsleeptime)andtiming(sleeponset,midsleep,andoffset)withgeolocatedmeteorologicalandclimatedata(Figures1Aand1B;Experimentalprocedures).Wespecifymultivariatefixed-ef-fectspanelmodels43—derivedfromtheclimateeconometricsliterature44,45—withindividualrepeatedmeasures,usingasgoodasrandomvariationinmeteorologicalvariablesrelativetolocalaveragestoestimatethetotaleffectofambientnighttimetemperatureonindividualsleepoutcomes(TablesS6andS7).Anadvanceofthepresentstudyisthatourdatasetallowsustocontrolforallstableindividualcharacteristicsandleveragewithin-personfluctuationsinbothweatherexposuresandsleepoutcomestoisolatetheplausiblycausaleffectofnighttimetem-peratureonourperson-levelsleepoutcomeswhilecontrollingforotherpotentiallyconfoundingindividual-level,calendar-date-specific,andsubnationaladministrativeregion-by-monthspatiotemporalfactorsthatmightotherwisebiasinferencebe-tweentemperatureexposuresandsleepoutcomes.Importantly,thisstatisticalmodelalsocontrolsforlocation-by-datehistoricalclimatenormalsandcloud-coveralterationsindaylight,removingthepotentialconfoundingeffectofseasonalityfromouranalyses(TablesS6–S8andS30).Thus,whereassleeplab-oratoryresearchinthissettingtypicallymanipulatesambientroomtemperatureswhilelimitingbehavioraladaptation,thepresentstudyseekstoinsteadestimatethetotaleffectofquasi-randomchangesinoutsideambienttemperaturesonsleeppatterns,allowingforhabitualbehavioraladjustmentstotemperature,includingpossibleresponsestotheenvironmentalinformationconveyedbyoutdoorconditions.Thislatterpointisimportantforstudyingtemperature-sleeprelationshipsunderecologicallyvalidcircumstances,becauseevenawarenessofoutdoorambientconditionswhileindoorsmayimpactsleepbehavioratnight.Summarizingourempiricalresults,wefindthatadultsfallasleeplater,riseearlier,andsleeplessduringhotnights.Devi-atingfromtheresultsoflaboratorystudiesthatconstrainedadaptivebehavior,weshowthatincreasesinnighttimetemper-aturereducetimesleptacrosstheglobaltemperaturedistribu-tion,witheffectsincreasinginmagnitudeastemperaturesbecomehotter.Theeffectofa1Cincreaseinminimumtemper-atureamongtheelderlyisovertwicetheeffectobservedinotheragegroups.Further,theeffectisnearlythreetimesaslargeamonggloballypoorerindividualsasitisamongindividualsinrichernationsandissignificantlylargerinfemalesascomparedwithmales.Wedonotfindevidenceofsleepadaptationtowarmertemperatureswithindays,betweendays,acrosssum-mermonths,orbetweenclimateregions.Indeed,thesleepimpactperdegreeoftemperatureincreaseinwarmerlocationsissignificantlylargerthanincolderlocations.Ourresultsimplythatsuboptimalambienttemperatureslikelyalreadyerodehu-mansleepconsiderablyearlyinthe21stcentury.Couplingourmodelestimateswithdownscaledclimatemodeloutput,weprojectthatclimatechangemayexacerbateglobalenviron-mentalinequalitiesbydisproportionatelyerodingsleepinthewarmestregions,withdifferentialsocietalsleepimpactsscalingwithfutureatmosphericgreenhousegasconcentrations.Weverifythatourprimaryconclusionsarerobusttoalternativesam-pleinclusioncriteria,meteorologicaldata,temporalcontrols,andoutcomemeasures(TablesS6–S20,S30,S31,S49,andS50;FiguresS2andS3).Further,ourmodelingframeworkllArticleOneEarth5,534–549,May20,2022535controlsforanyunobserved,fixeddevicecharacteristics,andweconfirmthattheperiodandfrequencyofsleep-trackingwrist-bandusedoesnotalterourprimaryresults(Experimentalpro-cedures;TablesS32andS33).RESULTSEffectsonsleepdurationandshortsleepprobabilityTheresultsofourbinnedtemperatureregressionsindicatethatexogenousincreasesinnighttimeambienttemperaturereduceadultsleepdurationacrossnearlytheentireobservedtempera-turedistribution(Figures2AandS2).Climatechangeisprojectedtocontinuetoincreasethemagnitudeandfrequencyofextremenighttimetemperaturesbeyondtherecenthistoricalrecord.Ourdataindicatethat,onverywarmnights(>30C),sleepdeclinesby14.08min(À10.61toÀ17.55)comparedwithnightswiththelowesttemperature-attributedsleeplossinoursample.Increasingnighttimetemperaturesamplifytheestimatedproba-bilityofobtainingashortnightofsleep,measuredwithmultiplestandarddefinitionsforinsufficientsleep.14Theprobabilityofsleepinglessthan7hincreasesgraduallyupto10C,beforeincreasingatanelevatedrate.Nighttimeminimumtemperaturesgreaterthan25Cincreasetheprobabilityofgettinglessthan7hofsleepby3.5percentagepointscomparedwiththetempera-turebaselineof5C–10C(Figure2D).However,ourresultsshowthattheoptimumnighttimeambienttemperatureforsuffi-cientsleepmaybeconsiderablylowerthanthisbaseline,withnighttimeheatinducingshortsleepacrossmostofthetempera-turedistribution.Providingscaleforthisestimatedrelationship,exposuretonighttimetemperaturesexceeding25C,ifextrapo-latedforanequivalentpopulationof100,000adultsacrossasin-glenight,wouldresultin4,600additionalindividualsobtainingashort<7-hnightofsleepcomparedwiththeestimatedoptimumminimumnighttimetemperature.TotalNightimeSleepObservations(millions)2015Sept-Dec2016Jan-Dec2017Jan-Oct1.002.03.04.00.613.443.36DayofYear(2016)Avg.IndividualNightlySleepDeviation(inhours)28-.4-.20.2.4.6.85684112140168196224252280308336364100100010000FitnessbandcountGHCNDweatherstationsABCDFigure1.Globalweatherstationandsleepdatacoverage(A)PlottedmapofweatherstationsfromtheGlobalHistoricalClimatologyNetwork-Daily(GHCND).Eachbluedotrepresentsonestation.(B)Worldmapdepictingthecountry-levelcountofaccelerometry-basedsleep-trackingwristbandusersincludedinthisstudy,spanning68countriesfromallcontinentsexceptforAntarctica.Countrieswithrelativelymoreusersappearasdarkershadesofgreen.(C)Plotshowingregularanddynamictemporalpatternsinwithin-individualsleepdurationdeviationfromaverage(inhours)overthe2016calendaryear.Eachdailymeasurecorrespondstothemeanofallwithin-individualnightlysleepdeviationsforactiveusersonthatday.Recurringweekendpeaks(abovezero)andweekdayvalleys(belowzero)reflecttheimbalancedtemporalstructureoftheadultworkingweek—wherebysleepreductionduringweekdaysispartiallycompensatedforonweekendswithoversleep.(D)Annualtotalnumberofnighttimesleepobservationscollectedoverthe2-yearperiodfromSeptember2015throughOctober2017,inmillions.llArticle536OneEarth5,534–549,May20,2022Ourresultsarerobust,evenwhenemployingmoreextremethresholdsofshortsleep,including<6hand<5h,demonstratingthatmarginallossesintotalsleeptimewithrisingtemperaturespredisposespeopletoinsufficientsleepattainment(Figure2D;TablesS9andS10).Further,sincepriorevidencefromaggre-gatedmobilephonecallingdatasuggeststhatpeoplemaycompensateforseasonalsleepreductionsduringthesummerwithafternoonnaps,wecheckthatourprimaryresultsarerobusttoreplacingnighttimesleepdurationwith24-hsleepduration.46Contrarytothehypothesisthattotalsleeptimemightbeconserved,wefindthatincludingdaytimesleepactuallyslightlyincreasestheeffectsizeoftemperatureonwithin-individualsleeplosswithinoursample(TablesS8andS29).Moreover,constrainingoursampletoonlyincludehigh-incomecountriesdoesnotalterourprimaryresults(TablesS49andS50).Ourfindingthathumansleepisunidirectionallysensitivetoincreasingambienttemperaturesacrossthetemperaturedistri-butiondiffersfrompreviousexperimentalstudiesthatfoundre-ductionsinsleepunderbothhighandlowenvironmentaltemper-atures.37Instead,ourwithin-personglobalanalysisuncoversasimilarfunctionalrelationshipasthoseidentifiedbypriornationalsurveyanalysesusingsubjectivemeasuresofsleep.11,13Inreal-worldsettings,humansappeartobebetteratadaptingtheirsurroundingstoobtainsufficientsleepundercooleroutside-2024PercentagePointChangeinShortSleep<7hr.<6hr.<5hr.-1001020Min.NighttimeTemperature(in°C)-2.50.02.5ChangeinMidsleep(min)ChangeinSleepOnset(min)ChangeinSleepOffset(min)-2.50.02.55.07.5-2.50.02.55.07.5>25°CMarginalEffectof>25°Consleepperiod-1001020Min.NighttimeTemperature(in°C)BCED-10-50515Min.NighttimeTemperature(in°C)ChangeinSleepDuration(minutes)−1001020AFigure2.Increasingtemperatureshortensthehumansleepperiod(A)Plotoftherelationshipbetweenincreasesinnighttimeminimumtemperatureandtheaveragewithin-individualchangeinsleepdurationforeachtemperaturebin.Asminimumtemperaturesrise,sleepdurationdecreaseswithasteeperlineardeclinewhentemperaturesexceed10C.Shadedregionsrepresent95%confidenceintervalscomputedusingheteroskedasticity-robuststandarderrorsclusteredonthefirstadministrativedivisionlevel.Histogramsplotthedistributionofobservednighttimetemperaturesacrossmillionsofsleepobservations.Weconfirmsufficientobservationalsupportacrossalltemperaturebins(TableS5).(B)Highnighttimetemperaturessignificantlycompressthehumansleepperiod,primarilythroughadelayinsleeponsetandamarginallysmalleradvanceinsleepoffset.Sleepoffsetadvancesunderhighernighttimetemperatures>15C,whileverycoldtemperaturesbelowÀ10Cdelayoffsettiming.(C)NighttimetemperatureincreasesaboveÀ10Cmarginallydelaymidsleep—themidpointofthehumansleepperiod—althoughthemagnitudeofchangeathighertemperaturesissmallerthanconcomitantchangesinsleeponsetandoffset.(D)Aplotofthepredictedchangeintheprobabilityofobtainingashortnightofsleepacrosseachminimumtemperaturebin.Astemperatureincreasesabove5C,theprobabilityofobtainingashortnightofsleep—measuredwiththreestandardcriteria—alsoincreases.(E)AboveÀ10C,increasingnighttimeambienttemperaturesdelaysleeponsetacrosstheobservedtemperaturedistribution.llArticleOneEarth5,534–549,May20,2022537conditions,whereassleeplossincreaseswithrisingambienttemperatures.Sinceothermeteorologicalfactorsmayalsoinflu-encesleep,weuseourprimaryflexiblemodelspecification(Experimentalprocedures;Equation1)toestimatethehumansleepresponsetochangesinweather.Sleeplossincreasesfurtherasafunctionofthediurnaltemperaturerange—thediffer-encebetweendailymaximumandminimumtemperature.Thisresultisdirectionallyconsistentwiththediurnaltemperaturerangeattributedmortalityresponseidentifiedbyarecentmulti-countryanalysis.47Sinceourspecifiedmodelcontrolsforotherweathervariables,includingcloudcoverandrelativehumidity,twoplausibleexplanationsarethatindoorenvironmentsmayretainheatgainedduringthedayorthatdaytimeheatmayimpartphysiologicaldemandsthatextendintothesleepperiod.Importantly,diurnaltemperaturerangeisprojectedtoincreaseannuallyoverEurope48andseparatelyacrossmostotherre-gionsduringsummermonthsunderahigh-emissions,climate-changescenario.47Bycontrast,highlevelsofprecipitation,windspeed,andcloudcovereachmarginallyincreasesleepduration(FigureS1).Comparedwithmoderatelevelsofrelativehumidity,bothlowandhighlevelsreducesleep,withtheformerproducinggreatersleepreduction,providinginitialevidencethatdryconditionsmaycurtailsleep.Effectonsleeponset,midsleep,andoffsetToinvestigatehowtheentiresleepperiodrespondstotempera-ture-drivensleeploss,weconstructseparateflexiblemodelstopredictsleeponset,midsleep,andoffsettiming.Drawingonthesecombinedestimates,weshowthatrisingtemperaturescompressthehumansleepperiodthroughbothalargerdelayinsleeponsetandamoderateadvanceinsleepoffset.Asmini-mumtemperaturesriseaboveÀ10C,delaysinsleeponsetcurtailsleepduration(Figures2A–2Cand2E)andmarginallydelaymidsleep.Bycontrast,nighttimetemperatureincreasesadvancesleepoffsettimingwhentemperaturesexceed15C.Thus,largerdeclinesinsleepdurationatwarmernighttimetem-peraturesarejointlydrivenbybothdelaysinsleeponsetandad-vancesinsleepoffset,constrictingthehumansleepperiodandslightlydelayingmidsleep(TablesS12–S14).TemperatureeffectsbyagegroupIndividualandenvironmentaldemographicfactorsmaymodifytheimpactoftemperatureonsleep.Olderadulthoodismarkedbyanattenuatedthermoregulatoryresponsetosuboptimalenvi-ronmentaltemperatures,earliersleeptiming,andreducedtotalsleepduration.49Suchage-relateddevelopmentsmayincreasethenocturnalsensitivityoftheelderlytohigherambienttemper-atures,possiblychallengingsleepdemand.Wefindthatolderadults(>65)aremarkedlymoresensitivetoexogenousincreasesinnighttimeambienttemperaturethanmid-agedadultsandyoungadults(Figure3A).Theper-degreeeffectofnighttimetem-peratureonlostsleepforolderadults(coefficient:À0.61)isovertwotimes(p<0.01)theeffectestimatedformid-ageadults(co-efficient:À0.28).Theseresultsaddtoincreasingevidenceoftheage-relatedambienttemperaturesensitivityofsleep.11,50Toexploretheemergenceofheightenedtemperaturesensitivityinlaterlife,werunanalternativespecificationfeaturingsmalleragegroupsforevery10-yearincrementabove30yearsofage.Weshowthatheightenedtemperaturesensitivitymayemergerapidlyafterage60andincreasefurtherbeyondage70(TableS23).TemperatureeffectsbysexUnderidenticalconditions,females’corebodytemperaturesdecreaseearlierintheeveningcomparedwithmales,51possiblyexposingfemalestohigherenvironmentaltemperaturesaroundtheirtimeofhabitualsleeponset.Femaleshavealsobeenshowntohavegreatersubcutaneousfatthickness,whichmightimpairnocturnalheatloss.38Comparingtheeffectofminimumtemper-atureonsleepdurationbetweensexesrevealsthattheper-de-greenegativeimpactofnighttimetemperatureriseissignifi-cantly(p<0.01)butonlyslightlylargerforfemales(coefficient:À0.34)thanmales(coefficient:À0.27)inourdataset(Figure3B).Thisfindingaddstoevidencethatfemalesmaybemorepredis-posedtoadverseheateffectsonhealththanmales.52,53TemperatureeffectsbycountryincomelevelSinceaccesstoinfrastructure,coolingtechnologies,andotherunobservedenvironmentalresourcesmayplausiblymodifytheextenttowhichtemperatureimpactssleep,wefurthertestwhetherourresultsdifferacrosscountry-incomelevels.Wefindthattheeffectofminimumnighttimetemperatureonhumansleeplossissubstantiallylargerforpeopleresidingwithinlower-middle-incomecountries(coefficient:À0.85)comparedwithcountrieswithhigherincomelevels(Figure3C;TablesS25andS26).Thenegativeeffectofnighttimetemperatureonsleepdurationis2.8timesgreater(p=0.087)forresidentsinlower-mid-dle-incomecountriescomparedwiththosefromhigh-incomecountries(coefficient:À0.30)and3.6timesgreater(p=0.057)comparedwithupper-middle-incomecountries(coefficient:À0.23).Collectively,theseresultsprovideinitialevidencethatcountriesfromallobservedincomelevelsaresensitivetotheef-fectofambientnighttimetemperatureonsleep,buttheamountofsleeplossperdegreeincreasemaybedisproportionatelylargerforpeopleinlower-middle-incomecountries.TemperatureeffectsbyseasonTodeterminewhetherincreasesinminimumtemperaturesimpacthumansleepdifferentlyoverthecourseoftheyear,weinspectthemarginaleffectoftemperatureonsleeplossacrosseachseason,accountingforhemisphericdifferencesinseason-ality.Nighttimetemperatureincreasesresultinsleeplossthroughouttheyear(Figure3D).Consistentwiththeannualtemperaturedistribution,wefindthatrisingnighttimetempera-turesdecreasesleepdurationthemostduringsummermonths(coefficient:À0.55),followedbyfall(coefficient:À0.35),spring(coefficient:À0.25),andwinter(coefficient:À0.20)months(allcoefficientsaresignificantlydifferentfromzeroatthep<0.01level).Theper-degreeeffectofanincreaseinnighttimetemper-atureonsleeplossduringthesummerisnearlythreetimeslargerthaninthewinter.Ourresultsprovidefurtherevidencethattem-peratureincreasesimpartthelargestlossesonhumansleepwhennighttimetemperaturesarealreadyelevated(Figure2A;TableS21).EffectsbyaverageannualnighttimetemperaturedecileThosewhoresideinwarmerareaswithgenerallyhighertemper-aturesmayrespondtotemperatureincreasesdifferentlythanllArticle538OneEarth5,534–549,May20,2022thoselivingincolderregions.54Toinvestigatewhethertheeffectoftemperaturediffersbyambientclimatecontext,weconductedaheterogeneityanalysisbydecileofaveragelocalminimumtemperatureoverthe2015–2017period(Experimentalproced-ures;TableS28;Figure3E).Wefindthat,comparedwiththecoldestaveragetemperaturedecile,marginaleffectsofmini-mumtemperatureonsleeplossaresignificantlylargerforresi-dentsofwarmerdeciles(4th–10thdeciles).Thoselivinginhotterregionsexperiencecomparablymoresleeplossperdegreeofwarming,suggestiveoflimitedadaptationinwarmerclimates.Theseresultsappearconsistentwithourbinnedtemperaturespecifications(Figure2A),showingthattemperatureincreasesatcoldertemperaturesyieldsmallereffectsizes.Intra-annualandinter-dayadaptationSincepriorresearchsuggeststhatpeoplemaybeabletophys-iologicallyorbehaviorallyacclimatizetowarmertemperaturesoverrelativelyshortperiodsoftime,55wefurtherassesspossibleintra-annualandinter-daysleepadaptationtoambienttempera-ture.First,wetestwhetherhumansleeprespondsdifferentlytonighttimetemperatureincreasesexperiencedduringthefirstmonthofsummer—whennightswithlocallyhottertemperaturesarerelativelynewer—versusthelastmonthofsummerwhentheyaremorefamiliar.55Whileshort-runacclimatizationwouldbeapparentiftheeffectoftemperatureonsleepdurationdimin-ishesfromthefirsttothelastmonthofsummer,weinsteadfindevidencethatnighttimetemperaturesappeartoincursimilarto01.51.00.5MarginalEffectof1°C(onminutesofsleeploss)D1ColdestD2D3D4D5D6D7D8D9D10Warmest2015-2017AvgMinimumTemperatureDecile01.51.00.5SpringSummerFallWinterSeasonMarginalEffectof1°C(onminutesofsleeploss)MarginalEffectof1°C(onminutesofsleeploss)01.51.00.5Lower-midUpper-midHighGrossNationalIncome01.51.00.5MarginalEffectof1°C(onminutesofsleeploss)FemalesMalesSex01.51.00.5YoungAdultsMiddle-AgedAdultsOlderAdultsAgeGroupMarginalEffectof1°C(onminutesofsleeploss)ABCDEFigure3.Demographic,seasonal,andregionalsubgroupanalyses(A)Themarginaleffectoftemperaturebyagecategoryonsleeplossproducedbyinteractingagegroupwithnighttimeminimumtemperaturewithinourprimarymodelspecification(Experimentalprocedures;Equation2).Themarginaleffectofincreasingtemperatureby1Consleeplossisnearlytwicethemagnitudeforolderadults(n=1,289adults;n=155,922observations)comparedwithmid-agedadults(n=39,460adults;n=4,078,623observations)andyoungadults(n=2,364adults;n=170,626observations).(B)Themarginaleffectsoftemperaturebysexonsleeploss.Thosewhoidentifyasfemale(n=13,302adults;n=1,279,271observations)losemoresleepperdegreeincreaseinminimumtemperaturecomparedwiththosewhoidentifyasmale(n=29,811adults;n=3,125,900observations).(C)Plotofthemarginaleffectsofnighttimeminimumtemperaturebycountry-levelgrossnationalincome(GNI).Theeffectoftemperatureonsleeplossissubstantiallylargerforpeopleresidingwithinlower-middle-incomecountries(n=995adults;n=14,639observations)comparedwithupper-middle-(n=5,910adults;n=274,488observations)andhigh-incomecountries(n=38,675adults;n=4,116,044observations).(D)Themarginaleffectsofnighttimeminimumtemperaturebyseasonoftheyearonsleeploss.Temperatureincreasesareassociatedwiththegreatestsleeplossesduringsummernights,followedbyfall,spring,andwinternights.(E)Marginaleffectsofa1Cincreasebyaverageminimumtemperaturedecileoverthe2015–2017period,fromcoldest(darkblue)towarmest(red)locations.Temperatureincreasesexertlargerimpactsinwarmerregionscomparedwithcolderregions.Errorbarsrepresent95%confidenceintervals.p<0.001,p<0.01,p<0.05,andp<0.1.llArticleOneEarth5,534–549,May20,2022539marginallymoresleeplossneartheendofsummer,whenwarmertemperaturesarerelativelylessnovel(Experimentalpro-cedures;TableS38).Second,afteragiventemperatureexpo-sure,peoplemayphysiologicallyadaptorotherwiseshiftwhentheygetsleepviaintertemporalsubstitutionacrossdays.Forinstance,short-termreductionsinsleepduetotemperaturemayinturnincreasehomeostaticsleeppressurethatfacilitatessubsequentrecoveryofinitialsleeploss.56Alternatively,previ-ousdays’thermalconditionsmayfurtherdisruptsleepviade-layedimpactsnotcapturedbyourcontemporaneouseffectes-timates.Toaccountforthis,weestimateadistributedlagmodelthatincludeslaggedminimumtemperaturetermsfromtheprevi-ous7days.Wefindthatanincreaseinnighttimetemperatureproducesadditionaldelayedsleeploss:thesumofthecontem-poraneousandlaggedcoefficientsis$30%largerthanthecontemporaneouseffectoftemperaturealone(TableS39).Coef-ficientsremainnegativethroughthe5thlag,withcumulativesleeplossgrowingupuntilasmallpartialreboundondays6and7.Theseresultspersistwhenincludinglagsforallweathervariablesorincludingtemperaturelagsforeachofthepreceding14days(TablesS39andS40),indicatingthatariseinambienttemperatureyieldscumulativelylargernetsleeplossratherthandelayedsleepsubstitution.AnnualindividualsleeplossandshortsleepprojectionsFinally,abidingbytheassumptionthatfuturesleeplosswillrespondtoprojectedchangesinnighttimeminimumtempera-tureastheyhaverespondedtothemintherecentpast,weconstructprojectionsfortheimpactofambientwarmingoncu-mulativeannualindividualsleeplossandtemperature-attributedshortsleepforallcountrieswithinourdataset(Figure1B).Consistentwiththeclimateimpactsliterature,wedrawupongriddeddatafrom21globalclimatemodelsrununderbothend-of-centurystabilization(RepresentativeConcentrationPathway4.5[RCP4.5])andincreasing(RCP8.5)atmosphericgreenhousegasconcentrationscenariosandlinkdownscaled,nighttimetemperatureprojectionswithoursplineregressionmodeltocomputetheper-personaverageannualexcesssleeplossexpectedatthebeginning,middle,andendofthecentury(Figures4Aand4B;Experimentalprocedures).Takingaworld-population-weightedaverageacrossallgrid-cell-leveldailytimeseriesandeachofthe21climatemodels,weestimatethatannualindividualexcesssleeplossduetosuboptimalnight-timetemperaturewaslikelyconsiderablenearthebeginningofthe21stcentury,withtemperatureserodinganestimated44excesshoursofsleepperpersonannuallyonaverage(Figure4A)andcontributingapproximately11additionalnightsofshortsleepperpersonannually,basedondownscaledclimatesimu-lationdatafor2010(Figure4B).Totalannualsleeplossduetowarmingnighttimetemperaturesmaysteadilyincreasebymid-century,withyearlylossesbecomingmarkedlylargerby2099underanincreasinggreenhousegas(GHG)scenariobutonlymoderatelylargerunderascenarioinwhichatmosphericGHGconcentrationsstabilizebytheendofthecentury(Figure4A).Meanprojectedtemperature-attributedindividualexcesssleeplossin2099variesfrom$50(range:46.7–53.6)hperyearinastabilizedGHGconcentrationscenario(RCP4.5)to$58(range:52.7–65.2)hinanincreasingGHGconcentrationscenario(RCP8.5).Sleeperosionisprojectedtoexactgrowingsocietalsleepimpacts,withthenumberoftemperature-attributedshortnightsofsleepestimatedtoincreasefrom$11perpersonperyearin2010to$12shortnightsperyearby2050underaninter-mediateRCP4.5scenario.Bytheendofthecentury,nighttimetemperaturesmaycontributeto$13(range:11.9–13.8)shortYearProjectedAnnualTemperature-AttributedExcessNightsofShortSleep(#of<7hr.NightsperPerson,perYear)RCP4.5RCP8.5C20102050209910.011.012.013.014.015.016.017.0ProjectedAnnualIndividualTemperature-AttributedExcessSleepLoss(HoursperPersonperYear)201020502099YearRCP4.5RCP8.54550556065ABFigure4.Projectedexcesssleeplossbyclimate-changescenario(A)Globalpopulation-weightedaverageindividual-levelprojectionsfortheimpactofelevatednighttimetemperaturesonhoursofsleeplossunderamidcenturystabilizedatmosphericGHGconcentrationscenario(RCP4.5inpurple)andanincreasingGHGconcentrationclimate-changescenario(RCP8.5inorange).Eachlinerepresentstheestimatedannualtotalper-personexcesssleeplossduetosuboptimalambienttemperatureforadifferentdownscaledclimatemodelprojection,averagedacrossallcountry-levelpixelswithinthedataset.Thedarkcoloredlinesplotthescenario-specificensemblemeanprojectedlossacross21statisticallydownscaledglobalCMIP5climatemodels.Sleeplossincreasesovertimeduetoprojectedwarmingacrossallcountries.(B)Meanindividualprojectionsofthecumulativeannualcountofshort(<7h)sleepnightsperpersonduetonighttimeambienttemperaturein2010,2050,and2099.Raincloudplotsdepictthedistributionsofprojectedannualsleepimpactsacross21bias-correctedandstatisticallydownscaledCMIP5climatemodelsunderRCP4.5(purple)andRCP8.5(orange)warmingscenarios.VerticalmarksbeneatheachdistributiondepictCMIP5climate-model-specificprojectiones-timates,withthemedianmodelprojectionsshownasdarkenedmarks.llArticle540OneEarth5,534–549,May20,2022nightsofsleepperpersonperyearunderthestabilizedRCP4.5pathwayandover$15(range:13.6–17.0)shortnightsofsleepperyearundertheincreasingGHGconcentration(RCP8.5)pathway.Thesegloballyaveraged,population-weightedestimatesmaskconsiderablespatialheterogeneityinimpacts,withpro-jectedgeographicinequalitiesintemperature-drivensleeploss(Figures5A–5D)expectedtoincreaseovertime.Withoutfurtheradaptationbytheendofthecentury,residentsinthewarmestareasareprojectedtoexperienceover23hofadditionaltemper-ature-drivensleeplossperyearby2099underahighGHGcon-centrationscenarioand8.5hofadditionalsleeplossunderanin-termediatestabilizationscenario(Figures5A–5DandS6),netofexistingtemperature-attributedexcesssleeplossapparentin2010(Figure4;Experimentalprocedures).Similarly,futurewarmingisprojectedtounequallyincreasetemperature-drivenshortsleep.Disparitiesinestimatednetsleeperosionincreasebothovertimeandacrossspacebetweenwarmerandcolderre-gionsunderallscenarios(Figures5E–5H),butdifferentialim-pactsareprojectedtobemoremodestunderanincreasinglyplausiblescenarioinwhichatmosphericGHGconcentrationsstabilizebytheendofthecentury(RCP4.5).Bytheendofthe21stcentury,adultsinthewarmestregionsareexpectedtoexperienceapproximately3additionalnightsofshortsleepperyearduetorisingnighttimetemperaturesunderthemoremod-erate(RCP4.5)scenariocomparedwithupwardsof7additionalnightsofshortsleepundera‘‘nopolicy’’increasingGHGcon-centration(RCP8.5)scenario.Critically,theseprojectedchangesarenetofestimatedtemperature-attributedsleepim-pactsatthebeginningofthe21stcentury(Figure4),andourre-sultsindicatethatsuboptimal,warmerambienttemperatureslikelyalreadycontributetoinsufficientsleepglobally(Figure2D).Importantly,ourhistoricalestimatesunderlyingtheseprojec-tionsmayalsobeconservative,sincethemajorityofdataarisefromhigh-incomecountriesandareskewedtowardamiddle-aged,maledemographic(Experimentalprocedures).Indeed,oursubgroupanalysesindicatethatfuturesleeplossmaybelargerbyafactorof$3forlower-incomecountries,afactorof$2fordemographicallyolderpopulationsandmarginallyhigherforwomen(Figure3).Moreover,thecumulativeimpactoflaggedtemperatureeffectslikelyexceedsthecontemporaneousesti-matesusedintheseprojections(Results;TablesS39–S41).Futureplanetary-scaleresearchisneededthatsystematicallyin-vestigatestheimpactofrisingtemperaturesandotherclimatehazardsonthesleepoutcomesofvulnerablepopulations,particularlythoseresidinginlow-incomecountriesandcommunities.DISCUSSIONInsummary,weprovideextensiveevidencethathumansleepissensitivetonighttimeambienttemperature,posinganadditionalclimate-change-relatedthreattoglobalpublichealthandhumanwellbeing.Increasesinnighttimeminimumtemperaturereducesleepdurationandincreasetheprobabilityofobtaininginsuffi-cientsleepviatheconstrictionofthehumansleepperiod,pri-marilybydelayingwhenpeoplefallasleep.Theeffectofnight-timetemperatureonsleeplossisamplifiedforlower-incomecountries,olderadults,andfemales.Ourresultssuggestthattemperature-drivensleeplossisevidentacrossdemographics,andincreasingtemperaturesleadtosomewithin-personsleeplossacrossallseasons,withthelargestlossesduringthewarm-estmonthsandonnightswhenminimumtemperaturesexceed10C.Wedonotfindevidenceofshort-termacclimatizationofsleeptowarmertemperaturesviaintra-day,inter-day,orintra-annualsubstitution,andthemarginaleffectofincreasingtem-peratureisevenlargerforthosealreadylivingingloballywarmerregionscomparedwiththoseresidingincolderareas.Takentogether,wefindlimitedevidenceofhumansleepadaptationtohottertemperatures.Weestimatethatsuboptimalnighttimetemperatureslikelyalreadyinflictconsiderableindividualsleeplossearlyinthe21stcentury,andthus,increasingnighttimetem-peraturesmayfurthererodehumansleepintothefuture.Theburdenoffuturewarmingwillnotbeevenlydistributed,barringfurtheradaptationandmitigation,withpeoplelivinginhottercli-matesexpectedtoloseconsiderablymorehoursofsleepperyearby2099,contributingtosocietalimpactsthatscalewiththeleveloffutureatmosphericGHGconcentrations.Takentogether,ourresultsdemonstratethattemperature-drivensleeplosslikelyhasandmaycontinuetoexacerbateglobalenviron-mentalinequalities.Ourresultscarrysignificantimplicationsforadaptationplan-ning,policy,andresearch.Growingevidencefaultsincreasesintemperaturewithsocietalimpactstopublichealth,behavior,andmentalwellbeing,althoughthecausalmechanismshavere-mainedpoorlycharacterized.1,4,7,9,10,45,57–64Insufficientsleepincreasestheriskofmanyofthesamenegativephysiological,behavioral,social,andeconomicoutcomesshowntoincreasewithhightemperatures.5–8,13,53,65–73Thus,sleepmayactasakeybiobehavioralmechanismbetweenambienttemperatureandadversehumanoutcomes,withimplicationsforhumanper-formanceandproductivityaswellasphysicalandmentalhealth.13,15,18–21,23–25Forinstance,byelevatingtheprobabilityofshortsleep,highambienttemperaturesmaypredisposesus-ceptiblesegmentsofsocietytoworsenedaffect,23,74angerandaggression,23,24hypertensionandadversecardiovascularout-comes,20–22diminishedcognitiveperformance,15,16elevatedriskofaccidentsandinjuries,25andcompromisedimmunesys-temfunctioning.19Whilefurtherresearchshouldseektoclarifythishypothesis,addressingthenocturnalimpactofrisingambienttemperaturesonhumansleepmaybeanefficientearlyinterventiontoreducedownstreamadversebehavioralanddevelopmentalimpactslinkedtoinsufficientsleep.Throughtheuseofconsistentlymeasuredsleeprecordsregisteredbysleep-trackingwristbands,ourfindingsindicatethatelevatedtemperaturesdrivesleeplossprimarilybydelayingwhenpeoplefallasleep,providingaspecifictargetforfutureadaptiveinter-ventionsthatseektoattenuatetheimpactofnighttimeheat.Interestingly,acorollarytoourresultsisthatambientcoolinginterventionsmaybeabletopromotesleepgain(Figure2A).Althoughaccesstoairconditioningmaypartiallybuffertheeffectofhighambienttemperatures(Figure3C),thesesameadaptivetechnologiescanpotentiallyexacerbatetheunequalburdensofbothglobalandlocalwarming,throughincreasedGHGemis-sionsandambientheatdisplacement.31,58,75,76Moreover,continuedurbanizationisexpectedtofurtheramplifyambientheatexposure.77,78Heat-resilientplanning,environmentaldesign,andbiopsychosocialinterventionsmaybeneededtollArticleOneEarth5,534–549,May20,2022541ProjectedAnnualTemperature-AttributedNetIncreaseinShortNightsofSleepAbove2010Baseline(#ofAdditional<7hr.NightsperPerson,perYear)0.00.51.01.52.02.53.03.54.04.55.05.56.06.57.0b2050RCP4.5IndividualSleepLossProjection2099RCP4.52050RCP8.52099RCP8.5ProjectedAnnualTemperature-AttributedNetIncreaseinSleepLossAbove2010Baseline(#ofAdditionalHoursLostperPerson,perYear)0246810121416182022242050RCP4.52099RCP4.52050RCP8.52099RCP8.5IndividualShortSleepProjectionABCDEFGHFigure5.Projectednetsleepchangefromfuturewarming(A–D)Worldmapsprojectingannualindividualtemperature-attributednetsleeplossby2050and2099(netof2010temperature-drivensleeploss)underin-termediate(RCP4.5,left)andhighGHGconcentration(RCP8.5,right)scenarios.Eachcoloredgridcellrepresentstheadditionalper-personannualsleeplossprojectedforthecorresponding25325kmareausingtheensembleaverageof21NASAbias-correctedandstatisticallydownscaledCMIP5models.Darkerpurplecolorsrepresentareaswiththelowestprojectedannualnetsleeplossesfromthe2010baseline,whilelighteryellowcolorssignalareaswiththelargestannualsleepreductions.Projectionsareonlyshownforcountriesinthedataset;othercountriesshowningray.Geographicinequalityinthemagnitudeofclimate-change-drivensleeplossisevidentalreadyby2050andbecomesmorepronouncedbytheendofthecentury,withglobalinequalitiesscalingwiththeleveloffutureemissions.(E–H)Globalimpactmapsprojectingtheindividualexcesscountoftemperature-attributednightsofshortsleepby2050and2099(netof2010temperature-attributedsleeploss)underamidcenturystabilizedGHGconcentrationscenario(RCP4.5,left)andunmitigatedincreasingGHGconcentrationscenario(RCP8.5,right).Gridcellsdepicttheadditionalannualnumberofshort(<7h)sleepnightsperpersonforthespecified25325kmareaabovethe2010baseline.Browncolorsindicateareaswithrelativelylowerimpactsoninsufficientsleep,orangecolorsdepictareaswithmoderateimpacts,andredcolorsrepresentregionswithmoresevereimpacts.Planetary-scalesocietalsleepimpactsduetoambienttemperatureaccrueunevenlyacrossregionsandovertime,withhigherGHGconcentrationsleadingtomorepervasivesevereimpacts.llArticle542OneEarth5,534–549,May20,2022equitablyprotecttheworld’surbanpopulationcentersandvulnerablecommunitiesfromdifferentialexposuretomagnifiednighttimetemperatures.59,79–81Severalconsiderationsshouldbetakenintoaccountwhenin-terpretingourresults.First,globalaccessandadoptionofwear-abledevicesisnotgeographicallyordemographicallyuniform.Ourdatasetcontainsmorepeoplewhoaremiddle-aged,male,andfromhigh-andupper-middle-incomecountries(Figure1B;Experimentalprocedures).Giventhatnighttimetemperatureeffectsarelargerforfemales,theelderly,andlower-middle-in-comecountriesinoursample,themagnitudeofourprimaryeffectestimatesandprojectionsislikelyconservative.Sleep-trackingwristbandownershipmayalsobeassociatedwithun-observeddemographicfactors,includinghighersocioeconomicstatus,physiologicalresilience,andaccesstocoolingtechnolo-gies,possiblyreducingtheaccuracyofourestimates—espe-ciallyinlower-middle-incomecountries.76Second,thedeconvolutionprocessusedinouranalyseslikelymechanicallybiasesoureffectestimatestowardzero.82Never-theless,weobserveconsistentambient-temperatureeffectsonsleep—evenforpeoplelivinginindustrializedsocietiesandhigh-incomecountrieswithplausibleaccesstoairconditioning(Figure3C).Moreover,station-basedmeasuresofambienttem-peraturemaydifferfromactualtemperatureexposureswherepeoplelive,likelyattenuatingthemagnitudeofourempir-icalestimatesoftherelationshipbetweentemperatureandsleep.35,39,83Assuch,resultsfromourecologicalstudyreflectthetotaleffectofambientoutdoortemperatureonhumansleepdurationandtiming,includingallsleep-adjacentbehavioralef-fects.Forinstance,temperature-alteredphysicalactivities—previouslyshowntobesensitivetoambientthermalcondi-tions55,84–87—maysubsequentlyimpacthumansleep.Indeed,inanalternativemodelspecificationwherewesimultaneouslyincludemaximumandminimumtemperatureasexplanatoryvar-iables,wefindthatdaytimemaximumtemperaturesmayresultingreatersleeploss(TableS45).However,weinterpretthisexploratoryresultcautiouslysincethespecificationrisksintro-ducingmulticollinearityduetoserialcorrelationbetweendailyminimumandmaximumtemperaturevalues.Futuremulti-coun-trystudieswithpairedperson-levelphysicalactivityoutcomesareneededtoassesswhetheralteredphysicalactivitymaybeimplicatedinthecausalpathwaylinkingtemperatureandsleepoutcomes,includingthedelayinsleeponsetthatweidentify.Third,thecurrentstudyprimarilymeasureschangesinsleepdurationandtiming,whichdoesnotconveyhowtheobserveddeclineinsleepdurationimpactsunderlyingsleepphysiology.Controlledexperimentswithhumansubjectshaveshownthatrapideyemovement(REM)andnon-REM(NREM)sleepdecreasewhenpeopleareexposedtohighenvironmentaltem-peratures.37Yetitremainsunclearhowambienttemperaturemodulateshumansleeparchitectureandotherneurobehavioralcorrelatesofrestorativesleepinreal-worldsettingsglobally.34Ifpeopleresponddifferentlyoutsideofthesleeplaboratory,forinstance,viaadaptiveimprovementstosleepquality,thentheconsequencesofthesleeplossweidentifymaybepartiallyoffset.Inaninitialexploratoryanalysis(mirroringouranalyticalapproachoutlinedinEquation1),weinvestigatetheinfluenceofambienttemperatureonsleepinterruption—theprobabilitythatanindividualwakesuponeormoretimesduringthenight-timesleepperiod.Wedonotfindevidencethatanincreaseinambienttemperaturesignificantlyreducesorotherwisealtersregisterednighttimeawakening(TableS51),suggestingthattemperature-drivenreductionsinsleepquantitymaynotbecompensatedforwithimprovementsinsleepquality.However,similartowristactigraphy,accelerometer-basedactivity-trackingwristbandsmayunderestimatenighttimeawakenings,suggestingthatthesleepimpactestimatesinthisstudymaybeconservative.Futureinsituresearchshouldfurtherinvesti-gatewhethersleepfragmentationisalsosensitivetoambientweatherconditions.Moreover,globalresearchisneededtoun-derstandtheimpactofambienttemperatureonsleepdisor-ders12andcopingbehaviors.88Fourth,althoughoursampleincludesdatafrom68countriesspanningallpopulatedcontinents,ithassparsecoverageforlargepartsofAfrica,CentralAmerica,SouthAmerica,andtheMiddleEast—regionsthatalreadyrankamongthewarmestintheworld(Figure5).Climateprojectionsindicatethatmanyofthecountrieswithintheseregionswillbedisproportionatelyexposedtosomeofthehighestambienttemperaturesandmostcoolingdegreedays,warrantingfuturestudy.75Lastly,eventhoughweshowthatrisingtemperaturesexertlargerimpactsinwarmerregionsanddonotfindevidenceofshort-termacclimatization,itispossiblethatpeoplemayadapttowarmernighttimetemperaturesinthefuturethroughtechno-logicalorenvironmentaldevelopmentsnotcapturedbyourhis-toricalestimates,whichlikelyalreadyreflectconsiderableadap-tation(Figure3C).89,90Tothisend,futureresearchisneededtoinvestigateequitablepolicy,planning,anddesigninnovationsthatalleviatethestressofelevatednighttimetemperaturesandpromoteresilientslumberonanindividual,societal,andplane-taryscale.EXPERIMENTALPROCEDURESResourceavailabilityLeadcontactFurtherinformationandrequestsforresourcesshouldbedirectedtoleadauthor,KeltonMinor(kmi@samf.ku.dk).MaterialsavailabilityNonewmaterialsweregeneratedinthisstudy.DataandcodeavailabilityMeteorologicaldataarepubliclyavailablefromhttps://www.ncdc.noaa.gov/ghcn-daily-descriptionandhttps://psl.noaa.gov/data/gridded/data.ncep.reanalysis2.html.Globalpopulationdataareavailableonlinefromhttps://sedac.ciesin.columbia.edu/data/set/gpw-v4-population-count-rev11.Globalclimatesleepprojectiondata,analysiscode,andderivedmodeldatathatsup-portthefindingsofthisstudyhavebeendepositedatHarvardDataverseundertheDOI[https://doi.org/10.7910/DVN/5G5KX6]andarepubliclyavailableasofthedateofpublication.Rawdataarenotpubliclyavailabletopreservethepri-vacyofparticipants.Interestedresearchersmaycontactthecorrespondingauthorsaboutadditionalanalyses.DatadescriptionNostatisticalmethodswereusedtopredeterminesamplesize,consistentwithrecentlarge-scalebehavioralstudiesemployingdigitaltracedata.91Data-streamsfrommobileactivity-trackingdevicesholdpotentialutilityforassess-ingthehumanimpactsofglobalenvironmentalchanges,witharecentsystem-aticreviewspecificallyhighlightingtheneedforlarge-scalesleepstudiesthatusewearabledevicestoregisterconsistent,objectivemeasuresofsleepinsituacrossavarietyofambientconditionsandclimatologicalsettings.92,93Forourperson-levelanalysis,weincludesleepentriescollectedovera2-yearperiodfromSeptember2015throughOctober2017from47,628anonymousadultsllArticleOneEarth5,534–549,May20,2022543whoelectronicallyconsentedfortheirdatatobeprocessedforresearchpur-poses.AlldataanalyseswerecarriedoutinaccordancewiththeEU’sGeneralDataProtectionRegulation2016/679(GDPR)andtheregulationssetoutbytheDanishDataProtectionAgency.Toourknowledge,thisisthelargestsam-pleofmobilesleep-tracking-deviceusersyetemployedtostudytherelation-shipbetweenmeteorologicalfactorsandhumansleep.Toinvestigatewhethermeteorologicalvariablesinfluenceseveralsleepparametersofinterest,weregisterthefollowingforeachsubjectinourdataset:theonsettimewhenthesleepperiodcommences(sleeponset),themidpointoftheregisteredsleepperiod(midsleep),thedetectedtimewhenthesleepperiodends(sleepoffset),andthetotalsleeptimeregisteredduringagivennight(sleepduration).Self-reportedage,sex,height,andweightdatawereregisteredviaasinglecross-sectionalreportattheonsetofparticipationandwereaggregatedintoagegroup,sex,andWorldHealthOrganization(WHO)BMIcategoriesduringapreprocessingstage.Weaggregated10.67billionsleep-stateobserva-tions—measuredin1-minepochs—into7.41millionsleeprecords.Geolocal-izedsleepobservationswerelinkedwithnightlymeteorologicaldatafromtwosources.Foreachnighttimesleepobservation,wecomputetheinversedis-tance-weightedaverageofnearbystation-levelrecordsofminimumtempera-ture,maximumtemperature,diurnaltemperaturerange,andprecipitationdatawithina100-kmradius,usingstationmeasurementsfromtheNationalCentersforEnvironmentalInformationGlobalHistoricalClimatologyNetwork-Daily(GHCND)dataset.Inaddition,welinkeachobservationtogriddedwindspeed,dailycloudcover,andrelativehumiditydatafromtheNationalCentersforEnvironmentalPrediction(NCEP)Reanalysis2project.94,95InclusioncriteriaWeadoptinclusioncriteriaforminandmaxallowablesleepdurationusedinpriorglobalobservationalsleepstudies(4h<sleepduration<12h).96Tostudytheeffectofnighttimeambienttemperatureonconcurrentsleepattainmentduringthenocturnalperiod,wefurtherfiltersleepentriesbasedonlocaltiming(19:00<sleeponsettime<08:00and00:00<sleepoffsettime<15:00).Ourprimaryresultsarerobusttousingalternativesleeptimingfiltersusedintheliteratureinsteadofthesewidercriteria(TableS31).96,97Sincepeoplemaycompensateforinsufficientsleepatnightwithdaytimenapsshorterthan4h,weconfirmthatourprimaryresultsarerobusttousing24-hsleepattainmentinstead(TableS8).Toensuresufficienttemporalcoverage,werequireeachpersontohaveaminimumof4weeks(28nights)withsleepentriesandentriesonatleast25%ofnightsspanningtheperiodfromfirsttolastuse.Ourresultsarerobusttoalternativetemporalinclusioncriteria,includingconstrainingouranalysistoonlythosewithgreaterthan56,84,and112totalnightswithsleepentries(TableS33).Furthermore,ourresultspersistwhenconstrainingoursampletothosewithregularwristbanduseon50%,75%,and85%ofnightsfromtheirdateoffirstuse(TableS32).SleepmeasurementThedatawereregisteredbySWR30andSWR12waterproofsleep-trackingwristbandsthatutilizeaninternalaccelerometertodetectmovementandmea-suresleepandwakestatesin1-minepochs.Thewristbandshavebeeninter-nallyvalidatedattemperaturesexceedingthoseobservedinthepresentstudyandhavealistedoperatingtemperaturerangeofÀ20C–60C,wellbeyondthedistributionofambienttemperaturesencounteredinthisstudy.Thesleep-andwake-stateestimatesproducedbythesesleep-trackingwristbandshavebeenfoundtoaccuratelyalignwithindependent,contemporaneousmeasure-mentsofmobile-deviceinactivityandactivity,abehavioralproxyforwakeful-ness.98Further,theexternalvalidityofsleepestimatesproducedbythesede-viceshasbeenassessedbycomparingthenationalanddemographicsleepestimatesgeneratedbytheaccelerometer-basedwristbandstoresultsfromasuiteofpreviouslypublishedsleepstudies.99Theresultingglobaldatasetre-producesestablishedsocio-temporal,demographic,andgeographicsleeptrends.Distinctweekend-weekdaydifferencesinsleepdurationareindicativeofcharacteristicworkandsocialschedulesthatconstrainhumansleep,withreducedsleeponweekdaysandsleeprecoveryonweekends(Figure1C;TableS2).Forthissampleofwristbandusers,themedianindividualaveragenighttimesleepdurationwas7.1h.Agreaterpercentageofolderadults(43.6%)regularlysleptlessthan7hanightcomparedwithyoungadults(32.7%),andmiddle-agedadultshadshorteraveragesleepdurationduringtheworkingweekcomparedwithbothyoungerandolderadults,consistentwiththeliterature(TablesS1andS2).100PreviousresearchalsosuggeststhataveragesleepdurationinEastAsiancountriesismoderatelylowerthaninWesterncountries.96,101,102Ourwearabledatasetreplicatestheseregionaldifferences.99Forinstance,adultsinJapansleeplessonbothweekdaysandweekendscomparedwithadultsfromfourdifferentEuropeancountries,acrossalladultageranges(TableS2).SamplecharacteristicsOursampleconsistsofpeoplewhoself-selectedintosleep-trackingwristbanduseandthusdiffersfrombackgroundpopulationsinbothobservableandun-observableways.Weobservethatoursampleconsistsofagreaterproportionofmales($69%)thanfemales($31%).Further,participantsinthedatasetresidedentirelywithinhigh-andmiddle-incomecountries.Approximately80%ofincludeduserswerefrom42differenthigh-incomecountriesand$20%werefrom26middle-incomecountries,with$2%fromninelower-mid-dle-incomecountries.Thesampleconsistsprimarilyofmiddle-agedadults(25–65years;$91%),withfeweryoungadults(19–25years;6%)andolderadults(65+years;3%).Theage-standardizedBMIvaluesfromthetopfivecountrieswiththemostusersinourdataset(Japan,Germany,UnitedKingdom,Sweden,andSpain)fallwithinorneartheWHOpopulationestimaterangesforthesecountries(TableS4).Ofnote,theage-standardizedBMIforbothmenandwomenfromJapanwasslightlyhigherthantheWHOrange.Wedonotfindevidenceforheterogeneityintheeffectofnighttimetempera-tureonsleepdurationacrossBMIcategoriesinourdataset(FigureS5).ModelsOurprimaryrelationshipofinterestistheeffectofdailynighttimeminimumtemperatureonwithin-personsleepoutcomes.Person-levelmultivariateflexiblefixedeffectspanelregressionYiktm=fðTMINiktmÞ+TMIN:NORM1981to2010iktm+Zh+ai+mt+nkm+εiktm(Equation1)Inthismultivariate,fixed-effectspanelmodel,iindexesindividuals,kin-dexesfirst-leveladministrativedivision(e.g.,states),tindexesuniquedateofstudy,andmindexesuniquecalendarmonths.OurdependentvariableYiktmrepresentsthesleepduration(inminutes)ofindividualiinagivenfirstadministrativeregionkondatetandcalendarmonthm.Thus,Yiktmsequen-tiallyrepresentssleepduration(inminutes)(Figure1A),sleeponset(Figure1E),midsleep(Figure1C),offset(Figure1B),andanindicatorforshortsleep(usingseveralstandardthresholddefinitions)(Figure1D;TablesS9–S11).14Ourinde-pendentvariableofinterestisminimumnighttimetemperature,TMINiktm.Wealsocontrolforlocalseasonalitythroughtheinclusionof1981–2010days-of-yearaveragesofminimumtemperaturefrom1981to2010,TMIN:NORM1981to2010iktmcomputedforeachlocation-night.Further,wecontrolfordailyprecipitation,diurnaltemperaturerange(TMAXiktmÀTMINiktm),percentagecloudcover,relativehumidity,andaveragewindspeed,representedviaZh,asfailuretodosomaybiasourestimatesoftheeffectofnighttimeminimumtemperatureonoursleepoutcomemeasure.44InEqua-tion1,weconvertcontinuousmeteorologicalvariablesintoindicatorvariablesforeach5Cminimumtemperaturebin(e.g.,fðTMINiktmÞ),5Cdiurnaltemper-aturerangebin,841-cmprecipitationbin,5-m/swindspeedbin,and20per-centagepointbinofcloudcoverandrelativehumidity.Thisenablesustoflex-iblyestimateanonlinearrelationshipbetweeneachofourmeteorologicalvariablesandsleepoutcomes(Figures2AandS1).55Weomitthe5C–10Cminimumtemperature,5C–10Cdiurnaltemperaturerange,0-cmprecipita-tion,0-to5-m/swindspeed,0%cloudcover,and60%–80%humiditybinsasreferencecategories.Finally,wealsoincludeclimatenormalswithinZhforeachofourmeteorologicalcontrolvariables,computedastheday-of-yearaveragevaluefrom1981to2010foragivenlocation-dateusinginversedistance-weightedweatherstationvaluesandextractedgriddedreanalysistimeseries.Weinterpretourestimatesastheaveragewithin-individualchangeinsleepoutcomesataparticulartemperaturebinrelativetothesebaselines.Unobservableperson-specific,location-specific,ortemporalfactorsmayinfluencesleepoutcomes.Toensurethattheseindividual-specificfactorsllArticle544OneEarth5,534–549,May20,2022donotbiasourestimatesoftheeffectofweatheronsleep,weincludeai—representinguser-levelindicatorvariables—inEquation1.Thesevariablescontrolforallstableunobservedcharacteristicsforeachpersonandsleep-trackingwristband.44Further,theremaybeunobserveddailydevelopmentsorregion-specificseasonalchanges—suchasdaylight—orseculartrendsinfluencingsleepingoutcomesthatmightspuriouslycorrelatewiththeweather.Inordertocontrolforthesepotentialconfounders,weincludemtandnkminEquation1,representingdateofstudy(e.g.,‘‘2015-11-11’’and‘‘2016-11-11’’)andfirstadmin-by-calendarmonthindicatorvariables,respec-tively.Ourprimaryresultsarerobusttoalternativetemporalcontrols,includingreplacingfirstadmin-by-monthwithfirstadmin-by-weekindicatorvariablestocontrolforadministrativeregion-specificweeklychanges(TableS30).Ourempiricalidentifyingassumption,consistentwiththeclimateecono-metricsliterature,44,103isthattheremainingvariationindailyminimumtem-peratureisasgoodasrandomafterconditioningonthesefixedeffects.104TheestimatedmodelcoefficientsfromTMINiktmcanthusbeinterpretedasthecausaleffectofanincreaseinminimumnighttimetemperatureonsleepduration.45,105WeestimateEquation1usingordinaryleastsquaresandadjustforpossiblespatialandserialcorrelationinεiktmbyemployinghetero-skedasticity-robuststandarderrorsclusteredatthefirstadministrativedivi-sionlevel.Weomitnon-climaticcontrolvariablesfromEquation1becauseoftheirpotentialtogeneratebiasinourparametersofinterest.44,106,107Ourresultsareconsistentwhenbinningeachofourclimatecontrolvariablesaswell(TablesS34–S36)andseparatelyremainsignificantwhenclusteringstandarderrorsonbothspatialunits(firstadministrativeregion)andtemporalunits(dateofstudy)(TablesS46–S48).OurflexiblemodelresultsarerobusttosubstitutingtheNationalWeatherService(NWS)HeatIndex108—amea-sureofheatstress—forminimumtemperatureandrelativehumidityinEqua-tion1(FigureS2B;TableS16).Ourprimaryresultspersistwhenaggregatingperson-levelsleepobservationstothefirst-administrative-region-nightlevelwithmeansleepdurationasthedependentvariable(TablesS43andS44).Seesupplementalinformationforadescriptionofadditionalrobustnesschecks.Theglobalweatherdatathatwerelyonforourprimaryhistoricalestimatehaveahigherconcentrationofstationsprovidingtemperatureandprecipita-tionmeasurementsoverNorthAmericaandEurasiathanoverAfricaandpartsofSouthAmerica,resultinginsomeexclusionofusersintothefinalsampleforourprimarymodelandpotentiallylesspreciseambienttemperatureestimatesforlower-middle-incomecountries.Ourresultsarerobusttousinggloballygriddedreanalysisdatainstead,resultinginamoreinclusivesampleandslightlylargersleeplossestimatesacrossthetemperaturedistribution(Fig-ureS2A;TablesS6–S8).94Importantly,theresultingempiricalestimatesfromouranalysesarelikelyconservative.Acombinationofmeasurementerrorandamplificationofnoiseduetothedeconvolutionprocessweuseinouran-alyseslikelyfurtherbiasesourestimatesoftherelationshipbetweentemper-atureandsleepoutcomestowardzero.82,83,109SociodemographicandseasonalsubgroupanalysesYiktm=TMINiktmÃBs+TMINORM1981to2010iktm+Zh+ai+mt+nkm+εiktm(Equation2)Asanalternativetoourprimarybinnedspecification,wealsoestimateamultivariatefixed-effectslinearpanelmodel,wherefðÞisreplacedwithalinearfunction(TableS8).Inordertoinspectthemarginaleffectoftemperaturebysubgroupsonourrelationshipofinterest,wepreservethisspecificationandsequentiallyinteractourcontinuousmeasurefornighttimeminimumtempera-tureTMINiktmwithacategoricalvariableBs,successivelyrepresentingagegroup(Figure3A),sex(Figure3B),WorldBankgrossnationalincome(GNI)category(Figure3C),seasonoftheyear(Figure3D;TableS21),andBMIgroup(FigureS5).Weinterprettheresultingestimatesasthemarginaleffectsofa1Cminimumtemperatureincreaseonsleeplossforeachsub-grouprelativetothecorrespondingreferencecategory(Figures3andS5;TablesS22–S27).Sincedemographiccategoryinformationisnotavailableforsomesubjectsacrossallsubgroupcategories,oursamplesizeinthesere-gressionsvaries.AcclimatizationtestsIandII:Regionalclimateadaptationandintra-annualadaptationToinvestigateregionaladaptation—whetherthoseresidinginregionswithgenerallywarmeraveragenighttimetemperaturesaredifferentiallyresilienttotemperatureshockscomparedwiththoseresidingincolderregions—weemploythissamespecificationwithcontemporaneousnighttimetemperatureinteractedwithdecilesofaveragelocation-specificminimumtemperatureoverthe2015–2017studyperiod(D1,coldesttoD10,warmest)(Figure3E;TableS28).Totestforpossiblemedium-termacclimatizationtowarmernight-timetemperatures,weextractasubsetofthedataconsistingofthefirstandlastsummermonthsforeachlocationandyearofobservation.Thus,forobser-vationsoriginatingfromthenorthernhemisphere(southernhemisphere),June(December)islabeledasthefirstmonthofsummerwhenlocallywarmertem-peraturesarearelativelyneweroccurrence,whileAugust(February)islabeledasthelastmonthofsummerwhenelevatedtemperatureshavebecomemorefamiliar.WeemployasummermonthinteractiontermBsinEquation2whileotherwisekeepingthesamemodelspecification.Theresultingestimaterepre-sentsthemarginaleffectofa1Cminimumtemperatureincreaseonsleepout-comesduringthelastsummermonthcomparedwiththefirst(TableS38).AcclimatizationtestsIIIandIV:Inter-dayadaptationandintra-dayadaptationYiktm=TMINiktm+TMINikðtÀ1Þm+TMIN/ikðtÀnÞm+TNORMiktm+Zh+ai+mt+nkm+εiktm(Equation3)Toinvestigatethelaggedeffectsofnighttimeminimumtemperatureonpo-tentialdelayedsleepdisplacementorrecovery,wespecifyadistributedlagmodelthatincludesbothacontemporaneousandlaggedtemperaturetermsTMINikðtÀxÞmforeachoftheprevious7days(TableS39).Asrobustnesschecks,wealsorunaversionofthisspecificationwithlaggedminimumtem-peraturetermsforeachofthepreceding14daysandaseparatespecificationwithlaggedtermsforallweathervariablesovertheprevious7days(TableS39).Toassesspossibleacuteadaptationviaintra-daysubstitutionofnighttimesleepwithdaytimerest,weestimateanalternativeversionofourprimaryspecificationwherenighttimesleepisreplacedwitha24-hsleepmeasure(TableS8).Alternativetemperaturemeasureflexiblefixed-effectspanelregressionYiktm=fðTMIN:ANOMALY1981to2010iktmÞ+Zh+ai+mt+nkm+εiktm(Equation4)Climatechangeisincreasingthefrequencyandmagnitudeofwarmerthannormalnights.AsanalternativespecificationtoEquation1,wereplacebothfðTMINiktmÞandTMINORM1981to2010iktmwithasingleterm:nighttimetem-peratureanomaliesfðTMIN:ANOMALY1981to2010iktmÞ.Thisnewindepen-dentvariableofinterestrepresentsthenightlyminimumtemperaturedeviationfromthenormalhistoricalaverage(from1981to2010)foreachsubject-night(TableS18).Weinclude1Cflexibletemperatureanomalybinstosemi-para-metricallyestimatetherelationshipbetweennighttimeminimumtemperatureanomaliesandsleepduration.Furthermore,weaddbinnedmeteorologicalcontrols,employingthesamebaselinecategoriesasspecifiedinEquation1.WeomitthetemperatureanomalyreferencerangeofÀ0.5C–0.5Candinter-pretourestimatesastheaveragewithin-individualchangeinsleepdurationwithinaparticularnighttimetemperatureanomalybinrelativetothisbaselinebin(FigureS4;TableS19).Weestimatealinearversionofthisspecificationasafurtherrobustnesscheck(TableS18).SplineregressionmodelsToinvestigatehowclimatechangemayimpacttemperature-drivenhumansleeplossandtheprevalenceofshortsleepin2050and2099,wedrawupondatafrom21CoupledModelIntercomparisonProjectPhase5(CMIP5)models110runseparatelyunderanintermediate‘‘stabilization’’sce-nario(RCP4.5)andincreasingatmosphericGHGconcentrationscenariollArticleOneEarth5,534–549,May20,2022545RCP8.5111andextractNASAEarthExchangeGlobalDailyDownscaledPro-jections(NEX-GDDP)bias-corrected,statisticallydownscaled,nightlytemper-aturetimeseries112foreach25325kmgridcellspanningeachcountryincludedinourglobalsleepdataset.AlthoughRCP8.5isincreasinglyviewedasalessplausibleanthropogenicforcingscenariogivenrecentdecarboniza-tiontrends,113,114weincludeitforthepurposeofmodelingtheriskassociatedwitha‘‘nomitigationpolicy’’counterfactualfuture.Further,largeuncertaintiesintheEarthclimatesystempreventrulingoutlargefuturewarmingifcondi-tionalandunconditionalemissionspledgesarenotimplemented.115,116Climatechangeisprojectedtoextendthenighttimetemperaturedistributionrightwards,resultinginextremeambienttemperaturesthatexceedourhistor-icalobservations.Ratherthanassigningtheseextremetemperaturesthefittedvaluefromthehighesttemperaturebinwithinthehistoricaldistribution,wefitalinearsplinetothedata—withknotsplacedatÀ20Cand10C—andforecastbehavioralestimatesforprojectedtemperaturesfor2050and2099.84Weconstructsplinemodelsforbothindividualsleepdurationandshortsleepprobability(TableS37).ThefunctionalformsyieldedbythesplinemodelscloselymirrortherelationshipsuncoveredbyEquation1.Person-levelannual-temperature-attributedexcesssleepprojectionplotsToplottheprojectedaverageexcesssleeplossattributedtosuboptimalambienttemperature(Figure4A),weapplyoursplineregressionmodeloutputtoextractthe2010,2050,and2099averagedailyminimumtemperaturepre-dictedsleeplossfromall21ofNASA’sNEX-GDDPbias-corrected,statisticallydownscaleddailyclimatemodels.Wesumthedailyprojectedsleeplossandshortsleepforeachgrid-cellandeachmodel,yieldingestimatesofthepro-jectedtotalindividualsleepimpactsforeachgrid-cellandmodelcombination.Wethenaverageacrossallglobalgridcells—weightingcellsbytheirestimated2015humanpopulationcounts(usingGriddedPopulationoftheWorld[GPWv4]data117)—tocomputethepopulation-weightedaverageannualindi-vidualtemperature-drivensleeplossandshortsleepforeachclimatemodel-year(Figures4Aand4B).Weplotthedistributionsofalltemperature-attributedindividualshortsleepprojections,alongwithmodel-specificestimates(Fig-ure4B).Separately,wecomputeandplotcountry-levelprojectedannualsleeploss(perperson)byinsteadaveraginggridcellsforeachcountry,acrossall21downscaledclimatemodels(FigureS6).GridcellannualnetsleepchangeprojectionmapsTomaptheprojectedchangeinglobalsleepimpactsbymid-centuryandendofcenturyunderdifferentanthropogenicforcingscenarios,weseparatelyplottheensemblemeanestimateofannualper-persontemperature-attributedsleeploss(Figures5A–5D)andshortsleep(Figures5E–5H)acrossallmodelsforeachgridcell.Thus,eachcoloredgridcellrepresentstheprojectedaddi-tionalannualindividualsleeploss(Figures5A–5D)orshortsleep(Figures5E–5H)forapersonresidingwithintheareademarcatedbythatgridcell,netofthe2010temperature-attributedexcesssleeplossforthesamegridcell.SUPPLEMENTALINFORMATIONSupplementalinformationcanbefoundonlineathttps://doi.org/10.1016/j.oneear.2022.04.008.ACKNOWLEDGMENTSWethankworkshopparticipantsatthe101stAmericanMeteorologicalSocietyAnnualMeetingforhelpfulcomments.K.M.acknowledgessupportfromTheDanishAgencyforHigherEducationandScienceandTheIndependentResearchFundDenmark(grant9095-00007A).AUTHORCONTRIBUTIONSConceptualization,K.M.,A.B.-N.,S.L.,andN.O.;datastructuring,K.M.,A.B.-N.,andS.S.J.;formalanalysis,K.M.andN.O.;fundingacquisition,S.L.,A.B.-N.,andK.M.;investigation,K.M.andN.O.;methodology,N.O.andK.M.;software,K.M.,N.O.,S.S.J.,andA.B.-N.;visualization,K.M.andN.O.;writing–originaldraft,K.M.;writing–reviewandediting,K.M.,N.O.,andS.L.DECLARATIONOFINTERESTSTheauthorsdeclarenocompetinginterests.Received:October30,2021Revised:March14,2022Accepted:April26,2022Published:May20,2022REFERENCES1.Berry,H.L.,Waite,T.D.,Dear,K.B.G.,Capon,A.G.,andMurray,V.(2018).Thecaseforsystemsthinkingaboutclimatechangeandmentalhealth.Nat.Clim.Change8,282–290.https://doi.org/10.1038/s41558-018-0102-4.2.Manning,C.,andClayton,S.(2018).Threatstomentalhealthandwell-beingassociatedwithclimatechange.InPsychologyandClimateChange,S.ClaytonandC.Manning,eds.(AcademicPress),pp.217–244.3.Clayton,S.,Devine-Wright,P.,Stern,P.C.,Whitmarsh,L.,Carrico,A.,Steg,L.,Swim,J.,andBonnes,M.(2015).Psychologicalresearchandglobalclimatechange.Nat.Clim.Change5,640–646.https://doi.org/10.1038/nclimate2622.4.Evans,G.W.(2019).Projectedbehavioralimpactsofglobalclimatechange.Annu.Rev.Psychol.70,449–474.https://doi.org/10.1146/an-nurev-psych-010418-103023.5.Park,R.J.,Goodman,J.,andBehrer,A.P.(2020).Learningisinhibitedbyheatexposure,bothinternationallyandwithintheUnitedStates.Nat.Hum.Behav.5,19–27.https://doi.org/10.1038/s41562-020-00959-9.6.Burke,M.,Gonza´lez,F.,Baylis,P.,Heft-Neal,S.,Baysan,C.,Basu,S.,andHsiang,S.(2018).HighertemperaturesincreasesuicideratesintheUnitedStatesandMexico.Nat.Clim.Change8,723–729.https://doi.org/10.1038/s41558-018-0222-x.7.Romanello,M.,McGushin,A.,DiNapoli,C.,Drummond,P.,Hughes,N.,Jamart,L.,Kennard,H.,Lampard,P.,SolanoRodriguez,B.,Arnell,N.,etal.(2021).The2021reportoftheLancetCountdownonhealthandclimatechange:coderedforahealthyfuture.Lancet398,1619–1662.https://doi.org/10.1016/S0140-6736(21)01787-6.8.Nori-Sarma,A.,Sun,S.,Sun,Y.,Spangler,K.R.,Oblath,R.,Galea,S.,Gradus,J.L.,andWellenius,G.A.(2022).AssociationbetweenambientheatandriskofemergencydepartmentvisitsformentalhealthamongUSadults,2010to2019.JAMAPsychiatry79,341–349.https://doi.org/10.1001/jamapsychiatry.2021.4369.9.Obradovich,N.,andMinor,K.(2022).Identifyingandpreparingforthementalhealthburdenofclimatechange.JAMAPsychiatry79,285–286.https://doi.org/10.1001/jamapsychiatry.2021.4280.10.Hwong,A.R.,Wang,M.,Khan,H.,Chagwedera,D.N.,Grzenda,A.,Doty,B.,Benton,T.,Alpert,J.,Clarke,D.,andCompton,W.M.(2022).Climatechangeandmentalhealthresearchmethods,gaps,andpriorities:ascopingreview.LancetPlanet.Health6,e281–e291.https://doi.org/10.1016/s2542-5196(22)00012-2.11.Obradovich,N.,Migliorini,R.,Mednick,S.C.,andFowler,J.H.(2017).Nighttimetemperatureandhumansleeplossinachangingclimate.Sci.Adv.3,e1601555.https://doi.org/10.1126/sciadv.1601555.12.Rifkin,D.I.,Long,M.W.,andPerry,M.J.(2018).Climatechangeandsleep:asystematicreviewoftheliteratureandconceptualframework.SleepMed.Rev.42,3–9.https://doi.org/10.1016/j.smrv.2018.07.007.13.Mullins,J.T.,andWhite,C.(2019).Temperatureandmentalhealth:evi-dencefromthespectrumofmentalhealthoutcomes.J.HealthEcon.68,102240.https://doi.org/10.1016/j.jhealeco.2019.102240.14.Hirshkowitz,M.,Whiton,K.,Albert,S.M.,Alessi,C.,Bruni,O.,DonCarlos,L.,Hazen,N.,Herman,J.,Katz,E.S.,Kheirandish-Gozal,L.,etal.(2015).NationalSleepFoundation’ssleeptimedurationrecommendations:methodologyandresultssummary.SleepHealth1,40–43.https://doi.org/10.1016/j.sleh.2014.12.010.llArticle546OneEarth5,534–549,May20,202215.Killgore,W.D.S.(2010).Effectsofsleepdeprivationoncognition.Prog.BrainRes.185,105–129.16.Krause,A.J.,Simon,E.B.,Mander,B.A.,Greer,S.M.,Saletin,J.M.,Goldstein-Piekarski,A.N.,andWalker,M.P.(2017).Thesleep-deprivedhumanbrain.Nat.Rev.Neurosci.18,404–418.https://doi.org/10.1038/nrn.2017.55.17.Hafner,M.,Stepanek,M.,Taylor,J.,Troxel,W.M.,andvanStolk,C.(2016).WhySleepMatters—TheEconomicCostsofInsufficientSleep(RANDCorporation).18.Barnes,C.M.,andWatson,N.F.(2019).Whyhealthysleepisgoodforbusiness.SleepMed.Rev.47,112–118.https://doi.org/10.1016/j.smrv.2019.07.005.19.Irwin,M.R.(2015).Whysleepisimportantforhealth:apsychoneuroim-munologyperspective.Annu.Rev.Psychol.66,143–172.https://doi.org/10.1146/annurev-psych-010213-115205.20.Cappuccio,F.P.,Cooper,D.,D’Elia,L.,Strazzullo,P.,andMiller,M.A.(2011).Sleepdurationpredictscardiovascularoutcomes:asystematicreviewandmeta-analysisofprospectivestudies.Eur.HeartJ.32,1484–1492.https://doi.org/10.1093/eurheartj/ehr007.21.Jackson,C.L.,Redline,S.,andEmmons,K.M.(2015).Sleepasapoten-tialfundamentalcontributortodisparitiesincardiovascularhealth.Annu.Rev.PublicHealth36,417–440.https://doi.org/10.1146/annurev-publ-health-031914-122838.22.Cappuccio,F.P.,D’Elia,L.,Strazzullo,P.,andMiller,M.A.(2010).Sleepdurationandall-causemortality:asystematicreviewandmeta-analysisofprospectivestudies.Sleep33,585–592.https://doi.org/10.1093/sleep/33.5.585.23.Goldstein,A.N.,andWalker,M.P.(2014).Theroleofsleepinemotionalbrainfunction.Annu.Rev.Clin.Psychol.10,679–708.https://doi.org/10.1146/annurev-clinpsy-032813-153716.24.Bernert,R.A.,Kim,J.S.,Iwata,N.G.,andPerlis,M.L.(2015).Sleepdistur-bancesasanevidence-basedsuicideriskfactor.Curr.PsychiatryRep.17,15.https://doi.org/10.1007/s11920-015-0554-4.25.Czeisler,C.A.,Wickwire,E.M.,Barger,L.K.,Dement,W.C.,Gamble,K.,Hartenbaum,N.,Ohayon,M.M.,Pelayo,R.,Phillips,B.,Strohl,K.,etal.(2016).Sleep-deprivedmotorvehicleoperatorsareunfittodrive:amulti-disciplinaryexpertconsensusstatementondrowsydriving.SleepHealth2,94–99.https://doi.org/10.1016/j.sleh.2016.04.003.26.Yoo,S.S.,Hu,P.T.,Gujar,N.,Jolesz,F.A.,andWalker,M.P.(2007).Adeficitintheabilitytoformnewhumanmemorieswithoutsleep.Nat.Neurosci.10,385–392.https://doi.org/10.1038/nn1851.27.Fultz,N.E.,Bonmassar,G.,Setsompop,K.,Stickgold,R.A.,Rosen,B.R.,Polimeni,J.R.,andLewis,L.D.(2019).Coupledelectrophysiological,he-modynamic,andcerebrospinalfluidoscillationsinhumansleep.Science366,628–631.https://doi.org/10.1126/science.aax5440.28.Khubchandani,J.,andPrice,J.H.(2019).ShortsleepdurationinworkingAmericanadults,2010–2018.J.CommunityHealth45,219–227.https://doi.org/10.1007/s10900-019-00731-9.29.Ford,E.S.,Cunningham,T.J.,andCroft,J.B.(2015).Trendsinself-re-portedsleepdurationamongUSadultsfrom1985to2012.Sleep38,829–832.https://doi.org/10.5665/sleep.4684.30.Donat,M.G.,Alexander,L.V.,Yang,H.,Durre,I.,Vose,R.,Dunn,R.J.H.,Willett,K.M.,Aguilar,E.,Brunet,M.,Caesar,J.,etal.(2013).Updatedan-alysesoftemperatureandprecipitationextremeindicessincethebegin-ningofthetwentiethcentury:theHadEX2dataset.J.Geophys.Res.Atmos.118,2098–2118.https://doi.org/10.1002/jgrd.50150.31.Salamanca,F.,Georgescu,M.,Mahalov,A.,Moustaoui,M.,andWang,M.(2014).Anthropogenicheatingoftheurbanenvironmentduetoairconditioning.J.Geophys.Res.Atmos.119,5949–5965.https://doi.org/10.1002/2013jd021225.32.Obradovich,N.,andMigliorini,R.(2018).Sleepandthehumanimpactsofclimatechange.SleepMed.Rev.42,1–2.https://doi.org/10.1016/j.smrv.2018.09.002.33.Schmidt,M.H.(2014).Theenergyallocationfunctionofsleep:aunifyingtheoryofsleep,torpor,andcontinuouswakefulness.Neurosci.BiobehavRev.47,122–153.https://doi.org/10.1016/j.neubiorev.2014.08.001.34.Harding,E.C.,Franks,N.P.,andWisden,W.(2019).Thetemperaturedependenceofsleep.Front.Neurosci.13,336.https://doi.org/10.3389/fnins.2019.00336.35.Yetish,G.,Kaplan,H.,Gurven,M.,Wood,B.,Pontzer,H.,Manger,P.R.,Wilson,C.,McGregor,R.,andSiegel,J.M.(2015).Naturalsleepanditsseasonalvariationsinthreepre-industrialsocieties.Curr.Biol.25,2862–2868.https://doi.org/10.1016/j.cub.2015.09.046.36.Kr€auchi,K.(2007).Thethermophysiologicalcascadeleadingtosleepinitiationinrelationtophaseofentrainment.SleepMed.Rev.11,439–451.https://doi.org/10.1016/j.smrv.2007.07.001.37.Buguet,A.(2007).Sleepunderextremeenvironments:effectsofheatandcoldexposure,altitude,hyperbaricpressureandmicrogravityinspace.J.Neurol.Sci.262,145–152.https://doi.org/10.1016/j.jns.2007.06.040.38.N€ayh€a,S.,Rintam€aki,H.,Donaldson,G.,Hassi,J.,Jousilahti,P.,Laatikainen,T.,Jaakkola,J.J.K.,andIkaheimo,T.M.(2014).Heat-relatedthermalsensation,comfortandsymptomsinanorthernpopulation:theNationalFINRISK2007study.Eur.J.PublicHealth24,620–626.https://doi.org/10.1093/eurpub/ckt159.39.vanLoenhout,J.A.F.,leGrand,A.,Duijm,F.,Greven,F.,Vink,N.M.,Hoek,G.,andZuurbier,M.(2016).Theeffectofhighindoortemperaturesonself-perceivedhealthofelderlypersons.Environ.Res.146,27–34.https://doi.org/10.1016/j.envres.2015.12.012.40.Lauderdale,D.S.,Knutson,K.L.,Yan,L.L.,Liu,K.,andRathouz,P.J.(2008).Self-reportedandmeasuredsleepduration:howsimilararethey?Epidemiology19,838–845.https://doi.org/10.1097/ede.0b013e318187a7b0.41.Miller,C.B.,Gordon,C.J.,Toubia,L.,Bartlett,D.J.,Grunstein,R.R.,D’Rozario,A.L.,andMarshall,N.S.(2015).Agreementbetweensimplequestionsaboutsleepdurationandsleepdiariesinalargeonlinesurvey.SleepHealth1,133–137.https://doi.org/10.1016/j.sleh.2015.02.007.42.Banks,M.A.(2020).Techgiants,armedwithwearablesdata,areen-trenchinginhealthresearch.Nat.Med.26,4–5.https://doi.org/10.1038/s41591-019-0701-2.43.McNeish,D.,andKelley,K.(2019).Fixedeffectsmodelsversusmixedef-fectsmodelsforclustereddata:reviewingtheapproaches,disentanglingthedifferences,andmakingrecommendations.Psychol.Methods24,20–35.https://doi.org/10.1037/met0000182.44.Hsiang,S.(2016).Climateeconometrics.Annu.Rev.Resour.Econ.8,43–75.https://doi.org/10.3386/w22181.45.Carleton,T.A.,andHsiang,S.M.(2016).Socialandeconomicimpactsofclimate.Science353,aad9837.https://doi.org/10.1126/science.aad9837.46.Monsivais,D.,Bhattacharya,K.,Ghosh,A.,Dunbar,R.I.M.,andKaski,K.(2017).Seasonalandgeographicalimpactonhumanrestingperiods.Sci.Rep.7,10717.https://doi.org/10.1038/s41598-017-11125-z.47.Lee,W.,Kim,Y.,Sera,F.,Gasparrini,A.,Park,R.,MichelleChoi,H.,Prifti,K.,Bell,M.L.,Abrutzky,R.,Guo,Y.,etal.(2020).Projectionsofexcessmortalityrelatedtodiurnaltemperaturerangeunderclimatechangesce-narios:amulti-countrymodellingstudy.LancetPlanet.Health4,e512–e521.https://doi.org/10.1016/S2542-5196(20)30222-9.48.Lindvall,J.,andSvensson,G.(2015).ThediurnaltemperaturerangeintheCMIP5models.Clim.Dyn.44,405–421.https://doi.org/10.1007/s00382-014-2144-2.49.Li,J.,Vitiello,M.V.,andGooneratne,N.S.(2018).Sleepinnormalaging.SleepMed.Clin.13,1–11.https://doi.org/10.1016/j.jsmc.2017.09.001.50.Weinreich,G.,Wessendorf,T.E.,Pundt,N.,Weinmayr,G.,Hennig,F.,Moebus,S.,Mohlenkamp,S.,Erbel,R.,Jockel,K.H.,Teschler,H.,andHoffmann,B.(2015).Associationofshort-termozoneandtemperaturewithsleepdisorderedbreathing.Eur.Respir.J.46,1361–1369.https://doi.org/10.1183/13993003.02255-2014.llArticleOneEarth5,534–549,May20,202254751.Baker,F.C.,Waner,J.I.,Vieira,E.F.,Taylor,S.R.,Driver,H.S.,andMitchell,D.(2001).Sleepand24hourbodytemperatures:acomparisoninyoungmen,naturallycyclingwomenandwomentakinghormonalcon-traceptives.J.Physiol.530,565–574.https://doi.org/10.1111/j.1469-7793.2001.0565k.x.52.Sorensen,C.,Murray,V.,Lemery,J.,andBalbus,J.(2018).Climatechangeandwomen’shealth:impactsandpolicydirections.PLoSMed.15,e1002603.https://doi.org/10.1371/journal.pmed.1002603.53.Obradovich,N.,Migliorini,R.,Paulus,M.P.,andRahwan,I.(2018).Empiricalevidenceofmentalhealthrisksposedbyclimatechange.Proc.Natl.Acad.Sci.USA115,10953–10958.https://doi.org/10.1073/pnas.1801528115.54.Carleton,T.A.,Jina,A.,Delgado,M.T.,Greenstone,M.,Houser,T.,Hsiang,S.M.,Hultgren,A.,Kopp,R.E.,McCusker,K.E.,Nath,I.B.,etal.(2020).ValuingtheGlobalMortalityConsequencesofClimateChangeAccountingforAdaptationCostsandBenefits,ReportNo.27599.55.GraffZivin,J.,andNeidell,M.(2014).Temperatureandtheallocationoftime:implicationsforclimatechange.J.LaborEcon.32,1–26.https://doi.org/10.1086/671766.56.Eban-Rothschild,A.,Appelbaum,L.,anddeLecea,L.(2018).Neuronalmechanismsforsleep/wakeregulationandmodulatorydrive.Neuropsychopharmacology43,937–952.https://doi.org/10.1038/npp.2017.294.57.Hajat,S.,O’Connor,M.,andKosatsky,T.(2010).Healtheffectsofhotweather:fromawarenessofriskfactorstoeffectivehealthprotection.Lancet375,856–863.https://doi.org/10.1016/s0140-6736(09)61711-6.58.Patz,J.A.,Frumkin,H.,Holloway,T.,Vimont,D.J.,andHaines,A.(2014).Climatechange.JAMA312,1565–1580.https://doi.org/10.1001/jama.2014.13186.59.Watts,N.,Amann,M.,Arnell,N.,Ayeb-Karlsson,S.,Belesova,K.,Boykoff,M.,Byass,P.,Cai,W.,Campbell-Lendrum,D.,Capstick,S.,etal.(2019).The2019reportoftheLancetCountdownonhealthandclimatechange:ensuringthatthehealthofachildborntodayisnotdefinedbyachangingclimate.Lancet394,1836–1878.https://doi.org/10.1016/S0140-6736(19)32596-6.60.Vergunst,F.,andBerry,H.L.(2021).Climatechangeandchildren’smentalhealth:adevelopmentalperspective.Clin.Psychol.Sci.21677026211040787.https://doi.org/10.1177/21677026211040787.61.Liu,J.,Varghese,B.M.,Hansen,A.,Xiang,J.,Zhang,Y.,Dear,K.,Gourley,M.,Driscoll,T.,Morgan,G.,Capon,A.,andBi,P.(2021).Isthereanassociationbetweenhotweatherandpoormentalhealthoutcomes?Asystematicreviewandmeta-analysis.Environ.Int.153,106533.https://doi.org/10.1016/j.envint.2021.106533.62.Vicedo-Cabrera,A.M.,Scovronick,N.,Sera,F.,Roye´,D.,Schneider,R.,Tobias,A.,Astrom,C.,Guo,Y.,Honda,Y.,Hondula,D.M.,etal.(2021).Theburdenofheat-relatedmortalityattributabletorecenthuman-inducedclimatechange.Nat.Clim.Change11,492–500.https://doi.org/10.1038/s41558-021-01058-x.63.Ebi,K.L.,Vanos,J.,Baldwin,J.W.,Bell,J.E.,Hondula,D.M.,Errett,N.A.,Hayes,K.,Reid,C.E.,Saha,S.,Spector,J.,andBerry,P.(2021).Extremeweatherandclimatechange:populationhealthandhealthsystemimpli-cations.Annu.Rev.PublicHealth42,293–315.https://doi.org/10.1146/annurev-publhealth-012420-105026.64.Middleton,J.,Cunsolo,A.,Jones-Bitton,A.,Wright,C.J.,andHarper,S.L.(2020).Indigenousmentalhealthinachangingclimate:asystematicscopingreviewofthegloballiterature.Environ.Res.Lett.15,053001.https://doi.org/10.1088/1748-9326/ab68a9.65.Baylis,P.,Obradovich,N.,Kryvasheyeu,Y.,Chen,H.,Coviello,L.,Moro,E.,Cebrian,M.,andFowler,J.H.(2018).Weatherimpactsexpressedsentiment.PLoSOne13,e0195750.https://doi.org/10.1371/journal.pone.0195750.66.Parks,R.M.,Bennett,J.E.,Tamura-Wicks,H.,Kontis,V.,Toumi,R.,Danaei,G.,andEzzati,M.(2020).Anomalouslywarmtemperaturesareassociatedwithincreasedinjurydeaths.Nat.Med.26,65–70.https://doi.org/10.1289/isee.2020.virtual.p-0410.67.Zhang,P.,Deschenes,O.,Meng,K.,andZhang,J.(2018).Temperatureeffectsonproductivityandfactorreallocation:evidencefromahalfmillionChinesemanufacturingplants.J.Environ.Econ.Manag.88,1–17.https://doi.org/10.1016/j.jeem.2017.11.001.68.Dasgupta,S.,vanMaanen,N.,Gosling,S.N.,Piontek,F.,Otto,C.,andSchleussner,C.F.(2021).Effectsofclimatechangeoncombinedlabourproductivityandsupply:anempirical,multi-modelstudy.LancetPlanet.Health5,e455–e465.https://doi.org/10.1016/s2542-5196(21)00170-4.69.Park,R.J.,Goodman,J.,Hurwitz,M.,andSmith,J.(2020).Heatandlearning.Am.Econ.J.Econ.Policy12,306–339.https://doi.org/10.1257/pol.20180612.70.Lu,P.,Zhao,Q.,Xia,G.,Xu,R.,Hanna,L.,Jiang,J.,Li,S.,andGuo,Y.(2021).Temporaltrendsoftheassociationbetweenambienttemperatureandcardiovascularmortality:a17-yearcase-crossoverstudy.Environ.Res.Lett.16,045004.https://doi.org/10.1088/1748-9326/abab33.71.Wang,J.,Obradovich,N.,andZheng,S.(2020).A43-million-personinvestigationintoweatherandexpressedsentimentinachangingclimate.OneEarth2,568–577.https://doi.org/10.1016/j.oneear.2020.05.016.72.Baylis,P.(2020).Temperatureandtemperament:evidencefromtwitter.J.PublicEcon.184,104161.https://doi.org/10.1016/j.jpubeco.2020.104161.73.Garg,T.,Jagnani,M.,andTaraz,V.(2020).Temperatureandhumancap-italinIndia.J.Assoc.Environ.Resour.Econ.7,1113–1150.https://doi.org/10.1086/710066.74.Minkel,J.D.,Banks,S.,Htaik,O.,Moreta,M.C.,Jones,C.W.,McGlinchey,E.L.,Simpson,N.S.,andDinges,D.F.(2012).Sleepdepriva-tionandstressors:evidenceforelevatednegativeaffectinresponsetomildstressorswhensleepdeprived.Emotion12,1015–1020.https://doi.org/10.1037/a0026871.75.Biardeau,L.T.,Davis,L.W.,Gertler,P.,andWolfram,C.(2020).Heatexposureandglobalairconditioning.Nat.Sustain.3,25–28.https://doi.org/10.1038/s41893-019-0441-9.76.Davis,L.W.,andGertler,P.J.(2015).Contributionofairconditioningadoptiontofutureenergyuseunderglobalwarming.Proc.Natl.Acad.Sci.USA112,5962–5967.https://doi.org/10.1073/pnas.1423558112.77.Tuholske,C.,Caylor,K.,Funk,C.,Verdin,A.,Sweeney,S.,Grace,K.,Peterson,P.,andEvans,T.(2021).Globalurbanpopulationexposuretoextremeheat.Proc.Natl.Acad.Sci.USA118.e2024792118.https://doi.org/10.1073/pnas.2024792118.78.Wang,J.,Chen,Y.,Liao,W.,He,G.,Tett,S.F.B.,Yan,Z.,Zhai,P.,Feng,J.,Ma,W.,Huang,C.,andHu,Y.(2021).Anthropogenicemissionsandurbanizationincreaseriskofcompoundhotextremesincities.Nat.Clim.Change11,1084–1089.https://doi.org/10.1038/s41558-021-01196-2.79.Hoffman,J.S.,Shandas,V.,andPendleton,N.(2020).Theeffectsofhis-toricalhousingpoliciesonresidentexposuretointra-urbanheat:astudyof108USurbanareas.Climate8,12.https://doi.org/10.3390/cli8010012.80.Schell,C.J.,Dyson,K.,Fuentes,T.L.,DesRoches,S.,Harris,N.C.,Miller,D.S.,Woelfle-Erskine,C.A.,andLambert,M.R.(2020).Theecologicalandevolutionaryconsequencesofsystemicracisminurbanenviron-ments.Science369,6510.https://doi.org/10.1126/science.aay4497.81.Nardone,A.,Rudolph,K.E.,Morello-Frosch,R.,Casey,J.A.,andCaseyJoan,A.(2021).Redlinesandgreenspace:therelationshipbetweenhis-toricalredliningand2010greenspaceacrosstheUnitedStates.Environ.HealthPerspect.129,017006.https://doi.org/10.1289/ehp7495.82.Blanc,E.,andSchlenker,W.(2017).Theuseofpanelmodelsinassess-mentsofclimateimpactsonagriculture.Rev.Environ.Econ.Pol.11,258–279.https://doi.org/10.1093/reep/rex016.llArticle548OneEarth5,534–549,May20,202283.Hausman,J.(2001).Mismeasuredvariablesineconometricanalysis:problemsfromtherightandproblemsfromtheleft.J.Econ.Perspect.15,57–67.https://doi.org/10.1257/jep.15.4.57.84.Obradovich,N.,andFowler,J.H.(2017).Climatechangemayalterhu-manphysicalactivitypatterns.Nat.Hum.Behav.1,1–7.https://doi.org/10.1038/s41562-017-0097.85.Heaney,A.K.,Carrio´n,D.,Burkart,K.,Lesk,C.,andJack,D.(2019).Climatechangeandphysicalactivity:estimatedimpactsofambienttem-peraturesonbikeshareusageinNewYorkcity.Environ.HealthPerspect.127,037002.https://doi.org/10.1289/ehp4039.86.Chan,N.W.,andWichman,C.J.(2020).Climatechangeandrecreation:evidencefromNorthAmericancycling.Environ.Resour.Econ.76,119–151.https://doi.org/10.1007/s10640-020-00420-5.87.Bernard,P.,Chevance,G.,Kingsbury,C.,Baillot,A.,Romain,A.J.,Molinier,V.,Gadais,T.,andDancause,K.N.(2021).Climatechange,physicalactivityandsport:asystematicreview.SportsMed.51,1041–1059.https://doi.org/10.1007/s40279-021-01439-4.88.Min,Kb,Lee,S.,andMin,J.Y.(2020).Highandlowambienttemperatureatnightandtheprescriptionofhypnotics.Sleep44,zssa262.https://doi.org/10.1093/sleep/zsaa262.89.Vicedo-Cabrera,A.M.,Sera,F.,Guo,Y.,Chung,Y.,Arbuthnott,K.,Tong,S.,Tobias,A.,Lavigne,E.,deSousaZanottiStagliorioCoelho,M.,HilarioNascimentoSaldiva,P.,etal.(2018).Amulti-countryanalysisonpoten-tialadaptivemechanismstocoldandheatinachangingclimate.Environ.Int.111,239–246.https://doi.org/10.1016/j.envint.2017.11.006.90.Nicol,F.(2019).Temperatureandsleep.EnergyBuild204,109516.https://doi.org/10.1016/j.enbuild.2019.109516.91.Rafaeli,A.,Ashtar,S.,andAltman,D.(2019).Digitaltraces:newdata,re-sources,andtoolsforpsychological-scienceresearch.Curr.Dir.Psychol.Sci.28,560–566.https://doi.org/10.1177/0963721419861410.92.Ford,J.D.,Tilleard,S.E.,Berrang-Ford,L.,Araos,M.,Biesbroek,R.,Lesnikowski,A.C.,MacDonald,G.K.,Hsu,A.,Chen,C.,andBizikova,L.(2016).Bigdatahasbigpotentialforapplicationstoclimatechangeadaptation.Proc.Natl.Acad.Sci.USA113,10729–10732.https://doi.org/10.1073/pnas.1614023113.93.Lu,X.,Wrathall,D.J.,Sundsøy,P.R.,Nadiruzzaman,M.D.,Wetter,E.,Iqbal,A.,Qureshi,T.,Tatem,A.,Canright,G.,Engo-Monsen,K.,andBengtsson,L.(2016).Unveilinghiddenmigrationandmobilitypatternsinclimatestressedregions:alongitudinalstudyofsixmillionanonymousmobilephoneusersinBangladesh.Glob.Environ.Change38,1–7.https://doi.org/10.1016/j.gloenvcha.2016.02.002.94.Kanamitsu,M.,Ebisuzaki,W.,Woollen,J.,Yang,S.K.,Hnilo,J.J.,Fiorino,M.,andPotter,G.L.(2002).NCEP–DOEAMIP-IIreanalysis(R-2).Bull.Am.Meteorol.Soc.83,1631–1643.https://doi.org/10.1175/bams-83-11-1631(2002)083<1631:nar>2.3.co;2.95.Menne,M.J.,Durre,I.,Vose,R.S.,Gleason,B.E.,andHouston,T.G.(2012).Anoverviewoftheglobalhistoricalclimatologynetwork-dailydatabase.J.Atmos.OceanTechnol.29,897–910.https://doi.org/10.1175/jtech-d-11-00103.1.96.Walch,O.J.,Cochran,A.,andForger,D.B.(2016).Aglobalquantificationof‘‘normal’’sleepschedulesusingsmartphonedata.Sci.Adv.2,e1501705.https://doi.org/10.1126/sciadv.1501705.97.Althoff,T.,Horvitz,E.,White,R.W.,andZeitzer,J.(2017).Harnessingthewebforpopulation-scalephysiologicalsensing:acasestudyofsleepandperformance.InWWW’17:Proceedingsofthe26thInternationalConferenceonWorldWideWeb(ACMPress),pp.113–122.98.Cuttone,A.,Bækgaard,P.,Sekara,V.,Jonsson,H.,Larsen,J.E.,andLehmann,S.(2017).SensibleSleep:abayesianmodelforlearningsleeppatternsfromsmartphoneevents.PLoSOne12,e0169901.https://doi.org/10.1371/journal.pone.0169901.99.Jonasdottir,S.S.,Minor,K.,andLehmann,S.(2020).Genderdifferencesinnighttimesleeppatternsandvariabilityacrosstheadultlifespan:aglobal-scalewearablesstudy.Sleep44,zsaa169.https://doi.org/10.1093/sleep/zsaa169.100.Roenneberg,T.,Allebrandt,K.V.,Merrow,M.,andVetter,C.(2012).Socialjetlagandobesity.Curr.Biol.22,939–943.https://doi.org/10.1016/j.cub.2012.03.038.101.Ong,J.L.,Tandi,J.,Patanaik,A.,Lo,J.C.,andChee,M.W.L.(2019).Large-scaledatafromwearablesrevealregionaldisparitiesinsleeppat-ternsthatpersistacrossageandsex.Sci.Rep.9,3415.https://doi.org/10.1038/s41598-019-40156-x.102.Lo,J.C.,Leong,R.L.F.,Loh,K.K.,Dijk,D.J.,andChee,M.W.L.(2014).YoungAdultsaˆVÔsleepdurationonworkdays:differencesbetweenEastandwest.Front.Neurol.5,81.https://doi.org/10.3389/fneur.2014.00081.103.Hsiang,S.,Kopp,R.,Jina,A.,Rising,J.,Delgado,M.,Mohan,S.,Rasmussen,D.J.,Muir-Wood,R.,Wilson,P.,Oppenheimer,M.,etal.(2017).EstimatingeconomicdamagefromclimatechangeintheUnitedStates.Science356,1362–1369.https://doi.org/10.1126/science.aal4369.104.Obradovich,N.,Tingley,D.,andRahwan,I.(2018).Effectsofenviron-mentalstressorsondailygovernance.Proc.Natl.Acad.Sci.USA115,8710–8715.https://doi.org/10.1073/pnas.1803765115.105.Burke,M.,Hsiang,S.M.,andMiguel,E.(2015).Globalnon-lineareffectoftemperatureoneconomicproduction.Nature527,235–239.https://doi.org/10.1038/nature15725.106.Hsiang,S.M.,Burke,M.,andMiguel,E.(2013).Quantifyingtheinfluenceofclimateonhumanconflict.Science341,6151.https://doi.org/10.1126/science.1235367.107.Acharya,A.,Blackwell,M.,andSen,M.(2016).Explainingcausalfindingswithoutbias:detectingandassessingdirecteffects.Am.Polit.Sci.Rev.110,512–529.https://doi.org/10.1017/s0003055416000216.108.Buzan,J.R.,Oleson,K.,andHuber,M.(2015).Implementationandcom-parisonofasuiteofheatstressmetricswithintheCommunityLandModelversion4.5.Geosci.ModelDev.8,151–170.https://doi.org/10.5194/gmd-8-151-2015.109.Obradovich,N.,andRahwan,I.(2019).Riskofafeedbackloopbetweenclimaticwarmingandhumanmobility.J.R.Soc.Interface16,20190058.https://doi.org/10.1098/rsif.2019.0058.110.Taylor,K.E.,Stouffer,R.J.,andMeehl,G.A.(2012).AnoverviewofCMIP5andtheexperimentdesign.Bull.Am.Meteorol.Soc.93,485–498.https://doi.org/10.1175/bams-d-11-00094.1.111.Riahi,K.,Rao,S.,Krey,V.,Cho,C.,Chirkov,V.,Fischer,G.,Kindermann,G.,Nakicenovic,N.,andRafaj,P.(2011).RCP8.5—ascenarioofcomparativelyhighgreenhousegasemissions.Clim.Change109,33–57.https://doi.org/10.1007/s10584-011-0149-y.112.Thrasher,B.,Maurer,E.P.,McKellar,C.,andDuffy,P.B.(2012).TechnicalNote:biascorrectingclimatemodelsimulateddailytemperatureex-tremeswithquantilemapping.Hydrol.EarthSyst.Sci.16,3309–3314.https://doi.org/10.5194/hess-16-3309-2012.113.Moore,F.C.,Lacasse,K.,Mach,K.J.,Shin,Y.A.,Gross,L.J.,andBeckage,B.(2022).Determinantsofemissionspathwaysinthecoupledclimate–socialsystem.Nature603,103–111.https://doi.org/10.1038/s41586-022-04423-8.114.PielkeJr,R.,Burgess,M.G.,andRitchie,J.(2022).Plausible2005–2050emissionsscenariosprojectbetween2Cand3Cofwarmingby2100.Environ.Res.Lett.17,024027.https://doi.org/10.1088/1748-9326/ac4ebf.115.Hausfather,Z.,andMoore,F.C.(2022).Net-zerocommitmentscouldlimitwarmingtobelow2C.Nature604,247–248.https://doi.org/10.1038/d41586-022-00874-1.116.Meinshausen,M.,Lewis,J.,McGlade,C.,G€utschow,J.,Nicholls,Z.,Burdon,R.,Cozzi,L.,andHackmann,B.(2022).RealizationofParisAgreementpledgesmaylimitwarmingjustbelow2C.Nature604,304–309.https://doi.org/10.1038/s41586-022-04553-z.117.Doxsey-Whitfield,E.,MacManus,K.,Adamo,S.B.,Pistolesi,L.,Squires,J.,Borkovska,O.,andBaptista,S.R.(2015).Takingadvantageoftheimprovedavailabilityofcensusdata:afirstlookatthegriddedpopulationoftheworld,version4.Pap.Appl.Geogr.1,226–234.https://doi.org/10.1080/23754931.2015.1014272.llArticleOneEarth5,534–549,May20,2022549OneEarth,Volume5SupplementalinformationRisingtemperatureserodehumansleepgloballyKeltonMinor,AndreasBjerre-Nielsen,SiggaSvalaJonasdottir,SuneLehmann,andNickObradovichFigureS1Meteorologicalconditionsinfluencesleepduration.A,Depictsthepredictedwithin-individualchangeinsleepdurationasafunctionofrelativehumidity.Lowlevelsofrelativehumidityreducesleepmorethanhighrelativehumidity.Shadedregionsrepresent95%confidenceintervalscomputedusingheteroskedasticity-robuststandarderrorsclusteredonthefirstadministrativedivisionlevel.Histogramsplotthedistributionofobservedmeteorologicalvariablesspanningover7millionsleepobservations.B,Sleepdurationincreasesasafunctionofprecipitationintensity.C,Anincreaseinthediurnaltemperaturerangebetweenthedailymaximumandminimumtemperaturereducessleepduration.D,Moderatetohighwindspeedsextendsleepduration.e,Highcloudcovermarginallyincreasessleepduration.Themagnitudeoftheeffectofmovingacrossthedistributionsofthesemeteorologicalcontrolvariablesiscomparativelysmallerthanmovingacrossthedistributionofnighttimeminimumtemperature(Figure2A,FigureS2A,TableS6).FigureS2Highambienttemperaturesandheatindexvaluesbothreducesleepduration.A,Employinggriddedreanalysisdata(NCEPReanalysis2)enablestheinclusionofadditionalsubjectsandsleepobservationsintheestimatedrelationshipbetweenminimumtemperatureandtotaltimeasleepatnight.Increasesinambientnighttimetemperaturereducesleepdurationacrosstheentiretemperaturedistribution,withincrementallylargerreductionsabove10°C(TableS6).Shadedregionsrepresent95%confidenceintervals.Histogramsplotthedistributionofobservedtemperaturesacrossover7millionsleepobservations.B,Elevatedheatindexvaluesabove10°Creducesleepattainment,whilevaluesbelow-10°Cmarginallyincreasesleepduration(TableS15).FigureS3Extremelywarmnightsgenerateacutesleeploss.A-B,EstimatesgeneratedfromamodelsubstitutingGHCNDweatherstationdata(outputfromtheoriginalmodelshownonleft)withgloballygriddedNCEPReanalysis2meteorologicaldata(right)generateaconsistentfunctionalform,butyieldlargersleeplossvaluesathighertemperatures.Nighttimetemperaturesabove30°Cdecreaseindividualsleepdurationbyoverelevenandahalfminutescomparedtotemperatureswithinthe5-10°Crange(coefficient:-11.54,p<0.001).Conversely,extremelycoldnightsbelow-20°Cincreasesleepdurationbyover4minutes(coefficient:4.30,p<0.01).FigureS4Positivenighttimetemperatureanomaliesreducesleepduration.A,Modellingtheeffectofnighttimetemperatureincreasesabovelocalhistoricalaverages(1981-2010),wefindthatpositivetemperatureanomaliesreducesleep,consistentwiththeestimatesfromourprimarymodelspecification(Figure2A,ExperimentalProceduresEq.4,TableS19-S20).Shadedregionsrepresent95%confidenceintervalscomputedusingheteroskedasticity-robuststandarderrorsclusteredonthefirst-leveladministrativedivision.Histogramsplotthedistributionofobservedtemperatureanomaliesrelativetohistoricalaverages.B,Substitutinggriddedreanalysisdataforstation-basedtemperaturemeasurementsproducesaconsistentfunctionalformwithsimilarestimates.Positivetemperatureanomaliesshortensleepdurationwhilenegativetemperatureanomaliesbelowlocalhistoricalaveragesincreasesleepduration.FigureS5Theeffectofa1°CincreaseinambienttemperatureonsleeplossissimilarinmagnitudeacrossBMIcategories.ThemarginaleffectoftemperatureonsleeplossbyWHOBMIcategories(ExperimentalProcedures,Eq.2).Theeffectofelevatingtemperatureby1°ConsleeplossisconsistentinmagnitudeacrossNormal(n=2,094,740observations),Overweight(n=1,260,247observations)andObese(n=510,742observations)BMIcategories(TableS27).FigureS6Increasesinnighttimetemperaturesduetoclimatechangeareprojectedtoerodehumansleepdurationacrossallcountriesobserved,withlargeregionaldisparities.Globallyaveragedprojectionsfortheadditionalimpactofclimatechangeonexcesshoursofindividualsleeplossnetofthe2010baseline,stratifiedbycountry.Eachcoloredlinedepictstheestimatedcountry-levelchangeinper-personsleeplossfortheensemblemeanofprojectedlossacross21downscaledclimatemodels,averagedacrosseachsetofcountry-levelpixelswithinthedataset,usingthefittedvaluesfromoursplineregressionmodel(ExperimentalProcedures,Person-LevelAnnualProjectionPlot).Countryiconsdisplaynationalestimatesofper-persontemperature-attributedexcesssleeplossby2099abovethe2010baseline.Annualsleeplossandcountry-leveldisparitiesincreaseovertime-withthemagnitudeofrelativelossincreasingfromthemiddletotheendofthecentury-duetoprojectedwarmingunderahighemissionsscenario(RCP8.5).Withoutadaptation,countrieswithrelativelywarmerclimatesareexpectedtosustaingreaterlosses,sinceestimatedmarginalsleeplossincreaseswithelevatedtemperatures(Figure2A,FigureS2A).FigureS7Histogramofsubject-leveltotalnighttimesleepobservations.Countofsubjectsbythetotalnumberofnighttimesleepobservationsregistered.TableS1:PercentageofPeopleinDatasetwithMedianSleepDuration<6Hours,6-7Hours,7-8HoursAgegroup%ofpeoplewithmediansleepduration<6hours%ofpeoplewithmediansleepduration6-7hours%ofpeoplewithmediansleepduration7-8hours19-244.8%27.9%47.6%25-6413.1%37.1%38.0%>=6510.1%33.5%37.9%TableS2:AverageSleepOnsetandDuration(onWeekdaysvs.Weekends)byAgeGroupfortheTopFiveNCountriesJapanN=14750(31%)GermanyN=5329(11.2%)UKN=3510(7.4%)SwedenN=2465(5.2%)SpainN=2231(4.7%)AgegroupWeekdayaveragesleeponset(hh:mm)19-2400:5023:5100:1323:5601:1325-6400:0723:2723:3523:2300:30≥6523:1523:3223:1223:4300:30AgegroupWeekendaveragesleeponset(hh:mm)19-2401:3001:0500:5700:5802:2825-6400:3000:1200:1100:1001:17≥6500:2423:4600:0800:0200:45AgegroupWeekdayaveragesleepduration(hours)19-246.787.487.647.717.2225-646.477.227.357.296.99≥656.837.427.277.357.17AgegroupWeekendaveragesleepduration(hours)19-247.258.027.988.157.6525-646.967.847.827.947.58≥656.947.547.427.497.37TableS3:MedianAgeComparisonwithUNStandardPopulationfortheTopFiveCountriesintheDataset.Source:https://population.un.org/wpp/Download/Standard/Population/Country(#users)Studysample(medianage)UNdataset(medianage)Japan(14750)4546Germany(5329)4046UK(3510)4140Sweden(2465)4441Spain(2231)4143TableS4:AgeStandardizedBMIValuebyCountryfortheFiveCountrieswiththeMostUsersintheDataset.Source:http://apps.who.int/gho/data/view.main.CTRY12461?lang=enCountry(#users)SampleWHOdatasetMaleFemaleMaleFemaleJapan(14750)24.223.323.1-24.021.3-22.3Germany(5329)26.926.226.5-28.124.9-28.1UK(3510)26.928.026.9-27.726.6-27.4Sweden(2465)26.626.525.8-27.624.3-26.5Spain(2231)26.724.826.3-27.624.0-25.51Nighttimeminimumtemperaturebin#observationsinprimaryspecificationwithGHCNDweatherstationdata#observationsinrobustnessspecificationwithNCEP-R2reanalysisgriddeddata(<-20,-20]1164429702(-20,-15]1623047400(-15,-10]39701100232(-10,-5]128603262332(-5,0]506951750659(0,5]10100831304568(5,10]7728961273489(10,15]7606791269646(15,20]5325951066543(20,25]489756868785(25,30]135311195586(30,>30]7225670TableS5:NighttimesleeprecordcountsbytemperaturebinforGHCNDandNCEP-R2SpecificationsTablesS6:BinnedNighttimeMinimumTemperatureandSleepDurationFERegressionsDependentVariable:SleepDuration(Minutes)BinnedGHCNDBinnedRean2(1)(2)3.316∗∗4.298∗∗∗(1.456)(0.809)3.093∗∗∗3.404∗∗∗(0.866)(0.548)2.018∗∗∗1.508∗∗∗(0.670)(0.418)0.867∗1.401∗∗∗(0.477)(0.318)0.4270.727∗∗∗(0.392)(0.259)0.658∗∗∗0.644∗∗∗(0.248)(0.164)−1.956∗∗∗−1.061∗∗∗(0.219)(0.229)−4.379∗∗∗−3.650∗∗∗(0.334)(0.257)−6.397∗∗∗−6.176∗∗∗(0.450)(0.456)−7.243∗∗∗−8.666∗∗∗(0.605)(0.606)−10.766∗∗∗−11.536∗∗∗(1.769)(1.380)−0.208∗∗∗−0.046(0.079)(0.061)0.298∗∗∗0.087(0.106)(0.101)1.218∗∗∗0.489∗∗(0.292)(0.233)1.330∗∗∗0.951∗∗∗(0.350)(0.338)2.106∗∗∗1.325∗∗∗(0.541)(0.412)2.163∗∗0.039(1.096)(1.087)2.690∗∗−0.959(1.212)(1.149)0.2610.515∗∗∗(0.176)(0.138)−0.590∗∗∗−0.766∗∗∗(0.113)(0.143)−2.029∗∗∗−1.921∗∗∗(0.299)(0.274)−2.124∗∗∗−2.702∗∗∗(0.726)(0.815)CUTTMIN(-Inf,-20]CUTTMIN(-20,-15]CUTTMIN(-15,-10]CUTTMIN(-10,-5]CUTTMIN(-5,0]CUTTMIN(0,5]CUTTMIN(10,15]CUTTMIN(15,20]CUTTMIN(20,25]CUTTMIN(25,30]CUTTMIN(30,Inf]TMIN.NORM1981_2010CUTPRCP(0,1]CUTPRCP(1,2]CUTPRCP(2,3]CUTPRCP(3,Inf]PRCP.NORM1981_2010CUTTRANGE(-Inf,0]CUTTRANGE(0,5]CUTTRANGE(10,15]CUTTRANGE(15,20]CUTTRANGE(20,Inf]TRANGE.NORM1981_2010−0.029−0.167∗∗(0.145)(0.082)Note:Outputcontinuesonnextpage∗p<0.1;∗∗p<0.05;∗∗∗p<0.01Standarderrorsareinparenthesesandareclusteredonthe1st-leveladmindivision3TablesS7:Continued...BinnedNighttimeMinimumTemperatureandSleepDurationFERegressionsDependentVariable:NighttimeSleepDuration(Minutes)BinnedGHCNDBinnedRean2(1)(2)0.5220.658∗∗(0.438)(0.327)0.3820.707∗∗(0.461)(0.344)0.6581.063∗∗∗(0.453)(0.310)1.001∗∗1.414∗∗∗(0.482)(0.328)1.624∗∗∗2.164∗∗∗(0.458)(0.343)−0.030−0.028(0.023)(0.023)−4.676∗∗∗−2.880∗∗∗(1.250)(0.889)−1.480∗∗−1.537∗∗∗(0.625)(0.415)0.009−0.146(0.191)(0.154)−0.328∗∗−0.079(0.136)(0.131)0.101∗∗0.078∗∗∗(0.039)(0.029)0.484∗∗∗0.306∗∗∗(0.118)(0.094)0.779∗∗∗0.430∗∗(0.230)(0.184)(Continued)CUTCLOUD.REAN2(0,20]CUTCLOUD.REAN2(20,40]CUTCLOUD.REAN2(40,60]CUTCLOUD.REAN2(60,80]CUTCLOUD.REAN2(80,100]CLOUD.NORM1981_2010CUTRHUM.REAN2(0,20]CUTRHUM.REAN2(20,40]CUTRHUM.REAN2(40,60]CUTRHUM.REAN2(80,100]RHUM.REAN2.NORM1981_2010CUTWIND.REAN2(5,10]CUTWIND.REAN2(10,Inf]WIND.REAN2.NORM1981_2010−0.324∗−0.174(0.194)(0.165)YesYesYesYesYesYes4,405,1717,174,6120.2840.2760.2740.269UserFEDateFEState:MonthFEObservationsR2AdjustedR2ResidualStd.Error77.70777.937Note:∗p<0.1;∗∗p<0.05;∗∗∗p<0.01Standarderrorsareinparenthesesandareclusteredonthe1st-leveladmindivision4TableS8:LinearNighttimeMinimumTemperatureandSleepDurationFERegressionsDependentVariable:SleepDuration(Minutes)LinearGHCNDNighttimeSleepLinearReanalysis2NighttimeSleepLinearGHCND24hrDailySleep(1)(2)(3)TMIN−0.295∗∗∗−0.284∗∗∗−0.319∗∗∗(0.027)(0.020)(0.029)TMIN.NORM1981_2010−0.178∗∗0.005−0.061(0.085)(0.071)(0.091)PRCP0.484∗∗∗0.295∗∗∗0.463∗∗∗(0.120)(0.074)(0.134)PRCP.NORM1981_20102.118∗−0.1041.960∗(1.085)(0.978)(1.172)TRANGE−0.208∗∗∗−0.237∗∗∗−0.243∗∗∗(0.023)(0.023)(0.025)TRANGE.NORM1981_20100.0550.0250.151(0.147)(0.083)(0.164)CLOUD.REAN20.010∗∗∗0.016∗∗∗0.011∗∗∗(0.002)(0.002)(0.003)CLOUD.NORM1981_2010−0.039−0.029−0.053∗∗(0.024)(0.022)(0.026)RHUM.REAN20.0010.0080.0004(0.008)(0.005)(0.008)RHUM.NORM1981_20100.104∗∗∗0.092∗∗∗0.096∗∗(0.040)(0.031)(0.040)WIND.REAN20.128∗∗∗0.099∗∗∗0.150∗∗∗(0.022)(0.016)(0.026)WIND.NORM1981_2010−0.296−0.059−0.262(0.188)(0.143)(0.220)UserFEYesYesYesDateFEYesYesYesState:MonthFEYesYesYesObservations4,405,1717,174,6124,405,171R20.2840.2760.275AdjustedR20.2740.2690.265ResidualStd.Error77.70877.93882.496Note:∗p<0.1;∗∗p<0.05;∗∗∗p<0.01Standarderrorsareinparenthesesandareclusteredonthe1st-leveladministrativedivision5TableS9:NighttimeMinimumTemperatureandShortSleepBinnedProbabilityModelsDependentVariable:ShortSleepAttainment(<7hr,<6hr,<5hr)ChangeinProb<7hrsSleepChangeinProb<6hrsSleepChangeinProb<5hrsSleep(1)(2)(3)CUTTMIN(-Inf,-15]−0.011∗∗−0.006∗−0.002(0.005)(0.004)(0.002)CUTTMIN(-15,-10]−0.009∗∗∗−0.008∗∗∗−0.001(0.003)(0.003)(0.002)CUTTMIN(-10,-5]−0.006∗∗−0.002−0.0003(0.002)(0.002)(0.001)CUTTMIN(-5,0]−0.002−0.001−0.001(0.002)(0.001)(0.001)CUTTMIN(0,5]−0.004∗∗∗−0.004∗∗∗−0.002∗∗∗(0.001)(0.001)(0.001)CUTTMIN(10,15]0.009∗∗∗0.007∗∗∗0.003∗∗∗(0.001)(0.001)(0.001)CUTTMIN(15,20]0.019∗∗∗0.014∗∗∗0.007∗∗∗(0.002)(0.001)(0.001)CUTTMIN(20,25]0.030∗∗∗0.022∗∗∗0.011∗∗∗(0.002)(0.002)(0.001)CUTTMIN(25,Inf]0.035∗∗∗0.024∗∗∗0.012∗∗∗(0.003)(0.003)(0.002)TMIN.NORM1981_20100.001∗∗0.0003−0.00003(0.0004)(0.0003)(0.0002)CUTPRCP(0,1]−0.001∗0.00020.0001(0.001)(0.001)(0.0003)CUTPRCP(1,2]−0.005∗∗∗−0.002∗−0.001(0.002)(0.001)(0.001)CUTPRCP(2,3]−0.004∗∗−0.004∗∗0.001(0.002)(0.001)(0.001)CUTPRCP(3,Inf]−0.006∗∗−0.009∗∗∗−0.004∗∗(0.003)(0.003)(0.002)PRCP.NORM1981_2010−0.0060.008−0.002(0.005)(0.005)(0.003)CUTTRANGE(-Inf,0]−0.018∗∗−0.009−0.003(0.007)(0.006)(0.003)CUTTRANGE(0,5]−0.002∗∗−0.002∗∗−0.0002(0.001)(0.001)(0.0004)CUTTRANGE(10,15]0.002∗∗∗0.0010.0002(0.001)(0.001)(0.0004)CUTTRANGE(15,20]0.009∗∗∗0.005∗∗∗0.002∗∗∗(0.001)(0.001)(0.001)CUTTRANGE(20,Inf]0.013∗∗∗0.0050.002(0.004)(0.004)(0.002)TRANGE.NORM1981_2010−0.0001−0.000050.00004(0.001)(0.001)(0.0003)UserFEYesYesYesDateFEYesYesYesState:MonthFEYesYesYesObservations4,405,1714,405,1714,405,171R20.2360.2010.115AdjustedR20.2250.1900.102ResidualStd.Error0.4400.3980.276Note:Outputcontinuesonnextpage∗p<0.1;∗∗p<0.05;∗∗∗p<0.01Standarderrorsareinparenthesesandareclusteredon1st-leveladmindivision6TableS10:Continued...NighttimeMinimumTemperatureandShortSleepBinnedProbabilityModelsDependentVariable:ShortSleepAttainment(<7hr,<6hr,<5hr)ChangeinProb<7hrsSleepChangeinProb<6hrsSleepChangeinProb<5hrsSleep(1)(2)(3)(Continued)CUTCLOUD.REAN2(0,20]−0.004∗0.0001−0.0004(0.002)(0.002)(0.001)CUTCLOUD.REAN2(20,40]−0.0040.0005−0.0002(0.003)(0.002)(0.001)CUTCLOUD.REAN2(40,60]−0.005∗∗−0.001−0.001(0.003)(0.002)(0.001)CUTCLOUD.REAN2(60,80]−0.007∗∗−0.002−0.001(0.003)(0.002)(0.001)CUTCLOUD.REAN2(80,100]−0.009∗∗∗−0.003−0.002(0.003)(0.002)(0.001)CLOUD.NORM1981_20100.00010.00020.0001(0.0001)(0.0001)(0.0001)CUTRHUM.REAN2(0,20]0.015∗∗0.015∗∗0.007(0.008)(0.007)(0.006)CUTRHUM.REAN2(20,40]0.009∗∗∗0.0050.002(0.003)(0.003)(0.002)CUTRHUM.REAN2(40,60]−0.0002−0.0010.0002(0.001)(0.001)(0.001)CUTRHUM.REAN2(80,100]0.002∗∗∗0.001∗0.001(0.001)(0.001)(0.0004)HUMID.NORM1981_2010−0.001∗∗∗−0.0004∗∗−0.00000(0.0002)(0.0002)(0.0001)CUTWIND.REAN2(5,10]−0.002∗∗∗−0.00010.0002(0.001)(0.001)(0.0004)CUTWIND.REAN2(10,Inf]−0.003∗∗0.0010.001∗∗(0.001)(0.001)(0.001)WIND.NORM1981_20100.002∗∗0.00010.001(0.001)(0.001)(0.0005)UserFEYesYesYesDateFEYesYesYesState:MonthFEYesYesYesObservations4,405,1714,405,1714,405,171R20.2360.2010.115AdjustedR20.2250.1900.102ResidualStd.Error0.4400.3980.276Note:∗p<0.1;∗∗p<0.05;∗∗∗p<0.01Standarderrorsareinparenthesesandareclusteredonthe1st-leveladmindivision7TableS11:NighttimeMinimumTemperatureandShortSleepLinearProbabilityModelsDependentVariables:ShortNighttimeSleepAttainment(<7hr,<6hr,<5hr)LinearChangeinProb<7hrsSleepLinearChangeinProb<6hrsSleepLinearChangeinProb<5hrsSleep(1)(2)(3)TMIN0.001∗∗∗0.001∗∗∗0.0004∗∗∗(0.0001)(0.0001)(0.0001)TMIN.NORM1981_20100.001∗∗0.0002−0.00001(0.0005)(0.0003)(0.0002)PRCP−0.002∗∗−0.001∗∗∗−0.0002(0.001)(0.0004)(0.0004)PRCP.NORM1981_2010−0.0050.008−0.002(0.005)(0.005)(0.003)TRANGE0.001∗∗∗0.0005∗∗∗0.0002∗∗∗(0.0001)(0.0001)(0.0001)TRANGE.NORM1981_2010−0.001−0.0003−0.0001(0.001)(0.001)(0.0003)CLOUD−0.00004∗∗∗−0.00002∗∗−0.00001∗(0.00001)(0.00001)(0.00001)CLOUD.NORM1981_20100.00020.0002∗0.0001∗(0.0001)(0.0001)(0.0001)HUMID0.00002−0.000000.00000(0.00004)(0.00003)(0.00002)HUMID.NORM1981_2010−0.001∗∗∗−0.0004∗∗0.00001(0.0002)(0.0002)(0.0001)WIND−0.0005∗∗∗−0.000020.0001(0.0001)(0.0001)(0.0001)WIND.NORM1981_20100.002∗−0.00020.0005(0.001)(0.001)(0.0005)UserFEYesYesYesDateFEYesYesYesState:MonthFEYesYesYesObservations4,405,1714,405,1714,405,171R20.2360.2010.115AdjustedR20.2250.1900.102ResidualStd.Error0.4400.3980.276Note:∗p<0.1;∗∗p<0.05;∗∗∗p<0.01Standarderrorsareinparenthesesandareclusteredonthe1st-leveladmindivision8TableS12:BinnedNighttimeMinimumTemperatureSleepOnset,MidsleepandOffsetRegressionsDependentVariables:SleepTiming(Minutes)ChangeinSleepOnsetTimeChangeinMidsleepTimeChangeinSleepOffsetTime(1)(2)(3)CUTTMIN(-Inf,-15]−0.9391.0842.972∗∗∗(1.140)(0.843)(1.017)CUTTMIN(-15,-10]−1.675−0.7940.369(1.045)(0.623)(0.724)CUTTMIN(-10,-5]−2.309∗∗∗−1.824∗∗∗−1.310∗∗(0.708)(0.422)(0.525)CUTTMIN(-5,0]−1.962∗∗∗−1.310∗∗∗−1.019∗∗(0.572)(0.390)(0.512)CUTTMIN(0,5]−1.319∗∗∗−0.851∗∗∗−0.475(0.315)(0.241)(0.296)CUTTMIN(10,15]2.255∗∗∗0.950∗∗∗−0.002(0.370)(0.246)(0.255)CUTTMIN(15,20]3.454∗∗∗1.061∗∗∗−1.160∗∗∗(0.510)(0.388)(0.433)CUTTMIN(20,25]4.848∗∗∗0.983∗∗−2.117∗∗∗(0.768)(0.455)(0.542)CUTTMIN(25,INF]5.918∗∗∗1.005∗−2.511∗∗∗(0.954)(0.592)(0.727)TMIN.NORM1981_20100.1310.1610.068(0.129)(0.109)(0.124)CUTPRCP(0,1]0.595∗∗∗0.768∗∗∗0.922∗∗∗(0.187)(0.137)(0.155)CUTPRCP(1,2]0.670∗∗1.375∗∗∗1.973∗∗∗(0.336)(0.294)(0.386)CUTPRCP(2,3]1.182∗∗1.947∗∗∗2.689∗∗∗(0.580)(0.319)(0.388)CUTPRCP(3,Inf]0.6500.8761.840∗∗∗(0.949)(0.543)(0.613)PRCP.NORM1981_20103.589∗∗4.963∗∗∗6.427∗∗∗(1.544)(1.228)(1.322)CUTTRANGE(-Inf,0]−3.243−1.5100.381(2.377)(1.415)(1.542)CUTTRANGE(0,5]−0.1310.328∗0.432∗(0.206)(0.173)(0.230)CUTTRANGE(10,15]0.204−0.222−0.532∗∗(0.221)(0.188)(0.217)CUTTRANGE(15,20]0.210−0.888∗∗∗−1.977∗∗∗(0.471)(0.301)(0.380)CUTTRANGE(20,Inf]0.163−1.724∗∗−2.728∗∗∗(1.376)(0.755)(0.840)TRANGE.NORM1981_20100.0330.024−0.023(0.245)(0.156)(0.184)Note:Outputcontinuesonnextpage∗p<0.1;∗∗p<0.05;∗∗∗p<0.01Standarderrorsareinparenthesesandareclusteredonthe1st-leveladmindivision9TableS13:Continued...BinnedNighttimeMinimumTemperatureSleepOnset,MidsleepandOffsetRegressionsDependentVariables:SleepTiming(Minutes)ChangeinSleepOnsetTimeChangeinMidsleepTimeChangeinSleepOffsetTime(1)(2)(3)(Continued)CUTCLOUD.REAN2(0,20]0.597−0.0870.341(0.760)(0.513)(0.629)CUTCLOUD.REAN2(20,40]0.156−0.495−0.082(0.771)(0.544)(0.653)CUTCLOUD.REAN2(40,60]0.181−0.4730.081(0.767)(0.559)(0.673)CUTCLOUD.REAN2(60,80]0.406−0.0740.644(0.801)(0.566)(0.692)CUTCLOUD.REAN2(80,100]1.0370.7421.782∗∗∗(0.801)(0.538)(0.635)CLOUD.NORM1981_20100.156∗∗∗0.077∗∗∗0.053(0.040)(0.028)(0.034)CUTRHUM.REAN2(0,20]4.0030.019−2.360(2.912)(2.291)(2.097)CUTRHUM.REAN2(20,40]3.133∗∗∗0.599−0.222(1.103)(0.792)(0.938)CUTRHUM.REAN2(40,60]0.671∗0.2270.164(0.349)(0.273)(0.320)CUTRHUM.REAN2(80,100]0.460∗0.152−0.047(0.257)(0.190)(0.224)HUMID.NORM1981_2010−0.387∗∗∗−0.207∗∗∗−0.147∗∗∗(0.076)(0.057)(0.055)CUTWIND.REAN2(5,10]0.519∗∗∗0.980∗∗∗1.246∗∗∗(0.199)(0.131)(0.157)CUTWIND.REAN2(10,Inf]1.285∗∗∗1.935∗∗∗2.323∗∗∗(0.378)(0.261)(0.294)WIND.NORM1981_2010−0.169−0.197−0.235(0.318)(0.170)(0.189)UserFEYesYesYesDateFEYesYesYesState:MonthFEYesYesYesObservations4,405,1714,405,1714,405,171R20.2360.5070.482AdjustedR20.2260.5010.475ResidualStd.Error137.06267.08175.809Note:∗p<0.1;∗∗p<0.05;∗∗∗p<0.01Standarderrorsareinparenthesesandareclusteredonthe1st-leveladmindivision10TableS14:NighttimeMinimumTemperature,SleepOnset,MidsleepandOffsetTimingLinearFERegressionsDependentVariable:SleepTiming(Minutes)LinearChangeinSleepOnsetTimeLinearChangeinMidsleepTimeLinearChangeinSleepOffsetTime(1)(2)(3)TMIN0.257∗∗∗0.071∗∗∗−0.078∗∗(0.034)(0.024)(0.032)TMIN.NORM1981_20100.1250.1650.089(0.128)(0.108)(0.127)PRCP0.2360.452∗∗∗0.688∗∗∗(0.175)(0.120)(0.162)PRCP.NORM1981_20103.731∗∗5.060∗∗∗6.479∗∗∗(1.533)(1.235)(1.314)TRANGE0.045−0.097∗∗∗−0.203∗∗∗(0.032)(0.019)(0.023)TRANGE.NORM1981_2010−0.0080.0350.029(0.247)(0.158)(0.184)CLOUD0.006∗0.009∗∗∗0.015∗∗∗(0.004)(0.002)(0.003)CLOUD.NORM1981_20100.158∗∗∗0.073∗∗0.045(0.040)(0.029)(0.037)HUMID0.0140.0130.013(0.013)(0.011)(0.013)HUMID.NORM1981_2010−0.408∗∗∗−0.217∗∗∗−0.155∗∗∗(0.079)(0.059)(0.057)WIND0.147∗∗∗0.241∗∗∗0.309∗∗∗(0.034)(0.025)(0.030)WIND.NORM1981_2010−0.248−0.254−0.283(0.313)(0.173)(0.192)UserFEYesYesYesDateFEYesYesYesState:MonthFEYesYesYesObservations4,405,1714,405,1714,405,171R20.2360.5070.482AdjustedR20.2260.5010.475ResidualStd.Error137.06367.08275.811Note:∗p<0.1;∗∗p<0.05;∗∗∗p<0.01Standarderrorsareinparenthesesandareclusteredonthe1st-leveladmindivision11TableS15:NighttimeHeatIndexandSleepDurationFERegressionDependentVariable:SleepDuration(Minutes)LinearHEATINDEXHEAT.INDEX−0.265∗∗∗(0.024)TMIN.NORM−0.180∗∗(0.085)PRCP0.500∗∗∗(0.112)PRCP.NORM2.080∗(1.095)TRANGE−0.216∗∗∗(0.022)TRANGE.NORM0.060(0.148)CLOUD0.011∗∗∗(0.002)CLOUD.NORM−0.039(0.024)HUMID.NORM0.110∗∗∗(0.040)WIND0.125∗∗∗(0.022)WIND.NORM−0.293(0.188)UserFEYesDateFEYesState:MonthFEYesObservations4,405,171R20.284AdjustedR20.274ResidualStd.Error77.708Note:∗p<0.1;∗∗p<0.05;∗∗∗p<0.01Standarderrorsareinparenthesesandareclusteredonthe1st-leveladmindivision12TableS16:BinnedNighttimeHeatIndexFERegressionDependentVariable:SleepDuration(Minutes)BinnedHeatIndex(GHCND)CUTHEAT.INDEX(-Inf,-15]2.485∗∗∗(0.764)CUTHEAT.INDEX(-15,-10]1.140∗(0.654)CUTHEAT.INDEX(-10,-5]0.616(0.569)CUTHEAT.INDEX(-5,0]0.206(0.436)CUTHEAT.INDEX(0,5]0.598∗∗(0.240)CUTHEAT.INDEX(10,15]−2.197∗∗∗(0.205)CUTHEAT.INDEX(15,20]−4.435∗∗∗(0.360)CUTHEAT.INDEX(20,25]−6.513∗∗∗(0.481)CUTHEAT.INDEX(25,INF]−7.069∗∗∗(0.688)CUTHEAT.INDEX.NORM−0.219∗∗∗(0.077)CUTPRCP(0,1]0.274∗∗∗(0.105)CUTPRCP(1,2]1.216∗∗∗(0.283)CUTPRCP(2,3]1.296∗∗∗(0.350)CUTPRCP(3,Inf]2.099∗∗∗(0.535)PRCP.NORM2.172∗∗(1.098)CUTTRANGE(-Inf,0]2.702∗∗(1.204)CUTTRANGE(0,5]0.223(0.176)CUTTRANGE(10,15]−0.548∗∗∗(0.125)CUTTRANGE(15,20]−2.037∗∗∗(0.277)CUTTRANGE(20,Inf]−2.295∗∗∗(0.719)TRANGE.NORM−0.030(0.146)Note:Outputcontinuedonnextpage∗p<0.1;∗∗p<0.05;∗∗∗p<0.01Standarderrorsareinparenthesesandareclusteredonthe1st-leveladmindivision13TableS17:Continued...BinnedNighttimeHeatIndexRegressionDependentVariable:SleepDuration(Minutes)BinnedHeat.Index(GHCND)(Continued)CUTCLOUD.REAN2(0,20]0.498(0.438)CUTCLOUD.REAN2(20,40]0.344(0.468)CUTCLOUD.REAN2(40,60]0.600(0.456)CUTCLOUD.REAN2(60,80]0.933∗(0.485)CUTCLOUD.REAN2(80,100]1.540∗∗∗(0.459)CLOUD.NORM−0.028(0.023)HUMID.NORM0.108∗∗∗(0.041)CUTWIND.REAN2(5,10]0.481∗∗∗(0.117)CUTWIND.REAN2(10,Inf]0.785∗∗∗(0.229)WIND.NORM−0.336∗(0.195)UserFEYesDateFEYesState:MonthFEYesObservations4,405,171R20.284AdjustedR20.274ResidualStd.Error77.707Note:∗p<0.1;∗∗p<0.05;∗∗∗p<0.01Standarderrorsareinparenthesesandareclusteredonthe1st-leveladmindivision14TableS18:AlternativeRegressionSpecification:NighttimeMinimumTemperatureAnomaliesandSleepDurationFERegressionsDependentVariable:SleepDuration(Minutes)LinearTMIN.AnomalyGHCNDLinearTMIN.AnomalyRean2LinearTMIN.AnomalyGHCND24hr(1)(2)(3)TMIN.ANOMALY−0.283∗∗∗−0.281∗∗∗−0.309∗∗∗(0.026)(0.020)(0.028)PRCP0.485∗∗∗0.296∗∗∗0.464∗∗∗(0.120)(0.073)(0.134)PRCP.NORM1981_20102.406∗∗−0.6562.191∗(1.123)(0.868)(1.208)TRANGE−0.205∗∗∗−0.235∗∗∗−0.242∗∗∗(0.023)(0.023)(0.025)TRANGE.NORM1981_20100.264∗0.1140.319∗∗(0.142)(0.092)(0.155)CLOUD.REAN20.010∗∗∗0.016∗∗∗0.011∗∗∗(0.002)(0.002)(0.003)CLOUD.NORM1981_2010−0.058∗∗−0.047∗−0.069∗∗∗(0.024)(0.026)(0.026)RHUM.REAN20.0010.0080.001(0.007)(0.005)(0.008)RHUM.NORM1981_20100.132∗∗∗0.126∗∗∗0.118∗∗∗(0.045)(0.037)(0.043)WIND.REAN20.128∗∗∗0.098∗∗∗0.151∗∗∗(0.022)(0.016)(0.026)WIND.NORM1981_2010−0.233−0.188−0.212(0.207)(0.170)(0.233)UserFEYesYesYesDateFEYesYesYesState:MonthFEYesYesYesObservations4,405,1717,174,6124,405,171R20.2840.2760.275AdjustedR20.2740.2690.265ResidualStd.Error77.70977.93982.497Note:∗p<0.1;∗∗p<0.05;∗∗∗p<0.01Standarderrorsareinparenthesesandareclusteredonthe1st-leveladmindivision15TableS19:BinnedNighttimeMinimumTemperatureAnomaliesandSleepDurationFERegressionsDependentVariable:SleepDuration(Minutes)TMIN.AnomalyGHCNDTMIN.AnomalyRean2CUTTANOMALY(-Inf,-10.5]1.4182.599∗∗∗(0.935)(0.575)CUTTANOMALY(-10.5,-9.5]1.4941.155(1.098)(0.843)CUTTANOMALY(-9.5,-8.5]0.5511.831∗∗∗(0.876)(0.637)CUTTANOMALY(-8.5,-7.5]0.9941.862∗∗∗(0.688)(0.556)CUTTANOMALY(-7.5,-6.5]0.4811.677∗∗∗(0.517)(0.537)CUTTANOMALY(-6.5,-5.5]0.1631.028∗∗(0.385)(0.435)CUTTANOMALY(-5.5,-4.5]−0.0551.143∗∗∗(0.439)(0.375)CUTTANOMALY(-4.5,-3.5]0.0700.726∗(0.256)(0.371)CUTTANOMALY(-3.5,-2.5]0.1711.043∗∗∗(0.248)(0.241)CUTTANOMALY(-2.5,-1.5]0.1660.420(0.235)(0.313)CUTTANOMALY(-1.5,-.5]0.197−0.030(0.185)(0.178)CUTTANOMALY(.5,1.5]−0.205−0.352∗(0.157)(0.182)CUTTANOMALY(1.5,2.5]−1.159∗∗∗−0.636∗∗∗(0.168)(0.241)CUTTANOMALY(2.5,3.5]−1.481∗∗∗−0.877∗∗∗(0.189)(0.236)CUTTANOMALY(3.5,4.5]−1.686∗∗∗−1.235∗∗∗(0.257)(0.203)CUTTANOMALY(4.5,5.5]−2.118∗∗∗−1.307∗∗∗(0.261)(0.250)CUTTANOMALY(5.5,6.5]−2.095∗∗∗−1.696∗∗∗(0.309)(0.439)CUTTANOMALY(6.5,7.5]−3.046∗∗∗−1.711∗∗∗(0.391)(0.377)CUTTANOMALY(7.5,8.5]−2.999∗∗∗−2.241∗∗∗(0.476)(0.433)CUTTANOMALY(8.5,9.5]−3.026∗∗∗−2.424∗∗∗(0.574)(0.385)CUTTANOMALY(9.5,10.5]−3.522∗∗∗−3.393∗∗∗(0.988)(0.423)CUTTANOMALY(10.5,Inf]−3.970∗∗∗−3.682∗∗∗(0.761)(0.453)CUTPRCP(0,1]0.335∗∗∗0.103(0.105)(0.102)CUTPRCP(1,2]1.222∗∗∗0.407∗(0.284)(0.239)CUTPRCP(2,3]1.347∗∗∗0.807∗∗(0.346)(0.331)CUTPRCP(3,Inf]1.979∗∗∗1.287∗∗∗(0.533)(0.413)PRCP.NORM2.534∗∗−0.694(1.121)(0.841)Note:Outputcontinuesonnextpage∗p<0.1;∗∗p<0.05;∗∗∗p<0.01Standarderrorsareinparenthesesandareclusteredonthe1st-leveladmindivision16TableS20:Continued...BinnedNighttimeMinimumTemperatureAnomaliesandSleepDurationFERegressionsDependentVariable:SleepDuration(Minutes)TMIN.AnomalyGHCNDTMIN.AnomalyRean2(Continued)CUTTRANGE(-Inf,0]2.998∗∗−0.764(1.219)(1.166)CUTTRANGE(0,5]0.458∗∗∗0.658∗∗∗(0.170)(0.152)CUTTRANGE(10,15]−0.568∗∗∗−0.944∗∗∗(0.118)(0.150)CUTTRANGE(15,20]−1.978∗∗∗−2.181∗∗∗(0.295)(0.277)CUTTRANGE(20,Inf]−2.008∗∗∗−2.890∗∗∗(0.733)(0.858)TRANGE.NORM0.245∗0.053(0.140)(0.094)CUTCLOUD.REAN2(0,20]0.5530.784∗∗(0.437)(0.331)CUTCLOUD.REAN2(20,40]0.4750.892∗∗(0.458)(0.350)CUTCLOUD.REAN2(40,60]0.760∗1.293∗∗∗(0.452)(0.316)CUTCLOUD.REAN2(60,80]1.148∗∗1.668∗∗∗(0.477)(0.336)CUTCLOUD.REAN2(80,100]1.747∗∗∗2.393∗∗∗(0.452)(0.348)CLOUD.NORM−0.054∗∗−0.047∗(0.024)(0.026)CUTRHUM.REAN2(0,20]−5.087∗∗∗−3.729∗∗∗(1.342)(0.923)CUTRHUM.REAN2(20,40]−1.655∗∗∗−1.837∗∗∗(0.615)(0.413)CUTRHUM.REAN2(40,60]−0.004−0.222(0.189)(0.155)CUTRHUM.REAN2(80,100]−0.339∗∗−0.071(0.138)(0.142)HUMID.NORM0.125∗∗∗0.115∗∗∗(0.044)(0.034)CUTWIND.REAN2(5,10]0.595∗∗∗0.434∗∗∗(0.122)(0.094)CUTWIND.REAN2(10,Inf]1.048∗∗∗0.685∗∗∗(0.236)(0.198)WIND.NORM−0.218−0.165(0.215)(0.180)UserFEYesYesDateFEYesYesState:MonthFEYesYesObservations4,405,1717,174,612R20.2840.276AdjustedR20.2740.269ResidualStd.Error77.70877.939Note:∗p<0.1;∗∗p<0.05;∗∗∗p<0.01Standarderrorsareinparenthesesandareclusteredonthe1st-leveladmindivision17TableS21:NighttimeMinimumTemperatureandSleepDuration:SeasonsInteractionModelDependentVariable:SleepDuration(Minutes)BaseLevel:WinterTMIN−0.199∗∗∗(0.042)TMIN.NORM−0.190∗∗(0.086)PRCP0.458∗∗∗(0.117)PRCP.NORM2.275∗∗(1.128)TRANGE−0.206∗∗∗(0.023)TRANGE.NORM0.027(0.147)CLOUD0.010∗∗∗(0.002)CLOUD.NORM−0.038(0.024)HUMID0.00001(0.008)HUMID.NORM0.104∗∗∗(0.040)WIND0.120∗∗∗(0.021)WIND.NORM−0.287(0.195)FALL:TMIN−0.154∗∗∗(0.056)SPRING:TMIN−0.055(0.044)SUMMER:TMIN−0.350∗∗∗(0.070)UserFEYesDateFEYesState:MonthFEYesObservations4,405,171R20.284AdjustedR20.274ResidualStd.Error77.707Note:∗p<0.1;∗∗p<0.05;∗∗∗p<0.01Standarderrorsareinparenthesesandareclusteredonthe1st-leveladmindivision18TableS22:SubgroupAnalysis:NighttimeMinimumTemperatureandSleepDuration:AgeInteractionModelDependentVariable:SleepDuration(Minutes)BaseLevel:Middle-agedAdults25-64TMIN−0.283∗∗∗(0.027)TMIN.NORM−0.177∗∗(0.085)PRCP0.484∗∗∗(0.120)PRCP.NORM2.133∗∗(1.087)TRANGE−0.208∗∗∗(0.023)TRANGE.NORM0.059(0.147)CLOUD0.010∗∗∗(0.002)CLOUD.NORM−0.039(0.024)HUMID0.001(0.008)HUMID.NORM0.104∗∗∗(0.040)WIND0.128∗∗∗(0.022)WIND.NORM−0.292(0.186)TMIN:AgeGroup.19-24.Young−0.025(0.048)TMIN:AgeGroup.65+.Older−0.324∗∗∗(0.042)UserFEYesDateFEYesState:MonthFEYesObservations4,405,171R20.284AdjustedR20.274ResidualStd.Error77.707Note:∗p<0.1;∗∗p<0.05;∗∗∗p<0.01Standarderrorsareinparenthesesandareclusteredonthe1st-leveladmindivision19TableS23:SubgroupAnalysis:NighttimeMinimumTemperatureandSleepDuration,AgeInteractionModel(Alternative10yr.AgeGroupIntervals)DependentVariable:SleepDuration(Minutes)BaseLevel:<30yearsTMIN−0.313∗∗∗(0.032)TMIN.NORM−0.178∗∗(0.085)PRCP0.484∗∗∗(0.120)PRCP.NORM2.144∗∗(1.086)TRANGE−0.208∗∗∗(0.023)TRANGE.NORM0.059(0.147)CLOUD0.010∗∗∗(0.002)CLOUD.NORM−0.039∗(0.024)HUMID0.0005(0.008)HUMID.NORM0.104∗∗∗(0.040)WIND0.128∗∗∗(0.022)WIND.NORM−0.292(0.187)TMIN:AGE_GROUP(30,40]0.038(0.025)TMIN:AGE_GROUP(40,50]0.056∗∗(0.025)TMIN:AGE_GROUP(50,60]0.023(0.028)TMIN:AGE_GROUP(60,70]−0.228∗∗∗(0.044)TMIN:AGE_GROUP(70,Inf]−0.266∗∗(0.105)UserFEYesDateFEYesState:MonthFEYesObservations4,405,171R20.284AdjustedR20.274ResidualStd.Error77.706Note:∗p<0.1;∗∗p<0.05;∗∗∗p<0.01Standarderrorsareinparenthesesandareclusteredonthe1st-leveladmindivision20TableS24:SubgroupAnalysis:NighttimeMinimumTemperatureandSleep,SexInteractionModelDependentVariable:SleepDuration(Minutes)BaseLevel:MaleTMIN−0.273∗∗∗(0.029)TMIN.NORM−0.183∗∗(0.086)PRCP0.485∗∗∗(0.121)PRCP.NORM2.118∗(1.085)TRANGE−0.207∗∗∗(0.023)TRANGE.NORM0.057(0.147)CLOUD0.010∗∗∗(0.002)CLOUD.NORM−0.039(0.024)HUMID0.0005(0.008)HUMID.NORM0.103∗∗∗(0.040)WIND0.128∗∗∗(0.022)WIND.NORM−0.294(0.187)TMIN:Female−0.065∗∗∗(0.022)UserFEYesDateFEYesState:MonthFEYesObservations4,405,171R20.284AdjustedR20.274ResidualStd.Error77.708Note:∗p<0.1;∗∗p<0.05;∗∗∗p<0.01Standarderrorsareinparenthesesandareclusteredonthe1st-leveladmindivision21TableS25:SubgroupAnalysis:NighttimeMinimumTemperatureandSleep,Income(WorldBankCountryGNICategory)InteractionModelDependentVariable:SleepDuration(Minutes)IncomeCategoryBase:HighIncomeTMIN−0.302∗∗∗(0.029)TMIN.NORM−0.176∗∗(0.085)PRCP0.482∗∗∗(0.121)PRCP.NORM2.124∗(1.086)TRANGE−0.207∗∗∗(0.023)TRANGE.NORM0.055(0.147)CLOUD0.010∗∗∗(0.002)CLOUD.NORM−0.039(0.024)HUMID0.001(0.008)HUMID.NORM0.104∗∗∗(0.039)WIND0.128∗∗∗(0.022)WIND.NORM−0.295(0.188)TMIN:UpperMiddleIncomeGNI0.068(0.052)TMIN:LowerMiddleIncomeGNI−0.545∗(0.318)UserFEYesDateFEYesState:MonthFEYesObservations4,405,171R20.284AdjustedR20.274ResidualStd.Error77.708Note:∗p<0.1;∗∗p<0.05;∗∗∗p<0.01Standarderrorsareinparenthesesandareclusteredonthe1st-leveladmindivision.22TableS26:SubgroupAnalysis:NighttimeMinimumTemperatureandSleep,Income(WorldBankCountryGNICategory)InteractionModel,AlternativeReferenceCategoryDependentVariable:SleepDuration(Minutes)IncomeCategoryBase:UpperMiddleIncomeTMIN−0.234∗∗∗(0.048)TMIN.NORM−0.176∗∗(0.085)PRCP0.482∗∗∗(0.121)PRCP.NORM2.124∗(1.086)TRANGE−0.207∗∗∗(0.023)TRANGE.NORM0.055(0.147)CLOUD0.010∗∗∗(0.002)CLOUD.NORM−0.039(0.024)HUMID0.001(0.008)HUMID.NORM0.104∗∗∗(0.039)WIND0.128∗∗∗(0.022)WIND.NORM−0.295(0.188)TMIN:HighIncomeGNI−0.068(0.052)TMIN:LowerMiddleIncomeGNI−0.613∗(0.322)UserFEYesDateFEYesState:MonthFEYesObservations4,405,171R20.284AdjustedR20.274ResidualStd.Error77.708Note:∗p<0.1;∗∗p<0.05;∗∗∗p<0.01Standarderrorsareinparenthesesandareclusteredonthe1st-leveladmindivision23TableS27:SubgroupAnalysis:NighttimeMinimumTemperatureandSleepBMICategoryInteractionModelDependentVariable:SleepDuration(Minutes)BaseLevel:NormalBMIRangeTMIN−0.295∗∗∗(0.030)TMIN.NORM−0.168∗(0.089)PRCP0.470∗∗∗(0.130)PRCP.NORM2.357∗∗(1.130)TRANGE−0.199∗∗∗(0.023)TRANGE.NORM0.094(0.145)CLOUD0.009∗∗∗(0.002)CLOUD.NORM−0.038(0.025)HUMID0.003(0.008)HUMID.NORM0.103∗∗∗(0.039)WIND0.146∗∗∗(0.021)WIND.NORM−0.334(0.205)TMIN:BMI.Overweight0.009(0.019)TMIN:BMI.Obese0.014(0.028)UserFEYesDateFEYesState:MonthFEYesObservations3,865,729R20.283AdjustedR20.273ResidualStd.Error77.646Note:∗p<0.1;∗∗p<0.05;∗∗∗p<0.01Standarderrorsareinparenthesesandareclusteredonthe1st-leveladmindivision24TableS28:MarginalEffectofTemperaturebyAvg.NighttimeMinimumTemperatureDecileOverStudyPeriodDependentVariable:SleepDuration(Minutes)BaseLevel:Avg.2015-2017TminDecile1(Coldest)TMIN−0.183∗∗∗(0.034)TMIN.NORM−0.130(0.082)PRCP0.471∗∗∗(0.119)PRCP.NORM1.927∗(1.107)TRANGE−0.218∗∗∗(0.023)TRANGE.NORM0.038(0.148)CLOUD_REAN20.010∗∗∗(0.002)CLOUD.NORM−0.040∗(0.023)RHUM_REAN20.001(0.008)RHUM.NORM0.116∗∗∗(0.039)0.120∗∗∗(0.022)−0.330∗(0.183)0.050(0.053)−0.022(0.039)−0.168∗∗∗(0.052)−0.160∗∗∗(0.054)−0.205∗∗∗(0.045)−0.215∗∗∗(0.048)−0.238∗∗∗(0.040)−0.283∗∗∗(0.053)WIND_REAN2WIND.NORMTMIN:CLIMATE_DECILE2TMIN:CLIMATE_DECILE3TMIN:CLIMATE_DECILE4TMIN:CLIMATE_DECILE5TMIN:CLIMATE_DECILE6TMIN:CLIMATE_DECILE7TMIN:CLIMATE_DECILE8TMIN:CLIMATE_DECILE9TMIN:CLIMATE_DECILE10(Warmest)−0.266∗∗∗(0.064)UserFEYesDateFEYesState:MonthFEYesObservations4,405,171R20.284AdjustedR20.274ResidualStd.Error77.707Note:∗p<0.1;∗∗p<0.05;∗∗∗p<0.01Standarderrorsareinparenthesesandareclusteredonthe1st-leveladmindivision25TableS29:MinimumTemperatureandDaytimeNappingLinearProbabilityModelDependentVariable:ProbabilityofNappingChangeinDaytimeNappingProbabilityTMIN−0.0002∗∗(0.0001)TMIN.NORM0.001∗∗∗(0.0002)PRCP−0.0001(0.0003)PRCP.NORM−0.0004(0.003)TRANGE−0.0004∗∗∗(0.0001)TRANGE.NORM0.001∗∗∗(0.0005)CLOUD0.00002∗(0.00001)CLOUD.NORM−0.0001(0.0001)HUMID0.00001(0.00002)HUMID.NORM−0.0001(0.0002)WIND0.0003∗∗∗(0.0001)WIND.NORM0.001(0.001)UserFEYesDateFEYesState:MonthFEYesObservations4,405,171R20.133AdjustedR20.121ResidualStd.Error0.311Note:∗p<0.1;∗∗p<0.05;∗∗∗p<0.01Standarderrorsareinparenthesesandareclusteredonthe1st-leveladmindivision26TableS30:AlternativeTimeandLocationControlsDependentVariable:SleepDuration(Minutes)State-WeekControlState-MonthControlCountry-MonthControl(1)(2)(3)TMIN−0.329∗∗∗−0.295∗∗∗−0.288∗∗∗(0.027)(0.027)(0.043)TMIN.NORM−0.296∗∗∗−0.178∗∗−0.030(0.112)(0.085)(0.102)PRCP0.527∗∗∗0.484∗∗∗0.462∗∗∗(0.129)(0.120)(0.138)PRCP.NORM2.0432.118∗2.638∗(1.652)(1.085)(1.433)TRANGE−0.230∗∗∗−0.208∗∗∗−0.209∗∗∗(0.029)(0.023)(0.018)TRANGE.NORM−0.1420.0550.195(0.189)(0.147)(0.290)CLOUD0.013∗∗∗0.010∗∗∗0.009∗∗∗(0.003)(0.002)(0.003)CLOUD.NORM−0.001−0.039−0.073∗∗∗(0.034)(0.024)(0.013)HUMID0.0070.0010.003(0.008)(0.008)(0.011)HUMID.NORM0.143∗∗∗0.104∗∗∗0.113∗∗∗(0.047)(0.040)(0.028)WIND0.143∗∗∗0.128∗∗∗0.134∗∗∗(0.022)(0.022)(0.041)WIND.NORM−0.567∗∗−0.296−0.025(0.243)(0.188)(0.231)UserFEYesYesYesDateFEYesYesYesState:WeekFEYesNoNoState:MonthFENoYesNoCountry:MonthFENoNoYesObservations4,405,1714,405,1714,405,171R20.2920.2840.280AdjustedR20.2750.2740.273ResidualStd.Error77.65677.70877.804Note:∗p<0.1;∗∗p<0.05;∗∗∗p<0.01Standarderrorsareinparenthesesandareclusteredonthelevelindicated:state(admin1)orcountry27TableS31:AlternativeSleepTimingFiltersforInclusioninSampleDependentVariable:SleepDuration(Minutes)19:00<onset<08:00and00:00<offset<15:00Walchetal.(2016)19:00<onset<03:00and03:00<offset<11:00(1)(2)TMIN−0.295∗∗∗−0.291∗∗∗(0.027)(0.028)TMIN.NORM−0.178∗∗−0.186∗∗(0.085)(0.082)PRCP0.484∗∗∗0.550∗∗∗(0.120)(0.134)PRCP.NORM2.118∗2.196∗∗(1.085)(1.042)TRANGE−0.208∗∗∗−0.213∗∗∗(0.023)(0.022)TRANGE.NORM0.0550.047(0.147)(0.158)CLOUD0.010∗∗∗0.011∗∗∗(0.002)(0.002)CLOUD.NORM−0.039−0.033(0.024)(0.026)HUMID0.0010.001(0.008)(0.008)HUMID.NORM0.104∗∗∗0.081∗∗(0.040)(0.037)WIND0.128∗∗∗0.152∗∗∗(0.022)(0.021)WIND.NORM−0.296−0.305∗(0.188)(0.172)UserFEYesYesDateFEYesYesState:MonthFEYesYesObservations4,405,1714,175,362R20.2840.302AdjustedR20.2740.292ResidualStd.Error77.70875.938Note:∗p<0.1;∗∗p<0.05;∗∗∗p<0.01Standarderrorsareinparenthesesandareclusteredonthe1st-leveladmindivision28TableS32:AlternativeMinimumPercentageofNightswithWearableDeviceUseforInclusioninSampleDependentVariable:SleepDuration(Minutes)>25pctofnights>50pctofnights>75pctofnights>85pctofnights(1)(2)(3)(4)TMIN−0.295∗∗∗−0.307∗∗∗−0.316∗∗∗−0.297∗∗∗(0.027)(0.027)(0.037)(0.051)TMIN.NORM−0.178∗∗−0.1110.0280.146(0.085)(0.091)(0.132)(0.179)PRCP0.484∗∗∗0.522∗∗∗0.627∗∗∗0.802∗∗∗(0.120)(0.133)(0.143)(0.196)PRCP.NORM2.118∗1.0630.3820.422(1.085)(1.153)(1.717)(2.158)TRANGE−0.208∗∗∗−0.230∗∗∗−0.235∗∗∗−0.221∗∗∗(0.023)(0.025)(0.035)(0.049)TRANGE.NORM0.0550.0050.0620.084(0.147)(0.156)(0.249)(0.332)CLOUD0.010∗∗∗0.011∗∗∗0.015∗∗∗0.015∗∗∗(0.002)(0.003)(0.004)(0.005)CLOUD.NORM−0.039−0.042−0.049−0.046(0.024)(0.029)(0.039)(0.052)HUMID0.0010.0010.0110.015(0.008)(0.009)(0.010)(0.014)HUMID.NORM0.104∗∗∗0.136∗∗∗0.1110.152(0.040)(0.051)(0.084)(0.102)WIND0.128∗∗∗0.138∗∗∗0.138∗∗∗0.134∗∗∗(0.022)(0.025)(0.035)(0.039)WIND.NORM−0.296−0.210−0.171−0.593(0.188)(0.174)(0.347)(0.363)UserFEYesYesYesYesDateFEYesYesYesYesState:MonthFEYesYesYesYesObservations4,405,1713,171,6821,357,635607,435R20.2840.2860.2930.308AdjustedR20.2740.2760.2810.292ResidualStd.Error77.70876.36673.19470.085Note:∗p<0.1;∗∗p<0.05;∗∗∗p<0.01Standarderrorsareinparenthesesandareclusteredonthe1st-leveladmindivision29TableS33:AlternativeMinimumNumberofNightsofWearableDeviceUseforInclusioninSampleDependentVariable:SleepDuration(Minutes)>28nights>56nights>84nights>112nights(1)(2)(3)(4)TMIN−0.295∗∗∗−0.296∗∗∗−0.287∗∗∗−0.282∗∗∗(0.027)(0.027)(0.027)(0.027)TMIN.NORM−0.178∗∗−0.174∗∗−0.131−0.121(0.085)(0.088)(0.089)(0.092)PRCP0.484∗∗∗0.466∗∗∗0.529∗∗∗0.523∗∗∗(0.120)(0.121)(0.121)(0.124)PRCP.NORM2.118∗2.339∗∗2.228∗∗2.267∗(1.085)(1.084)(1.125)(1.168)TRANGE−0.208∗∗∗−0.212∗∗∗−0.216∗∗∗−0.215∗∗∗(0.023)(0.023)(0.023)(0.024)TRANGE.NORM0.0550.0290.0570.071(0.147)(0.145)(0.147)(0.150)CLOUD0.010∗∗∗0.010∗∗∗0.009∗∗∗0.009∗∗∗(0.002)(0.002)(0.002)(0.002)CLOUD.NORM−0.039−0.042∗−0.051∗∗−0.059∗∗(0.024)(0.023)(0.024)(0.024)HUMID0.0010.0010.0010.002(0.008)(0.008)(0.008)(0.008)HUMID.NORM0.104∗∗∗0.110∗∗∗0.123∗∗∗0.115∗∗(0.040)(0.041)(0.044)(0.046)WIND0.128∗∗∗0.136∗∗∗0.131∗∗∗0.138∗∗∗(0.022)(0.022)(0.022)(0.024)WIND.NORM−0.296−0.292−0.239−0.213(0.188)(0.191)(0.190)(0.189)UserFEYesYesYesYesDateFEYesYesYesYesState:MonthFEYesYesYesYesObservations4,405,1714,204,1733,959,6873,696,585R20.2840.2830.2830.282AdjustedR20.2740.2740.2740.274ResidualStd.Error77.70877.60277.47777.326Note:∗p<0.1;∗∗p<0.05;∗∗∗p<0.01Standarderrorsareinparenthesesandareclusteredonthe1st-leveladmindivision30TableS34:Alternative(Binned)ClimateNormalsDependentVariable:SleepDuration(Minutes)BinnedGHCNDBinnedReanalysis2(1)(2)CUTTMIN(-Inf,-15]3.333∗∗∗3.746∗∗∗(0.885)(0.531)CUTTMIN(-15,-10]2.148∗∗∗1.517∗∗∗(0.680)(0.412)CUTTMIN(-10,-5]1.015∗∗1.432∗∗∗(0.477)(0.314)CUTTMIN(-5,0]0.5970.751∗∗∗(0.391)(0.268)CUTTMIN(0,5]0.755∗∗∗0.640∗∗∗(0.248)(0.169)CUTTMIN(10,15]−2.101∗∗∗−1.015∗∗∗(0.227)(0.236)CUTTMIN(15,20]−4.489∗∗∗−3.564∗∗∗(0.341)(0.269)CUTTMIN(20,25]−6.508∗∗∗−6.079∗∗∗(0.458)(0.404)CUTTMIN(25,Inf]−7.462∗∗∗−8.658∗∗∗(0.612)(0.611)CUTTMIN.NORM1981_2010(-Inf,-15]3.953∗0.101(2.145)(1.152)CUTTMIN.NORM1981_2010(-15,-10]1.6331.172(1.029)(0.814)CUTTMIN.NORM1981_2010(-10,-5]0.3831.296∗∗(0.852)(0.623)CUTTMIN.NORM1981_2010(-5,0]−0.6170.931∗(0.496)(0.527)CUTTMIN.NORM1981_2010(0,5]−0.1350.583∗∗(0.320)(0.263)CUTTMIN.NORM1981_2010(10,15]0.728∗−0.711∗∗∗(0.399)(0.250)CUTTMIN.NORM1981_2010(15,20]−0.300−1.383∗∗∗(0.496)(0.505)CUTTMIN.NORM1981_2010(20,25]−0.632−1.996∗∗∗(0.727)(0.484)CUTTMIN.NORM1981_2010(25,Inf]1.155−0.967(0.814)(0.810)CUTPRCP(0,1]0.304∗∗∗0.085(0.107)(0.102)CUTPRCP(1,2]1.222∗∗∗0.476∗∗(0.290)(0.238)CUTPRCP(2,3]1.333∗∗∗0.923∗∗∗(0.355)(0.339)CUTPRCP(3,Inf]2.091∗∗∗1.272∗∗∗(0.541)(0.416)CUTPRCP.NORM1981_2010(0,1]5.437∗∗0.559(2.677)(0.701)CUTPRCP.NORM1981_2010(1,2]4.383∗0.744(2.615)(0.830)CUTPRCP.NORM1981_2010(2,3]−117.570∗∗∗2.431∗(6.254)(1.255)CUTPRCP.NORM1981_2010(3,Inf]−4.941(7.213)Note:Outputcontinuesonnextpage∗p<0.1;∗∗p<0.05;∗∗∗p<0.01Standarderrorsareinparenthesesandareclusteredonthe1st-leveladmindivision31TableS35:Continued...Alternative(Binned)ClimateNormalsDependentVariable:NighttimeSleepDuration(Minutes)BinnedGHCNDBinnedRean2(1)(2)(Continued)CUTTRANGE(-Inf,0]2.767∗∗−0.939(1.209)(1.171)CUTTRANGE(0,5]0.2740.518∗∗∗(0.174)(0.143)CUTTRANGE(10,15]−0.623∗∗∗−0.791∗∗∗(0.115)(0.143)CUTTRANGE(15,20]−2.093∗∗∗−1.944∗∗∗(0.317)(0.275)CUTTRANGE(20,Inf]−2.203∗∗∗−2.629∗∗∗(0.709)(0.792)CUTTRANGE.NORM1981_2010(0,5]0.614∗0.682∗∗(0.366)(0.302)CUTTRANGE.NORM1981_2010(10,15]0.3470.140(0.265)(0.269)CUTTRANGE.NORM1981_2010(15,20]−0.3190.257(1.105)(0.866)CUTTRANGE.NORM1981_2010(20,Inf]0.967−3.765(3.999)(2.462)CUTCLOUD.REAN2(0,20]0.5190.616∗(0.444)(0.327)CUTCLOUD.REAN2(20,40]0.3610.653∗(0.467)(0.349)CUTCLOUD.REAN2(40,60]0.6300.997∗∗∗(0.459)(0.310)CUTCLOUD.REAN2(60,80]0.987∗∗1.345∗∗∗(0.490)(0.330)CUTCLOUD.REAN2(80,100]1.598∗∗∗2.100∗∗∗(0.464)(0.344)CUTCLOUD.NORM1981_2010(20,40]−0.0030.280(1.227)(0.761)CUTCLOUD.NORM1981_2010(40,60]0.0440.345(1.238)(0.796)CUTCLOUD.NORM1981_2010(60,80]1.1821.166(1.375)(0.835)CUTCLOUD.NORM1981_2010(80,100]1.1120.818(1.665)(1.391)Note:Outputcontinuesonnextpage∗p<0.1;∗∗p<0.05;∗∗∗p<0.01Standarderrorsareinparenthesesandareclusteredonthe1st-leveladmindivision32TableS36:Continued...Alternative(Binned)ClimateNormalsDependentVariable:NighttimeSleepDuration(Minutes)BinnedGHCNDBinnedRean2(1)(2)(Continued)CUTRHUM.REAN2(0,20]−4.873∗∗∗−3.504∗∗∗(1.285)(1.042)CUTRHUM.REAN2(20,40]−1.512∗∗−1.596∗∗∗(0.654)(0.433)CUTRHUM.REAN2(40,60]−0.023−0.174(0.193)(0.156)CUTRHUM.REAN2(80,100]−0.303∗∗−0.074(0.136)(0.130)CUTRHUM.NORM1981_2010(0,20]3.4370.192(9.071)(1.688)CUTRHUM.NORM1981_2010(20,40]−2.623∗−3.004∗∗(1.499)(1.213)CUTRHUM.NORM1981_2010(40,60]−0.878−0.614(0.574)(0.482)CUTRHUM.NORM1981_2010(80,100]0.682∗∗∗0.581∗∗∗(0.218)(0.199)CUTWIND.REAN2(5,10]0.488∗∗∗0.294∗∗∗(0.113)(0.093)CUTWIND.REAN2(10,Inf]0.724∗∗∗0.387∗∗(0.237)(0.178)CUTWIND.NORM1981_2010(5,10]0.1400.139(0.258)(0.197)CUTWIND.NORM1981_2010(10,Inf]−1.089−0.106(1.647)(0.996)YesYesYesYesYesYes4,405,1717,174,6120.2840.2760.2740.269User_FEDate_FEState:MonthFEObservationsR2AdjustedR2ResidualStd.Error77.70777.937Note:∗p<0.1;∗∗p<0.05;∗∗∗p<0.01Standarderrorsareinparenthesesandareclusteredonthe1st-leveladmindivisionTableS37:SplineRegressionModelforClimateSleepLossProjectionsDependentVariable:SleepDuration(Minutes)Knotplacedat10C-20C10CConstant−0.107∗∗∗(0.019)−0.618∗∗∗(0.035)0.000(0.037)YesYesYesYesYes4,405,17177.175De-meanedUserDe-meanedDateDe-meanedState:MonthDe-meanedWeatherControlsDe-meanedClimateNormalsObservationsResidualStd.ErrorFStatistic312.043∗∗∗Note:∗p<0.1;∗∗p<0.05;∗∗∗p<0.01Standarderrorsareinparentheses33TableS38:AcclimatizationTestI:MarginalEffectbySummerMonth(Intra-Annual)DependentVariable:SleepDuration(Minutes)BaseLevel:FirstSummerMonthTMIN−0.831∗∗∗(0.069)TMIN.NORM0.219(0.157)PRCP0.063(0.211)PRCP.NORM3.718∗(2.206)TRANGE−0.571∗∗∗(0.060)TRANGE.NORM−0.245(0.324)CLOUD0.022∗∗∗(0.006)CLOUD.NORM0.019(0.046)HUMID−0.009(0.015)HUMID.NORM−0.023(0.086)WIND0.144∗∗(0.060)WIND.NORM0.200(0.541)TMIN:LAST.SUMMER.MONTH−0.137∗∗(0.066)UserFEYesDateFEYesState:MonthFEYesObservations678,118R20.314AdjustedR20.283ResidualStd.Error75.524Note:∗p<0.1;∗∗p<0.05;∗∗∗p<0.01Standarderrorsareinparenthesesandareclusteredonthe1st-level-admindivision34TableS37:SplineRegressionModelforClimateShort(<7hr.)SleepProjectionsDependentVariable:Short<7hr.SleepProbabilitytminneg200.0004∗∗∗(0.0001)tmin100.003∗∗∗(0.0002)Constant−0.000(0.0002)YesYesYesYes4,405,1710.437De-meanedUserDe-meanedDateDe-meanedState:MonthDe-meanedWeatherControlsDe-meanedClimateNormalsObservationsResidualStd.ErrorFStatistic206.556∗∗∗Note:∗p<0.1;∗∗p<0.05;∗∗∗p<0.01StandarderrorsareinparenthesesYesTableS39:AcclimatizationTestII:DistributedLagModels(Inter-Day)DependentVariable:SleepDuration(Minutes)Tmin7daylagsTmin14daylagsAllweather7daylags(1)(2)(3)TMIN_REAN2−0.202∗∗∗−0.199∗∗∗−0.193∗∗∗(0.024)(0.023)(0.021)TMIN_REAN2_l1−0.100∗∗∗−0.103∗∗∗−0.131∗∗∗(0.015)(0.015)(0.026)TMIN_REAN2_l2−0.045∗∗∗−0.043∗∗∗−0.034(0.014)(0.015)(0.022)TMIN_REAN2_l3−0.039∗∗−0.041∗∗−0.059∗∗∗(0.017)(0.017)(0.021)TMIN_REAN2_l4−0.0004−0.0010.030(0.015)(0.015)(0.022)TMIN_REAN2_l5−0.104∗∗∗−0.103∗∗∗−0.155∗∗∗(0.020)(0.019)(0.028)TMIN_REAN2_l60.097∗∗∗0.095∗∗∗0.136∗∗∗(0.025)(0.025)(0.036)TMIN_REAN2_l70.029∗0.035∗∗0.052∗∗∗(0.015)(0.016)(0.019)TMIN_REAN2_l80.010(0.018)TMIN_REAN2_l9−0.026(0.018)TMIN_REAN2_l10−0.008(0.022)TMIN_REAN2_l11−0.013(0.016)TMIN_REAN2_l120.006(0.017)TMIN_REAN2_l130.068∗∗∗(0.020)TMIN_REAN2_l14−0.024(0.020)TMIN.NORM0.0410.0310.035(0.072)(0.075)(0.073)PRCP_REAN20.280∗∗∗0.272∗∗∗0.229∗∗∗(0.069)(0.068)(0.070)PRCP_REAN2_l1−0.012(0.070)PRCP_REAN2_l20.007(0.068)PRCP_REAN2_l3−0.180∗∗∗(0.068)PRCP_REAN2_l40.090(0.075)PRCP_REAN2_l50.035(0.072)PRCP_REAN2_l6−0.086(0.084)PRCP_REAN2_l70.022(0.085)PRCP.NORM−0.011−0.0110.199(0.963)(0.965)(0.996)Note:Outputcontinuesonnextpage∗p<0.1;∗∗p<0.05;∗∗∗p<0.01Standarderrorsareinparenthesesandareclusteredonthe1st-leveladmindivision35TableS40:Continued...AcclimatizationTestII:DistributedLagModels(Inter-Day)DependentVariable:SleepDuration(Minutes)Tmin7daylagsTmin14daylagsAllweather7daylags(1)(2)(3)(Continued)TRANGE_REAN2−0.202∗∗∗−0.200∗∗∗−0.174∗∗∗(0.024)(0.024)(0.021)TRANGE_REAN2_l1−0.072∗∗(0.035)TRANGE_REAN2_l2−0.012(0.033)TRANGE_REAN2_l3−0.054∗∗(0.027)TRANGE_REAN2_l4−0.016(0.026)TRANGE_REAN2_l5−0.126∗∗∗(0.026)TRANGE_REAN2_l60.135∗∗∗(0.043)TRANGE_REAN2_l70.095∗∗∗(0.029)TRANGE.NORM0.0160.009−0.001(0.081)(0.081)(0.081)CLOUD_REAN20.015∗∗∗0.015∗∗∗0.015∗∗∗(0.002)(0.002)(0.002)CLOUD_REAN2_l1−0.005∗(0.003)CLOUD_REAN2_l2−0.002(0.002)CLOUD_REAN2_l3−0.005∗(0.003)CLOUD_REAN2_l4−0.008∗∗∗(0.002)CLOUD_REAN2_l5−0.009∗∗∗(0.002)CLOUD_REAN2_l6−0.0002(0.003)CLOUD_REAN2_l70.009∗∗∗(0.002)CLOUD.NORM−0.029−0.028−0.023(0.022)(0.022)(0.022)RHUM_REAN20.014∗∗0.014∗∗∗(0.005)(0.005)RHUM_REAN20.030∗∗∗(0.005)RHUM_REAN2_l1−0.019∗∗(0.009)RHUM_REAN2_l20.012∗∗(0.005)RHUM_REAN2_l3−0.008(0.007)RHUM_REAN2_l40.010(0.006)RHUM_REAN2_l5−0.006(0.006)RHUM_REAN2_l60.027∗∗∗(0.008)RHUM_REAN2_l7−0.021∗∗∗(0.005)RHUM.NORM0.092∗∗∗0.091∗∗∗0.092∗∗∗(0.030)(0.030)(0.031)Note:Outputcontinuesonnextpage∗p<0.1;∗∗p<0.05;∗∗∗p<0.01Standarderrorsareinparenthesesandareclusteredonthe1st-leveladmindivision36TableS41:Continued...AcclimatizationTestII:DistributedLagModels(Inter-Day)DependentVariable:SleepDuration(Minutes)Tmin7day_lagsTmin14daylags(1)(2)Allweather7daylags(3)(Continued)WIND_REAN20.113∗∗∗0.115∗∗∗0.105∗∗∗(0.017)(0.017)(0.015)WIND_REAN2_l10.064∗∗∗(0.021)WIND_REAN2_l2−0.024(0.019)WIND_REAN2_l30.078∗∗∗(0.016)WIND_REAN2_l4−0.001(0.022)WIND_REAN2_l5−0.038∗(0.021)WIND_REAN2_l60.054∗∗∗(0.018)WIND_REAN2_l7−0.077∗∗∗(0.018)WIND.NORM−0.137−0.139−0.094(0.148)(0.153)(0.137)YesYesYesYesYesYesYesYesYes7,174,5557,174,4167,160,0920.2760.2760.2760.2690.2690.269UserFEDateFEState:MonthFEObservationsR2AdjustedR2ResidualStd.Error77.93677.93677.932Note:∗p<0.1;∗∗p<0.05;∗∗∗p<0.01Standarderrorsareinparenthesesandareclusteredonthe1st-leveladmindivision37TableS42:AlternativeUnitofAnalysis:Admin1_Day(LinearModel)DependentVariable:SleepDuration(Minutes)LinearTMINTMIN−0.343∗∗∗(0.035)TMIN.NORM1981_2010−0.688∗∗∗(0.143)PRCP0.011(0.165)PRCP.NORM1981_2010−2.161(3.129)TRANGE−0.200∗∗∗(0.030)TRANGE.NORM1981_20100.198(0.307)CLOUD_REAN20.011∗∗∗(0.003)CLOUD.NORM1981_20100.027(0.046)RHUM_REAN20.028∗∗(0.011)RHUM.NORM1981_20100.037(0.037)WIND_REAN20.125∗∗∗(0.029)WIND.NORM1981_20101.272∗∗∗(0.246)UserFEYesDateFEYesState:MonthFEYesObservations86,098R20.697AdjustedR20.666ResidualStd.Error18.233Note:∗p<0.1;∗∗p<0.05;∗∗∗p<0.01Standarderrorsareinparenthesesandareclusteredonthe1st-leveladmindivision38TableS43:AlternativeUnitofAnalysis:Admin1_Day(BinnedModel)DependentVariable:SleepDuration(Minutes)FlexibleTMINGHCNDCUTTMIN(-Inf,-15]3.894∗∗∗(1.251)CUTTMIN(-15,-10]1.250(1.048)CUTTMIN(-10,-5]1.684∗∗∗(0.611)CUTTMIN(-5,0]0.596(0.403)CUTTMIN(0,5]0.843∗∗∗(0.277)CUTTMIN(10,15]−2.221∗∗∗(0.302)CUTTMIN(15,20]−5.197∗∗∗(0.493)CUTTMIN(20,25]−8.000∗∗∗(0.672)CUTTMIN(25,Inf]−9.608∗∗∗(1.413)TMIN.NORM1981_2010−0.640∗∗∗(0.141)CUTPRCP(0,1]0.312(0.215)CUTPRCP(1,2]0.328(0.412)CUTPRCP(2,3]1.172∗(0.610)CUTPRCP(3,Inf]0.335(1.168)PRCP.NORM1981_2010−2.463(3.211)CUTTRANGE(-Inf,0]0.625(1.394)CUTTRANGE(0,5]0.272(0.222)CUTTRANGE(10,15]−0.909∗∗∗(0.177)CUTTRANGE(15,20]−1.786∗∗∗(0.386)CUTTRANGE(20,Inf]−3.833∗∗∗(1.316)TRANGE.NORM1981_20100.113(0.326)Note:Outputcontinuesonnextpage∗p<0.1;∗∗p<0.05;∗∗∗p<0.01Standarderrorsareinparenthesesandareclusteredonthe1st-leveladmindivision39TableS44:Continued...AlternativeUnitofAnalysis:Admin1_Day(BinnedModel)DependentVariable:NighttimeSleepDuration(Minutes)BinnedGHCND(1)(Continued)CUTCLOUD_REAN2(0,20]1.402(0.962)CUTCLOUD_REAN2(20,40]1.677∗(0.981)CUTCLOUD_REAN2(40,60]1.422(0.982)CUTCLOUD_REAN2(60,80]1.899∗∗(0.955)CUTCLOUD_REAN2(80,100]2.499∗∗(0.971)CLOUD.NORM1981_20100.028(0.039)CUTRHUM_REAN2(0,20]3.230(4.148)CUTRHUM_REAN2(20,40]0.193(1.469)CUTRHUM_REAN2(40,60]−0.152(0.358)CUTRHUM_REAN2(80,100]0.204(0.202)RHUM.NORM1981_20100.060(0.047)CUTWIND_REAN2(5,10]0.225(0.165)CUTWIND_REAN2(10,Inf]0.876∗∗(0.340)WIND.NORM1981_20101.216∗∗∗(0.266)YesYesYes86,0980.6980.666UserFEDateFEState:MonthFEObservationsR2AdjustedR2ResidualStd.Error18.228Note:∗p<0.1;∗∗p<0.05;∗∗∗p<0.01Standarderrorsareinparenthesesandareclusteredonthe1st-leveladmindivision40TableS45:AlternativeTemperatureVars:Minimumvs.MaxDailyTemperature(nodiurnaltemprange)DependentVariable:SleepDuration(Minutes)TMINTMAX(1)(2)BothTMINandTMAX(3)TMIN−0.226∗∗∗−0.087∗∗∗(0.026)(0.033)TMIN.NORM−0.222∗∗∗−0.233(0.079)(0.151)TMAX−0.264∗∗∗−0.208∗∗∗(0.018)(0.023)TMAX.NORM−0.1190.055(0.081)(0.147)PRCP0.628∗∗∗0.221∗∗0.484∗∗∗(0.114)(0.109)(0.120)PRCP.NORM1.5702.105∗∗2.118∗(1.062)(0.957)(1.085)CLOUD_REAN20.012∗∗∗0.011∗∗∗0.010∗∗∗(0.002)(0.002)(0.002)CLOUD.NORM−0.025−0.060∗∗∗−0.039(0.024)(0.022)(0.024)RHUM_REAN20.025∗∗∗−0.0010.001(0.007)(0.007)(0.008)RHUM.NORM0.080∗∗0.084∗∗0.104∗∗∗(0.036)(0.036)(0.040)WIND_REAN20.138∗∗∗0.123∗∗∗0.128∗∗∗(0.021)(0.020)(0.022)WIND.NORM−0.296−0.308∗∗−0.296(0.184)(0.157)(0.188)UserFEYesYesYesDateFEYesYesYesState:MonthFEYesYesYesObservations4,704,1225,029,2114,405,171R20.2840.2830.284AdjustedR20.2740.2740.274ResidualStd.Error77.75977.57177.708Note:∗p<0.1;∗∗p<0.05;∗∗∗p<0.01Standarderrorsareinparenthesesandareclusteredonthe1st-leveladmindivision41TableS46:AlternativeClusteringSpecifications:LinearModelsDependentVariable:SleepDuration(Minutes)ClusteronAdmin1RegionClusteronAdmin1RegionandDateofStudy(1)(2)TMIN−0.294∗∗∗−0.294∗∗∗(0.027)(0.053)TMIN.NORM−0.164∗∗−0.164(0.079)(0.111)PRCP0.482∗∗∗0.482∗∗(0.120)(0.212)PRCP.NORM2.251∗∗2.251(1.132)(1.646)TRANGE−0.207∗∗∗−0.207∗∗∗(0.023)(0.050)0.0380.038(0.145)(0.177)0.010∗∗∗0.010∗(0.002)(0.005)−0.042∗−0.042(0.024)(0.046)0.0010.001(0.008)(0.015)0.099∗∗∗0.099(0.038)(0.065)0.128∗∗∗0.128∗∗∗(0.022)(0.047)TRANGE.NORMCLOUD_REAN2CLOUD.NORMRHUM_REAN2RHUM.NORMWIND_REAN2WIND.NORM−0.270−0.270(0.193)(0.254)UserFEYesYesDateFEYesYesState:MonthFEYesYesObservations4,413,8624,413,862R20.2840.284AdjustedR20.2740.274ResidualStd.Error77.71677.716Note:∗p<0.1;∗∗p<0.05;∗∗∗p<0.01Standarderrorsareinparenthesesandareclusteredatthespecifiedlevels42TableS47:AlternativeClusteringSpecifications:BinnedModelsDependentVariable:SleepDuration(Minutes)ClusteronAdmin1ClusteronAdmin1andDateofStudy(1)(2)3.308∗∗3.308(1.456)(2.222)3.118∗∗∗3.118∗∗(0.863)(1.382)2.003∗∗∗2.003∗(0.670)(1.086)0.849∗0.849(0.476)(0.770)0.4250.425(0.392)(0.644)0.653∗∗∗0.653∗(0.246)(0.369)−1.956∗∗∗−1.956∗∗∗(0.220)(0.394)−4.368∗∗∗−4.368∗∗∗(0.333)(0.580)−6.358∗∗∗−6.358∗∗∗(0.448)(0.769)−7.240∗∗∗−7.240∗∗∗(0.604)(1.066)−11.360∗∗∗−11.360∗∗∗(1.766)(1.984)−0.193∗∗∗−0.193∗(0.074)(0.108)0.301∗∗∗0.301(0.105)(0.228)1.221∗∗∗1.221∗∗(0.290)(0.507)1.316∗∗∗1.316∗∗∗(0.350)(0.491)2.105∗∗∗2.105∗∗∗(0.545)(0.641)2.302∗∗2.302(1.145)(1.660)2.693∗∗2.693∗∗(1.214)(1.212)0.2680.268(0.175)(0.229)−0.584∗∗∗−0.584∗∗∗(0.113)(0.223)−2.002∗∗∗−2.002∗∗∗(0.299)(0.592)−2.047∗∗∗−2.047∗∗(0.726)(0.854)CUTTMIN(-Inf,-20]CUTTMIN(-20,-15]CUTTMIN(-15,-10]CUTTMIN(-10,-5]CUTTMIN(-5,0]CUTTMIN(0,5]CUTTMIN(10,15]CUTTMIN(15,20]CUTTMIN(20,25]CUTTMIN(25,30]CUTTMIN(30,Inf]TMIN.NORMCUTPRCP(0,1]CUTPRCP(1,2]CUTPRCP(2,3]CUTPRCP(3,Inf]PRCP.NORMCUTTRANGE(-Inf,0]CUTTRANGE(0,5]CUTTRANGE(10,15]CUTTRANGE(15,20]CUTTRANGE(20,Inf]TRANGE.NORM−0.048−0.048(0.143)(0.175)Note:Outputcontinuesonnextpage∗p<0.1;∗∗p<0.05;∗∗∗p<0.01Standarderrorsareinparenthesesandareclusteredonthespecifiedlevel(s)43TableS48:Continued...AlternativeClusteringSpecifications:BinnedModelsDependentVariable:SleepDuration(Minutes)ClusteronAdmin1ClusteronAdmin1andDateofStudy(1)(2)0.4910.491(0.437)(0.480)0.3560.356(0.459)(0.532)0.6220.622(0.451)(0.563)0.971∗∗0.971∗(0.481)(0.590)1.599∗∗∗1.599∗∗(0.456)(0.686)−0.033−0.033(0.023)(0.044)−4.617∗∗∗−4.617∗∗∗(1.221)(1.355)−1.611∗∗∗−1.611∗∗(0.615)(0.794)−0.014−0.014(0.190)(0.399)−0.329∗∗−0.329(0.136)(0.262)0.095∗∗0.095(0.038)(0.063)0.480∗∗∗0.480∗∗(0.118)(0.187)0.774∗∗∗0.774(0.232)(0.486)CUTCLOUD_REAN2(0,20]CUTCLOUD_REAN2(20,40]CUTCLOUD_REAN2(40,60]CUTCLOUD_REAN2(60,80]CUTCLOUD_REAN2(80,100]CLOUD.NORMCUTRHUM_REAN2(0,20]CUTRHUM_REAN2(20,40]CUTRHUM_REAN2(40,60]CUTRHUM_REAN2(80,100]RHUM.NORMCUTWIND_REAN2(5,10]CUTWIND_REAN2(10,Inf]WIND.NORM−0.297−0.297(0.201)(0.257)YesYesYesYesYesYes4,413,8624,413,8620.2840.2840.2740.274UserFEDateFEState:MonthFEObservationsR2AdjustedR2ResidualStd.Error77.71577.715Note:∗p<0.1;∗∗p<0.05;∗∗∗p<0.01Standarderrorsareinparenthesesandareclusteredonthespecifiedlevel(s)44TableS49:AlternativeInclusionCriteria:With/WithoutDatafromLowerandUpperMiddleIncomeCountriesDependentVariable:SleepDuration(Minutes)BinnedTMINAllCountries(1)BinnedTMINOnlyHighIncome(2)3.316∗∗7.310∗∗∗(1.456)(1.205)3.093∗∗∗2.514∗∗(0.866)(1.112)2.018∗∗∗1.997∗∗(0.670)(0.793)0.867∗0.324(0.477)(0.489)0.4270.177(0.392)(0.391)0.658∗∗∗0.526∗∗(0.248)(0.251)−1.956∗∗∗−1.780∗∗∗(0.219)(0.231)−4.379∗∗∗−4.088∗∗∗(0.334)(0.352)−6.397∗∗∗−6.118∗∗∗(0.450)(0.479)−7.243∗∗∗−6.954∗∗∗(0.605)(0.649)−10.766∗∗∗−9.429∗∗∗(1.769)(1.760)−0.208∗∗∗−0.186∗∗(0.079)(0.090)0.298∗∗∗0.309∗∗∗(0.106)(0.112)1.218∗∗∗1.324∗∗∗(0.292)(0.299)1.330∗∗∗1.320∗∗∗(0.350)(0.367)2.106∗∗∗2.150∗∗∗(0.541)(0.569)2.163∗∗2.337∗∗(1.096)(1.144)2.690∗∗3.031∗∗(1.212)(1.340)0.2610.204(0.176)(0.181)−0.590∗∗∗−0.551∗∗∗(0.113)(0.116)−2.029∗∗∗−1.995∗∗∗(0.299)(0.323)−2.124∗∗∗−1.817∗∗(0.726)(0.717)−0.0290.003(0.145)(0.153)0.5220.695(0.438)(0.461)0.3820.510(0.461)(0.490)0.6580.782(0.453)(0.480)1.001∗∗1.135∗∗(0.482)(0.518)1.624∗∗∗1.758∗∗∗(0.458)(0.483)CUTTMIN(-Inf,-20]CUTTMIN(-20,-15]CUTTMIN(-15,-10]CUTTMIN(-10,-5]CUTTMIN(-5,0]CUTTMIN(0,5]CUTTMIN(10,15]CUTTMIN(15,20]CUTTMIN(20,25]CUTTMIN(25,30]CUTTMIN(30,Inf]TMIN.NORMCUTPRCP(0,1]CUTPRCP(1,2]CUTPRCP(2,3]CUTPRCP(3,Inf]PRCP.NORMCUTTRANGE(-Inf,0]CUTTRANGE(0,5]CUTTRANGE(10,15]CUTTRANGE(15,20]CUTTRANGE(20,Inf]TRANGE.NORMCUTCLOUD_REAN2(0,20]CUTCLOUD_REAN2(20,40]CUTCLOUD_REAN2(40,60]CUTCLOUD_REAN2(60,80]CUTCLOUDREAN2(80,100]CLOUD.NORM−0.030−0.036(0.023)(0.025)Note:Outputcontinuesonnextpage∗p<0.1;∗∗p<0.05;∗∗∗p<0.01Standarderrorsareinparenthesesandareclusteredonthe1st-leveladmindivision45TableS50:Continued...AlternativeInclusionCriteria:Withvs.WithoutDatafromLowerandUpperMiddleIncomeCountriesDependentVariable:SleepDuration(Minutes)BinnedTMINAllCountries(1)BinnedTMINOnlyHighIncome(2)(Continued)−4.676∗∗∗−3.776∗∗(1.250)(1.780)−1.480∗∗−0.995(0.625)(0.634)0.009−0.021(0.191)(0.195)−0.328∗∗−0.340∗∗(0.136)(0.139)0.101∗∗0.115∗∗∗(0.039)(0.042)0.484∗∗∗0.439∗∗∗(0.118)(0.129)0.779∗∗∗0.821∗∗∗(0.230)(0.239)CUTRHUM_REAN2(0,20]CUTRHUM_REAN2(20,40]CUTRHUM_REAN2(40,60]CUTRHUM_REAN2(80,100]RHUM.NORMCUTWIND_REAN2(5,10]CUTWIND_REAN2(10,Inf]WIND.NORM−0.324∗−0.317(0.194)(0.199)YesYesYesYesYesYes4,405,1714,116,0440.2840.2860.2740.277UserFEDateFEState:MonthFEObservationsR2AdjustedR2ResidualStd.Error77.70777.501Note:∗p<0.1;∗∗p<0.05;∗∗∗p<0.01Standarderrorsareinparenthesesandareclusteredonthe1st-leveladmindivision46TableS51:NighttimeSleepInterruptionsLinearProbabilityModelDependentVariable:awakeningduringsleep(prob>=1awakenings)LinearTMIN(GHCND)tmin0.00002(0.0001)tmin_norm_w7−0.0003(0.0004)prcp0.002∗∗∗(0.0005)prcp_norm_w70.011∗∗(0.005)trange−0.00003(0.0001)trange_norm_w7−0.001(0.001)cloud_rean20.00002∗∗(0.00001)cloud_norm_7_rean2−0.0003∗(0.0002)rhum_rean20.00004(0.00003)rhum_norm_7_rean20.0004∗∗(0.0002)wind_rean20.0004∗∗∗(0.0001)wind_norm_7_rean20.005∗∗(0.003)UserFEYesDateFEYesState:MonthFEYesObservations4,405,171R20.171AdjustedR20.160ResidualStd.Error0.425Note:∗p<0.1;∗∗p<0.05;∗∗∗p<0.01Standarderrorsareinparenthesesandareclusteredonthefirstadminlevel47