Coal2022VIP专享VIP免费

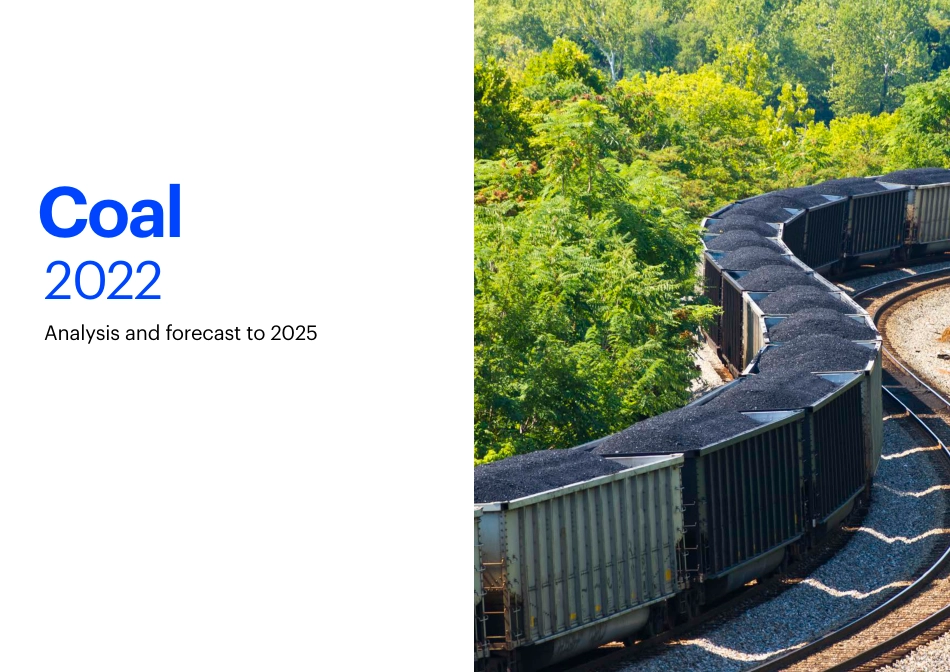
Coal
Analysis and forecast to 2025
2022
The IEA examines the full spectrum of energy
issues including oil, gas and coal supply and
demand, renewable energy technologies,
electricity markets, energy efficiency, access to
energy, demand side management and much
more. Through its work, the IEA advocates
policies that will enhance the reliability,
affordability and sustainability of energy in its 31
member countries, 11 association countries and
beyond.
This publication and any map included herein are
without prejudice to the status of or sovereignty
over any territory, to the delimitation of
international frontiers and boundaries and to the
name of any territory, city or area.
Source: IEA.
International Energy Agency
Website: www.iea.org
IEA member countries:
Australia
Austria
Belgium
Canada
Czech Republic
Denmark
Estonia
Finland
France
Germany
Greece
Hungary
Ireland
Italy
Japan
Korea
Lithuania
Luxembourg
Mexico
Netherlands
New Zealand
Norway
Poland
Portugal
Slovak Republic
INTERNATIONAL ENERGY AGENCY
Spain
Sweden
Switzerland
Republic of Türkiye
United Kingdom
United States
The European Commission
also participates in the work
of the IEA
IEA association countries:
Argentina
Brazil
China
Egypt
India
Indonesia
Morocco
Singapore
South Africa
Thailand
Ukraine
Coal 2022
PAGE | 3
Abstract
IEA. CC BY 4.0.
Abstract
Coal sits in the centre of climate and energy discussions because it
is the largest energy source globally for electricity generation and
for the production of iron and steel and of cement, as well as the
largest single source of carbon dioxide (CO2) emissions. The
current energy crisis has forced some countries to increase their
reliance on coal in spite of climate and energy targets.
Coal 2022 offers a thorough analysis of recent trends in coal
demand, supply, trade, costs and prices against a backdrop of
rising concern about energy security and geopolitical tensions. It
also provides forecasts to 2025 for demand, supply and trade by
region and by coal grade. The report contains a deep analysis of
China, whose influence on the coal market is unparalleled by any
other country and in any other fuel.
The IEA’s Coal Market Report has been published every December
since 2011, becoming the global benchmark for coal demand,
supply and trade forecasts. It is essential reading for anyone with an
interest in climate and energy.
CoalAnalysisandforecastto20252022TheIEAexaminesthefullspectrumofenergyissuesincludingoil,gasandcoalsupplyanddemand,renewableenergytechnologies,electricitymarkets,energyefficiency,accesstoenergy,demandsidemanagementandmuchmore.Throughitswork,theIEAadvocatespoliciesthatwillenhancethereliability,affordabilityandsustainabilityofenergyinits31membercountries,11associationcountriesandbeyond.Thispublicationandanymapincludedhereinarewithoutprejudicetothestatusoforsovereigntyoveranyterritory,tothedelimitationofinternationalfrontiersandboundariesandtothenameofanyterritory,cityorarea.Source:IEA.InternationalEnergyAgencyWebsite:www.iea.orgIEAmembercountries:AustraliaAustriaBelgiumCanadaCzechRepublicDenmarkEstoniaFinlandFranceGermanyGreeceHungaryIrelandItalyJapanKoreaLithuaniaLuxembourgMexicoNetherlandsNewZealandNorwayPolandPortugalSlovakRepublicINTERNATIONALENERGYAGENCYSpainSwedenSwitzerlandRepublicofTürkiyeUnitedKingdomUnitedStatesTheEuropeanCommissionalsoparticipatesintheworkoftheIEAIEAassociationcountries:ArgentinaBrazilChinaEgyptIndiaIndonesiaMoroccoSingaporeSouthAfricaThailandUkraineCoal2022PAGE3AbstractIEA.CCBY4.0.AbstractCoalsitsinthecentreofclimateandenergydiscussionsbecauseitisthelargestenergysourcegloballyforelectricitygenerationandfortheproductionofironandsteelandofcement,aswellasthelargestsinglesourceofcarbondioxide(CO2)emissions.Thecurrentenergycrisishasforcedsomecountriestoincreasetheirrelianceoncoalinspiteofclimateandenergytargets.Coal2022offersathoroughanalysisofrecenttrendsincoaldemand,supply,trade,costsandpricesagainstabackdropofrisingconcernaboutenergysecurityandgeopoliticaltensions.Italsoprovidesforecaststo2025fordemand,supplyandtrade–byregionandbycoalgrade.ThereportcontainsadeepanalysisofChina,whoseinfluenceonthecoalmarketisunparalleledbyanyothercountryandinanyotherfuel.TheIEA’sCoalMarketReporthasbeenpublishedeveryDecembersince2011,becomingtheglobalbenchmarkforcoaldemand,supplyandtradeforecasts.Itisessentialreadingforanyonewithaninterestinclimateandenergy.Coal2022PAGE4IEA.CCBY4.0.TableofcontentsTableofcontentsExecutivesummary.........................................................................................5Demand...........................................................................................................10Supply.............................................................................................................35Trade...............................................................................................................53ThermalCoal................................................................................................57MetallurgicalCoal.........................................................................................66Pricesandcosts............................................................................................72Prices...........................................................................................................73Costs............................................................................................................86Coalminingprojects.....................................................................................95Generalannex..............................................................................................107Coal2022PAGE5IEA.CCBY4.0.ExecutivesummaryExecutivesummaryCoal2022PAGE6IEA.CCBY4.0.ExecutivesummaryExecutiveSummaryGlobalcoaldemandissettorisein2022amidtheupheavaloftheenergycrisisCoalmarketshavebeenshakenseverelyin2022,withtraditionaltradeflowsdisrupted,pricessoaringanddemandsettogrowby1.2%,reachinganall-timehighandsurpassing8billiontonnesforthefirsttime.Inlastyear’sannualmarketreport,Coal2021,wesaidthatglobalcoaldemandmightwellreachanewpeakin2022or2023beforeplateauingthereafter.Despitetheglobalenergycrisis,ouroveralloutlookremainsunchangedthisyear,asvariousfactorsareoffsettingeachother.Russia’sinvasionofUkrainehassharplyalteredthedynamicsofcoaltrade,pricelevels,andsupplyanddemandpatternsin2022.Fossilfuelpriceshaverisensubstantiallyin2022,withnaturalgasshowingthesharpestincrease.Thishaspromptedawaveoffuelswitchingawayfromgas,pushingupdemandformoreprice-competitiveoptions,includingcoalinsomeregions.Nonetheless,highercoalprices,strongdeploymentofrenewablesandenergyefficiency,andweakeningglobaleconomicgrowtharetemperingtheincreaseinoverallcoaldemandthisyear.InChina,whichaccountsfor53%ofglobalcoalconsumption,prolongedandstringentCovid-19lockdownshaveweighedheavilyoneconomicactivity,underminingcoaldemand.Atthesametime,droughtsandheatwavesinChinathissummeracceleratedcoalburningtomeetasurgeinpowerdemandforairconditioning.Coalusedinelectricitygeneration,thelargestconsumingsector,isexpectedtogrowbyjustover2%in2022.Bycontrast,coalconsumptioninindustryisexpectedtodeclinebyover1%,mainlydrivenbyfallingironandsteelproductionamidtheeconomiccrisis.GlobalcoalpowergenerationrisestorecordlevelsIn2022,highnaturalgaspricesledtosignificantfuelswitchingtocoalinelectricitygenerationinEurope,althoughbothgasandcoalgenerationincreasedasthegrowthofwindandsolarwasinsufficienttofullyoffsetlowerhydroandnuclearpoweroutput.InChina,lowhydropoweroutputinthesummeramidabigheatwavepushedcoalpowergenerationsignificantlyhigher.InAugust,coalpowergenerationinChinaincreasedbyaround15%year-on-yeartoover500terawatt-hours(TWh).Thismonthlylevelofgenerationishigherthanthetotalannualcoalpowergenerationofanyothercountry,exceptIndiaandtheUnitedStates.InIndiaandChina,wherecoalisthebackboneofelectricitysystemsandgasaccountsforjustafractionofpowergeneration,theimpactofsteepergaspricesoncoaldemandhasbeenlimited.Nevertheless,increasedcoaluseinthesecountrieshasreplacedsomegas,whichhasbeenpurchasedbyotherregionswillingtopaymoreforit.Coalpowergenerationwillrisetoanewrecordin2022,surpassingits2021Coal2022PAGE7IEA.CCBY4.0.Executivesummarylevels.ThisisdrivenbyrobustcoalpowergrowthinIndiaandtheEuropeanUnion(EU)andbysmallincreasesinChina–anditcomesdespiteadeclineintheUnitedStates.Europe’sU-turnoncoalistemporaryEurope–andtheEuropeanUnioninparticular–hasbeenoneoftheregionshardesthitbytheenergycrisis,givenitsrelianceonRussianpipelinesuppliesofnaturalgas.Lowerhydroandnuclearpoweroutputduetoweatherconditions,combinedwithtechnicalproblemsinFrenchnuclearpowerplants,putadditionalstrainsontheEuropeanelectricitysystem.Inresponse,someEuropeancountrieshaveincreasedtheiruseofcoalpowergenerationwhilealsoacceleratingthedeploymentofrenewablesand,insomecases,extendingthelifetimesofnuclearplants.Underthethreatofgasshortagesandpotentialissuesensuringsufficientpowersystemadequacy,somecoalplantsthathadcloseddownorbeenleftinreservehavere-enteredthemarket.Inmostcountries,thisinvolvedalimitedamountofcoalpowercapacity.OnlyinGermany,with10gigawatts(GW),isthereversalatasignificantscale.ThishasincreasedcoalpowergenerationintheEuropeanUnion,whichisexpectedtoremainatthesehigherlevelsforsometime.ButredoubledeffortstoimproveenergyefficiencyandexpandrenewableswillseeEUcoalgenerationanddemandreturntoadownwardtrajectoryassoonas2024inourforecast.Globalcoaldemandissettoplateauthrough2025,butmuchdependsondevelopmentsinChinaInourforecast,globalcoaldemandplateausaroundthe2022levelof8billiontonnesthrough2025.However,giventhecurrentenergycrisiswithallitsuncertainties,alurchintogrowthorcontractionispossible.Thiscouldbedrivenbychangesinglobaleconomicactivity,weatherconditions,fuelpricesorgovernmentpolicies–amongmanyotherpotentialvariables.DevelopmentsinChinamaywellhavethelargestimpactontheoutlookforglobalcoaldemand,sinceChinaaccountsformorethanhalfofit.China’spowersectoraloneaccountsforone-thirdofglobalcoalconsumption.CoalconsumptioninChinagrewstronglyin2021,butgrowthisexpectedtoremainrelativelystagnantatanaverageof0.7%ayearto2025,largelybecauseoftheincreaseinrenewablepowergeneration.Inthe2022-2025period,weexpectChina’srenewablepowergenerationtoincreasebyalmost1000TWh,equivalenttothetotalpowergenerationofJapantoday.Meanwhile,India’scoalconsumptionhasdoubledsince2007atanannualgrowthrateof6%–anditissettocontinuetobethegrowthengineofglobalcoaldemand.Bycontrast,coaluseisforecasttomaintainitsdownwardtrajectoryintheUnitedStates,andtofallconsiderablyintheEuropeanUnionby2025.Atagloballevel,weexpectnewrenewablegenerationtocoveralmost90%ofadditionalelectricitydemandthrough2025.WithamodestincreaseinnuclearpowergenerationandhighgasCoal2022PAGE8IEA.CCBY4.0.Executivesummarypricesprevailing,coalpowergenerationincreasesslightlyto2025.Therefore,intheabsenceoflow-emissionsalternativesthatcanreplacecoalatscaleintheironandsteelsectorinthenearterm,globalcoaldemandissettoremainflatthroughourforecastperiod.Anall-timehighforcoalproductionin2022ChinaandIndia,theworld’slargestcoalconsumers,arealsothebiggestproducersand,inaddition,thetoptwocoalimporters.Inresponsetopricerisesandsupplyshortages,Chinaand,toalesserextent,India,pushedupdomesticcoalproductionaftersummer2021.InMarch2022,Chineseproductionreachedanewmonthlyhighanditissettorisetoanewannualrecord,withexpectedgrowthof8%forthefullyear,reducingtheneedforimportsandreplenishingstocks.InIndia,thegovernmenthastriedtoincreaseproductionforalongtimetoreduceimports.In2021,coalproductionreached800milliontonnesforthefirsttime.Inourforecast,India’sproductionsurpasses1billiontonnesby2025.Indonesia,theworld’sthird-largestproducer,isalsoexpectedtoexpandproductiontoreachanewhighin2022,withexportsplayingamoreimportantrolethandomesticdemand.WithminorgrowthintheUnitedStatesandeveninEurope,globalcoalproductionwillriseabove8billiontonnesin2022,itshighestlevelever.InternationalcoaltradeisreshufflingasaresultofRussiasanctionsRussia’sinvasionofUkrainehastriggeredaseriesofbansandsanctionsonRussiabymanycountriesandcompanies.Russiaisthethirdlargestcoalexporterintheworldandthesanctionshaveasaresultgivenrisetoareshufflingofglobaltradeflowsasbuyers,especiallyinEurope,seekalternativesupplies.Inaddition,owingtothelackofrailcapacity,partoftheRussiancoalvolumespreviouslysentbyrailtoEuropeorshippedfromnorthwesternRussianportstowardsEuropecannotberedirectedtotheeastorthesouth.ThishasresultedinadeclineofRussianexportsandatighteningofthemarket.ThegapleftbyRussiancoalsuppliesinEuropehasbeenlargelyfilledbySouthAfrica,ColombiaandothersmallerproducerssuchasTanzaniaandBotswana.Indonesia,whichstartedtheyearbanningcoalexportsinordertomeetitsowndomesticdemand,onceagaindemonstrateditsflexibilityasitshifteditsexportstoEuropetohelpoffsettheRussianshortfall.Bycontrast,theUnitedStatesisnotaswingsupplieranymore.Strugglingwithinvestment,workforceshortagesandtransportbottlenecks,UScoalexportsaresettodeclinemarginallydespitehighprices.Meanwhile,rainsandfloodsinAustraliahavecurtailedproduction,contributingtothetightmarket.Tightmarketsandwarpremiumpropelledcoalpricestorecordlevelsin2022SupplyanddemandimbalancescombinedwithhighgaspricespushedthermalcoalpricestounprecedentedhighsinOctober2021.Almostimmediately,ChinaandIndiaacceleratedproductioninordertoeasethemarket,andpricessoonfellbacktolowerlevels.WhenIndonesiabannedexportsinJanuary2022,internationalpricesroseagainwhileChinesepricesremainedmoreCoal2022PAGE9IEA.CCBY4.0.Executivesummarystable,asthelocalmarketwaswellsupplied.Russia’sinvasionofUkraineinlateFebruary,however,sparkedasurgeingasprices,whichinturnpushedcoalpricesuptonewrecordsinMarchandduringthesummer.Furthersupportforpricescamefromawarpremiumandanincreasingperceptionofariskofphysicalenergyshortages.Priceshavemoderatedsincethesummerassupplyworrieshaveeased.RainsinAustraliafurtherexacerbatedmarkettightnessduringtheyear,exceptionallypushingpricesforhigh-qualitythermalcoalabovethoseforhigh-valuecokingcoal.WiththeEUbanonRussiancoalphasedinfromApriltoearlyAugust,pricesforRussiancoalhavebeensharplydiscounted.Despiterecordprofitsforproducers,thereislittleappetiteformoreinvestmentincoalminingassetsTherecordhighsforcoalpricesseensinceOctober2021andarenewedfocusonenergysecuritysinceRussia’sinvasionofUkrainemighthavebeenexpectedtodriveanuptickininvestmentincoalmineassets.However,outsideChinaandIndia,wheredomesticproductionhasbeenrampeduptoreduceexternalreliance,therearenostrongsignsofreversaloftheinvestmenttrends.Governments,banksandinvestors–aswellasminingcompanies–continuetoshow,ingeneral,alackofappetiteforinvestmentincoal,particularlythermalcoal.Coal2022PAGE10DemandIEA.CCBY4.0.DemandCoal2022PAGE11DemandIEA.CCBY4.0.Globalcoaldemandbreaches8billiontonnesthresholddespiteslowgrowthin2022Globalcoalconsumptionreboundedbyastrong6%to7929milliontonnes(Mt)in2021,afterasharpdeclinethepreviousyearduetotheonsetoftheCovid-19pandemic.Arobusteconomicrecovery,especiallyincountriesthatrelyheavilyoncoal,suchasthePeople’sRepublicofChina(hereafter“China”)andIndia,whilehighernaturalgaspricespromptedawaveoffuelswitchingtocoal,withpowergenerationup8%to5344Mt.Increasedindustrialactivityboostedcoalusefornon-powerapplicationsby2.2%to2585Mt.Chinaisbyfarthelargestcoal-consumingcountry,accountingfor53%ofglobaldemand.Overall,China’scoalconsumptionincreasedby4.6%to4232Mtin2021,withthestrongestgrowthinthefirsthalfoftheyearbeforeslowinginthesecondhalf.CoaldemandinIndia,thesecond-largestconsumer,increasedbyanevensharper14%,or128Mt,in2021.OthercountriesreportingsignificantgainsweretheUnitedStates(+15%/+66Mt),Germany(+19%/+26Mt)andPoland(+12%/+13Mt).Onlyafewcountriesrecordeddeclineslastyear,withSouthAfricapostingthelargestfallat-5%(-9Mt).Bycontrast,globaldemandgrowthforcoalisexpectedtoslowmarkedlyin2022,risingbyjust1.2%butstillreachinganewrecordof8025Mt,slightlyabovethe2013level(7997Mt).Thelowergrowthlargelyreflectstheweakerglobaleconomy,withGDPforecasttoaverage3.2%in2022asitstruggleswiththeenergycrisis,risinginflationandstrainedsupplychaindisruptions.Nevertheless,aconvergenceoffactorsissupportinganincreaseincoaldemand.First,tightnaturalgassuppliesandtheresultinghighgaspricesaredrivingsomecountriesandcompaniestoturntorelativelycheapercoal.Second,heatwavesanddroughtsinsomeregionsoftheworlddroveupelectricitydemandandreducedhydropowergeneration,creatingagapthathadtobefilledbymostlydispatchablethermalpowerplants.Last,nuclearpowergenerationwasexceptionallyweakin2022,especiallyinEurope,whereFrancehadtoshutdownasignificantportionofitsnuclearcapacityformaintenance.ThelargestincreaseincoaldemandthisyearisexpectedinIndia(+7%/+70Mt),followedbytheEuropeanUnion(+6%/+29Mt)andChina(+0.4%/+18Mt),mainlyledhigherbystrongerpowersectoruse.Still,whilecoal-firedpowergenerationinChinaandIndiaisrisingtokeeppacewithstrongerdemand,someEuropeancountrieshavebeentemporarilyswitchingtocoalduetorecord-highpricesfornaturalgas,lowhydropowergeneration,andmaintenance-relatedclosuresatnuclearplants.AsignificantdeclineincoalconsumptionisseenintheUnitedStates(-6%/-31Mt),wheretheshiftfromcoal-togas-firedpowergenerationcontinuesandcoalproducersstruggleafteryearsofunderinvestment.Coal2022PAGE12DemandIEA.CCBY4.0.Globalcoalconsumptionsettoplateauthrough2025Globalcoalconsumption,2000-2025IEA.CCBY4.0.Changesinglobalcoalconsumption,2020-2025IEA.CCBY4.0.0100020003000400050006000700080009000200020052010201520202025MtChinaIndiaOtherAsiaUnitedStatesEuropeanUnionRestofworld75117929802580381068211787373974007500760077007800790080008100820083002020202120222025MtRestofworldOtherAsiaChinaIndiaUnitedStatesEuropeanUnionTotalCoal2022PAGE13DemandIEA.CCBY4.0.Globalcoalpowergenerationhitsanotherrecordin2022Totalelectricitydemandreboundedby5.2%in2021asthestrongrecoveryintheglobaleconomyandadverseweatherconditionsboostedconsumption.Inresponsetolowhydropowergenerationandweakwindconditionsinsomeregions,coal-firedgenerationroseby8%(+762TWh),intandemwithan8%increase(+392Mt)incoalconsumptioninthepowersector.Growthinelectricitydemandhasmoderatedtoanestimated3%in2022,temperedbytheslowdownintheworldeconomy,whichoffsetincreasedpoweruseduetoexceptionalheatwavesinsomeregions.ElectricitydemandgrowthinChinaandIndiaisabovetrend,andforecasttoriseby4%and7%,respectively.Renewableenergywillmeetapproximately88%oftheadditionaldemandin2022,whiletheresidualof~221TWhwillbecoveredbycoalandnaturalgas.Thecurrentgasshortageandresultinghigherpricesaresupportingcoal-basedpowergenerationworldwide,notablyintheEuropeanUnion,wherenaturalgasisparticularlyexpensiveduetotheRussianFederation(hereafter“Russia”)cuttingsupplies.InChinaandIndia,wheregasdoesnotplayabigroleinpower,theimpactofhighgaspricesoncoaldemandismoremuted.Consequently,someEuropeancountriespostponedscheduledclosuresofcoalpowerplantsandactivatedcoal-firedreservecapacitytolimitgasusageinthepowersector.Intotal,weforecastcoalpowergenerationtoincreaseby1.8%to10339TWh,anewall-timehigh.Overall,weexpectcoaldemandforpowergenerationtoriseby2.4%to5472Mt,withChinaconsumingmorethanhalfoftheincrease.From2022to2025,globalelectricitydemandisforecasttogrow2.8%annuallyonaverage,orbyanabsoluteof~2496TWh.Renewableenergywillprovidethemajorityshareofadditionaldemandat90%.Theremaininggapof~83TWhwillbecoveredbycoal-andgas-firedpowergeneration.ThelargestincreasesincoalburnareforecastforChina(+5%),India(+7%)andSoutheastAsia(+14%).Meanwhile,coal-firedpowergenerationwillcontinuetocontractintheUnitedStates(-18%)whileareturntoadecliningtrajectoryisexpectedfortheEuropeanUnion(-29%).Coal2022PAGE14IEA.CCBY4.0.DemandStronggrowthinrenewableswillsupplylion’sshareofadditionalpowerdemand,withcoalandgasfillingtheremainingmodestgapAdditionalglobalpowerdemandandgenerationbysource,2021-2025IEA.CCBY4.0.Gaspricemarkers,2020-2025IEA.Allrightsreserved.Source:ArgusMediagroup.Allrightsreserved.82824977202255-1131591750500100015002000250030002021-20222022-2025TWhAdditionalpowerdemandRenewablesNuclearandothersCoalGas010203040506070USD/MBtuTTFHenryHubCoal2022PAGE15IEA.CCBY4.0.DemandNon-powerthermalcoalconsumptionstablein2022-2025Outsidethepowersector,thermalcoalisusedinvariousotheroperations,suchascementproductionorindustrialandresidentialheatapplications.In2021,non-powerthermalcoalconsumptionincreasedby2.8%to1475Mt,accountingfor22%oftotalthermalcoaluse.Indiapostedthelargestincreaseinthermalcoaldemandfornon-poweruses,up16%in2021,mainlyduetostronggrowthinindustrialproduction.InChina,demandroseonlymarginally(+0.8%),drivenbythecountry’seffortstoreducethermalcoaluseintheresidentialsectorbutalsobyathermalcoalshortageinthesecondhalfof2021,whichweighedonindustrialconsumption,e.g.cementproduction.In2022,thermalcoaldemandfornon-powerpurposesisexpectedtoremainstableasgrowthinIndiaoffsetsadeclineinChina.AnoverallweakeconomicperformanceisbehindthedownturninChina’sdemand.Inparticular,lowercementproductionweighedonthermalcoaldemandasdidongoingeffortstoreducecoalconsumptionforresidentialheatingandsmallindustries.Bycontrast,thermalcoalconsumptionintheconversionsector(i.e.coal-to-liquidsandcoal-to-gas)roseaspartofChina’sstrategytoincreaseenergysecuritybyproducingfeedstockssuchashydrogenfromdomesticcoal.India’sthermalcoaldemandoutsidethepowersectorisexpectedtorise7%in2022becauseofhigherindustrialoutput.From2022to2025,thermalcoaldemandfornon-poweruseisforecasttorise0.3%peryearasindustrialproductioncontinuestoexpand,especiallyinIndia.However,non-poweruseinChinaissettocontinuecontracting,withincreaseddemandfromtheconversionsectormorethanoffsetbylowerconsumptioninhighenergy-intensiveindustriesandsustainedeffortstoreducecoalinheatingandsmallindustries.Changesinthermalcoalconsumptionfornon-powerpurposesbyregion,2020-2025IEA.CCBY4.0.-500501002020-20212021-20222022-2025MtChinaIndiaSoutheastAsiaOtherAsiaEuropeanUnionRestofworldWorldCoal2022PAGE16IEA.CCBY4.0.DemandAfteradropin2022,globalmetallurgicalcoaldemandtoremainstablethrough2025Metallurgical(met)coal,whichincludescokingcoal(hard,mediumandsemi-soft)andpulverisedcoalinjection(PCI)coal,isaprimaryingredientinsteelmaking.Furthermore,coke(producedbyheatingcokingcoalintheabsenceofoxygen)isusedtoproducecarbides,ferroalloysandothercompounds.Therefore,ourforecastisbasedonsteelproductionprojectionsfromorganisationssuchastheWorldSteelAssociationaswellasoutlooksforindustrialproduction,GDPgrowth,amongotherfactors.Globalmetcoalconsumptionincreased1.3%to1110Mtin2021,assteelproductionrecoveredfromapandemic-relateddeclineinmostmajorsteel-producingregions,includingIndia(+13%/+9Mt),theEuropeanUnion(+13%/+7Mt)andtheUnitedStates(+28%/+4Mt).However,inChina,theworld’slargeststeelproducer,metcoaldemandfellby2.5%(-19Mt)asenergyshortagesandaweakerconstructionsectorcurbedsteeloutput.Bycontrast,in2022totalmetcoalconsumptionisexpectedtodeclineby2.7%,or30Mt,largelyduetohighenergypricesandslowerglobaleconomicgrowth.ThelargestdeclineisexpectedinChina(-1.7%/-12Mt),followedbyRussia(-6%/-4Mt)andtheEuropeanUnion(-3.9%/-2.3Mt).From2022to2025,metcoalconsumptionisforecasttobestableAt1078Mtby2025,demandformetallurgicalcoalisforecasttobewellbelowthepre-pandemiclevel,asChina’ssteelproductionisexpectedtoremainmuted.Intotal,loweruseintheEuropeanUnion,Japan,Korea,Russia,andChinaisoffsetbyastrongdemandincreaseinIndiaandtherestoftheworld,mainlySoutheastAsia.Metcoalconsumptionandannualchanges,2020-2025IEA.CCBY4.0.Changesinmetallurgicalcoalconsumption,2022-2025IEA.CCBY4.0.020040060080010001200202020212022MtChinaIndiaRussiaEuropeanUnionJapanKoreaRestofworld-40-20020402020-20212021-2022Mt1080107814164368106010801100112020222025MtTotalChinaIndiaRussiaEuropeanUnionJapanandKoreaRestofworldCoal2022PAGE17IEA.CCBY4.0.DemandChina'scoalconsumptionreboundedin2021butthereafterplateausthrough2025China’seconomygrewstronglyinthefirsthalfof2021,drivingthecountry’scoaldemandhigher.Coalsupplycouldnotkeeppacewithdemandgrowthinthefirstsixmonthsoftheyear,however,leadingtosevereshortagesstartinginthesecondhalfof2021,evenaseconomicgrowthslowed.China’scoaluserose4.6%forthefullyearto4232Mt,thehighestever.Whereasthermalcoalconsumptionincreased6.2%to3511Mt,mainlyforpowergeneration,metallurgical(met)coaldemanddeclinedby2.5%to720Mt,hamperedbyenergyshortagesandasluggishconstructionsector.Afterpostingstronggrowthlastyear,in2022China’seconomyweakened,inlargepartduetothegovernment’szero-Covidpolicythathasledtoseverelockdownsandweighedheavilyondomesticconsumption,industrialproductionandsupplychainbottlenecks.Inaddition,thecollapseofChina'srealestatemarkethassharplyreducednewconstructionactivity,whichhasupendeddemandforcementandsteel.China'seconomyisexpectedtoexpandbyonly3.1%in2022.Exceptforthepandemicyear2020,thisisthelowesteconomicgrowthsince1977.For2022,weexpectcoal-firedpowergenerationtoincreasemodestly(+1.8%),resultingincoaldemandof2664Mt.Thermalcoaldemandfornon-powerusesisexpectedtodeclineby1.8%,andmetallurgicalcoalconsumption,primarilyforsteelproduction,by-1.7%.Overall,thepowersector’sgrowthdominates,andChina’scoaldemandwillreachanewall-timehighof~4250Mtin2022,slightlyabovethe2021level(+0.4%).OurforecastforChina’scoaldemandthrough2025isunderpinnedbytwokeyassumptions:growthinGDPandindustrialproduction.Weassumeannualgrowthof~4.7%onaverageforGDPand~5%forindustrialproduction.China’selectricitydemandisforecasttoincreaseby~5%.Basedontheseassumptions,weexpectChina’scoalconsumptionwillriseataslowerrateof0.7%annually,thoughitwillstillreachanewhighof4337Mtby2025.Growthwillbedrivenmainlybythepowersector,despiteintenseeffortstoexpandnuclearandrenewableenergycapacity.Thermalcoaldemandinnon-powersectorswillmaintainthedecliningtrendofrecentyearsassmall,inefficientcoalboilersarecontinuouslyreplacedbygas,districtheating,andelectricsolutions.China’smetcoalconsumptionappearstohavealreadyreachedapeakin2021,andwillstabiliseandslightlydeclineuntil2025.Outsideofpower,theonlysectorwithincreasingcoaldemandiscoalconversion,e.g.theproductionofliquidfuels,syntheticmethaneandchemicalsfromcoal.Coal2022PAGE18IEA.CCBY4.0.DemandYear-on-yearpercentagechangesforvariouseconomicindicatorsinChina,January-October2022IEA.CCBY4.0.Note:Coal-firedpowergenerationvaluesarenotavailableonamonthlybasis.Source:NationalBureauofStatisticsofChina(2022),StatisticalDatabase.AnnualchangesincoalconsumptionbygradeanduseinChina,2022-2025IEA.CCBY4.0.-20%-15%-10%-5%0%5%10%15%20%ThermalgenerationSteelproductionCementproduction-40-200204060802022202320242025MtSteamcoal(power)Steamcoal(non-power)MetcoalChangeincoalconsumptionCoal2022PAGE19IEA.CCBY4.0.DemandCoal-firedpowergeneration–thebackboneofChina’selectricitysystemChinaisbyfarthelargestcoal-consumingcountry,accountingfor53%oftheworld’sdemand.Coalamountstomorethan60%ofthecountry'sprimaryenergyconsumption1,makingitthebackboneofChina’seconomy.Thepowersector2wasresponsiblefor~62%ofChina’stotalcoaldemandin2021,or2617Mt.Inthefirsthalfof2022,coalconsumptioninChina'spowersectorfellbyanestimated3%duetoacombinationofweakerdemandandasharpyear-on-yearriseinhydropowergeneration.However,inthesecondhalfoftheyear,asevereheatwaveledtohigherelectricitydemandforcoolingwhileadroughtincentralandsouthwestChinareducedhydropowergeneration.Asaresult,electricityshortagesdevelopedinsomehydropower-reliantregions,suchasSichuan.Meanwhile,coal-firedpowergenerationreachedahistorichighof~530TWhinAugustamidsoaringtemperatures.Asaresult,coaldemandforpowergenerationisexpectedtopartiallyrecoverinH22022andincreaseby1.8%fortheyearasawhole.Chinacommissionedatotalof~26GWofnewcoal-firedpowerplantsin2021.Bycontrast,coal-firedcapacityadditionsare1InaccordancewithChinesestatistics,whichusesdifferentmetrics,itis56%.expectedtoremainatalowlevelin2022,withonly7.5GWrecordedinthefirstsixmonthsoftheyear.In2021,constructionstartedon33GWofcoal-firedpowerplants,themostsince2016.Inanticipationoffurtherpowershortages,whichfirstemergedinDecember2020andreturnedagaininsummer2021,thegovernmentplanstobuildmorecoal-firedplantstoensureadequatecapacityinthefuture.Newpermitsforcoal-firedpowerplantsincreasedagaininthefirsthalfof2022,withChinaapprovingatotalcapacityof15GWcoal-firedpowerplants.In2021,Chinaaccountedfor~55%oftheglobalcoalpowercapacityunderdevelopmentandtheshareisexpectedtogrowin2022.InGuangdongprovince,14GWofnewcapacitywasapprovedthispastsummer–thefirstnewcoalpowerplantapprovalsinfiveyears.Electricitydemandisexpectedtogrowbyanaverageof~4.8%annuallyuntil2025.Althoughweforecastelectricitygenerationfromrenewablesandnucleartoincreaseby11%and4.4%,respectively,peryear,thisisinsufficienttomeetdemandgrowth.Followingthepowershortagesin2020and2021andthedraughtin2022,nationalandlocalgovernmentsintendtofurtherissuemorepermits2IncludesdistrictheatingCoal2022PAGE20IEA.CCBY4.0.Demandfornewcoalpowerplants,withapotentialofupto270GWcoal-firedpowerplantcapacityby2025,accordingtoforecastsbyChinaEnergy.Iftheseplansarerealised,theadditionalcapacitywouldtotalmorethananyothercountryintheworldcurrentlyhasinstalled.However,itisunlikelythattheadditionalcoal-firedpowerplantswillbeoperatedatfullcapacity,astheyarelargelyintendedtoensureenergysecurityandarethereforenotexpectedtodirectlyincreasecoalconsumptioninChina’spowersector.Moreover,theadditionalcapacityisnotanticipatedtobecommencedtoasignificantextentbefore2025,soitdoesnotimpactthegenerationcapacityincludedinthisreport.Overall,weassumecoal-firedpowergenerationwillincreaseby2.3%peryearto~5731TWhby2025,correspondingtoprojectedconsumptionof~2803Mt.However,uncertaintyaboutChina’sactualcoal-firedgenerationoutputremainsascoldsnapsandheatwavescansuddenlyandsignificantlyincreasedemandforelectricity.Ascoal-firedpowergenerationislargelythedefaultelectricitysupplierinChina,volatileelectricitydemanddirectlytranslatesintofluctuationsincoalconsumption.Moreover,asrenewablegenerationcapacityincreases,weatherconditionswillhaveagreaterimpactonthesupplyofelectricityand,thus,ondemandforthermalpowerplantstofillthegenerationgap.Ofparticularconcern,rainfallandwindconditionscanvarysignificantlyfromyeartoyear.China’srisingpowergenerationanddemand,2020-2025IEA.CCBY4.0.0100020003000202020212022202320242025TWhRenewablesNuclear,gas,oil,otherCoalandcoalproductsDemandCoal2022PAGE21IEA.CCBY4.0.DemandChina’snon-powerthermalcoaldemanddecreasesslightly,despitegrowthincoalconversionThermalcoalconsumptioninnon-powerapplicationsroseto895Mt(+0.8%)in2021,accountingfor~21%ofChina’scoaluse.ThisissimilartothetotalcoaldemandinAsia,outsideofChinaandIndia.Heavy,energy-intensiveindustriesconsumeabouthalfofthenon-powerthermalcoal,ofwhich~50%isusedincementproduction.Thesubstitutionofcoalwithotherenergysourcesforcementandbuildingmaterialmanufacture,seeninrecentyears,isexpectedtocontinueslowly.Moreimportantly,theslumpintherealestatesectorandconstructionactivityarecurrentlyaddingdownwardpressureoncementproduction.Cementoutputfellby11%fromJanuarytoOctoberthisyearcomparedto2021.InSeptember,Chinaannouncedthatemissionsfromitscementindustrywouldpeakbefore2023.However,basedonthelatestproductionnumbers,wedonotexpectthesectortorecoverquickly.Giventhedecliningshareofthecementindustryinoverallcoalconsumption,webelieveChina’scementindustry'sdemandforcoalalreadypeakedin2021.Asaresult,thermalcoalconsumptioninheavyindustriesisforecasttodeclinein2022byabout1.8%to878Mt.Until2025,itisexpectedtocontinuedecliningto840Mt(-4%).Approximatelyone-quarterofnon-powerthermalcoaldemandhasbeenusedforresidentialheatingandlightaswellasnon-energy-intensiveindustriesin2021.Thissharehasdeclinedinrecentyearsthankstoeffortstoreduceairpollutionbyreplacingsmall,inefficientcoalboilerswithgasandelectricoptions.Althoughhighgaspricesareslowingtheprocess,provincesandcitiesareexpectedtocontinuewitheffortsforsubstitution.AgrowingnicheofChina’snon-powerthermalcoalconsumptioniscoalconversion(coal-to-liquids,coal-to-gas,coal-to-chemicals).Thedirectionofthissectorhasbeenunclearinrecentyears,asthegoalofincreasingenergysecuritybyreducingoilandgasimportsandChina’sclimategoalshaveconflicted.Thecurrentfocusonenergysecurityandhighoilandgaspricesisanincentiveforcoalconversionprojects,generallyusinglocal,evenstranded,coal.ChinaEnergyGroupcommissioneda400000tonnes(t)coal-to-ethyleneglycolconversionprojectinNovember2021anda350000tcoal-to-hydrogenconversionprojectinYulin,ShaanxiinSeptember2022.Until2025,weforecastthecoalconversionsectortogrowbyjustabove10%peryear.China’smetallurgicalcoalconsumptiondeclinedslightlyin2021to720Mt(-2.5%),accountingforabout17%ofthecountry’scoaldemandand~65%oftheglobalmetcoaldemand.Thedeclinereflectedtheweaknessoftheconstructionsector,whichweighsonthecountry’ssteeldemand.BecauseofCovid-19restrictions,in2022scrapcollectionhasbeenpoorandthereforethepigiron/steelratioincreased.Oncethepandemicisundercontrol,weexpectthetrendtoreverse.China’smetcoaldemandisforecasttodeclineby1.7%in2022andfallby2%intotaluntil2025astheeconomicoutlookismixedandtheshareofscrapmetalisexpectedtoincrease.Coal2022PAGE22IEA.CCBY4.0.DemandRobusteconomicgrowthfuelsIndia'sappetiteforcoalin2022India’scoalconsumptionsurgedto1033Mtin2021,a14%reboundfromapandemiclowin2020.About93%(~959Mt)ofthecountry’scoaldemandwasthermalcoal(includinglignite),mainlyforelectricitygeneration(757Mt).Therestwasmetcoalusedprimarilyinsteelproduction(75Mt).Demandforbothtypesofcoalincreasedstrongly:by14%forthermalcoaland13%formetcoal.For2022,weexpecta7%increaseincoaldemand.Despitetheslowdowninglobalgrowth,theIndianeconomyisdoingexceptionallywell,withGDPforecasttoexpandby7.3%thisyear.Coaldemandislargelybeingledhigherbyasharpincreaseinelectricityconsumption,ofwhicharound73%willbegeneratedbycoal-firedpowerplantsin2022.Weexpectelectricitydemandtogrowby7%duetorobusteconomicgrowth.DemandwasalsosupportedbythesevereheatwavefromMarchtoearlyMay.InApril,thedailypowerdeficitamountedto~5%ofoverallsupplyonnationallevelandupto15%inafewstates.Withsuchtightelectricitymarkets,weexpectcoalconsumptioninthepowersectortoincreaseby7%in2022.Coal-intensiveindustries,suchasthecementandsteelsectors,continuedtogrowin2022.FromJanuarytoSeptember,monthlycementproductionaveraged11%higheryear-on-year.ThegrowthratepeakedinMaybeforeslowinginJulywhentheonsetofthemonsoonseasoncurbedconstructionactivity.Monthlyspongeironandhotmetalproductionincreasedbyanaverageofabout1%and6%,respectively.Overall,weexpect2022thermalcoalconsumptionoutsidethepowersectortoriseby7%andmetcoalby2%.Year-on-yearpercentagechangesforvariouseconomicindicatorsinIndia,January-October2022IEA.CCBY4.0.Source:IEAbasedonMcCloskey(2022).McCloskeyCoal,MetalsandMiningService-15%-10%-5%0%5%10%15%20%25%30%PowergenerationCementproductionSpongeironproductionHotmetalproductionCoal2022PAGE23IEA.CCBY4.0.DemandIndia’scoaldemandcontinuestoincreasethrough2025Coal-firedelectricitygenerationaccountsforabout73%ofIndia’soverallpowerneedsandwillremainthemostimportantsourceofelectricityintheforeseeablefuture.Coal-firedpowerplantsmakeup50%oftheoverallinstalledcapacityof404GWconnectedtogrids,withanother25GWcurrentlyunderconstruction.WeexpectIndia’scoaldemandtorisesteadilyto~1220Mtin2025,withashareof8%formetallurgicalcoaland92%forthermalcoal.Nevertheless,bytargetingashareof50%renewablesinitspowermixby2030,Indiaseekstoalleviatetheelectricitysector’sdependencyoncoalandreducethecostofenergygeneration.Indiafacilitatesinvestmentinrenewablesbymandating81coal-firedpowerplantstoreducepowergenerationbyatotalofabout58TWhoverthenextfouryears,however,withoutshuttingdownanyofits172powerplantsconnectedtothegrid.Additionally,Indiaplanstoestablishacarbonmarket,consolidatingexistingcertificatemarketsrelatedtoenergyefficiencyandrenewableenergyobligations.Indiaistargetinganemissionreductionof45%ofitsGDP’semissionintensityfrom2005to2030.Withproductionofabout344Mt,Indiaaccountedforabout8%ofglobalcementproductionin2021,rankingsecondafterChina,whichhasashareof~55%oftheworld’sproduction.ProductioninIndiaisexpectedtogrowsubstantiallyuntil2025andbeyond.India’scementproducers,suchasDalmiaBharat,UltratechandAdani,plantoalmostdoubletheirproductioncapacityfrom~225Mtpatoabout425Mtpaintotalbytheendofthedecade,whichimpliesincreasingcapacitythrough2025.Togetherwithhighersteelproduction,weforecastthecountry’scoaldemandfornon-powerpurposestogrow~20%by2025.Atthesametime,thegovernmentofIndiahasconfirmeditstargettogasify100Mtpaofcoalby2030.AnnualchangesincoalconsumptionbytypeanduseinIndia,2021-2025IEA.CCBY4.0.05010015020212022202320242025MtMetcoalSteamcoal(non-power)Steamcoal(power)Coal2022PAGE24IEA.CCBY4.0.DemandYearlychangeinpowergenerationbysource,2021-2025IEA.CCBY4.0.-100010020020212022202320242025TWhRenewablesNuclear,gas,oil,otherCoalandcoalproductsCoal2022PAGE25IEA.CCBY4.0.DemandUScoaldemandcontinuesitsdownwardtrajectoryIntheUnitedStates(US),coal-firedpowergenerationremainsondownwardtrendafterabriefbutstrongrecoveryof15%in2021.Expansionofrenewablesisacceleratingwhilethecoalpowerfleetcontinuestocontract.Morethan6GWofcoal-firedcapacitywasretiredorconvertedin2021andalmost13GWisscheduledtobeclosedin2022.Limitedaccesstocoalduetologisticalissuesandhighpricesinglobalmarketshaveputadditionalpressureoncoal-firedgeneration,increasingtheshareofrenewablesandnaturalgas,despitethehigherprices,inelectricitygeneration.Coal'sshareinelectricitygenerationisexpectedtoeasefrom23%in2021to20%in2022.Overall,weforecasta6.3%declineincoalconsumptionintheUnitedStates,to465Mt,inlinewithshut-incoal-firedelectricitygeneration,whichaccountsfor92%oftotalcoalconsumption.Coal-firedpowergenerationwillcontinuetodeclineinthecomingyears,withtotalcapacityof22GWeitherretiredorplantsconvertedby2025.Moreover,weexpecttheUSInflationReductionActtoacceleratethetransitiontocleanenergy,furtherreducingUScoaldemand.TheActwillfundalmostUSD400billioninenergyandclimatechangespending,andincludesmorespendingoncleanenergiesandexpansionofenergyinfrastructure.AlthoughtheActincludescarboncaptureandstorageprojects(CCUS)thatcouldpotentiallyusecoal,wedonotexpectthistoimpactcoaldemanduntil2025.Asaresult,coal'sshareintheelectricitymixisprojectedtofalltojust16%,correspondingtoan18%dropincoalusefromthe2022level.Thedeclinecouldbeevensteeperiftheeconomicsituationworsens.ChangeinUScoal-firedgenerationcapacity,2010-2025IEA.CCBY4.0.Notes:Capacityvaluesfor2022to2025arebasedonannouncedretirements.Sources:EIA(2022),ElectricPowerMonthlyandEIA(2022),CoalData.-20-15-10-505102010201120122013201420152016201720182019202020212022202320242025HistoryForecastGWCommissionedRetiredCoal2022PAGE26IEA.CCBY4.0.DemandEUcoaldemandreboundsamidhighgaspricesbeforedecliningin2024-2025TheEuropeanUnion’s(EU)coaldemandsteadilydeclinedforadecadeuntilitreachedalowpointin2020amidtheCovid-19pandemicandextraordinarilylowgaspricesundercutcoal-firedpowergeneration.However,in2021,tightergasmarketsandtheresultingriseingaspricessawcoal-firedpowergenerationbecomecompetitiveagain,despitehigherEuropeanUnionAllowance(EUA)pricesforcarbonemissions.3Overall,coalconsumptionintheEuropeanUnionsurgedby14%in2021,ledmainlybyaresurgenceinthepowersectorinresponsetothepost-Covideconomicrecoveryandhighergasprices.Russia’sinvasionofUkraineinFebruary2022hasupendedbothcoalandgasmarketsandforcedEuropeancountriestoimplementaseriesofmeasurestoreplaceRussiansuppliestomeetcoaldemandthisyearandin2023.ThelossofRussiangasimportssignificantlyexacerbatedalreadytightsuppliesinEuropeandpropelledpricestorecordhighs.Also,availablenuclearcapacityandweakhydropowerhavelimitedalternativesourcesintheEU’selectricitymix.Giventheacutegassupplyshortagesandresultingunprecedentedhighgasprices,countriesandutilitiesthroughouttheregionareturningtowardcoal,whichremainsmoreprice3Insomecases,suchasco-generationplants,additionalrevenuestreamshavetobeconsideredwhenassessingtheprofitabilityofgenerationunits.competitivethangasdespitetheEU’simplementationofsanctionsoncoalimportsfromRussiaon10August.TheEuropeanUnionusedtoimportaround45%ofitscoalfromRussia,orabout52Mt,in2021.Germany,PolandandtheNetherlandsaretheEU’slargestimportersofRussiancoal.Inadditiontosecuringalternativesupplies,EUcountrieshaveimplementedaseriesofpolicymeasurestoreducegasuse.AnumberofEUcountries(Germany,Finland,France,theNetherlands,Spain,Italy,Denmark,Greece,theCzechRepublic,HungaryandAustria)areextendingthelifetimeofcoal-firedpowerplants,restartingclosedplantsorliftingexistingcapsongeneration.Inmostofthesecountries,thisaffectssmallgenerationcapacity,withGermanytheexception.Germanycreateda”gasreplacementreserve”withatotalcapacityof11.6GW.Itincludes1.9GWofligniteand4.3GWofhardcoalpowerplants,thatarenowallowedtoreturntothemarketuntilApril2024.Thedecommissioningof2.6GWofhardcoalpowercapacityand1.2GWoflignitecapacityhasbeenpostponed.Theremaining1.6GWisfromoil-firedpowerplants.Bycontrast,inPoland,thesecond-largestcoalconsumerinEurope,weexpectonlyaslightincreaseincoal-firedpowerCoal2022PAGE27IEA.CCBY4.0.Demandgenerationthisyeargivenlimitedcapacity.Previously,Russiasupplied20%ofPoland’sdomesticcoalneeds.Amidthesechallenges,coalconsumptionbytheEU’spowersectorisexpectedtoincrease9%,orby31Mt,toatotalof377Mtin2022,whichwouldbeclosetopre-pandemicdemandlevelsin2019.Non-powerindustrialcoaldemandisexpectedtodeclineby~2.3%becauseofhighenergyprices.Thecurrentforwardmarketsindicatethatthemarginalcostsofcoal-firedpowerplantswillbefarbelowthoseofgas-firedpowerplantsinthenextfewyears.Thiswouldonlychangein2025whenforwardgaspricesarelowenoughtoplaceefficientgas-firedpowerplantsaheadofinefficientcoal-firedones.However,lignite-firedpowerplantsareexpectedtoremainverycompetitiveuntil2025.AlthoughEuropeanelectricitymarketsareexpectedtoremaintightduetoongoinggasshortagesandtheGermanphase-outofnuclearpower,weexpectEUcountriestocontinuemovingforwardwiththeirplanstophaseoutcoal-firedpowergenerationfrom2024onwards.Germany,inparticular,planstoreduceitspowerplantfleetby6.2GWofhardcoaland2.9GWoflignitepowerplantcapacityfrom2021to2025.Inviewofafirmramp-upofelectricityproductionfromrenewablesandarecoveryinFrenchnuclearpower,ourmodelsindicatethatGermany,theEU’slargestcoal-firedpowergenerator,willturnfromanetexporterofelectricitytoanetimporterinthisperiod.Despitegaspricesremainingatahighlevel,Germany’scoal-firedpowergenerationand,thus,thethermalcoaldemandinthepowersectorisexpectedtodecreaseby57Mttoabout93Mtin2025.Bycontrast,Polishcoal-firedpowergenerationisexpectedtoremainrelativelyfirmuntil2025,resultinginadeclineofthermalcoaldemandinthepowersectorby6%.Overall,coalconsumptionintheEuropeanUnionisexpectedtodecreasesignificantly,from478Mtin2022to371Mtin2025,althoughuncertaintysurroundingthegasmarketcouldaffecttheoutlookforcoaldemand.IntheRepublicofTürkiye(hereafter“Türkiye”),coalconsumptionisforecasttoreboundin2022and2023beforeitstartsdecliningduetoincreasedrenewableenergyoutpacingelectricitydemand.Theshort-termriseispartiallydrivenbythenew1.3GWHunutlucoalpowerplant,whichcommencedoperationinSeptember2022andpushedimportedcoal-firedgenerationtoanall-timehighinNovember.Coal2022PAGE28IEA.CCBY4.0.DemandEuropeanUnionmarginalcoal-andgas-firedpowergenerationcosts,2020-2025IEA.Allrightsreserved.Notes:TTF=TitleTransferFacility.EUA=EuropeanUnionAllowance.CCGT=combined-cyclegasturbine.API=Argus/McCloskey’sCoalPriceIndex.JCC=JapanCrudeCocktail.CCGTnetefficiency:49-58%.Coalnetefficiency:35-46%.Lignitenetefficiency:39%.Sources:ArgusMediagroup.Allrightsreserved.AndIEAestimates.050100150200250300350400450500050100150200250300350400450500Jan-20Jan-21Jan-22Jan-23Jan-24Jan-25EUR/tEUR/MWhCoal(leftaxis)CCGT(leftaxis)TTF(gas)(leftaxis)API2(coal)(rightaxis)EUA(rightaxis)Germanlignite(leftaxis)Coal2022PAGE29IEA.CCBY4.0.DemandHighgaspricessupportcoaldemandinmatureAsiaPacificeconomiesthrough2025InJapan,coal-firedpowergenerationdeclinedby1.1%in2021duetostagnatingelectricitydemandandincreasednuclearpowergeneration.In2022,Japan’scoaldemandisforecasttoriseby1.8%asoperatorsshunhigher-pricednaturalgas.Thecountry’slargelong-termLNGsupplycontractshavelargelyshieldedoperatorsfromcurrentsteepgaspricesandimpactedcoal-firedpowergeneration,anessentialpillarofJapan’selectricitysector,onlytoalesserextent.Thermalcapacitywillincreasebyabout1.03GWintotal,ofwhichcoal-firedcapacitywillaccountforanetgainofabout0.7GW.Forwardpricesindicatethatcoalwillremaincompetitivewithspotgasforpowergenerationthrough2025.Inresponsetohigherelectricitypricesandeffortstoreinforceenergysecurity,Japanannouncedtheintentiontoextentthelifetimeoffourofits33availablenuclearpowerplantsto60years.InKorea,coaldemandforpowergenerationincreased6.3%in2021duetostrongerdemandandrisingLNGprices.SimilartoJapan,Koreanutilitiesprocureliquefiednaturalgasthroughlong-termcontracts,protectingthecountryfromrecord-highspotpricesthisyear.However,opportunitycostsarehighand–atthemargin–coalremainscost-competitivewithgas.Tosubstituteexpensivegas-firedgeneration,Koreasuspendedgenerationcapsandtemporaryshutdownsforcoalpowerplantsin2022.However,coalconsumptionforpowergenerationisexpectedtoremainunchanged(-0.2%)assomeoldcoal-firedunitswereclosedin2021,andnuclearandrenewablepowergenerationrose.Therestartofthe1.4GWShinHanual1nuclearreactorhasbeenannouncedandisexpectedtotakeplacebeforetheendof2022.In2023,coal-firedpowergenerationisprojectedtoincreaseasthe2GWAninpowerstationisscheduledtobecomeoperationalandhighspotgaspricespersist.By2025,however,Koreancoal-firedpowergenerationwilldeclinesomewhatandreachaboutthesamelevelasin2022,despitethecommissioningofanother2GWcoal-firedcapacity(Samcheokpowerstation),asoldunitsaredecommissionedandpowergenerationfromrenewablesincreases.ChineseTaipei’scoalconsumptionamountedto63Mtin2021,ofwhich48Mtwasusedinpowergeneration.Weexpectcoalconsumptiontoremainrelativelyconstantin2022.By2025,coaldemandisforecasttoincreaseby~2.6Mt,despitethecountry’splantoreachnet-zeroemissionsin2050.Accordingtotheplan,asof2025,nocoal-firedpowerplantswillbeconstructedordecommissioned.However,withthephaseoutofnuclearpowergenerationby2025,renewablecapacityexpansioncannotkeeppacewithgrowingdemand,leadingtoincreasedcoal-firedgeneration.InAustralia,coalconsumptionisforecasttocontractasgrowthinrenewableenergyoutpaceselectricitydemand.TheAustralianpowerplantfleetisindeclineinthemediumterm.Thelargestcoalpowerplant,the2.9GWEraringpowerstation,isexpectedtocloseinmid-2025,sevenyearsaheadofschedule.Coal2022PAGE30IEA.CCBY4.0.DemandKoreanmarginalcoal-andgas-firedpowergenerationcosts,2020-2025IEA.Allrightsreserved.Notes:JCC=JapanCrudeCocktail.CCGTnetefficiency:40-55%.Coalnetefficiency:35-46%.Sources:IEAestimatesandArgusMediagroup.Allrightsreserved.050100150200250300050100150200250300Jan-20Jan-21Jan-22Jan-23Jan-24Jan-25USD/tUSD/MWhCoal(leftaxis)CCGT(leftaxis)GasJCC-indexed(rightaxis)Coal2022PAGE31IEA.CCBY4.0.DemandCoaldemandinSoutheastAsiaontheriseCoalconsumptioninSoutheastAsiatotalled361Mtin2021,up1.5%fromthepreviousyear.ThelargestcoalconsumersintheregionareIndonesia(41%)andVietNam(26%),followedbyThailand(9%),Malaysia(9%)andthePhilippines(9%).For2022,weexpectcoalconsumptiontoriseby3.8%inSoutheastAsia,largelydrivenbystronggrowthinIndonesia.From2022to2025,weexpectcoalconsumptiontogrowby~4%peryearonaverage,pushingtotalconsumptionto422Mt.Theforecastisbasedonastrongeconomicoutlookfortheregion,somecoalpowerprojectsunderdevelopment(totalcapacityof18GW,ofwhich7.3GWwasapprovedin2021),andIndonesia’sabundantcoalsupply.MostofSoutheastAsia’scoal-firedpowerplantprojectsareinIndonesiaandVietNam.Thisyear,AdaroEnergystartedoperationsatthenew2GWBatangcoalpowerplantandBukitAsamatits1.32GWSumel8inIndonesia,andthe1.2GWNghoSon2powerplantcommencedoperationinVietNam.Bothgovernmentsannouncedplanstostopthedevelopmentofnewcoal-firedpowergeneration,asof2023forIndonesiaandinthelongertermforVietNam.Theimportanceofcoal-firedgeneration,however,isabouttoincreaseintheforeseeablefutureastherearestillseveralcoal-firedpowerplantsunderconstructioninIndonesia,andinVietNamthe1.2GWVungAng2isexpectedtobegingenerationin2025.AfterChina’scommitmenttostoptheconstructionofcoalplantsoverseasseveralprojectshavebeencancelled.However,thisisnotexpectedtoaffectcoalconsumptionthrough2025.Indonesia’scoaldemandamountedto148Mtin2021andwillgrowby~9%in2022.InJanuary2022,highpricesandheavyrainfallsthreateneddomesticcoalsuppliesandIndonesianutilitiesranlowonsuppliesasminersfocusedonexporting.Inresponse,thegovernmenttookanunprecedentedsteptobanallcoalexportsforamonthtoensuresuppliestodomesticpowerplants.Until2025,weexpectIndonesia’scoalconsumptiontogrowby~4.7%annually,ledbytheexpansionofthecountry’scoalpowerplantfleetbyupto10GW.VietNamrecordedconsumptionof84Mtthermalcoaland9Mtmetcoalin2021.Inthefirsthalfof2022,thehighavailabilityofhydropowerandcurtailmentduetosupplyshortagesofdomesticcoalreducedtheshareofcoal-firedgenerationto40%oftheoverallelectricitygeneration.Thetotalelectricitygenerationincreasedyear-on-yearbyabout4.5%.Forthesecondhalfof2022,furthergrowthinelectricitydemandisexpectedfollowingaheatwavethatboosteddemandforcoolinginnorthernpartsofthecountrycoupledwithstrongereconomicgrowthof7.7%in2022.Inviewofhighrenewableandhydropowergeneration,weexpectVietNam’scoalconsumptiontodeclineby2.1Mtto~91Mt.Coal2022PAGE32IEA.CCBY4.0.DemandThePhilippines’coaldemandin2022isexpectedtorisetoabout35Mt,upfromaround33Mt.Coal-firedgenerationmakesupfor57%ofthecountry’selectricityproductionand91%ofoverallcoaldemand.About70%ofthecoalconsumedisimportedfromIndonesia.AlthoughthePhilippineshavestoppedbuildingnewcoalpowerplants,coaldemandisexpectedtoincreasetoabout39Mtuntil2025,mainlydrivenbyrisingpowerconsumption.Malaysiancoaldemandisexpectedtoremainconstantin2022atabout33Mt.Demandisforecasttoincreasetoaround35Mtby2025,ledbyrisingelectricitydemandandhigherloadfactors,eventhoughthestate-ownedTNB’sannounceditplanstoclose1.4GWofcoalcapacitybefore2025.SoutheastAsiachangeincoalconsumptionbycountry,2021-2025IEA.CCBY4.0.0100200300400500202120222025MtIndonesiaVietNamMalaysiaPhilippinesThailandOtherSoutheastAsia-1001020304050202120222022-25MtCoal2022PAGE33IEA.CCBY4.0.DemandCoalconsumptioninSouthAsiadeclinesin2022onhigherpricesTightsupplyandhighpricesininternationalcoalmarketsarehittingemergingeconomieslikePakistan,BangladeshandSriLankaparticularlyhard.Atcurrenthighprices,theycannotaffordtobuyenoughenergy,includingcoal,whichisleadingtoelectricityrationing.Pakistan’scoalconsumptiondeclined7%to23Mtin2021inresponsetohighcoalprices.In2022,Pakistan’scoaluseisforecasttofallfurther(-3.8Mt)becausethecountrycannotaffordlargeseaborneimportssoitmustdependonsupplyfromdomesticcoalminesandland-basedimportsfromAfghanistan.Additionally,theheavier-than-usualmonsoonseasonbroughtseverefloodinginJune,coveringmorethanone-thirdofthecountry'slandareaandexacerbatingtheeconomiccrisis.FromJanuarytoSeptember,coal-firedpowergenerationfell7%,whilecoal-intensivecementproductiondeclinedby17%.By2025,Pakistan’scoalconsumptionisprojectedtoincreaseby30%to25Mt,fuelledbyexpectedeconomicgrowthof5%peryear,thecommissioningofnewcoal-firedpowerplantsandmoreuseofexistingones.ThecountryhasfivecoalpowerplantsunderconstructionbutweassumethatonlythefirstunitofJamshoro(660MW)andanadditional1650MWrunningondomesticlignite(Sindhprovince)willbecommissionedby2025.InDecember2020,Pakistan’sprimeministerannouncedthatthecountrywouldhave“nonewcoal-firedpower”.Whileweexpectthisdecisionwillnotaffectprojectsalreadyunderconstruction,othersintheplanningstagewithatotalcapacityof3GWareunlikelytoberealised.CoalconsumptioninBangladeshdeclinedby0.8Mtto3.8Mtin2021butisexpectedtogrowby2.8Mtin2022.Thesharpgrowthincoalconsumptionisduetothecommissioningofthetwo660MWblocksofthePayrapowerstationinMarchandDecember2021,respectively.Atleastsixothercoal-firedpowerprojectsareexpectedtogoahead,threeofwhich,withatotalcapacityof2.8GW,areanticipatedtobecompletedsoon.Thefutureoftheseventhproject,the1.2GWinMarabari,isunclearfollowingJapanesetradinghouseSumitomo’sdecisiontopulloutoftheprojectinFebruaryafterpledgingnottoinvestinnewcoal-relatedbusinesses.WeexpectBangladesh’scoalpowerfleettoincreaseto~5GWby2025,boostingthecountry’scoaldemandto19Mt.SriLanka’scoaldemandwilldecreaseslightlythisyearasthecountrystruggleswithhighcostsamidaseveredomesticeconomiccrisisresultinginaGDPcontractionof7%.For2025,coaldemandisforecasttoreturntoformerlevelsof2.2Mt.Coal2022PAGE34IEA.CCBY4.0.DemandAfricancoalconsumptionlikelytoremainstablenear2021levelsoverforecastperiodTotalcoaldemandontheAfricancontinentdeclinedby3.1%to189Mtin2021amidtheeconomicfalloutfromtheCovid-19pandemic.DuetocontinuedweakdemandfromSouthAfrica,thecontinent’scoaldemandisforecasttodecreaseforthethirdyearinsuccessionto180Mt(-9Mt).Until2025,weexpectconsumptiontoreboundto2021levels(~190Mt),whichiswellbelowthepre-pandemiclevelof2019.SouthAfricaaccountsforabout88%ofcoalconsumptioninAfricaandwasbehindthecontinent’sdemanddeclinefrom2020to2022.In2022,SouthAfricancoalconsumptionisexpectedtofallfrom166Mtto157Mt(-5.5%),inpartreflectingthecountry’sverysloweconomicrecoveryfromthepandemicshock.Economicgrowthisexpectedtoeaseto1.6%thisyear,after4.9%lastyearandapandemic-inducedslumpof6.3%in2020.Despiteeffortstoincreasethereliabilityofthepowersystem,rationingpersistsinSouthAfrica.InJune,astrikeatSouthAfrica’sstate-ownedutilityEskomdisruptedtheoperationandmaintenanceofthepowersystem.Eskomannouncedstagesixofload-sheddingattheendofJune,whichmeansdemandcutsof6GWfromthegrid.ThesituationeasedafterthestrikeendedinJulybutdelayedmaintenanceandunplannedoutagesledtocontinuingload-shedding.InSeptember,therollingblackoutsreachedrecordlevels,forcingareturntostagesixofload-shedding.Sofar,2022hasbeentheworstyearofload-sheddingonrecord.FromJanuarytoNovember,therehavebeenatleast155daysofreportedload-shedding.Thecountryhas~46GWofgenerationcapacity,sufficienttomeetapeakdemandofjust~32GW.However,lessthan60%ofthecapacityisavailable,leadingtoagapof~6GW.Inresponsetothecurrentsituation,thegovernmentannouncedaplantoattractmoreprivateinvestmentsinnewgenerationcapacities,raiseEskom’smaintenancebudgetandstartelectricityimportsfromBotswanaandZambia.WeprojectSouthAfrica’scoalconsumptiontoincreaseby5.3%from2022to2025asthecoalpowerplantfleet’sperformanceincreases.Aproposedlarge-scale3.3GWcoal-firedpowerplantprojectintheMusina-Makhadoenergyandmetallurgicalspecialeconomiczonehasbeencancelledandreplacedwithrenewablesources.ThefundingofothercoalpowerprojectsinAfricancountries,suchasZimbabwe,Botswana,TanzaniaandMozambique,isalsointhebalance.Inourforecast,wedonotexpectanynewcoal-firedpowerplantstobecommissionedinAfricaby2025.Coal2022PAGE35IEA.CCBY4.0.SupplySupplyCoal2022PAGE36IEA.CCBY4.0.SupplyGlobalcoalsupplyhitsall-timehighin2022butstallsby2025Despitedeterioratingeconomicprospects,globalcoalsupplyisforecasttoreachanewhighin2022asdemandforcoalinpowergenerationincreasesinresponsetotightgasmarketsandhighprices.ChinaandIndiacontinuetoboosttheircoalproductiontoovercomesupplyshortages,morethanoffsettingthedeclineinRussianproductionduetoWesternsanctionsimposedintheaftermathofthecountry’sinvasionofUkraine.Globalcoalproductionisforecasttoriseby5.4%to8318Mtin2022,anewall-time-highandwellabovetherecordsetin2019.Thisfollowsanincreaseof3.9%to7888Mtin2021aseconomiesrecoveredfromthepandemic-induceddemanddropin2020.Inabsoluteterms,2021growthwasmainlydrivenbyproductionincreasesof153MtinChina(4%)and48MtinIndia(~6%).Steamcoalandligniteaccountedfor98%ofthe295Mtincreaseandaround86%oftotalproduction.Thereboundgrowthtrajectoryforglobalcoalproductionisexpectedtoreachapeakin2023,justslightlyabovethe2022level.By2025,weestimatecoalproductionwillfallto8221Mt,backbelow2022levels.ThelowerlevelslargelyreflectexpectationsthatChina’scoalproductionwillplateauinthecomingyears,andthecontinuinggrowthinIndia’scoalproduction(+128Mt)willbeoffsetbylargedeclinesinotherregions,suchastheUnitedStates(-92Mt),theEuropeanUnion(-68Mt),Indonesia(-40Mt)andRussia(-13Mt).Globalcoalproduction,2000-2025IEA.CCBY4.0.Changesinglobalcoalproduction,2021-2025IEA.CCBY4.0.0200040006000800010000200020052010201520202025MtRestofWorldRussiaUnitedStatesAustraliaIndonesiaIndiaChina-300-200-1000100200300400500600202120222022-2025MtRestofworldRussiaEuropeanUnionUnitedStatesAustraliaIndonesiaIndiaCoal2022PAGE37IEA.CCBY4.0.SupplyChinaboosteditscoalproductioninthefaceofshortagesinH22021China’scoalproductiongrew4%in2021,reachinganewhighof3942Mt.Nevertheless,supplyfailedtokeeppacewithstrongdemandfrombothpowergenerationandnon-powerindustries,resultinginenergyshortagesinthesecondhalfoftheyear.Inresponse,thegovernmentandregionalauthoritiesfocusedonboostingdomesticcoalproductionbyauthorisingcapacityexpansionsatexistingminesorrestartingclosedoperations.Forexample,theNationalDevelopmentandReformCommission(NDRC)easedconditionsformineextensionstakingplacebeforeApril2022.InInnerMongolia,authoritiesapprovedtherestartof38disusedopencastmineswithacapacityof66.7Mtpa.Meanwhile,theprovinceofShanxisuspendedtheannualproductioncapandorderedallminestoincreasecoaloutputinstead.Theresultinggrowthincoalproductionmorethanoffsetsalllossescausedbypandemiccontainmentmeasures,newsafetyandenvironmentalregulationsornaturaldisasterslikefloodingsinShanxiinOctober2021.About83%ofChina’scoalproductionisthermalcoal,withtheremainingfrommetcoal.4ThebulkofChina’sthermalcoalproductionisconcentratedinjustfourregions,accountingformore4AlthoughChinaalsoproducesanthraciteandlignite,availabledatadonotreportthesecategoriesseparately.than80%ofthecountry’sthermalcoaloutput:InnerMongolia(33%),Shaanxi(23%),Shanxi(20%)andXinjiang(6%).Inallfourprovinces,thermalcoalminingincreasedin2021.ThemostsignificantincreasehappenedinInnerMongolia(+8%),followedbyShanxi(+7%),Shaanxi(+6%)andXinjiang(+6%).Thermalcoalproductioninotherregionsfell6%,mainlyduetodecliningoutputfromsmallandmedium-sizedmines.Intotal,China’sthermalcoalproductiongrew4.6%in2021.China’smetcoalproductionroseby1.4%in2021.ThemostimportantmetcoalminingregionisShanxi,whichaccountsforhalfofthecountry’stotalproduction.OtherimportantminingregionsareAnhui(8%),Shandong(7%)andHenan(7%)intheeast,Guizhou(4%)inthesouth,andInnerMongolia(4%)andHeilongjiang(4%)inthenorth.Shanxi’smetcoalproductionincreased1.8%in2021.Aswiththermalcoal,metcoalproductionisundergoingashiftfromsmall,decentralisedminestolarge,automatedones.Coal2022PAGE38IEA.CCBY4.0.SupplyChina’smajorcoal-producingprovincessubstantiallyrampedupcoaloutputin2021ChangeinthermalcoalproductioninChina’smajorproducingregionsbyminesize,2020-2021IEA.CCBY4.0.Source:AdaptedfromCRU(2022),ThermalCostModel(database).ChangeinmetallurgicalcoalproductioninChina’smajorproducingregionsbyminesize,2020-2021IEA.CCBY4.0.Source:AdaptedfromCRU(2022),MetallurgicalCostModel(database).-50-250255075100InnerMongoliaShanxiShaanxiXinjiangOthersMtLarge(>6.9Mtpa)Medium(2.3-6.9Mtpa)Small(<2.3Mtpa)-6-4-2024681012ShanxiSouthEastNorthOthersMtLarge(>6.9Mtpa)Medium(2.3-6.9Mtpa)Small(<2.3Mtpa)Coal2022PAGE39IEA.CCBY4.0.SupplyChina’scoalproductionontracktopostanotherrecordhighin2022WeforecastChina’scoalproductiontoexpandby8%to4237Mtin2022,reachinganewhighandsurpassingthe14thFive-YearPlan’stargetof4100Mtby2025.InChina’sfourmajorcoal-producingprovinces,outputrosesharplyinthefirstninemonthsof2022.Thehigherproductionlevelsarepartofthegovernment’splanstoraisedomesticsupply,withnewcapacityapprovedin2021of~300Mtpa.Theincreaseincoalproductioncouldhavebeenevenhigherhadstrictpandemiccontainmentmeasuresnothamperedoperationsandlogistics.Increasedsafetyinspectionsalsoweighedoncoaloutput.Withdomesticcoalproductionrapidlygrowing,theexistingrailcapacityhasbecomeabottleneckfortransportingcoaltodomesticportsandtoutilities.Whilethemajorcoalminingregionsaremainlylocatedinthenorthandcentreofthecountry,significantdemandisintheindustrialcentresalongtheeastcoast,suchasGuangdongortheShanghaiarea.Asdemandforcoalincreasesandtheshareofimportsatthecoastalpowerplantsdecreases,morecoalhastobetransportedtotheeastviarailandbarge.Tocopewiththeproblem,newstoragesitesareunderconstructionandtheChinaStateRailwayGrouphasincreasedthenumberofcoaltrainsonexistingroutes.However,producersandpowerplantsarehavingdifficultiessecuringsufficientrailcarsforcoalsuppliedunderlong-termcontracts.Truckcapacityisalsoscarce,worsenedbypandemiccontainmentmeasuresforcingtruckdriverstoberegularlytestedandthenwaitforresults.Shanxi,thelargestcoalminingregioninChina,increasedproductionby10%inthefirstninemonthsoftheyearandisaimingforfull-yearoutputof1300Mt.ThismakesShanxiabiggercoalproducerthananycountry(outsideChina).Shanxi’scoalproductionmighthavebeenevensomewhathigherhaditnotbeenforseveralaccidents,someofwhichwerefatal.Inresponse,theShanxiprovincialgovernmentorderedthesuspensionofoperationsandamulti-dayinspectionatatotalofeightcoalmines.Thelargest,Tashan,hasacapacityof25Mtpa.Theothermineshaveatotalcapacityofabout7.2Mtpa.Thesecond-largestcoalregion,InnerMongolia,produced124Mt(+19%)morecoalbetweenJanuaryandSeptemberthaninthepreviousyear.Thiswasthelargestabsoluteincreaseamongthecoal-producingprovinces.InShaanxiprovince,coalproductionroseby8%or34Mt.InlateAugust,operationswerehamperedwhenaCovid-19outbreakforcedthelocalgovernmenttosuspendmorethan90%ofminingcapacityinShenmucounty,akeythermalcoal-producingregioninShaanxiprovince.Atleast60ofthe81privatecoalmineswithacapacityof~80Mtpawereshutdown.In2021,theShenmucountyproduced~310Mt.Tocurbcoalproduction,thelocalgovernmentofYulin,anotherlargecoal-producingcityinShaanxi,decidedtostopCoal2022PAGE40IEA.CCBY4.0.Supplyusingcoalsaleslicences.Thelicences,whichlimitthesupplyofcoal,wereintroducedin2006withtheaimofcurbingillegalminingactivities,producingbeyondthelicensedcapacityandimprovingthesafetyofcoalminingandtransportation.Inrelativeterms,coalproductionincreasedthemostinXinjianprovince(+32%/68Mtpa).Bymid-September,13newmineshadbeenaddedintheprovincewithatotalcapacityof69Mtpa,whichcouldbefurtherexpanded.China’scoalproductionbymonth,2016-2022IEA.CCBY4.0.Source:NationalBureauofStatisticsofChina(2021),StatisticalDatabase.Year-on-yearchangeinChina’scoalproductionbyregion,JanuarytoSeptember,2020-2021IEA.CCBY4.0.Source:NationalBureauofStatisticsofChina(2021),StatisticalDatabase.050100150200250300350400450JanMarMayJulSepNovMtRange2016-2020202120220%10%20%30%40%04080120160ShanxiInnerMongoliaShaanxiXinjiangOthersMtAbsolutechange(leftaxis)Relativechange(rightaxis)Coal2022PAGE41IEA.CCBY4.0.SupplyChina’scoalprovincesareontracktoexceedtheir2025productiontargetsThe14thFive-YearPlansetsoutChina'seconomicdevelopmentgoalsforthe2021to2025period.Theplanaimstobalancetheenvironment,energysecurityandaffordabilityinitsdevelopmentstrategies.Coalisseenasanirreplaceablesourceofenergyforyearstocome,althoughChinahascommittedtopeakingitscarbonemissionsbefore2030andachievingcarbonneutralityby2060.Chinahastargeteda1%growthrateinitsannualcoalconsumptionprojections,to4200Mtin2025.Atthesametime,coalproductionissettoincreaseto4100Mt,withtheremaindertobecoveredbyimports.However,Chinawillmostlikelysurpassthisgoalin2022.WeexpectChina’scoalproductiontogrowslowerandpeaknextyearbeforestartingtodeclineslightlyfrom2024on.Asaresult,China’s2025coalproductionwouldbeveryclosetothe2022levelof~4237Mt.Followingthenationalplan,theprovincespublishedtheirfive-yearplans,withmostalsotargetinghighercoalproduction.Oftheninelargestcoal-producingprovinces,onlyShanxiandAnhuiintendtoreducetheircoalproduction.However,Shanxihassincereviseditsinitialtargetof1000Mtandisnowaimingforproductionof1300Mtin2022.FromJanuarytoSeptember2022,Shanxi’scoaloutputincreasedby179Mtcomparedtothesameperiodin2020.Threemajorcoal-producingregions,InnerMongolia(47%),Shaanxi(100%)andXinjian(66%),havealreadyachievedtheirtargetstoalargeextent.PlannedandrealisedchangesinChina’sminingcapacitybyregion,2020-2025IEA.CCBY4.0.Note:The2022valuerepresentsthedifferenceincoalproductionduringthefirstninemonthsof2020and2022.Sources:NationalBureauofStatisticsofChina(2022),StatisticalDatabase,andProvincial14thFive-Year-Plans.-50050100150200250300ShanxiInnerMongoliaShaanxiXinjiangGuizhouAnhuiHenanShandongNingxiaMtpaProductionchange2020-20222025targetCoal2022PAGE42IEA.CCBY4.0.SupplyIndiapushesdomesticproductiontoreinforceitssecurityofsupplyIndia’songoingeffortstoimproveenergysecurityandtoreduceimportdependencyledtosubstantialincreasesindomesticproductioninboth2021and2022.India’scoalproductionrose6.3%to805Mtyear-on-year(y-o-y)in2021andbyastronger11%to893Mtthisyear.InrecentyearsIndiahasimprovedcoalavailabilitysignificantlyinabidtoendhistoricalshortages.Nevertheless,despitehighercoalproduction,thecountryagainfacedsignificantcoalshortageswhenseveralfactorscoincidedinAugust2021.Againstthebackdropofsurgingdemandduetothepost-pandemiceconomicrecovery,suppliesweredisruptedbyheavymonsoonsinmajorminingregionsandhighpricesofimportedcoalledtoliquidityproblemsresultingininsufficientstockbuild-upatpowerplantsrelyingonimports.Allcombinedcreatedanacutesupplyshortage.India’scoalsectorcanbedividedintothreecategories:public,captive,andcommercialmining.Threestate-ownedcoalminingcompanies-CoalIndiaLtd(CIL),SingareniCollieriesCompanyLtd(SCCL)andNLC-conductpublicmining.CIL,thelargestcoalminingcompanyintheworld,accountedfor~77%ofthecountry’sproductionin2021,andSCCL,thesecond-largestproducerinIndia,foranother8%.Captiveblocksareindustry-ownedminestomeetcompanies’self-consumption,whilecommercialcoalblocksareauctionedbythegovernmenttoprivateminingfirmsforcommercialcoalsale.Thescaleofcaptiveandcommercialmining,whilestillcomparativelysmall,isexpectedtoincreasequickly.Inthefirsthalfof2022,coaloutputoftheseminesjumpedbymorethan50%comparedto2021.India’smonthlycoalproduction,2016-2022IEA.CCBY4.0.Source:IEAbasedonMcCloskey(2022).McCloskeyCoal,MetalsandMiningService020406080100120JanMarMayJulSepNovMtRange2016-202020212022Coal2022PAGE43IEA.CCBY4.0.SupplyThegovernment’sintentionstoreduceimportdependencywillcontinuetodrivecoalproductiongrowthoverour2022-25forecastperiod.Coal-firedgenerationisIndia’smostimportantsourceofelectricity,providingabout73%ofelectricitydemand.Toachieveproductiongrowth,theIndiangovernmenthasissuedablendofpushandpullmeasuresinrecentyears.Ontheoneside,thegovernmentispenalisingunderperformingpowerplantsandstipulatingfixedcoalinventorylevelsatpowerplants.Ontheotherside,thegovernmentpushesthesupplyup.Itpermitscaptiveminestosellupto50%oftheirproductionandtoblendupto30%ofimportedcoal.Moreover,itdedicatesrailwaycapacitiestocoaltransport,grantsadditionalproductionincreasestoapprovedexpansionprojects,andtemporarilyprioritisesthermalcoalaccessforpowergenerationovernon-poweruses.Addressingincreasedimportprices,theIndiangovernmentimplementeddirectivestoimprovetheliquidityofpowerplantowners.Additionally,theIndiangovernmentisabouttoissueacoallogisticspolicy.Ittargetsamultimodalcoalinfrastructurethatkeepsupwiththeincreasingcoaldemandandthedomesticproductiongrowthwhilereducingtransportationcosts.FundedbyCIL,railwayprojectsinIndia’sminingbeltwillbeimplementedtoimprovesupplychainsbyenhancingthecoalevacuationfrommines.Theplannedprojectsareexpectedtoincreasethecoalevacuationcapacityofacentralrailwaylinetoabout125Mtpa.India’sdomesticsupplyisforecasttocontinuetogrowuntilandbeyond2025inlinewiththesteadyincreaseindemandwhilealsostrivingtoreduceimportdependency.Totalproductionwillsurpass1000Mtin2025,totalling1021Mt.Almostallofthecoalproductionwillbethermalcoal,mainlyforpowergeneration.Thestate-ownedcompanyCILisexpectedtocontributesubstantiallytooveralldomesticproduction.India’sannualdomesticcoalproductionbycompany,2020-2025IEA.CCBY4.0.Sources:McCloskey(2022),IEAestimates.0200400600800100012002020202120222025MtCILSCCLOtherCoal2022PAGE44IEA.CCBY4.0.SupplyCommercialmines–anotherimportantpillarofcoalsupplyforIndiaCommercialminingisthethirdpillarofthestrategyofthegovernmenttoboostIndia’sdomesticcoalproduction.AspecialprovisiontoreformtheMiningActin2015pavedthewayfortheprivatesectortoproducecoaltobesoldinthefreemarketoutofthemonopolyofCoalIndia.In2020thefirstblocksforcommercialminingwereauctionedandawardedinNovemberofthatyear.SincethentheIndiangovernmenthasheldseveralroundsofauctionsallocatinganestimatedcumulatedcapacityof156Mtpathermalcoaland6Mtpacokingcoalforcommercialmining.On3November2022,theMinistryofCoallaunchedthe6throundofcommercialmineauctions,including141coalmines,ofwhich71arenewmines,62areonesnotawardedinpreviousauctions,andeightareonesforwhichsinglebidswerereceivedinthe5thauction.Inthefiscalyear2021-22,captiveminesincreasedtheirproductionby~30%toatotalof~90Mt.Bytheendofthefiscalyear2022-23(March2023),atotalof48captiveandcommercialmineswillbeinoperation,with11newminesexpectedtocomeonstream.FiveofthesearelocatedinJharkhandandwillbededicatedtopowerproductionbycompaniessuchasNTPC,DamodarValleyCorporation,andthePunjabElectricityBoard,andtosteelproductionbyJSWsteelandAraanya.Fortheongoingfiscalyear,captiveandcommercialminesareexpectedtoraisetheirproductionconsiderablytoabout140Mt.Allinall,numerousadditionalcommercialminesareabouttobedevelopedbasedonthecoalminetender.Atthisstage,however,itisdifficulttoassesshowfastandhowstrongtheramp-upofproductionfromcommercialmineswillbeby2025andbeyond.VedantahasreportedthatitexpectstobringintooperationOdisha’sRadhikapur(West),ablockawardedinNovember2020inthefirstauction,duringthefiscalyear2022-23.TenderedCapacityofIndia’scommercialmineauctionsIEA.Allrightsreserved.Source:ArgusMediagroup.Allrightsreserved.01002003004001stAuction2ndAuction3rdAuction4thAuction5thAuction6thAuctionMtpaAllocatedthermalAllocatedmetallurgicalNot-allocatedTenderedCoal2022PAGE45IEA.CCBY4.0.SupplyAustralia’sproductionconstrainedbyseveralfactorsIn2021,Australia’scoalproductiondeclinedmarginallyyear-on-year,toabout470Mt,duetoadverseweatherconditionscausedbytheLaNinaweatherphenomenon,theimpactofthepandemiconthelabourforceandskillshortageshinderedminersfromexpandingproductionandfullybenefitingfromrisingprices.Anincreaseinthermalcoaloutputofabout10Mtto300Mtwasoffsetbyadeclineincokingcoalproduction(-7%/-13Mt).Thermalcoalproductionaccountedfor~64%ofAustralia’scoaloutput.In2022,Australia’scoalproductionisexpectedtodeclineby5.2%to446Mt,primarilyduetoweatherconditionsandtheimpactofthepandemiconlaboursupply,whichcontinuestoweighonthecountry’scoalindustry.Bringingsevererainfalls,LaNinaeventsaffectcoalproduction,railingandshippinginNewSouthWalesandQueensland.AfterthelasteventendedinJune2022,theAustraliaBureauofMeteorologydeclaredanotherLaNinaeventinSeptember,thethirdinarow.Australianmeteorologistsforecastthatitwilllastuntilearly2023,peakingbetweenSeptemberandNovemberthisyear.Resultingfloodingfrequentlycausesproductiondowntimesanddamagetoinfrastructure.The0.9%declineincokingcoalproductionispartlyduetosomeminersswitchingtothermalcoalbysellingPCIandsemi-softcoalonthethermalcoalmarketorfocusingonthermalcoalseamsintheirmines.Until2025,Australia’smetcoalproductionisforecasttoexpandby8%intotalasnewminesandexpansionsofexistingonesarecommissionedandconstrainingfactorssuchasskilledlabourshortagesandweatherconditionsareovercome.However,thermalcoalproductionwillnotreturntothe2021level,butwillslowlyandsteadilydecline.Whilepressurefromlegaldisputesandregulators,aswellasinsuranceconditions,haveapparentlyeasedduringthecurrentenergycrisis,wedonotexpectfinancingconditionsforthermalcoalminingtoimprove.CoalproductioninAustraliabystate,2021-2025IEA.CCBY4.0.Source:AdaptedfromCRU(2022),CoalCostModel(database).-40-20020202120222023-2025MtMetcoalforexportThermalcoalforexportThermalcoalfordomesticconsumption0100200300400500202120222025MtWesternAustraliaNewSouthWalesQueenslandCoal2022PAGE46IEA.CCBY4.0.SupplyGrowthofIndonesiancoalproductionunderpinnedbyexportsIndonesia’scoalproductiongrewslightlyto569Mt(+0.6%)in2021afterapandemic-inducedslumpin2020.TheLaNinaeventbroughtheavyrainfalltothemajorcoalminingregionsofKalimantanandSumatra.Furthermore,lowheavy-equipmentavailabilityhamperedtherampingupofcoalproduction.In2022,theconstrainingfactorsonIndonesia’scoalproductionremainedlargelythesame:wetweatherconditions,inparticularintheKalimantanregion,infrastructuralbottlenecksaswellasalackofminingequipment.Furthermore,sharplyincreasedroyaltiesandoperationalcosts,coupledwiththegovernment'sdrivetochannelmorecoaltothedomesticmarket,arereducingincentives,especiallyforsmallminerstoopenorexpandtheircoalproduction.Despitethelimitingfactors,forthefullyear,Indonesiancoalproductionisforecasttoexpandby9%to622Mt,drivenbyincreaseddemandforIndonesiancoalfromabroad.Inthecomingyears,however,weexpectIndonesiancoalproductiontodeclineby2.2%annuallyonaverageastheimportdemandofthetopexportdestinations,ChinaandIndia,declines.Lowerproductionwillbepartlyoffsetbyhigherdomesticcoalconsumptioninthepowersector.Intotal,weforecastIndonesia’sproductiontodecreaseto582Mtby2025.VietNam’scoalproductiongrewby8Mtto51Mtin2021,reducingitsdependencyoncoalimports.In2022,domesticproductionisforecasttorisefurther,mainlydrivenbythestate-controlledcoalproducerVinacomin.WeexpectVietNam’scoalproductiontogrowcontinuouslyto~57Mtby2025.ChangesinandtotalcoalproductioninIndonesia,2021-2025IEA.CCBY4.0.-80-60-40-200204060202120222023-2025MtMetcoalforexportThermalcoalforexportThermalcoalfordomesticconsumption0100200300400500600700202120222025MtTotalCoal2022PAGE47IEA.CCBY4.0.SupplyBansandsanctionsweightonRussia’scoalproductionEurasia’scoalproductionrose4.7%to564Mtin2021.ThelargestproducerintheregionisRussia,withatotalproductionof437Mt(+9%),followedbyKazakhstanatasteady103Mt.Theregion’scoalproductionin2022andthenear-termoutlookarestronglyaffectedbyRussia’sinvasionofUkraineandtherelatedgeopoliticaltensionsandeconomicsanctions.In2022,Eurasia’scoalproductionisexpectedtofall4.6%,primarilydrivenbya7.4%declineinRussia’scoalproduction.TheEUbanonRussiancoalallowedcompaniestobuycoalfromRussiauntilAprilandtoimportitby10August.Sincethen,RussianproducerswhowerefocusedontheEuropeanmarketshaveencounteredproblemsredirectingtheirsuppliestoothercustomers,asrailwaycapacitytotheeastislimited.TheKuzbassregionrecordeda9%-slumpy-o-yfromJanuarytoAugust2022.LedbyreduceddemandfromJapanandChineseTaipei,exportstoAsiaalsodroppedinthefirsthalfof2022.Accordingtothecountry’seconomyministry,Russia’scoalproductionisexpectedtodeclinein2023byanother9%beforeproductionresumesgrowthagainin2024.Eventhoughwebelievethatinner-Russianinfrastructuralbottleneckswillberesolvedby2025,weexpectthecountry’scoalproductiontofallby3%intotaluntil2025asimportdemandfromChinaandIndiaeases.Russianchangeincoalproductionbyregionandintotal,2021-2025IEA.CCBY4.0.Source:AdaptedfromCRU(2022),CoalCostModel(database).Kazakhstan’scoalproductionwillriseto108Mt(+4.5%)in2022duetohigherdemandfromEurope,especiallyPoland,toreplaceRussiancoal.WeexpectKazakhcoalsupplytoexpandby3%to111Mtby2025.-40-30-20-10010203040202120222023-2025MtCentralEastWest0100200300400500202120222025MtTotalCoal2022PAGE48IEA.CCBY4.0.SupplyAmericancoalproducersstruggletorampupcoalproductiondespitehighcoalpricesAfteryearsofdeclineanda24%slumpincoaloutputin2020,UScoalproductionrecoveredsomewhat,withan8%increaseto524Mtin2021,fuelledbystrongdomesticdemandamidhighgaspricesandstronggrowthinGDP(+5.9%)andelectricityconsumption(+2.6%).In2022,coalproductionisexpectedtoincreasebyasmaller2%,despitehighexportcoalprices,steepgaspricesandlowinventories.Therefore,theUnitedStatesisnotaswingsupplieranymore.WhilecoalproductionintheWesternregionwillincrease(+6%),outputfromtheAppalachianregion(-0.2%)andtheInteriorregion(-2.8%)willlikelydecline.CoalproducersinCentralAppalachianarestrugglingtorampupproductionduetosupplychainissues,investorsrefrainingfromthethermalcoalminingbusiness,andtightlabourmarkets.AlphaMetallurgicalResources,forexample,steppedbackfromproducingthermalcoalandrefocusedonmetallurgicalcoal.EventhoughUSrailroadsarerecoveringfromtheaftermathofCovid-19byaddressingtheirstaffingshortages,therebyincreasingrailvolumes,transportinfrastructureremainsbottleneckedforUScoalproduction.Inthecomingyears,weexpectcoalproductiontodeclineagainasdomesticdemandforthermalcoalcontinuestocontract,thelackofinvestmentpersistsandpersonnelshortagesremain.OurforecastforUScoalsupplyseesanaverageannualdeclineof6.1%until2025,whenproductionreaches443Mt.UScoalproductionbyregion,2008-2025IEA.CCBY4.0.Source:IEAestimatesbasedonUSEIACoaldata(2022)020040060080010001200200820102012201420162018202020222024MtAppalachiaregionInteriorregionWesternregionCoal2022PAGE49IEA.CCBY4.0.SupplyMixedoutlooksforColombiaandCanadaCanada’scoalproductionrose4.8%to47Mtin2021,withmostoftheincreaseinmetcoal,whichaccountsfor~57%ofthecountry’soutput.Canadiansupplychainswereaffectedbyan18-daystrikeofnationalrailworkersinmid-2022andanother3-weekstrikeattheWestshoreexportterminalsuntilmid-October.Despitetheseobstacles,coalproductionisexpectedtoriseby3.6Mtin2022.However,weforecastCanada’scoalproductiontodeclineto45Mtby2025duetoreducedthermalcoalproductioninresponsetoslowerdomesticdemand.Colombiancoalproductionincreasedby5.7Mtto59Mtin2021,poweredbyariseinthermalcoaloutputof7Mt,whichoffsetasmalldeclineinmetallurgicalcoalofabout1Mt.In2022,thecountry’scoalproductionisforecasttodecreaseby3.7%,toaround57Mt.ProductionfromColombia’slargestproducerDrummondisrunningshortofthisyear’stargets,whichwillmorethanoffsetasurgeinoutputfromsmallercompanieslocatedintheinnerprovincesin2022.Duetoheavyrainyseasons,Drummondhadtoreduceitsexportprojectionsfor2022.Inaddition,long-termcontractshinderDrummondfromprofitingfromhighcoalprices.Afterincreasingoutputby11%inthefirsthalfof2022,CerrejonisfacinginfrastructureissuesatPuertoBolivarandsignificantproductioncurtailmentsduetoblockadesandprotestsbyIndigenouspeopleinthesecondhalfoftheyear.CompaniesfrominnerColombiaareexpectedtoincreasetheirexportsfrom1.5Mtin2021to6-7Mt,profitingfromahighwillingnesstopayonthedemandside.TheshipmentsareincreasinglydirectedthroughCaribbeanterminalssuchasPuertoNuevo,Carbosan,Barranquilla,andPuertoBrisa.By2025,weexpectColombiancoalproductiontodeclinebyabout1Mtduetoreduceddemandfromkeyimporters.CoalproductioninColombiabymineandcompany,2020-2022IEA.CCBY4.0.Source:AdaptedfromCRU(2022),CoalCostModel(database).0204060202020212022MtElDescansoPribbenowCerrejonCalenturitasLaJaguaOtherDrummondInternational:Glencore:Prodeco:Coal2022PAGE50IEA.CCBY4.0.SupplyIncreaseinEUcoalproductionisshort-livedbeforereturningtothedownwardtrendCoalproductionintheEuropeanUnionrosebyarobust~10%in2021,drivenbythepost-pandemicrecoveryandfuelswitchingfromhigher-pricednaturalgas.Thetwomajorcoal-producingcountriesareGermany(38%)andPoland(32%).SmallercoalproducersincludetheCzechRepublic(9%),Bulgaria(9%),Romania(5%)andGreece(4%).About83%oftheEU’scoalproductionislignite.AsaresultofRussia’sinvasionofUkraineandthesubsequentenergycrisiswhichhasengulfedEUcountries,weexpectcoalsupplyanddemandtoremainathigherlevelsinthecomingyears.Coalsupplyisforecasttoincreaseby7%to357Mtin2022andbyafurther2.7Mtin2023.Germany,thelargestligniteproducer,increasedcoalproductionby18%in2021inresponsetostrongerdemand.Inthecurrentenergycrisis,Germanyistryingtoexpanditscoal-firedpowerproductiontoreplacegasuse.Insteadofshuttingdown1.6GWoflignite-firedpowerplantsbytheendof2022asplanned,thegovernmenthasissuedawaivertoallowproductiontocontinueuntilMarch2024.Bycontrast,productioninPolandisexpectedtoremainconstrained.MinesinSilesianeedlargeinvestmentsandtheminingcompanyBogdankahasongoingproblemsmaintainingcurrentsteamcoalproduction.WeexpecttheEuropeanUniontoresumephasingoutcoalfrom2024,leadingtoasubstantialproductiondecline,particularlyinlignitemining.ProductionofhardcoalinPolandandsmallervolumesintheCzechRepublicwilleaseonlyslightly.By2025,EUcoalproductionisforecasttofall19%toabout289Mtcomparedto2022levels.ChangesincoalproductionintheEuropeanUnion,2021-2025IEA.CCBY4.0.-50-40-30-20-1001020304020212022202320242025MtMetcoalSteamcoalLigniteCoal2022PAGE51IEA.CCBY4.0.TradeSouthAfrica’scoalproductiondropswithfallingconsumptionandrailissuesSouthAfricaisthecontinent’slargestcoalproducerbyfar,withashareof~93%.In2021,SouthAfricancoalproductiondroppedbyalmost8%to229Mt.Thedeclineisexpectedtocontinuein2022,fallinganother3.3%duetoweakdomesticconsumptionandpoorrailwayperformancebyoperatorTransnetFreightRail.Keyissueswerelarge-scalecabletheft(intotal1500kmofcablehavebeenstoleninthelastfiveyears),unavailabilityoflocomotiveandspareparts,vandalismandinfrastructurebottlenecks.Furthermore,derailmentsofwagonsfrequentlyblockraillinesformultipledays.Forexample,inJuneraillinesweredownforfourdaysduetoaderailment.FromJanuarytoSeptember,Transnet’sraildeliveriestoRichardsBayCoalTerminalweremorethan30%belowthehistoricalaverage.InOctober,aten-dayworkers'strikeputadditionalstrainonTransnet'stransportcapacities.Ontopofbottlenecksinexportinfrastructure,domesticdemandhasbeenweak.Thestate-ownedpowerutilityEskomcontinuedtoexperiencefrequentunplannedoutagesofcoal-firedpowerplants,leavingsomeminingcompanieswithnochoicebuttoclosetheiroperationsforcareandmaintenance,despiterecord-highpricesinoverseasmarkets.Furthermore,heavyrainnegativelyimpactedthecountry’scoalproductioninthefirstquarter.Forthecomingyears,weexpectsomestabilisationofSouthAfrica’scoalproductionbutnorecovery.In2025,weforecasttotalcoalproductionof217Mt.SouthAfricamonthlycoalproduction,2016-2022IEA.Allrightsreserved.Source:ArgusMediagroup.Allrightsreserved.HighinternationalcoalpriceshaveincentivisedotherSouthernAfricancountries,suchasMozambique,Botswana,TanzaniaandZimbabwe,toincreasetheircoalproduction.Mozambique,thecontinent’ssecond-largestcoalproducer,reportedoutputof11Mtin2021.DespitestrikeactioninMay2022atanIndian-ownedcoalmine,weexpectthecountry’soutputtoincreaseby3.3Mtin2022beforebeginningtodeclineto11Mtagainby2025.051015202530JanMarMayJulSepNovMtRange2016-202020212022Coal2022PAGE52IEA.CCBY4.0.TradeBotswanaisexpectedtoincreasecoalproductioninthecomingyearsasthegovernmentactivelysupportscoalexploitationtodiversifythecountry’seconomyfromdiamondmining.Withhighcoalpricesmakingexportseconomicallyviable,Botswana’sprivatecoalproducerMinergyisoperatingatfullcapacityof1.5Mtpain2022.ShipmentsaremadefromWavisBayinNamibiaandMaputoinMozambique,crossingZimbabwe.Multiplenewprojectsareunderdevelopment(seeChapter5),someofwhichareexpectedtostartproductionby2025.Coalproductionisforecasttorisefrom3Mtin2022to4Mtin2025.Coal2022PAGE53IEA.CCBY4.0.TradeTradeCoal2022PAGE54IEA.CCBY4.0.TradeGlobaltradereboundedonstrongdemandin2021,butwilldeclinethrough2025InternationalcoaltradestartedslowlyrecoveringfromtheeconomicfalloutfromCovid-19in2021,withvolumesrisingto1333Mtfortheyear5,accountingfor~17%ofglobalcoaldemand.However,whilethetradeofthermalcoal(whichincludesligniteandsomeanthracite)increasedby1.6%,metallurgical(met)coaltradingvolumesdeclinedby2.3%,reversingpreviousyear’sdevelopments.Thegreatmajorityofcoaltradedin2021(93%)isseaborne.Traditionally,coaltradehasbeenconcentratedinthePacificandAtlanticBasins,withSouthAfricaand–toalesserextent–Russialinkingthetwo.However,internationalcoaltradepatternsshiftedinrecentyearsasEurope’simportdemanddeclinedandSouthAfricanexportsmovedtothePacificandtheIndianOcean.In2021,however,surgingnaturalgaspricesreversedthisdevelopmentascoalimportdemandinEuroperose.ImportsbyGermany(38Mt)surpassedTürkiye(36Mt)againtomakeitthelargestimporteroutsideofAsiaPacific,whichaccountedfor79%ofglobalcoalimports.Indonesiaincreaseditsexportsby~7%to436Mt,holdingontoitspolepositionastheworld’slargestcoalexporterbyweightin2021.5Forvariousreasons,annualimportsandexportsdonotmatch:forexample,someexportsreportedinDecembermaybereportedasimportsinJanuary.Tradevolumesinthissectionrefertoexports.Despitea5Mtdeclineinexports,Australiaremainedthesecond-largestexporterbyweightatatotal370Mt.Chinaincreaseditsimportsbyaround7%to338Mtandremainedthelargestimporter.ChinadrasticallyreducedimportsfromAustraliaduetoadisputebetweenthetwocountries’governments,andinsteadraisedsuppliesfromIndonesiaandRussia.India’scoalimportsfellabout6%to207MtwhileJapanremainedatabout173Mt.Thethreecountriesmakeupfor52%ofallimports.In2022,Russia’sinvasionofUkraineledtoacomplexreshuffleofglobalcoaltrade.Asaconsequenceofitsaggression,wide-ranginginternationalsanctionsimposedonRussia,includingthepayment,shippingandinsuranceofenergyexports,disruptedtradeflows.InApril,newpurchasesofRussiancoalwerebannedintheEUwhileexportsfromexistingcontractswerehaltedon10Augustonward.Asaresult,Russiancoalpricesplummetedandinternationalcoalflowsbegantoreroute.WhileAsiancountries,suchasIndiaandChina,increasedtheirimportsfromRussia,countriescomplyingwiththebanhavesoughtalternativesupplies.HighcoalpriceshaveincentivisedsmallcoalproducersCoal2022PAGE55IEA.CCBY4.0.TradesuchasTanzaniaandBotswanatoenterglobalcoalmarkets.Intotal,weexpectcoaltradein2022toreach1351Mt.Through2025,twofundamentaldevelopmentswillshapeglobaltrade.First,countries,particularlyinEurope,willadapttoandovercomethecurrentenergycrisisandreturntotheircoalphase-outpaths.Second,continuedeffortstosecureenergysuppliesbyChinaandIndialeadtohigherdomesticoutputandlowerimports.Overall,weexpectthethermalcoaltradetosharplydecline,byabout10%until2025.Bycontrast,themetallurgicalcoaltradewillcontinuetogrowby~6%.Coal2022PAGE56IEA.CCBY4.0.TradeThermalcoaltradedeclinesbutmetcoaltradeincreasesthrough2025Thermalcoaltradedevelopments(exportsbydestination),2020-2025IEA.CCBY4.0.Metallurgicalcoaltradedevelopments(exportsbydestination),2020-2025IEA.CCBY4.0.-12%-8%-4%0%4%8%12%-1200-800-40004008001200202020212022202320242025MtRestofWorld(leftaxis)ChinaIndiaAnnualgrowth(rightaxis)-12%-8%-4%0%4%8%12%-1200-800-40004008001200202020212022202320242025MtRestofWorld(leftaxis)ChinaIndiaAnnualgrowth(rightaxis)Coal2022PAGE57IEA.CCBY4.0.TradeThermalCoalCoal2022PAGE58IEA.CCBY4.0.TradeThermalcoaltraderecoveredin2021fromasteepdeclinein2020AfteraCovid-19-induceddecline,thermalcoaltradereboundedto1025Mtin2021,ledhigherastheeconomicrecoverygatheredpaceandbyrisinggasprices.Approximately94%ofthetradewasseaborne.Theshareoftheinternationalcoaltradeinglobalcoaldemanddecreasedfromabout16%to15%asincreasingimportswereoutpacedbygrowingdemand,whichwasmainlymetbyhigherdomesticsupply,particularlyinChinaandIndia.TheAsiaPacificisthemostimportantthermalcoaltradingregion:itwastheoriginof~63%ofallexportsandthedestinationforabout~82%ofallimportsin2021.Indonesianthermalcoalexportsaccountedfor~42%oftheglobaltrade,raisingitsmarketsharefrom~40%in2020.Australiarankedsecond,withamarketshareof~19%,followedbyRussiaat17%,SouthAfricaat6%,Colombiaat5%andtheUnitedStatesat4%.Chinaremainedtheworld'slargestimporterofthermalcoal,increasingvolumesby16%to284Mt,followedbyIndiaandJapan.In2021,India’sthermalcoalimportscontracted10%toabout141Mt.Thiswaspartlyduetohigherdomesticproductionandbuyers'reluctancetopayhigherprices,leadingtoseverecoalshortagesinthesecondhalfof2021.Japan’simportsdecreasedtoabout129Mt.ThermalcoalimportsinSoutheastAsiafellby11Mtto126Mt,mainlydrivenbyasharpdeclineinVietNam.ImportsbytheEuropeanUnionrosestronglyto61Mt(+25%)duetohighgasprices.Despitehighcoalprices,notallexportingcountrieswereabletoexpandtheirexports.WhileIndonesia(+27Mt)andtheUnitedStates(+12Mt)significantlyraisedvolumes,Colombian(-16Mt)andSouthAfrican(-10Mt)exportsdeclinedsharply.ExportsfromRussiaremainedatthe2020level.Indonesiaincreaseditsvolumesto432Mt(+7%),returningtoagrowthtrajectory,whichwastemporarilyinterruptedduetolowerdemandfromIndiain2020.Bycontrast,theriseinUSexportsmayprovetobeshort-livedashigherexportscameattheexpenseoffallingstocks.ThedeclineinAustralia’sexportsismainlyattributedtothepandemicreducinglabouravailabilityandadverseweatherconditionsfromastrongLaNinaphenomenon,whichbroughtheavyrainfallsandseverestorms.Australia’sthermalcoalexportstoChinaalmostvanishedduetoanunofficialbanandwereredirectedtootherAsiancountries,suchasJapan,Korea,andIndia.InColombia,adverseweatherconditionshamperedsomeminingoperations.SouthAfricancoalexportswerereducedbydisruptionstothecountry’srailinfrastructurecausedbyextensivecabletheft,strikesandprolongedunderinvestment.Coal2022PAGE59IEA.CCBY4.0.TradeDespiteEUrebound,thermalcoaltraderemainsconcentratedintheAsiaPacificBasinMaintradeflowsinthethermalcoalmarket,2021(Mt)IEA.CCBY4.0.Note:MapvaluesarebasedonavailableexportdataanddonotnecessarilymatchimportnumbersCoal2022PAGE60IEA.CCBY4.0.TradeThermalcoalimportsareexpectedtocontractthrough2025Importsofthermalcoalareexpectedtoexpectedtodecreaseslightlyto1035Mtin2022.Thermalcoalimportsaccountfor77%ofglobalcoalimportsandfor15%ofoverallthermalcoaldemand.Thestagnationin2022islargelyduetolowerimportsbyChina,whichsawasignificantramp-upofdomesticsupplyandadecelerationofdemandgrowth.StrongincreasesinthermalcoalimportsfromIndiaandEuropeoffsetthedecrease.China’sthermalcoalimportsareforecasttodeclineby44Mtto240Mtin2022.Thecountryremainstheworld’slargestimporterofthermalcoalbyfar,butitssharewilledgelowerfrom28%to23%.InFebruary,importstumbledto9Mt,thelowestlevelsinceNovember2020,butrecoveredthereafterandreachedpreviousyear’slevelinAugust.ChinasignificantlyincreasedimportsofRussiancoalinthesecondhalfoftheyearassteeppricediscountsemergedfollowingwidespreadWesternbansandsanctionsonthecountry’senergysupplies.InAugust,Chinaimported6.6MtofRussiancoal,asharpyear-on-yearincreaseof2.2Mt.Indiaisoncoursetoincreasethermalcoalimportsto152Mt,upby11Mtfrom2021levels,maintainingitspositionasthesecond-largestthermalcoalimporter.HigherimportsweresupportedbytheIndiangovernment’snewmandatesobligatingoperatorsofcoal-basedpowerplantstoincreaseinventoriesbyimportingatleast10%oftheircoaldemandandeasingtherestrictionsoncoalblending.India’simportsalsorosetoamultiple-yearmonthlyhighofaround20MtinJuneasbuyersrampedupimportsofsharplydiscountedcoalfromRussia.ImportsfromAustralia,therefore,halvedduringthefirstthreequarterscomparedto2021.Japanisforecasttoimport140Mtin2022,anincreaseof11Mt.ImportsbySoutheastAsiacountinuedecliningto124Mt(-3Mt/-2.2%)owingtoVietNam’sweakerdemand.EUimports,instead,areexpectedtorisetoabout82Mt,upby20Mtoralmost33%,asthedemandforcoal-firedelectricitygenerationsurgedinviewofhighgasprices.TheEuropeanUnionwill,thus,endupslightlybelowthelevelofKorea,whichisforecasttoincreasethermalthermalcoalimportsto92Mt(+2Mt/~2.2%).From2022,thermalcoalimportsareexpectedtosteadilycontracttoabout936Mtin2025,asChinaandIndiareducetheirdependencyonimportsandtheEuropeanUnionturnsawayfromcoal-firedpowergeneration.TheEuropeanUnionpoststhesharpestdeclineinimports(-45Mt/-56%),followedbyIndia(-27Mt/-18%)andJapan(-24Mt/-17%).Bycontrast,importsinpartsofAsiaareexpectedtorise.ExcludingChina,India,JapanandKorea,Asia’sthermalcoalimportsareforecasttogrowby29Mtto231Mtby2025.TheincreaseismainlyledbySoutheastAsiancountriessuchasVietNam,thePhilippines,andMalaysia.Until2025,theshareofthermalcoalinoverallcoalimportsisexpectedtodeclinetoabout74%.Themajorityofimportswillremainseaborne(94%).Ourforecast,however,faceconsiderableCoal2022PAGE61IEA.CCBY4.0.Tradeuncertaintiesinviewoftheongoingenergycrisis,theinvolvedpricedevelopmentandtheunclearprospectsoftheramp-upofIndia’sdomesticsupply.China’smonthlythermalcoalimports,2020-2022IEA.CCBY4.0.Source:IHSMarkit(2022),CoalPriceDataandIndexes.India’smonthlythermalcoalimports,2020-2022IEA.CCBY4.0.Source:IHSMarkit(2022),CoalPriceDataandIndexes.0510152025303540JanFebMarAprMayJunJulAugSepOctNovDecMt2020202120220510152025303540JanFebMarAprMayJunJulAugSepOctNovDecMt202020212022Coal2022PAGE62IEA.CCBY4.0.TradeThermalcoalimportsdeclineanduncertaintiesriseGlobalthermalcoalimportchanges,2021-2025IEA.CCBY4.0.Seabornethermalcoaltradechangesbybasin,2021-2025IEA.CCBY4.0.Note:The“Indian”categorycoversIndia,Pakistan,BangladeshandSriLanka.8008208408608809009209409609801000102010401060202120222025MtImportsChinaIndiaJapanKoreaOtherAsiaEuropeanUnionRestofworld8008208408608809009209409609801000102010401060202120222025MtTradevolumeAtlanticPacificIndianCoal2022PAGE63IEA.CCBY4.0.TradeSanctionsacceleratetheshiftofRussia’sexportseastwardSanctionsonRussia’scoalexportshaveupendedtraditionaltradeflows,especiallytoEurope,withshipmentssteadilymovingeastwardtocountriesnotpartytointernationalagreements.TheEuropeanUnion’sbanonRussia’scoalexportswaspartiallyimplementedinApril,althougharrivalswerealloweduntil10August.Russia’scoalexportstoEuropeancountriesstartedtodeclineinMarchbeforeplummetingwhenthebantookfulleffectinearlyAugust.Duringthefirsthalfof2022,Russia’sexportsofthermalcoalwerealreadywellbelowthelevelin2021.WhentheEUbancamefullyintoforceinAugust,EuropeancountrieshaltedimportsandexportsincreasedtoIndia,China,TürkiyeandKorea,thoughthevolumesonlypartiallyoffsettheplungeinexportstotheWest.ExportstoAsiawereconstrainedbylimitedrailcapacitywithinRussia.Inaddition,sharplyhigherfreightratesforRussianexportsandsecuringfinancingandinsurancebecameincreasinglydifficult.Intotal,weexpectRussia’sthermalcoalexportstodeclineby10%to157Mtin2022.Thelowervolumes,however,largelyreflecttheendofland-basedexportstoPolandandUkraine,whichcannotbereroutedeastwardintheshorttermduetorailwaybottlenecks.Russia’sthermalcoalexportsareexpectedtodeclinefurtherin2023,constrainedbysanctions.Atthesametime,bytheendofourforecastperiod,weforecastEurope’sdemandforcoalimportstodeclineastheshifttocleanerfuelsgatherspace.AlthoughRussiawillprobablyimproveexistingexportinfrastructureeastwards,AsianimportdemandisforecasttodeclinemainlyasaresultofexpandingdomesticproductioninIndiaandChina.Asaconsequence,weexpectRussia’sthermalcoalexportstodeclineto~150Mtin2025,about4.3%belowthe2022exportvolume.Monthlyy-o-ychangeofthermalcoalimportsfromRussiabydestination,2022IEA.CCBY4.0.Source:IHSMarkit(2022),CoalPriceDataandIndexes.-7-5-3-11357MtChinaJapanKoreaChineseTaipeiIndiaSoutheastAsiaTürkiyeEuropeanUnionUnitedKingdomOtherCoal2022PAGE64IEA.CCBY4.0.TradeIndonesiaprovestobethemostflexibleexporterofthermalcoalIndonesia’sthermalcoalexportsareexpectedtoreach469Mtin2022,9%abovepreviousyear.Thecountry’scoalexportsaccountforabout7%ofglobalthermalcoaldemand.Facedwithashortageinthedomesticmarket,theIndonesiangovernmentimposedabanoncoalexportsinJanuary2022.Thebanwasimposedinresponsetonon-compliancebysomecoalproducerswithanobligationthatrequiresproducerstoprovideatleast25%oftheiroutputtothedomesticmarket.ThermalcoalexportsinJanuaryplummetedtoabout13Mt,down66%fromyear-agolevels.AsWesterncountriesrefrainedfrombuyingRussiancoalandChinareduceditsimports,IndonesianexportsshiftedtowardsEurope.In2022,Indonesiaisexpectedtopostrecord-highexportstoEurope.Comparedto2021,thermalcoalexportsincreasedfrom0.2Mtto2.3Mtduringthefirstsevenmonthsoftheyear.MostoftheseshipmentswenttoItaly,theNetherlands,PolandandSwitzerland.Withanexpectedgrowthof37Mtin2022,Indonesiaisunderscoringthatithasthemostflexiblecapacityandistheonlymajorexporterwithcapacityforaquickramp-up,albeitmostlyoflowcalorificvalue(CV)coal.In2022,Australia’sthermalcoalexportswereheavilyaffectedbyinclementweatherconditionsandskilledlabourshortages.BetweenJanuaryandAugust,exportswere8%lowerthanayearearlier.Inviewofthebadweatherconditionsexperiencedformuchoftheremainderoftheyear,weexpectAustralia’sthermalcoalexportstodecreaseby15Mtto184Mt.SouthAfricanproducerscontinuetostrugglewithseverelogisticalshortages.However,exportsareforecasttorecoverfromlastyear’sdeclineto69Mt(+10%)in2022.Benefitingfromhighmarketprices,otherAfricancountries,suchasTanzaniaandBotswana,enteredtheexportmarket.ThermalcoalexportsfromAfricancountriesotherthanSouthAfricaareforecasttoalmostdoubleto11Mtthisyear.IntheAmericas,exportsfromtheUnitedStatesareexpectedtoedgemarginallylower,to35Mt(-2.8%).Colombia’sexportsareprojectedtofallforasecondyearinarowto52Mt(-3.7%),assmallerdomesticsuppliers’elevatedexportsdonotoffsettheweather-relatedoutagesfacedbyColombia’slargestexporterDrummond.Afterrisingin2021and2022,globalthermalcoalexportswilldecreasecontinuouslyuntil2025,to936Mt,whichis72MtlowerthaninCovid-19year2020.ThedeclineisdrivenbystrongincreasesindomesticsupplyinChinaandIndia,andlowercoal-firedpowergenerationintheEuropeanUnion.Theshareofthermalcoaltradeinglobaldemand,therefore,declinestoabout13%.Intotal,allsuppliers’exportsdecrease.WhileexportsfromIndonesiadeclinebyabout14%,Australia’sexportscontractonlymarginally(-0.5%).Russia’sexportsfallby4.3%comparedto2022whileNorthAmericanvolumesdecrease28%by2025.Coal2022PAGE65IEA.CCBY4.0.TradeAllmajorsupplier’sthermalcoalexportsdeclinethrough2025Indonesia’smonthlyy-o-ythermalcoalexportchangesbydestination,2022IEA.CCBY4.0.Source:IHSMarkit(2022),CoalPriceDataandIndexes.Globalthermalcoalexportchanges,2021-2025IEA.CCBY4.0.-30-25-20-15-10-5051015MtChinaJapanKoreaChineseTaipeiIndiaSoutheastAsiaEuropeanUnionOther8008208408608809009209409609801000102010401060202120222025MtTotalIndonesiaAustraliaRussiaSouthAfricaColombiaUnitedStatesRestofworldCoal2022PAGE66IEA.CCBY4.0.TradeMetallurgicalCoalCoal2022PAGE67IEA.CCBY4.0.TradeMetcoaltradecontinuestobeconcentratedinAsia,withAustralialeadingexportsAlthoughmetcoaljustaccountsfor23%oftheglobalcoaltrade,internationalmarketsaremuchmoreimportantformetcoalthanforthermalcoal.In2021,importsofmetcoalprovided~29%(324Mt)ofglobaldemand,ofwhichabout~91%wasseaborne.Metallurgicalcoalexportsdeclinedforthesecondyearinarow,fallingto308Mtin2021.Themetcoalmarketishighlyconcentratedontheexportside.Australiaisbyfarthelargestexporterwithamarketshareof~56%in2021.ItwasfollowedbytheUnitedStates(13%),Russia(13%)andCanada(9%).Thefoursuppliersaccountfor~91%ofallmetallurgicalcoalexports.About72%ofthemetcoalwasimportedbytheAsiaPacificregionin2021.Foryears,Chinahasbeenthelargestimporterofmetcoal,butvolumesfellsharply(-25%)in2021duetoacombinationofweaksteelproduction,abanonAustraliancoalimportsandCovid-19restrictionstoMongolianexports.Inturn,Indiamovedtothetopposition,accountingforabout20%(66Mt)ofglobalmetcoalimports,followedbyChina(17%),andJapan(14%).TheEuropeanUnionaccountedforabout15%.ThelargestrelativeincreaseinimportswasinSoutheastAsia(+42%/+7Mt)duetostrongindustrialgrowthandapost-pandemiceconomicrecovery.TheEuropeanUnionalsoimported7Mtmorethanin2020,whichisjustapartialrecoverysinceimportsdroppedby9Mtin2020.DuetoanunofficialChinesebanonAustraliancoalinresponsetodiplomatictensionsin2021,Australia’smetcoalexportstothecountrydroppeddramatically,to6Mtfromabout40Mtin2020.Australia’sexportsshiftedtootherAsiancountriessuchasIndia(56Mt/+21%),Japan(34Mt/+13%),andKorea(24Mt/+33%).ExportstotheEuropeanUnionalsoincreased,byabout32%to17Mt.China’smetcoalimportsfromMongoliaalsofellsharply,from19Mtin2020to11Mtin2021,aspandemiccontainmentmeasuresatthebordercurbedthetruck-basedexports.ChinafilledthegapbyincreasingimportsfromRussia,theUnitedStatesandCanada.Coal2022PAGE68IEA.CCBY4.0.TradeAustraliadominatesmetcoaltradeMaintradeflowsinthemetallurgicalcoalmarket,2021(Mt)IEA.CCBY4.0.Note:Mapvaluesarebasedonavailableexportdataanddonotnecessarilymatchimportnumbers.Coal2022PAGE69IEA.CCBY4.0.TradeChinaandIndialeadthegrowthinmetcoalimportsthrough2025Globalmetcoalimportsareexpectedtodecline5.4%to307Mtin2022,inlargepartbecauseoftheweakereconomy,especiallyinChina.ThestrugglingconstructionsectorweighedheavilyonChina’ssteelandthereforemetcoaldemand.WeforecastChina’smetcoalimportstodeclineby17%thisyeartojust45Mt.WhileimportsfromAustraliaarestilldownduetotheunofficialbanonAustraliancoal,ChinaincreaseditsimportsfromRussiaandMongolia.MongoliacompletedaraillinktoChinathisyear,whichallowsthecountrytoboostitsexports.Untilthen,coalwastransportedbytrucktoChinaandpandemiccontainmentmeasuredatthebordercurbedthetradecapacity.Metcoalimportsofmanyothercountries,suchasTürkiye(-2Mt),Korea(-1Mt)andGermany(-1Mt),alsodeclinedashighenergypricesweighedonsteeldemandandproduction.Meanwhile,India’smetcoalimportsareforecasttoincreaseby~4Mtin2022astheeconomyperformscomparativelywell.Withtheglobaleconomyexpectedtobebackonastrongergrowthtrajectoryby2025,weforecasta6.4%rise(+20Mt)inmetcoalimportsbythen.ThemajorityoftheincreasecanbeattributedtoIndia(+15Mt),followedbyChina(+7Mt),whereweexpecteconomicgrowthtoaccelerateandsteelproductiontoincreaseagain.However,thegainsarepartiallyoffsetbylowerimportsfromJapan(-4Mt),Korea(-2Mt)andtheEuropeanUnion(-3Mt).China’smonthlyy-o-ymetcoalimportchangesbyorigincountry,2022IEA.CCBY4.0.Source:IHSMarkit(2022),CoalPriceDataandIndexes.-6-226MtAustraliaRussiaMongoliaUSACanadaOtherCoal2022PAGE70IEA.CCBY4.0.TradeDespitetheadverseweatherconditions,AustraliaremainstheleadingmetcoalexporterMetcoalexportsareforecasttoedgemarginallylowerin2022,to307Mt(-0.4%).ExportsfromAustralia,byfartheworld’slargestmetcoalexporter,areexpectedtodeclineby~3%(-5Mt),asheavyrainfallsdisruptedcoalminingandtransportation,and,toalesserextent,assomesemi-softcokingcoalandPCIwassoldintothermalmarkets.ExportstoIndiaaresettofallthemost,whileexportstoEuropeincreasedslightly.Onaglobalscale,thelowerAustralianexportsarealmostfullyoffsetbyincreasedvolumesfromMongolia(+6Mt),whichpartiallyrecoveredfromasteep8Mtdroplastyear.Amongotherexportingcountries,weexpectCanada(+2Mt)andMozambique(+1.5Mt)toexpandtheirmetcoalexportsin2022,whileRussia’sexportsdecline(-5.9Mt).By2025,theinternationalmetcoalmarketisforecasttogrowby20Mtto326Mt(+6.4%).MostoftheincreaseisexpectedtocomefromAustralia(+13Mt)asweatherconditionsnormalise,improvingmineandinfrastructureperformance.ConditionswerepoorforthreeconsecutiveyearsduetotheLaNinaweatherphenomenon.Inaddition,metcoalprojectsunderdevelopmentareexpectedtoadvanceastheycontinuetofindfinancing,insuranceandgovernmentsupport-muchmoresothanthermalcoalprojects.Russia’smetcoalexportsareforecasttorecoverby3.6Mtaseastboundinfrastructurebottlenecksareremoved.MetcoalexportsfromcountrieslikeMongolia(+1.3Mt),Canada(+1.5Mt)andMozambique(+0.3Mt)areexpectedtocontinuethegrowthofrecentyears,whileexportsfromtheUnitedStatesareforecasttodeclineby1.2Mtby2025.Australia’smonthlymetcoalexportchangesbydestination,2022IEA.CCBY4.0.Source:IHSMarkit(2022),CoalPriceDataandIndexes.-3-2-1012MtChinaJapanKoreaIndiaSoutheastAsiaEUOtherCoal2022PAGE71IEA.CCBY4.0.TradeGrowingmetcoalimportdemandmetbyAustraliaMetcoalimportchanges,2021-2025IEA.CCBY4.0.Metcoalexportchanges,2021-2025IEA.CCBY4.0.280290300310320330340350202120222025MtChinaIndiaJapanKoreaOtherAsiaEuropeRestofworld280290300310320330340350202120222025MtCanadaAustraliaRussiaMongoliaMozambiqueUnitedStatesRestofworldCoal2022PAGE72IEA.CCBY4.0.PricesandcostsPricesandcostsCoal2022PAGE73IEA.CCBY4.0.PricesandcostsPricesCoal2022PAGE74IEA.CCBY4.0.PricesandcostsInternationalcoalpricesreachrecordhighs-thermalcoaleventradedabovecokingcoalAfterfallingto14-yearlowsin2020,thermalcoalpricesreboundedstronglyin2021.Mostinternationalthermalpriceindicesreachedall-timehighsinOctober,reflectingasupply-demandimbalancefollowingthepost-Covid-19recovery,withcoalandelectricityshortagesinChinaandIndia,tonamethemostrelevantcases.Newcastlefreeonboard(FOB)pricesforhigh-gradethermalcoalwithacalorificvalueof6,000kcal/kgandtheAPI2prices(indexforcoaldeliveriestoEurope)reachedanunprecedentedUSD253/tandUSD254/t,respectively.PriceseasedagainbytheendoftheyearasChina'seffortstoincreaseproductionborefruit,andcoalinventoriesreturnedtonormal.InJanuary2022,spotthermalcoalpriceswereinitiallypushedupwhentheIndonesiangovernmentdecidedtosuspendexportsimmediatelyinresponsetodomesticsupplyshortages.AttheendofJanuary,Australianhigh-gradecoalwastradingatUSD261/t,whichwasanewrecordatthetime,whilepricesinEurope(API2)tradedloweratUSD206/t.Russia'sinvasionofUkrainetriggeredpricesworldwidetoskyrockettoanotherrecordhighofUSD380/tinMarch2022.EuropeanthermalcoalpricescaughtupagainwithAustralianprices.Bycontrast,SouthChina’simportpriceswerelessaffectedduetolowerdemand,enhanceddomesticproductionandtheopportunitytobuydiscountedRussiancoal.WiththeendoftheheatingseasonintheNorthernHemisphere,globalseabornethermalcoalpricessoftenedbrieflyinApril.InMay,EuropeanandAustralianpricespickedupagain.Australianhigh-gradethermalcoalpricesclimbedstraighttothenextrecordhighofaboutUSD425/tinMayasfloodinginthecountryhamperedcoalproductionandtransportationwhileutilitiesinEuropeandNortheastAsiasoughttoobtainsuppliesofnon-Russiancoal.EuropeanimportpricesforthermalcoalwerelowerthanAustralia’sinearlysummerbutjumpedinJulywhenRussiareducedgasflowstoEurope.RisingfearsRussiacouldcutoffsuppliesaltogethersentnaturalgaspricesinEuropesoaring,promptingtheregion’sutilitiestobuymorecoalanddrivingpricesaboveUSD400/t.ThepriceofAustralianhigh-CVthermalcoalcontinueditsupwardtrend,reflectingstrongdemandfromJapaneseutilitiesreliantonthiscoaltypeandtheinabilityofAustralianexporterstosignificantlyincreaseexportvolumes,partlyduetoadverseweatherconditions.InSeptember,high-CVthermalcoalpricesreachedUSD443/t,thefourthrecordwithin12months.InEurope,gasandcoalpricesdeclinedinSeptember,asthecontinentappearedbetterpreparedforwinterthanexpected-inspiteofasteepreductioninRussiangaspipelinedeliveriestoEurope.InNovember,EuropeanandAustralianpricesreversedtheirdownwardtrendswiththestartoftheheatingseason.SouthChina’sthermalcoalimportpricestrendeddownwardsfromMarchtoAugust,ashigherdomesticproductionandmoderateCoal2022PAGE75IEA.CCBY4.0.Pricesandcostsdemandledtolowerimportvolumes.Inaddition,Chinesecompanies,likethoseinvariousotherimportingcountries,arebuyingRussiancoalatsubstantialdiscounts.InAugustandSeptember,importpricesinSouthChinaincreasedslightlyduetostrongerimportdemand.Asevereheatwaveanddroughthitthecountry,reducinghydropowergenerationandpushingupcoaldemandforcooling.Coal2022PAGE76IEA.CCBY4.0.PricesandcostsInternationalthermalcoalpricesclimbfromrecordtorecord,whilepricesinChinadivergeMarkerpricesfordifferenttypesofcoal,2020-2022IEA.Allrightsreserved.Note:FOB=freeonboard.CIF=cost,insuranceandfreight.CFR=costandfreight.Source:ArgusMediagroup.Allrightsreserved.0100200300400500Jan-21Mar-21May-21Jul-21Sep-21Nov-21Jan-22Mar-22May-22Jul-22Sep-22Nov-22USD/tNewcastleFOB(6000kcal/kg)ARACIF(6000kcal/kg)SouthChinaCFR(5500kcal/kg)Coal2022PAGE77IEA.CCBY4.0.PricesandcostsInareversaloffortune,thermalcoalhastradedabovecokingcoalsincemid-2022Cokingcoalpricessurgedin2021,drivenbyglobaleconomicgrowthand,particularly,bystrongdemandfromChina,wheretheeconomygrew8.1%.Inthefourthquarter,cokingcoalpricesreachedrecordhighs.Forexample,pricesforAustraliancokingcoalwithlowvolatilespeakedataboutUSD400/tbeforedecliningslightlyasChina’seconomicgrowthslowed.InJanuaryandFebruary2022,cokingcoalpricesrosefurtherbeforetheRussianinvasionandassociateduncertaintypushedpricestounprecedentedlevels.Inmid-March,atonneofAustralianlow-volatilecokingcoalreachedapeakpriceofUSD658/t.PricestheneasedbutremainedataveryhighlevelofmorethanUSD500/tuntiltheendofMay.SinceJune,priceshavedeclinedagainduetofearsofaglobalrecessionandtheweakperformanceofChina’ssteelindustry.Thisledtoanunprecedentedsituation:cokingcoalpricesfellbelowhigh-CVthermalcoalprices.Sincecokingcoalhasahigherenergycontentthanthermalcoal,cokingcoalcould–theoretically–beblendedwithlower-gradethermalcoaltoreplacemoreexpensivehigh-gradethermalcoal.Toasmallextent,metcoalproducershavestartedtoswitchtothermalcoalbysellingmetcoalproductssuchassemi-softcokingcoalandPCIonthethermalcoalmarketandincreasinglyminingthermalcoalseamsintheirmines.However,thepotentialforswitchingislimitedassuppliershavetofulfiltheirexistingcontracts.Inaddition,technicallimitationsmakeitdifficulttousemetcoalinpowerplants.Thepricespreadbetweenthetwotypesofcoalhasevenwidenedfurther,highlightingtheextraordinarysituationinglobalcoalmarkets.InearlyAugust,low-volatilecokingcoalpricesreachedaninterimlowpointbelowUSD200/tbeforerisingagaintoaroundUSD270/t,partlyaconsequenceofthemet-to-thermalcoalswitch.UntilNovember,priceswereonaconvergingtrajectorybeforethestartoftheheatingseasonreversedthistrend.MarkerpricesfordifferenttypesofAustraliancoal,2021-2022IEA.Allrightsreserved.Note:FOB=freeonboardSource:ArgusMediagroup.Allrightsreserved.0100200300400500600700USD/tAustralianmetcoallow-volatileFOBNewcastleFOB(6000kcal/kg)Coal2022PAGE78IEA.CCBY4.0.PricesandcostsHigher-qualitycoalpostedsharperpriceincreasesThermalcoaltradedinthePacificBasindiffersinquality.Coalcanbecharacterisedprimarilybyitsenergycontent,thecalorificvalue(CV).Althoughdifferenttypesofcoalcansubstituteforeachothertosomedegree,theyeachrepresentseparatemarketsegments.Pricesinthosemarketsegmentsusedtobestronglyconnectedtoeachother.Inthesecondhalfof2021,whendemandwashighandsupplywastightinChinaandIndia,pricesinallmarketsegmentsroseinparalleltorecordlevelsandtheneasedasChina’simportsfellbytheendoftheyear.In2022,however,thepricedevelopmenthasdecoupled.ThecurrentsupplystrainsinEuropeandNortheastAsiaaremainlyaffectingpricesforhigh-gradecoal.AustralianthermalcoalwithaCVof6000kcal/kgistradingformorethantwicethepriceofcoalwithaCVof5500kcal/kg.Japanesebuyers,inparticular,whoareturningawayfromRussiancoalsupplies,havelimitedalternativestobuyingAustralianhigh-gradecoal,aspowerplantsandlogisticsareoptimisedforthistypeofcoal.Simultaneously,the“LaNina”weathereventbroughtadverseweatherconditionssuchasheavyrainfallsandfloodingtoAustralia,hamperingcoalexports.Incomparison,pricesforlow-gradeIndonesiancoalhavehardlychangedsinceApril2022,mainlybecauseIndonesiansupplyexpandedandChina’simportdemandwaslower.Furthermore,competitionfromRussiancoalexports,whichtradeatlargediscounts,increased.MarkerpricesfordifferenttypesofAustraliancoal,2021-2022IEA.Allrightsreserved.Note:FOB=freeonboardSource:ArgusMediagroup.Allrightsreserved.0100200300400500USD/tNewcastle(6000kcal/kg)Newcastle(5500kcal/kg)Indonesia(4200kcal/kg)Coal2022PAGE79IEA.CCBY4.0.PricesandcostsBigdiscountsforRussiancoalfindnewbuyersinAsiaManycountriesandcompaniesarehesitanttobuycoalfromRussiainresponsetotheRussianinvasionofUkraine.Westernsanctions,thatincludetheexclusionfromtheSWIFTsystem,putamajorhurdleinplaceformakingpayments.TheUnitedStatesannouncedageneralbanonRussiancoalinMarch,followedbytheEuropeanUnion,thesecond-largestimporterafterChina,inApril.Also,someJapaneseandKoreanutilitiesannouncedtheyhavestoppedbuyingRussiancoal.Altogether,theEuropeanUnion,JapanandKoreaaccountedforabout40%ofRussiancoalexportsin2021.AlthoughtheEUcoalbancameonlyfullyintoforceinearlyAugust,itimmediatelyimpactedspotprices.RussiancoalpriceshavedeclinedsinceMarch,whileARA(AmsterdamRotterdamAntwerp)pricesrosefurther.ThediscountforRussiancoalatBalticportsrosefrom41%inMarchto73%inSeptember.FromMarchtoJune,theimportbanputmorepressureonexportpricesatRussia'sBalticportsandVostochny,whilepricesatBlackSeaports,whichmainlysupplyTürkiye,theMiddleEast,NorthAfricaandIndia,wereaboutUSD40/thigher.Inthesecondhalfoftheyear,WesternRussianpricesfellbyaboutUSD20/tinAugustwhentheEUcoalimportbancameintoforce.PricesattheFarEasternportofVostochny,instead,werepusheduptoaboutUSD80/taboveWesternRussianpricesdrivenbyincreasingimportsfromChineseandSoutheastAsianbuyers.PricesevenreachedARAlevels,beforethestartoftheheatingseasonpushedEuropeanpricesanditspremiumonRussianprices.Inthecategoryofmid-CVcoal(5500kcal/kg),firmdemandfromAsiameetingrailwayconstraintsdrovecoalpricesatFarEasternRussianportsaboveAustralianpricesinOctober,forthefirsttimesinceFebruary.InNovember,pricesonafobbasisattheportofVostochnysettledataroundUSD172/t,apremiumofaroundUSD30/ttoAustralianprices.EuropeanandRussianthermalcoal(6000kcal/kg)pricemarkers,2021-2022IEA.Allrightsreserved.Note:API=Argus/McCloskey’sCoalPriceIndex.FOB=freeonboard.CIF=cost,insuranceandfreight.Source:ArgusMediagroup.Allrightsreserved.0100200300400500USD/tARACIFBalticportsFOBBlackSeaFOBVostochnyFOBCoal2022PAGE80IEA.CCBY4.0.PricesandcostsChina’simportpricespreadnarrowsonhighdomesticproductionandtightseabornemarketsInrecentyears,China’spoliciestocurbimportshaveledtoaspreadbetweendomesticcoalpricesandpricesinthePacificBasin.ThemaindriverhasbeenChina’simportquotas,exacttermsandconditionsofwhichareunknown.Moreover,ChinaintroducedanunofficialbanonAustraliancoalin2020,raisingthepremiumChinesebuyershavetopayfordomesticcoal.Thepricespreadincreaseduntil2020,reachingapeakofUSD47/tinDecember.Onaverage,Chinesebuyershadtopaya40%premiumtodomesticcoalonimportpricesin2020.Atthebeginningof2021,thepricespreaddecreasedassoonasChina'sheatingseasonended.Inthesecondhalfoftheyear,China’scoalsupplycouldnotkeepupwithdemand,andimportvolumesandpricesrosesharply.Asaresult,thepricespreadspikedtoUSD87/tinOctober.Sincethen,China’ssupplyhasincreasedsharplyandimportdemandhasfallen-andwithitthepricespread.RisingdemandinEuropekeptseabornecoalpriceshighandcausedthepricespreadtotipintothenegativeforthefirsttimeinDecember2021.In2022,seabornecoalmarketsaretightduetoinsufficientsupply,exacerbatedbytheRussianaggressioninUkraineandsubsequentgeopoliticaltensions.Atthesametime,Chinahasbecomelessdependentoncoalimportsasdomesticsupplyincreases.Asaresult,thepricespreadbetweenChina’sdomesticcoalmarketandthePacificseabornecoalmarketfellbelowzeroseveraltimes,averagingonlyUSD1.60/tinthefirstninemonthsof2022.PricearbitragedomesticversusimportedcoalinChina,2020-2022IEA.CCBY4.0.Note:FOB=freeonboard;CIF=cost,insuranceandfreight;VAT=value-addedtax.Source:CRU(2022).-100-50050100150200250300350400Jan20Jul20Jan21Jul21Jan22Jul22USD/tDomesticminusimportedcoalpriceinSouthChinaSouthChinadomesticFOBincl.VAT,etc.(5500kcal/kg)SouthChinaCFRincl.VAT(5500kcal/kg)Coal2022PAGE81IEA.CCBY4.0.PricesandcostsAstrongappreciationoftheUSdollarmakescoalimportsevenmoreexpensiveinmanyplacesInternationalcoaltradecontractsarenegotiatedmainlyinUSdollars.Therefore,thevalueofacountry'scurrencyagainstthedollaraffectshowaffordablecoalimportsare.Inrecentyears,theexchangeratesofmajorcoal-importingcountrieshavefluctuatedonlyslightly.CurrenciessuchastheChineseyuan,theeuro,andtheBritishpoundappreciatedin2020and2021,primarilyduetotheFederalReserve'sloosemonetarypolicy.OneexceptionistheTurkishlira,whichhasdepreciatedsharplyinrecentyears.Facedwithrisinginflationratesfrom2021,theUSFederalReservebegantoraiseinterestrates.Asaresult,thedollar'srelativevalueroseagainstothercurrencies.Thisdevelopmentmakesthecurrentenergycrisisevenmoreexpensiveforcountriesthatrelyonhighenergyimports.TheJapaneseyen,forexample,depreciatedby16%inthefirstelevenmonthsof2022.Theeuro,Koreanwon,Britishpound,andPolishzlotyalsolost10-11%invaluethisyear.ThedepreciationoftheTurkishliraacceleratedaswellleadingtoalossinvalueofmorethan46%comparedtotheUSdollar.Duetothelossinvalue,importersfromChinaandIndiareportedlyturnedtolowergradesofcoal,boostingtheIndonesianlow-CVcoalmarket.ThesanctionsagainstRussiahaveforcedRussianproducerstolookforalternativebuyers,andpaymentsinyuan,rupees,rublesorEmiratidirhamhavebeenreported.Year-on-yeardevelopmentofselectedimportingcountries’currenciesagainsttheUSdollar,2020-2022IEA.CCBY4.0.Notes:CNY=Chineseyuanrenminbi.INR=IndianRupee.EUR=Euro.JPY=JapaneseYen.KRW=KoreanRepublicWon.GBP=GreatBritainPound.PLN=PolishZloty.TRY=TurkishLira.2022valuesrepresentaverageexchangeratestoNovember2022.Source:OECD(2022),MonthlyMonetaryandFinancialStatistics(MEI)exchangerates(USDmonthlyaverages).-50%-40%-30%-20%-10%0%10%202020212022CNYINREURJPYKRWGBPPLNTRYCoal2022PAGE82IEA.CCBY4.0.PricesandcostsMostcoalminersintheUnitedStatesareunabletotakeadvantageofhighpricesAbout85%ofthecoalproducedintheUnitedStatesisconsumeddomestically.Mostdomesticcoaltradetakesplaceunderlong-termcontractswithfixedprices.Asaresult,manyUScoalminescanbarelybenefitfromthecurrenthighworldmarketprices.USpowerplants'averagecostsfordeliveredcoalhaveincreasedbyonly~31%fromJanuary2021toSeptember2022.Asoperatingcostshavesimultaneouslyrisensharply,theyhaveundercuttherisingsalesrevenuesofsomemineoperators.Inresponse,surfacemineshavebeguntolinksalesagreementsandpricestodieselindexestogainpriceflexibilityandcovertheelevatedproductioncosts.Spotpricesforthermalcoal,mostlyaffectedbyexportcoalprices,haveincreasedenormouslyoverthesameperiod,almostthreefoldintheCentralAppalachianregionandmorethanfivefoldintheIllinoisBasin.SpotpricesinthePowderRiverBasinwerenotresponsivetocurrentglobalcoalpricesbecauseonlylimitedvolumesaretransportedtoportsonCanada’seastcoastforexport.Pricesroseonlyinlate2021ascoalinventoriesfellacrosstheUnitedStates.DespitehighspotpricesinCentralAppalachiaandtheIllinoisBasin,coalproducersdonotseemtohaveanappetitetoincreaseproductionandtheirshareofexportedcoal.Thelackoflong-termperspectivesmakesfinanceorevenhiringworkforceveryhard.TotalUScoalexportsareexpectedtoincreaseonlymarginallythisyear.SpotcoalpricesindifferentregionsoftheUnitedStatesandcostforcoaltoelectricunits,2021-2022IEA.Allrightsreserved.Source:ArgusMediaLtd.Allrightsreserved.EIA(2022),STEO.050100150200250USD/tPowderRiverBasinCentralAppalachiarailIllinoisBasinrailormineCosttoelectricunitsCoal2022PAGE83IEA.CCBY4.0.PricesandcostsThermalcoalpricessurpassedoilonanenergybasisSincethesecondhalfof2021,pricesforenergycommodities,suchasoil,coalandgas,havesurged,albeitbyvaryingdegrees.Themaindriversin2021havebeentheeconomicrecovery,particularlyinAsiaandNorthAmericaandtheconstraintonsupplyexpansionandRussia’sreducedgassuppliestoEurope.In2022,theRussianinvasionofUkraineandthesubsequentgeopoliticaltensionsaddedturmoilanduncertainty,leadingtowhatcanbeconsideredthefirstglobalenergycrisis.Duringtheenergycrisis,theimportanceofcoalasasubstituteforscarcegasincreasedworldwide,whileoildemanddeclinedastheglobaleconomyslowed.Forthefirsttimeever,coalprices(Newcastlehigh-CVcoal)–intermsofenergycontent–roseabovethepriceofBrentcrudeoiltwicein2022,inAugustandNovember.Crudeoil,whichhasahigherfundamentalvalueintermsofcalorificvalue,usuallytradesatamultipleofcoalprices,becauseversatilitymakesitasuperiorfuel,suitableformanydifferentapplications.Thisphenomenonwasshort-lived,however,asNewcastlecoalpricesfellshortlyafterwardsandcrudeoilpricesrecoveredsoon.Gasandcoalpricestendtobehighlycorrelated,asbotharelinkedthroughthepotentialforswitchingbetweengas-andcoal-firedpowergenerationinmostcountries.In2021,coalpricescloselyfollowedtheupwardtrendofgaspricesuntilAugust,reflectedinahighcorrelationbetweenbothprices.However,inthesecondhalfof2021,coalandgaspricesontheEuropeanmarketdecoupledseveraltimesandshowedanegativeornear-zerocorrelation.Whilegaspricesreachedpeaklevels,peakinginOctoberandDecember,coalpricesdeclinedfromarecordhighinOctoberasChina’simportdemandweakened.In2022,pricevolatilitywashighforbothcommoditiesandsowasthemovingcorrelationcoefficient.BothpricesspikedwhenRussiastarteditsinvasionofUkraine,thenfellandtrendedsidewaysuntilJune.Sincethen,gaspriceshaverisenrapidlyasRussiacurbedflowsandEuropefocusedonfillingstorage.However,plantavailabilityandlowwaterlevelsontheRhine,whichimpededcoalshipmentstopowerplantsinSouthernGermany,constrainedcoal-firedpowergeneration.Europeancoalpricescontinuedtrendingsidewaysatonlyslightlyelevatedlevels.SinceSeptember,pricesforbothcommoditieshavedeclinedhandinhand.Coal2022PAGE84IEA.CCBY4.0.PricesandcostsMarkerpricesforARACIFcoalandBrentCrudeOil,2021-2022IEA.Allrightsreserved.Note:FOB=freeonboardSource:ArgusMediagroup.Allrightsreserved.CorrelationofARACIFcoalandTTFgasprices,2020-2022IEA.Allrightsreserved.Note:CIF=cost,insuranceandfreight.TTF=TitleTransferFacilitySource:ArgusMediagroup.Allrightsreserved.0255075100USD/MWhNewcastleFOB(6000kcal/kg)BrentCrudeOil-1.0-0.50.00.51.00481216CorrelationIndexARACIF(6000kcal/kg)Index(leftaxis)TTFIndex(leftaxis)60daymovingcorrelation(rightaxis)Coal2022PAGE85IEA.CCBY4.0.PricesandcostsForwardcurvessuggestverytightmarketconditionsuntil2025TheforwardpricecurveofAPI2(apriceindexforcoaldeliveriestoEurope)showsbackwardation.Inotherwords,spotpricesarehigherthanfutureprices,indicatingshort-termshortageandmarketexpectationsthatpriceswilldecline.However,theforwardcurve’sbackwardationhasturnedsofterinrecentmonthsasforwardpriceshavesignificantlyshiftedupward.WhenpricespeakedforthefirsttimeinOctober2021,marketparticipantsbelievedmarketimbalanceswouldbeshort-livedandpriceswouldnormalisetolevelsbelowUSD100/twithinoneyear.Inmid-MarchwhenspotpriceswereclosetoUSD400/t,evenlong-termAPI2swapsforthecalendaryear2025weretradedjustbelowUSD100/t.Fivemonthslater,inmid-SeptemberspotpriceshaddeclinedslightlytoUSD366/tbutswappricesforcoalfor2025almosttripledtoUSD281/t.Twomonthslater,mid-November,afterspotpriceshadslumpedtoUSD188/t,API2swappricesfor2025fellagaintoUSD167/t.Afterspotpricesreturnedtoanupwardtrajectorywiththebeginningoftheheatingseason,swappricesfor2025increasedtoUSD237/tatthebeginningofDecember.Thus,coalmarketsareexpectedtoremaintightfortheforeseeablefuture.However,thefuturepricedirection,willstronglydependonthedevelopmentsontheEuropeannaturalgasmarkets.FollowingRussia’sinvasioninUkraine,RussiahassharplyreducedgassuppliestoEurope,andthecontinentnowreliesonsuppliesfromtightglobalLNGmarkets.FromMarchtoOctober,futurepricesofgas(TTF,July2025contract)rosefromUSD12.20/MBtutoUSD22.10/MBtu,asmallerrelativeincreasecomparedtocoalprices.API2spotpricesandforwardcurves,2021-2025IEA.Allrightsreserved.Source:ArgusMediagroup.Allrightsreserved.0100200300400500USD/tSpotOct-21Mar-22Sep-22Nov-22Coal2022PAGE86IEA.CCBY4.0.PricesandcostsCostsCoal2022PAGE87IEA.CCBY4.0.PricesandcostsCoalsupplycostsincreasedin2021butpricesrosemoreandprofitabilityimprovedThesupplycostsformetallurgicalcoalaregenerallyhigherthanthoseforthermalcoal.Thisisbecausemetcoalismoreoftenminedundergroundand,onaverage,comesfromsmallercoalminesthanthermalcoal.Inaddition,thepreparationcostsformetcoalarehigherthanforthermalcoal.In2021,thecostofcokingcoalsupplywasrelativelystablecomparedto2020,buttheamountofexportedcokingcoalincreased.Inparticular,Russia'sElgalow-costcoalmine,whichrampedupexportsin2021,hasplaceditselfatthebeginningoftheexportsupplycurveforcokingcoal.Aspricesincreased,sodidtheprofitabilityofcokingcoalproduction.TheaverageFOBpriceforAustralianlow-volatilemetcoalroseby79%comparedtothepreviousyear.ThesupplycostcurveforhighandlowCVthermalcoalshiftedupwardasthecostofinputfactorssuchasfuel,steelproductsandlabourincreased.Inparticular,miningcostsatIndonesianandAustralianminesrose.Thekeyfactorherewasroyalties,whichroughlydoubledinAustraliaandalmosttripledinIndonesia.Inaddition,thedepreciationoflocalcurrenciesledtoanincreaseinoperatingcosts,suchasthecostoffuelandminingequipment.However,theprofitabilityofcoalmines,particularlyhigh-CVmines,increasedsharplyaspricesreachedrecordhighs.TheaverageFOBpriceforAustralianthermalcoalwithaCVof6000kcal/kgincreasedby134%from2020to2021.In2022,coalmineprofitabilityremainsexceptionallyhighaspriceshavecontinuedtorise.Inthefirstninemonths,Australianhigh-CVthermalcoaltradedat~356USD/tonaverage,ay-o-y-increaseof161%.IndicativehardcokingcoalFOBsupplycurve2021andaverageFOBmarkerpricesIEA.Allrightsreserved.Notes:FOB=freeonboard.HCC=hardcokingcoal.Costcurvesaccountforvariableproductioncosts,overburdenremoval,royalties,inlandtransportationandportusagefees.TheannualaverageFOBmarkerpriceisbasedonthemonthlyaverageindexforAustralianprimehardcokingcoal.The2022priceisbasedontheaverageforJanuary-September.Source:ArgusMediagroup.Allrightsreserved.AdaptedfromCRU(2022),MetallurgicalCostModel(database)050100150200250300350400450255075100125150175200225250USD/tMtAustraliaIndonesiaRussiaUnitedStatesCanadaMozambiqueMongoliaRestofworld2020Australianlow-vol(FOB,2021)Australianlow-vol(FOB,2020)Australianlow-vol(FOB,2022)Coal2022PAGE88IEA.CCBY4.0.PricesandcostsRecordmarginsforcoalproducersIndicativehighcalorific(>5700kcal/kg)thermalcoalFOBsupplycurve2021andaverageFOBmarkerpricesIndicativelowcalorific(<4500kcal/kg)thermalcoalFOBsupplycurve2021andaverageFOBmarkerpricesIEA.Allrightsreserved.Note:Thecostcurvesaccountforvariableproductioncosts,overburdenremoval,royalties,inlandtransportation,andportusagefees.Thecostcurveisnotadjustedfordifferentqualitiesofcoal.Thetransportationcostsgivenaretotheclosestport,sotheFOBcostsofRussianproducersinAsiaaresomewhathigherthanthefigureshows.TheannualaverageFOBmarkerpriceisbasedonthemonthlyaverageindexfromNewcastle/Indonesiansteamcoal.The2022pricesarebasedonthemonthlyaveragefromJanuary-September.Source:ArgusMediagroup.Allrightsreserved.AdaptedfromCRU(2022),ThermalCostModel(database).05010015020025030035050100150200250300350400USD/tMtAustraliaIndonesiaRussiaUnitedStatesSouthAfricaColombiaOthers2020Newcastle(6000kcal/kg,FOB,2021)Newcastle(6000kcal/kg,FOB,2020)Newcastle(6000kcal/kg,FOB,2022)010203040506070809050100150USD/tMtAustraliaIndonesiaRussiaSouthAfricaOthers2020Indonesia(4200kcal/kg,FOB,2021)Indonesia(4200kcal/kg,FOB,2020)Indonesia(4200kcal/kg,FOB,2022)Coal2022PAGE89IEA.CCBY4.0.PricesandcostsInputcostsofcoalminesrosesharplyThecoststructureofcoalminesisdeterminedmainlybyoperatingexpensessuchaslabourandfuelcosts,taxesandroyaltiesaswellastransportationexpenditures(e.g.,forinlandtransportation,portfeesandseabornefreight).Thecostproportiondependsontheminingmethod(surfaceorunderground)andcanvaryconsiderablydependingontheproducer,countryandspecificminesite.Inputfactorssuchasfuel,explosives,tyres,andsteelproductsaretradedinternationally,andpricesfollowglobaltrends.Pricesfortyresandexplosiveshavebeenrelativelystableinrecentyears.Inanoverallinflationaryenvironment,theyhaveincreasedbyabout20%and15%,respectively,sincethebeginningof2021.Incontrast,fuelandsteelpriceshavebeensubjecttowidefluctuations.InthewakeoftheCovid-19pandemic,fuelpricesfelltotheirlowestlevelsince2003inJune2020.Pricesrecoveredin2021andjumpedtorecordlevelsinthefirsthalfof2022amidglobalenergyshortages.Pricesforsteelproductsmorethandoubledin2021astheeconomyrecoveredbeforeslippingslightlyin2022astheeconomicoutlookdeteriorated.Nominalpricesofselectedcommoditiesandinputfactorsusedincoalmining,2020-2022IEA.CCBY4.0.Source:USBureauofLabourStatistics(2022),ProducerPriceIndexes.050100150200250300350Jan-20Jul-20Jan-21Jul-21Jan-22Jul-22IndexDieselfuelExplosivesSteelproductsTyresCoal2022PAGE90IEA.CCBY4.0.PricesandcostsFuelcostsroseinmanycountries,inparticularliftingopencastminingcostsDieselfuelcostsareanimportantfactorinamine’soperatingcost.Inparticular,opencastminesrelyondiesel-fuelledtrucksandotherequipment.AsopencastminingisthepredominantminingmethodinColombiaandIndonesia,fuelpricesareamoreimportantfactorforthemines’profitabilitythan,forexample,inChina,whereopencastmininghasarathersmallshare.In2021,oilpricesrecoveredfromtheverylowlevelsof2020,whentheCovid-19pandemicweighedheavilyonprices.Dieselpricesrosefurtherinmanycountriesin2022.However,theshareoffuelcostsintotaloperatingcostsremainedconstantinmostcountries,asothercostfactorssuchaslabourandsustainingcapitalcostsincreasedevenmore.IndonesiaandRussiarecordedanincrease.Averagefuelcostsandshareintotalcoalminingcostsinselectedcountries,2020-2022IEA.CCBY4.0.Source:AdaptedfromCRU(2022),ThermalCostModel(database).0%5%10%15%20%25%30%35%0246810121416202020212022202020212022202020212022202020212022202020212022202020212022202020212022AustraliaColombiaIndonesiaRussiaSouthAfricaUnitedStatesChinaUSD/tAveragefuelcosts(leftaxis)Shareoffuelcostsintotalminingcosts(rightaxis)Coal2022PAGE91IEA.CCBY4.0.PricesandcostsLabourcostscontinuetoriseinmostcountriesLabourcostsvarysignificantlyamongcoal-producingcountriesandaffectthecompetitivenessofexporters.6InAustralia,Russia,SouthAfricaandChina,labourcostsincreasedin2021,partlyduetotheappreciationofthelocalcurrenciesagainsttheUSdollar.In2022,labourcostsroseinallmajorcoal-exportingcountriesascompaniesseektoincreasecoalproductionandarewillingtopayhigherwagestohireenoughworkers.However,duetoasurgingincreaseofothercostfactorssuchasresourcecosts,theshareoflabourcostsintotaloperationalcostssunkforallconsideredcountries.Averagelabourcostsandshareintotalcoalminingcostsinselectedcountries,2020-2022IEA.CCBY4.0.Source:AdaptedfromCRU(2022),ThermalCostModel(database)6Chinaisincludedbecauseitsdomesticcoastalcoaltradeofmorethan800Mtiscomparablewithglobaltrade.0%10%20%30%40%50%0510152025202020212022202020212022202020212022202020212022202020212022202020212022202020212022AustraliaColombiaIndonesiaRussiaSouthAfricaUnitedStatesChinaUSD/tAveragelabourcosts(leftaxis)Shareoflabourcostsintotalminingcosts(rightaxis)Coal2022PAGE92IEA.CCBY4.0.PricesandcostsGovernmentsraiseroyaltiestoparticipateinhighmarketpricesThenationalandregionalgovernmentssecuretherighttoreceiveroyaltiesforeachtonneofcoalproducedinreturnforgrantingmininglicences.Theheightofroyaltiesvariesfromcountrytocountryandfromregiontoregion.In2021and2022,governmentsacrosstheglobeincreasedroyaltiestobenefitfromrisingcoalprices.Inmanycountries,royaltiesroughlydoubledbothin2021andagainin2022.Australia’sminingregionQueenslandincreasedroyaltiesthemost,bothinabsoluteandrelativeterms.In2022,royaltiesaccountforaboutaquarterofminingcostsinQueensland,orUSD39onaverage.IndonesiaswitchedfromaCV-basedtoaspotprice-linkedsystem,whichledtoanincreaseinroyaltiesfrom3%toupto10%forsomeminingcompanies.Averageroyaltiesandshareintotalcoalminingcostsinselectedcountries,2020-2022IEA.CCBY4.0.Source:AdaptedfromCRU(2022),ThermalCostModel(database).0%5%10%15%20%25%30%051015202530354045202020212022202020212022202020212022202020212022202020212022202020212022202020212022NewSouthWalesQueenslandWesternAustraliaSouthKalimantanEastKalimantanCentralKalimantanSouthSumatraUSD/tAverageroyaltycosts(leftaxis)Shareofroyaltycostsintotalminingcosts(rightaxis)Coal2022PAGE93IEA.CCBY4.0.PricesandcostsAstrongUSdollarincreasesthecompetitivenessofotherexportersCurrencyexchangeratesaffectthecompetitivenessofexporters.WhilecoaltradingcontractsaremainlyinUSdollars,operatingcostsaresettledinlocalcurrencies.Consequently,alocalcurrencydepreciationagainsttheUSdollarimpliesareductioninoperatingcostsandincreasesproducers’competitiveness.In2020mostcoal-exportingcountries’currenciesdepreciatedagainsttheUSdollar,drivenbytheeconomiccrisisrelatedtotheCovid-19pandemic.WithalooseUSmonetarypolicy,theglobaleconomicrecoveryandsurgingenergyprices,thecurrenciesoftheexport-orientedeconomieslikeChinaandtop-energyexporterslikeAustralia,IndonesiaandSouthAfricaappreciatedagainsttheUSdollarin2021.Sincethesecondhalfof2021,theUSFederalReserveraisedtheinterestrates,andinvestmentsinUSdollarbecamemoreattractive,causinginvestorstowithdrawmoneyfromothercountries.Inparticular,developingcountries’currenciesliketheColombianpesoandtheSouthAfricanranddepreciatedagainsttheUSdollarin2022.AnexceptionistheRussianruble,whichappreciatedslightlyagainsttheUSdollardespitewesternsanctionsduetoextraordinarilyhighrevenuestreamsfromenergyexports.Year-on-yeardevelopmentofselectedcurrenciesagainsttheUSdollar,2019-2022IEA.CCBY4.0.Notes:AUD=Australiandollar;CNY=Chineseyuanrenminbi;ZAR=SouthAfricanrand;RUB=Russianruble;IDR=Indonesianrupiah;COP=Colombianpeso.Thechartdisplaysthey-o-yaverageexchangeratedevelopmentoftheselectedcurrenciesexpressedinchangefromthepreviousyear.2022representsaverageexchangeratestoAugust2022forallcurrenciesexcepttheAUD,whichistoSeptember2022.Source:OECD(2022),MonthlyMonetaryandFinancialStatistics(MEI):Exchangerates(USDmonthlyaverages).-15%-5%5%15%202020212022AUDCNYCOPIDRRUBZARCoal2022PAGE94IEA.CCBY4.0.PricesandcostsFreightrateseaseasglobaleconomyslowsAbout93%oftheglobalcoaltradeisseaborneandshippedbydrybulkvessels.Seabornecoaltrademakesup23%oftotalseabornedrybulktradebymass,aheadofgrain(10%)andslightlybehindironore(29%).Thevesselscanbecategorisedbythedeadweighttonnage(dwt).ThefourmainvesseltypesareHandysize,Handymax/Supramax,Panamax,andCapesize,withthemostusedbeingPanamax(60000–80000dwt)andCapesize(over80000dwt).Shippingcostsaremainlydeterminedbyfuelprices,whilefinalfreightratesdependonsupplyanddemand.Thepandemic-relateddemandreductionforcoalandironoreledtoadeclineinfreightratesin2020.FreightratesforshipmentsfromAustraliatoJapanandEurope,servedmainlybyCapesizevessels,weremoreaffectedthanthosewithPanamaxvessels,e.g.ontheroutefromIndonesiatoChina.In2021,freightratespickedupstronglyasglobaldemandforgoodsandenergyincreased.EnergyshortagesinChinaandIndiafurtherincreasedimportdemandinthesecondhalfoftheyear.FreightratestoEuropepeakedinOctoberamidtightgassuppliesandrisingdemandforthermalcoal.Inaddition,someportswerepartiallyorfullyclosedaspartofthemeasurestocontaintheCovid-19pandemic,whichledtoqueuesonshipsandreducedtheoverallsupplyofcargocapacity.Freightratesdeclinedattheendof2021asenergypricesfellandpressureonglobalsupplychainseasedslightly.InMarch2022,freightcostsroseagainduetotheRussianinvasionofUkraine,whichcausedenergyandgrainpricestoincreasedramatically.Inaddition,unfavourableweatherconditions,e.g.ontheAustralianeastcoast,hamperedcoalshipments.Inthesecondhalfoftheyear,freightratesdeclinedasgrainpricesfellandtheglobaleconomy,andthusdemandforgoods,slowed.Currently,theglobalcoaltradebottleneckiscoalproduction,nottransport.Freightratesonselectedroutes,2020-2022IEA.Allrightsreserved.Source:ArgusMediagroup.Allrightsreserved.01020304050Jan20Jul20Jan21Jul21Jan22Jul22USD/tAustralia-Japan(Panamax)Australia-Rotterdam(Capesize)Indonesia-SouthChina(Panamax)Coal2022PAGE95IEA.CCBY4.0.CoalminingprojectsCoalminingprojectsCoal2022PAGE96IEA.CCBY4.0.CoalminingprojectsHighpriceshardlystimulatecoalminingprojectsTworeasonscouldjustifyanuptickincoalinvestment.First,theunprecedentedhighpricesprevailingsinceOctober2021havemadethermalcoaloneofthebest-performingcommoditiessincethen.Second,theenergycrisistriggeredbyRussia’sinvasionofUkraineanditsconsequences,i.e.energyshortages,hasrenewedfocusonenergysecurity.Whereasthetwoabove-mentionedfactorsundeniablyimpactmarketplayers’moods,theanalysisoftheevolutionoftheindividualprojectsandnewonesdoesnotshowsignsofsignificantaccelerationincoalinvestmentoutsideChinaandIndia.Thepressurefromenvironmental,socialandgovernance(ESG)policiesisnoteasing.Countriesarenotrelaxingclimateorcoalphase-outgoals(althoughsomecountrieshavetemporarydelayedthedeadline),andgettingtheapproval,financeandinsuranceofanewprojecthasbecomemorechallenging.RenewedinterestinCCUShasnotimpactedinvestmentdecisionsyet.InvestordatashowsomeincreaseinsustainingCAPEXtoenjoythecurrentpricesforlongerandinsomeexpansionaryCAPEX,particularlyinflexibleproducerslikeIndonesia.Still,investmentingreenfield7More-advancedprojectshavebeenapprovedandobtainedafinalinvestmentdecisionorareunderconstruction,whileless-advancedprojectsareatthefeasibilityorenvironmentalassessmentstage,ortheyareawaitingapproval.projectsisnotaccelerating.Lastbutnotleast,apartofthecurrentmarkettightnesscomesfromthereverseofEuropeancoalimports,which,drivenbytheextremegasshortage,aregrowing.However,thereisacommonvisionamonginvestorsthattheEU‘sappetiteforcoal,particularlynon-Russiancoalafterthebanonthecountry’simports,willbeashort-termopportunity,whichproducerswilltrytocashin,butthatwillnotdrivenewinvestment.Thisreportclassifiesprojectsas"moreadvanced"or"lessadvanced".7Themore-advancedprojectsworldwideamounttoanexpectedproductioncapacityof~92Mtpa.Morethan65%ofthesearemetallurgical(met)coalprojects,althoughmetcoalaccountsforlessthan15%ofglobalcoaldemandandaboutone-thirdofinternationaltrade.Themore-advancedprojectsareconcentratedinAustralia(36%),Russia(23%)andSouthAfrica(15%).Thetotalpipelineofmore-advancedprojectshasdeclinedveryslightlybyacapacityof3Mtpaassomeprojectshavebeenrealisedandveryfewless-advancedprojectshaveprogressed.Allless-advancedprojectstogetheramounttoaproductioncapacityof663Mtpa,ofwhich~75%arethermalcoalprojects.ThevolumeCoal2022PAGE97IEA.CCBY4.0.Coalminingprojectsofless-advancedprojectshasdecreasedbyabout90Mtpacomparedtolastyear'sreport,assomemajorprojectshavebeencancelledorareconsideredcancelledduetoalackofprogressinrecentyears.Accordingtoofficialdata,about63%oftheless-advancedprojectsareinAustralia.However,thisnumbershouldbetakenwithcaution,asAustraliaismoretransparentaboutplannedcoalprojectsthanothercountries.UncertaintyaboutnewmininginvestmentsisparticularlyhighinIndonesia,thecountrywiththehighestnewproductionamongthemajorexportingcountries.Anon-exhaustivelistofcoalminingprojectsinthemajorexportingcountriescanbefoundintheAppendix.Investmentsinminingprojectsoftengohandinhandwithinfrastructureinvestments.Thelargestprojectcompletedthisyearisa415kmraillinkfromMongolia'slargestcoalmine,TalvanTolgoi,totheChineseborder.OtherexamplesoflargeinfrastructureprojectscanbefoundinRussiatoincreasethecountry'sexportcapacitytotheeastorinsouthernAfricatoexportcoalfromlandlockedBotswana.Coal2022PAGE98IEA.CCBY4.0.CoalminingprojectsMore-advancedcoalminingprojectsareprimarilyinAustraliaandRussiaCapacityofhardcoalexportminingprojectsbycountryandcoalgrade(Mtpa)IEA.CCBY4.0.Coal2022PAGE99IEA.CCBY4.0.CoalminingprojectsMetallurgicalcoalprojectscontinuetobethefocusforinvestorsoncoalSteelproductionwillremaincoal-basedinthemediumterm.Otherpromisingtechnologicalapproaches,suchashydrogen-basedsteelmaking,arenotyetavailableonthescaleandatthecostrequiredandarenotexpectedinthecomingyears.Thisisreflectedinashareofaboutone-thirdofallmore-advancedcoalexportminingprojects.Investorsseemtoprefermetallurgicalcoalprojectstothermalcoalprojects.Purethermalcoalprojectsaccountforonlyabout35%(32Mt)ofthemore-advancedprojects,althoughthermalcoal'smarketshareisthreetimesthatofcokingcoal.However,thermalcoal'sshareisabout43%intheless-advancedprojects.Thelowerappetiteforthermalcoalprojectsreflectsanexpectedreductionindemandandthehigherrisksanduncertaintyassociatedwithclimatetargetsandpublicopposition.Duetotheavailabilityofsubstitutesforcoal-firedpowergeneration,suchasrenewables,investorsarepushingcompaniestoreducetheircarbonfootprint.Themajorminingcompaniescontinuetoturnawayfromthermalcoalbysplittinguporsellingtheircoal-relatedassets.CompaniessuchasRioTintoandAngloAmericanhavealreadydivestedmostoftheircoalmines.BHPannouncedtheintentiontosellitsMtArthurthermalcoalmine.Thecompanyannouncedthatitdidnotfindabuyerandinsteaditappliedforapermittooperatebeyond2026,until2030.CoalgradesinhardcoalexportminingprojectsIEA.CCBY4.0.31%41%28%More-advanced(72Mtpa)ThermalcoalMetcoalBoth44%25%31%Less-advanced(591Mtpa)Coal2022PAGE100IEA.CCBY4.0.CoalminingprojectsAustraliaishometomostoftheannouncedexport-orientedcoalprojectsInAustralia,miningcompaniescontinuetheireffortstoincreasecoalproductionbyexpandingexistingsitesand(re)openingmines.Mostoftheminesproducemetallurgicalcoal,theonlynewthermalcoalmineisCarmichaelmine.Themine,ownedbyBravus,beganproductioninthelastquarterof2021andcommencedregularcoalexportshipmentsthroughtheAbbotPointportinJanuary2022.Allothernewminesproducecokingcoal.InQueensland,QcoalrestartedtheCookmineinApril,whichhadbeenoncareandmaintenancesinceDecember2019.Themineisexpectedtoreachafullcapacityof1.2MtpainNovember.InApril,BowenCokingCoal(BCC)reopenedandshippedthefirstcoalfromthe1-1.2MtpaBluffultra-lowvolatilePCImine.Afewmonthslater,inJuly,thecompanyalsobeganminingmetcoalattheBroadmeadowEastpit.ThecompanyalsointendstocommissionthenearbyBurtonpitlateinthefourthquarterandtostartupthenew5MtpaBurtoncoalhandlingandprocessingplantnextyeartoformtheBurtonmetcoalcomplex.InNewSouthWales(NSW),SIMECMiningplanstoincreasethecapacityoftheTahmoorSouthmetallurgicalcoalminefrom3Mtpato4Mtpa.Morethan46%oftheworld’smore-advancedcoalminingprojectsareinAustralia,amountingto33Mtpaofnewcapacity.MostoftheseprojectsarelocatedinQueensland(25Mtpa).Approximately19Mtpaofcoalminingcapacitycouldcommenceoperationsby2023.PembrokeResourcesisadvancingitsUSD1billionOliveDownscoalproject,whichisscheduledforcommissioningnextyear.InNSW,MalabarCoal’sMaxwellmine,withacapacityof3Mtpato3.6Mtpa,issettostartoperationsinmid-2023.Theminewillproduceabout75%cokingcoal,andtheremainderthermalcoal.Furthermore,AustralianPacificCoalwillresumeproductionattheDartbrookundergroundmine,whichhasbeenidlefor16years,inthesecondhalfof2023.Thethermalcoalminehasaninitialproductionrateof1.5Mtpa,buthasbeenapprovedtoproduceupto6Mtpain2024.Thecompanyistargetingafurtherincreaseinthemine’scapacityto10Mtpa.Australianplanningauthorities,whichhavebeenstrictertowardnewcoalprojectsinrecentyears,appeartobetakingasofterstance.Severalprojectshavealreadybeenapprovedthisyear.MACHEnergyreceivedapprovaltodoubletheproductioncapacityofitsMountPleasantmineinNSWfrom10.5Mtpato21Mtpaandtoextendthelifeoftheminefrom2026to2048.Themineproducesthermalandsemi-softcokingcoal.Furthermore,theprojectstoextendthelifeofthe7.5MtpaNewAclandthermalcoalmine,ownedbyNewHope,andthe5MtpaCarboroughDownscoalmine,ownedbyFitzroyResources,wasapproved.Theoverallcapacityoftheless-advancedprojectpipelineamountstoabout565Mtpa,ofwhich348Mtpaarethermalcoalprojects.Thetotalcapacityofplannedprojectshasdecreasedcomparedtothepreviousyear,assomeprojectshaveadvancedandothersCoal2022PAGE101IEA.CCBY4.0.Coalminingprojectshavebeencancelled.South32,forexample,hasdecidednottoproceedwiththeDendrobiumNextDomainextensionproject,aftertheNSWIndependentPlanningCommissionrejectedtheplan.Withouttheexpansion,themine'scapacitywilldropto5.5Mtpainsteadofthetargeted7.5-8Mtpaandwilllikelyclosein2028.Thecompanyalsovowsnottodeveloporinvestingreenfieldmetcoalprojects.Coal2022PAGE102IEA.CCBY4.0.CoalminingprojectsRussia'sailingcoalsectorlooksmoreattheEastInresponsetotheEuropeanbanonimportsofRussiancoal,thecountry’scoalexportersareacceleratingthelong-plannedexpansionofinfrastructuretotheeastinordertoincreaseexports,especiallytoChinaandIndia.Sofar,however,Russianexportersaresufferingfromthesanctionsandlackofcapacityintherailwaynetworktoreroutecoalthatusedtobeexportedinnorthwestportstotheeast.Inthesecondhalfof2022,afirstSino-RussianrailwaycrossingovertheAmuristobeputintooperation,whichwillsignificantlyexpandcross-bordertransportcapacities.ItwillconnectRussia'sNizhneleninskoyewithChina'sTongjiang,initiallywithacapacityof5Mtpa,whichcanbeexpandedto21Mtpainthefuture.Furtherinfrastructureprojectsareprogressing.Forexample,A-Property’snewterminalPortElgaatCapManorskywitharailwayconnectiontoitsElgacomplex,withaplannedcapacityof30Mtpaandacommencementdatein2024,gotenvironmentalapprovalinSeptember.TostrengthenitstieswithIndia,SUEKisopeninganofficeinIndiaasitintendstoincreasethermalandcokingcoalimportsfromRussiabyupto40Mtpauntil2035.Tothisend,furtherinvestmentsinshippinginfrastructurearelikelyyetnotannounced.ThecommissioningoftwoexpansionprojectsclosetotheChineseborderfavoursthereorientationeastwards.Kolmar’sInaglinskyextensionprojectisrampingupproductiontargetinganadditional4Mtpacokingcoalcapacity.A-PropertycompletedtheextensionofitsElgamine.However,theramp-upofthe6Mtpacokingandthermalcoalminedependsonthepaceoftheassociatedrailwaydevelopment.ThemineisoperatedbyELSI,whichistheresultofamergerofA-Property’sportfoliofirmsElgaandSibanthraciteandnowthelargestmetallurgicalcoalexporterinRussia.Additionally,A-Propertystartedtorampupproductionatits5MtpaVerkhneteshskyopen-cutcokingcoalmineintheKuzbassregion,alsooperatedbyELSI.TheminewillpredominantlyservetheAsianmarketandisexpectedtoreachanoutputof1Mtpabytheendof2023.Ontopofthat,UglePromInvest’sSibirskyacommencedproductionofits6Mtpathermalcoalmine.More-advancedprojectscomprisethermalandcokingcoaloperationsinthesouthandthenorth.SUEK’sChernogorskyexpansionproject,closetoNovosibirsk,hasaproductioncapacityof3.5Mtpathermalcoal.AEON’sWest-TaymyrIndustrialCluster,closetoportDiksonintheKaraSea,hasacokingcoalproductioncapacityof5Mtpa.FurtherexpansionprojectsclosetotheWestappeartobeonholdduetotransportationconstraintseastwardsastheEuropeanUnionshunsRussiancoal.Coal2022PAGE103IEA.CCBY4.0.CoalminingprojectsWhileSouthAfrica'scoalsectorstagnates,neighbouringcountriesstepinSouthAfricaTheSouthAfricancoalminingsectorisslowlycontractingafteryearsofunderinvestment,withcoalminingcapacitydecliningandtherailnetworkunderperforminginrecentyears.Infact,nonewminingcapacitywasaddedthisyear.TheonlynotablecapacityextensionisthecompletedconstructionofExxaro’sGrootegeluk6processingplant,whichwillallowthecompanytoincreasetheproductionofhigh-gradeexportcoalto1.7Mtpa.SouthAfrica’spipelineofmore-advancedprojectscomprisesapotentialproductioncapacityofapproximately13Mtpa.OneofthemostadvancedprojectsistheMakhadothermalandcokingcoaloperation,ownedbyMCMining.Constructionisscheduledtobegininearly2023.Oncecommissioned,theminecouldproduceupto1.1Mtpaofcokingandthermalcoalforsaledomesticallyandinternationally.TheoriginalplanwastousethecoalprocessingplantatVeleColliery,about130kmaway.NowMCMiningisconsideringbuildinganadditionalcoalprocessingplantatthesitetoreduceoperatingcosts.Inaddition,less-advancedprojectswithatotalproductioncapacityof47Mtpaareknown.ThemostrecentannouncementisthepotentiallifeextensionofThungela’s4.6MtpaKhwzelathermalcoalmine.BotswanaWhileSouthAfrica'scoalproductionisdeclining,Botswanaispreparingtofillthebreach,atleastinpart.Projectswithapotentialcapacityofatleast10Mtpaarealreadymoreadvanced.SomeaimtosupplySouthAfrica,whosedomesticcoalproductionisinsufficienttosupplythepowersector.Tothisend,andtoprovidethelandlockedcountrywithaccesstoSouthAfricanexportterminals,SouthAfrica'sTransnetandBotswana'srailroadcompanyhaveagreedtorepairandupgradea126-kmraillinebetweenthetwocountries.TheraillinewillallowheavytrainstotravelfromBotswanatotheexportportsofRichardsBayandDurban.Atthecountry'soldestoperatingcoalmine,MorupuleCoalMine(MCM),constructionhasbegunontheMotheoproject,whichincludesanopenpitmine,acoalpreparationandprocessingplant,andassociatedinfrastructure.TheprojectwillexpandMCM'scapacityfrom2.8Mtpato4.2Mtpa.InJune,BotswanaminingcompanyMinergyEnergyreportedthatBotswana'ssecondoperatingmine,theMasamathermalcoalmine,commissionedin2020,hasreacheditsproductioncapacityofabout1.5Mtpa.Thecompanyintendstodoublethecapacityifitcansecureadditionalinvestment.MinergyalsostartedexportingthroughtheMatolaterminalatthePortofMaputoinMozambiqueandtheWalvisBayCoal2022PAGE104IEA.CCBY4.0.CoalminingprojectsportsinNamibia,giventhelimitedlogisticalcapacitytoexportthroughSouthAfricanports.AlargepartofBotswana'scoalresourcesarelocatedintheMmamabulacoalfields,andthecountryisseekingtoexploitthem.In2021,MaatlaResourcesstarteditsMmamabulacoalproject.Themineisexpectedtostartproductioninmid-2023withaproductionrateof1.2Mtpaandlaterrampuptoabout4.5Mtpa.ThecoalwillbesolddomesticallyandontheSouthAfricanmarket.India-basedJindalalsoannouncedplanstostartconstructinga4.5MtpacoalmineinthesoutheasternMmamabulacoalfieldsin2022.ThemineisexpectedtobedevelopedintwotothreeyearsandsupplyaplannedlocalpowerplantandtheSouthAfricanmarket.Inthelongterm,thecompany'svisionistosignificantlyincreasecoalproductionattheMmamabulasiteto24Mtpaandexportcoaloverseas.MozambiqueAllproposedcoalminingprojectsinMozambiqueareclassifiedaslessadvancedandnoneoftheprojectshasreportedprogressby2022.However,theimportanceofthePortofMaputoisincreasingasitprovidesanalternativetoconstrainedSouthAfricanexportcapacityforcoalexportsfromlandlockedBotswana.Grindrod,theport’sowner,hasannouncedanumberofinvestmentstoincreaseitsdrybulkexportcapacityfrom1.5Mtpato4.5Mtpa.ZimbabweTheZimbabweangovernmentisplanningnewmineswithcorrespondingcoal-firedpowerplantsinthenorthwesterndistrictofHwange,whichwouldrequireinvestmentincoalminestofuelthoseplants.However,itisunclearwhetherthedevelopmentwillgoaheadsincepotentialinvestorChinahasdecidedtobaninvestmentincoal-firedpowerplantsabroad.OnecoalprojectalreadyunderdevelopmentistheLubuCokingCoalProject,whichcouldproduceupto5Mtpaofmetcoal.In2022,ownerContangoannouncedthatqualitytestshadbeenbetterthanexpected.Thefirstcoalisexpectedtobedeliveredbytheendoftheyear.TanzaniaInviewofthecurrenthighpricelevel,Tanzaniancoalmines,whichactuallyconcentrateondomesticcoal-firedpowergeneration,aretryingtoexportcoal.ThisisbeingfacilitatedintandembyanexpansionofexportcapacityattheportofMtwara.Theporthasmultipliedthenumberofshipsitcanhandlepermonthandisaimingforanexportcapacityof0.65Mtpa.Coal2022PAGE105IEA.CCBY4.0.CoalminingprojectsIntheUnitedStates,CanadaandeveninEurope,cokingcoalprojectstakecentrestageUnitedStatesIntheUnitedStates,multiplecokingcoalminesandathermalcoalminestartedoperationin2022.RamacoResourcesincreaseditsmetallurgicalcoalproductioncapacitybyatotalof~2.6Mtpa,poweredpartlybytheexpansionprojectsattheBerwindandtheElkCreekcomplexandpartlybythecommissionoftwonewmines:the0.7MtpaKnoxCreekmineandthe0.2MtpaBigCreek2mine.Moreover,RamacoResourcesacquiredRamacoCarbonLCCatthebeginningoftheyearandcommencedproductioninits0.25MtpathermalcoalBrookMine.PeabodyreopeneditsShoalCreekmine,whichclosedin2020duetolowdemand,andstartedrampingupcokingcoalproduction.Themineissettoreachitsmaximumproductioncapacityof2.1Mtpasoon.Furthermore,additionalcokingcoalprojectswithanaggregatedcapacityof4.5Mtpaarecategorisedasmoreadvanced,withNorthCentralResources’Longviewcoalminestandingoutwithatotalof3Mtpa.Itsstartofproductionhasbeenrescheduledfromend-2022tomid-2023.CanadaDuetopoliticalrestrictions,multiplecokingcoalprojectshavebeencancelledlately.Asaresult,theprojectpipeline’scapacitydecreasedby~10Mtpato~34Mtpa.Theonlymore-advancedprojectisCST’sGrandeCacheminewithamaximumcapacityof1.7Mtpa,whichappearstobeonthebrinkofreopening.Togetherwiththeless-advancedcokingcoalprojectsGrassyMountain(4.5Mpta)byBegaMiningandMountainTent(1.1Mtpa)byMontem,itwasexceptedfromarestrictiononexplorationanddevelopmentprojectspassedbytheAlbertagovernment.Thelargestprojectunderdevelopmentisthe10MtpacokingcoalprojectFordingRiverExtensionbyTeckCoal.Itsstarthasbeenscheduledfor2027.EuropeAftercommittingtophasingoutcoal-firedpowergeneration,EuropeanminingprojectsonlyfocusonnewcokingcoalminesintheUnitedKingdomandPoland.Poland’sfirstnewcokingcoalminein25years,JSW’sBzie-Debina1-Zachod,commencedproductionwithacapacityof2.2Mtpa.IntheUnitedKingdom,WestCumbriaMining’s2.5MtpacokingcoalprojectWoodhouseCollieryhasbeenapprovedinDecember2022,makingittheUnitedKingdom’sfirstnewcoalmineprojectin30years.Theminecouldbeoperationalwithintwoyearswithanestimatedproductionof0.5Mtpainthefirstphase.Coal2022PAGE106IEA.CCBY4.0.CoalminingprojectsIndonesiaandMongoliaareexpandingexportcapacities,whileColombiahaltsdevelopmentIndonesiaThelackoftransparencyregardingminingprojectsmakesitdifficulttocompareIndonesiawithothercountries.However,traceableprojectsarepredominantlythermalcoalprojectsindifferentstages.KangarooResourcesstartedrampingupitsthermalcoalprojectParkarNorthslowly.Theprojecthasamaximumproductioncapacityof16Mtpa.Inaddition,ITM’sGrahaPancaKarsaminecommencedproductionatthebeginningofthisyearwithamaximumcapacityof2Mtpa.Moreover,IATArampedupproductionofitsIndonesiaBatuPrimaEnergiminewithanoverallcapacityof1Mt.ThemostrecentminecommissioningistheBumiBaritoMineralmine.Themineis60%-ownedbyCokalandwillproducebothcokingandPCIcoalintheCentralKalimantanprovince.CokalstartedoperationsinOctoberandaimstoreachmaximumcapacityof2Mtpain2023.MongoliaInvestmentsinMongoliaarestronglydirectedtoimproveaccesstoChina’scokingcoalmarketinfrastructural-wise.MongoliahascompletedtheTavanTolgoirailline,a233kmrailwaylinktoChina(toGashuuaSukhait)withacapacityof30-50Mtpa.ItwillenableboostingcokingcoalexportsfromtheTavanTolgoiminebyreplacingtrucktransport.MongoliahasalsocompletedasecondmajorraillinktoChina–fromZuunbayantotheborderpointbetweenKhangiandMandal.Moreover,ChinaintendstoexpandathirdbordercheckpointbetweenZamyn-UudandErlianin2022.Additionally,thoughmoreexpensive,toincreasethroughputasthecountries’railgaugesaredifferent,Mongoliaisshiftingfrombulkcargotocontainers.Besidesinfrastructuralaccomplishments,MongoliancokingcoalminingprojectssuchasAspireMining’sOvootprojectwithacapacityof4MtpaorSakerResources’Shinjinstwithatotalcapacityof3Mtpaareprogressing.Bothprojectsappeartobeclosetostartingproduction.ColombiaThenewgovernmentofColombiahasexpresseditsintentiontoreduceColombia’sdependencyonoilandcoalgradually.Forthislegislativeperiod,itplansnottograntanynewexplorationprojectoffossilresources.Beforethisyear’selections,investorsstartedtoretreatfromtheconsolidatingColombianmarket.BHPandAngloAmericansoldtheirstakesintheCerrejoncoalminetoGlencoreatthebeginningof2022.Atthesametime,Glencore’sportfoliocompanyProdecoGrouprelinquisheditsminingtitlesonProdeco.Newcontractingisinprogressunderthatuncertainenvironment.However,RoninResourcesannouncedanexpansionofitsVetasprojectneartheeasternborderwithVenezuela.TheprojectcouldproducePCIandsemi-softmetallurgicalcoalonceoperational.Coal2022PAGE107IEA.CCBY4.0.AnnexesGeneralannexCoal2022PAGE108AnnexesIEA.CCBY4.0.TablesTotalcoalconsumption(Mt),2020-2025Region/country20202021202220252020-20212021-2022CAAGR2022-2025AsiaPacific58306153625164925.5%1.6%1.3%China40454232425043374.6%0.4%0.7%India90510331103122014.1%6.8%3.4%Japan174174177158-0.1%1.8%-3.8%SoutheastAsia3563613754221.5%3.8%4.0%NorthAmerica46252950241014.4%-5.1%-6.5%UnitedStates43049646538315.4%-6.3%-6.3%CentralandSouthAmerica485045373.8%-8.9%-6.8%Europe58564968555210.9%5.7%-7.0%EuropeanUnion39244947837114.4%6.5%-8.0%MiddleEast1312107-7.0%-14.5%-11.7%Eurasia3443483503511.0%0.6%0.1%Russia2172252362273.9%4.8%-1.4%Africa195189180190-3.1%-4.5%1.7%World74777929802580386.0%1.2%0.1%Notes:CAAGR=compoundaverageannualgrowthrate.Datafor2020and2021arefromIEAstatistics;2021arepreliminary;2022areestimated;2025areforecasts.Differencesintotalsareduetorounding.Coal2022PAGE109AnnexesIEA.CCBY4.0.Thermalcoalandligniteconsumption(Mt),2020-2025Region/country20202021202220252020-20212021-2022CAAGR2022-2025AsiaPacific49165242535155926.6%2.1%1.5%China33063511354236436.2%0.9%0.9%India8399591027112814.2%7.1%3.2%Japan132130133118-1.3%2.3%-4.0%SoutheastAsia339338350394-0.4%3.7%4.0%NorthAmerica44450447938813.6%-4.9%-6.8%UnitedStates41747945036915.0%-6.0%-6.4%CentralandSouthAmerica353532220.0%-9.2%-11.7%Europe52258062048911.1%6.8%-7.6%EuropeanUnion34139042131914.6%8.0%-8.9%MiddleEast9863-13.2%-23.2%-24.1%Eurasia2652652802810.2%5.7%0.0%Russia1531591731673.7%9.3%-1.2%Africa193186177187-3.5%-4.6%1.7%World63826820694569606.9%1.8%0.1%Notes:CAAGR=compoundaverageannualgrowthrate.Datafor2020and2021arefromIEAstatistics;2021arepreliminary;2022areestimated;2025areforecasts.Differencesintotalsareduetorounding.Coal2022PAGE110AnnexesIEA.CCBY4.0.Metallurgicalcoalconsumption(Mt),2020-2025Region/country20202021202220252020-20212021-2022CAAGR2022-2025AsiaPacific915911900900-0.4%-1.2%0.0%China739720708694-2.5%-1.7%-0.7%India6675769212.9%2.0%6.6%Japan424444403.6%0.2%-3.2%SoutheastAsia1724252841.6%5.8%4.0%NorthAmerica1926232234.6%-8.9%-1.5%UnitedStates1317141427.7%-14.1%-1.9%CentralandSouthAmerica1315141513.5%-8.3%2.7%Europe6269666210.0%-3.9%-1.8%EuropeanUnion5258565313.2%-3.9%-2.0%MiddleEast44446.4%0.8%0.8%Eurasia798269703.6%-15.7%0.4%Russia646763594.5%-6.0%-1.9%Africa233327.3%2.7%2.2%World10951110108010781.3%-2.7%-0.1%Notes:CAAGR=compoundaverageannualgrowthrate.Datafor2020and2021arefromIEAstatistics;2021arepreliminary;2022areestimated;2025areforecasts.Differencesintotalsareduetorounding.Coal2022PAGE111AnnexesIEA.CCBY4.0.Totalcoalproduction(Mt),2020-2025Region/country20202021202220252020-20212021-2022CAAGR2022-2025AsiaPacific57475947635864563.5%6.9%0.5%China37893942423742374.0%7.5%0.0%India75880589310216.3%10.9%4.6%Australia474470446450-0.7%-5.2%0.3%Indonesia5665696225820.6%9.3%-2.2%NorthAmerica5385795944947.5%2.5%-5.9%UnitedStates4865245354438.0%2.0%-6.1%CentralandSouthAmerica616665629.7%-2.9%-1.3%Europe4474855194338.6%6.9%-5.8%EuropeanUnion30233235728910.2%7.3%-6.8%MiddleEast22220.0%3.6%0.0%Eurasia5395645385374.7%-4.6%-0.1%Russia4024374043928.6%-7.4%-1.1%Africa260245243238-5.9%-0.7%-0.7%World75927888831882213.9%5.4%-0.4%Notes:CAAGR=compoundaverageannualgrowthrate.Datafor2020and2021arefromIEAstatistics;2021arepreliminary;2022areestimated;2025areforecasts.Differencesintotalsareduetorounding.Coal2022PAGE112AnnexesIEA.CCBY4.0.Thermalcoalandligniteproduction(Mt),2020-2025Region/country20202021202220252020-20212021-2022CAAGR2022-2025AsiaPacific48515061548055964.3%8.3%0.7%China31143257356135954.6%9.3%0.3%India75279988610136.3%10.9%4.6%Australia2903002772683.4%-7.7%-1.0%Indonesia5625656155720.5%8.9%-2.3%NorthAmerica4604915054086.9%2.7%-6.9%UnitedStates4364684803917.3%2.5%-6.6%CentralandSouthAmerica5663615812.0%-3.1%-1.4%Europe4324705044198.7%7.2%-6.0%EuropeanUnion28831834227510.4%7.6%-7.0%MiddleEast000031.2%1.1%0.0%Eurasia4364564384344.7%-4.0%-0.2%Russia3033323082959.7%-7.4%-1.4%Africa253236234228-6.7%-1.0%-0.8%World64886777722171434.5%6.5%-0.4%Notes:CAAGR=compoundaverageannualgrowthrate.Datafor2020and2021arefromIEAstatistics;2021arepreliminary;2022areestimated;2025areforecasts.Differencesintotalsareduetorounding.Coal2022PAGE113AnnexesIEA.CCBY4.0.Metallurgicalcoalproduction(Mt),2020-2025Region/country20202021202220252020-20212021-2022CAAGR2022-2025AsiaPacific896886878860-1.0%-1.0%-0.7%China6756846766421.4%-1.2%-1.7%India66780.6%13.0%4.7%Australia184171169182-7.2%-0.9%2.5%Indonesia457915.2%62.3%7.4%NorthAmerica7988898611.4%1.3%-1.0%UnitedStates5056555213.4%-1.7%-2.1%CentralandSouthAmerica4444-20.0%1.1%0.6%Europe141515155.0%0.3%-1.4%EuropeanUnion131414145.9%0.1%-1.4%MiddleEast1111-3.2%4.0%0.0%Eurasia1031081011024.8%-6.8%0.5%Russia9910496965.0%-7.6%0.0%Africa7891024.4%8.7%2.1%World11041111109610780.6%-1.3%-0.6%Notes:CAAGR=compoundaverageannualgrowthrate.Datafor2020and2021arefromIEAstatistics;2021arepreliminary;2022areestimated;2025areforecasts.Differencesintotalsareduetorounding.Coal2022PAGE114AnnexesIEA.CCBY4.0.Totalcoalimports(Mt),2020-2025Region/country20202021202220252020-20212021-2022CAAGR2022-2025Europe13715417611812.2%14.3%-12.5%Japan174173184156-0.5%6.3%-5.3%Korea1231261271191.7%0.7%-2.0%ChineseTaipei6370656610.3%-6.8%0.4%China3173382852886.8%-15.7%0.3%India220207221209-5.9%7.1%-1.9%SoutheastAsia154150148160-2.4%-1.5%2.7%Restofworld1501531361472.3%-11.4%2.6%World13381371134112622.5%-2.1%-2.0%Notes:CAAGR=compoundaverageannualgrowthrate.Datafor2020and2021arefromIEAstatistics;2021arepreliminary;2022areestimated;2025areforecasts.Differencesintotalsareduetorounding.Coal2022PAGE115AnnexesIEA.CCBY4.0.Thermalcoalandligniteimports(Mt),2020-2025Region/country20202021202220252020-20212021-2022CAAGR2022-2025Europe86961216611.2%26.0%-18.4%Japan132129140116-1.9%8.4%-6.0%Korea869092864.0%2.2%-2.1%ChineseTaipei5561565611.0%-8.8%0.0%China24428424023516.2%-15.4%-0.7%India157141152125-10.3%7.8%-6.4%SoutheastAsia137126124135-7.7%-2.2%3.1%Restofworld1191191111170.1%-7.3%1.8%World1017104710359362.9%-1.1%-3.3%Notes:CAAGR=compoundaverageannualgrowthrate.Datafor2020and2021arefromIEAstatistics;2021arepreliminary;2022areestimated;2025areforecasts.Differencesintotalsareduetorounding.Metallurgicalcoalimports(Mt),2020-2025Region/country20202021202220252020-20212021-2022CAAGR2022-2025Europe5158555213.9%-5.0%-1.7%Japan424444403.6%0.2%-3.2%Korea37363533-3.5%-3.0%-1.6%China73554552-24.6%-17.3%5.0%India636669845.1%5.4%6.8%Restofworld5566586419.6%-11.6%3.3%World3213243073261.1%-5.4%2.1%Notes:CAAGR=compoundaverageannualgrowthrate.Datafor2020and2021arefromIEAstatistics;2021arepreliminary;2022areestimated;2025areforecasts.Differencesintotalsareduetorounding.Coal2022PAGE116AnnexesIEA.CCBY4.0.Totalcoalexports(Mt),2020-2025Region/country20202021202220252020-20212021-2022CAAGR2022-2025Australia376370350362-1.5%-5.4%1.1%Canada323236360.1%14.3%-0.5%Colombia72555353-23.8%-3.2%0.0%Indonesia4084364734116.8%8.5%-4.6%Russia2122151921891.0%-10.7%-0.5%SouthAfrica73637053-13.4%10.3%-8.9%UnitedStates6377766523.4%-1.3%-5.2%Restofworld888510194-3.3%19.0%-2.4%World13231333135112620.7%1.4%-2.2%Notes:CAAGR=compoundaverageannualgrowthrate.Datafor2020and2021arefromIEAstatistics;2021arepreliminary;2022areestimated;2025areforecasts.Differencesintotalsareduetorounding.Coal2022PAGE117AnnexesIEA.CCBY4.0.Thermalcoalandligniteexports(Mt),2020-2025Region/country20202021202220252020-20212021-2022CAAGR2022-2025Australia200199184183-0.4%-7.4%-0.2%Colombia70545252-22.9%-3.7%0.0%Indonesia4044324694066.8%8.6%-4.7%Russia174174157150-0.4%-9.8%-1.4%SouthAfrica72636952-13.5%10.4%-9.0%UnitedStates2536352547.4%-2.8%-10.7%Restofworld636879687.2%16.4%-4.7%World1008102510459361.6%1.9%-3.6%Notes:CAAGR=compoundaverageannualgrowthrate.Datafor2020and2021arefromIEAstatistics;2021arepreliminary;2022areestimated;2025areforecasts.Differencesintotalsareduetorounding.Metallurgicalcoalexports(Mt),2020-2025Region/country20202021202220252020-20212021-2022CAAGR2022-2025Australia176171166179-2.7%-3.0%2.5%Canada27262830-2.9%7.8%1.7%Mongolia19111718-40.9%54.4%2.5%Mozambique446613.1%34.2%1.9%Russia384135397.2%-14.4%3.3%UnitedStates384141407.9%0.0%-1.0%Restofworld13131315-1.4%2.5%3.3%World315308307326-2.3%-0.4%2.1%Notes:CAAGR=compoundaverageannualgrowthrate.Datafor2020and2021arefromIEAstatistics;2021arepreliminary;2022areestimated;2025areforecasts.Differencesintotalsareduetorounding.Coal2022PAGE118AnnexesIEA.CCBY4.0.Totalseabornecoalimports(Mt),2020-2025Region/country20202021202220252020-20212021-2022CAAGR2022-2025Europe12814717611815.1%19.8%-12.5%Japan174173184156-0.5%6.3%-5.3%Korea1231261271191.7%0.7%-2.0%ChineseTaipei6370656610.3%-6.8%0.4%China29532626726810.4%-18.1%0.1%India220207221209-5.9%7.1%-1.9%SoutheastAsia154150148160-2.4%-1.5%2.7%Restofworld1251271261371.8%-0.9%2.8%World12821325131312333.4%-0.9%-2.1%Notes:CAAGR=compoundaverageannualgrowthrate.Datafor2020and2021arefromIEAstatistics;2021arepreliminary;2022areestimated;2025areforecasts.Differencesintotalsareduetorounding.Coal2022PAGE119AnnexesIEA.CCBY4.0.Seabornethermalcoalandligniteimports(Mt),2020-2025Region/country20202021202220252020-20212021-2022CAAGR2022-2025Europe77891216615.4%35.6%-18.4%Japan132129140116-1.9%8.4%-6.0%Korea869092864.0%2.2%-2.1%ChineseTaipei5561565611.0%-8.8%0.0%China24128223923416.9%-15.5%-0.7%India157141152125-10.3%7.8%-6.4%SoutheastAsia137126124135-7.7%-2.2%3.1%Restofworld1061061051120.1%-1.1%2.0%World992102510289293.3%0.2%-3.3%Notes:CAAGR=compoundaverageannualgrowthrate.Datafor2020and2021arefromIEAstatistics;2021arepreliminary;2022areestimated;2025areforecasts.Differencesintotalsareduetorounding.Seabornemetallurgicalcoalimports(Mt),2020-2025Region/country20202021202220252020-20212021-2022CAAGR2022-2025Europe5058555214.5%-4.5%-1.7%Japan424444403.6%0.2%-3.2%Korea37363533-3.5%-3.0%-1.6%China54442834-19.0%-35.4%6.5%India636669845.1%5.4%6.8%Restofworld4353546022.0%2.3%3.5%World2903002853043.5%-4.8%2.1%Notes:CAAGR=compoundaverageannualgrowthrate.Datafor2020and2021arefromIEAstatistics;2021arepreliminary;2022areestimated;2025areforecasts.Differencesintotalsareduetorounding.Coal2022PAGE120AnnexesIEA.CCBY4.0.Totalseabornecoalexports(Mt),2020-2025Region/country20202021202220252020-20212021-2022CAAGR2022-2025Australia376370350362-1.5%-5.4%1.1%Canada31313635-1.3%15.5%-0.5%Colombia72555353-23.8%-3.2%0.0%Indonesia4084364734116.8%8.5%-4.6%Russia2122151921891.0%-10.7%-0.5%SouthAfrica73637053-13.4%10.3%-8.9%UnitedStates6377766523.4%-1.3%-5.2%Restofworld3743484615.2%12.3%-1.2%World12721290129812141.4%0.6%-2.2%Notes:CAAGR=compoundaverageannualgrowthrate.Datafor2020and2021arefromIEAstatistics;2021arepreliminary;2022areestimated;2025areforecasts.Differencesintotalsareduetorounding.Coal2022PAGE121AnnexesIEA.CCBY4.0.Seabornethermalcoalandligniteexports(Mt),2020-2025Region/country20202021202220252020-20212021-2022CAAGR2022-2025Australia200199184183-0.4%-7.4%-0.2%Colombia70545252-22.9%-3.7%0.0%Indonesia4044324694066.8%8.6%-4.7%Russia174174157150-0.4%-9.8%-1.4%SouthAfrica72636952-13.5%10.4%-9.0%UnitedStates2536352547.4%-2.8%-10.7%Restofworld3338444016.4%16.5%-3.1%World97899510109081.8%1.5%-3.5%Notes:CAAGR=compoundaverageannualgrowthrate.Datafor2020and2021arefromIEAstatistics;2021arepreliminary;2022areestimated;2025areforecasts.Differencesintotalsareduetorounding.Seabornemetallurgicalcoalexports(Mt),2020-2025Region/country20202021202220252020-20212021-2022CAAGR2022-2025Australia176171166179-2.7%-3.0%2.5%Canada27262829-4.4%8.8%1.7%Mozambique446613.1%34.2%1.9%Russia384135397.2%-14.4%3.3%UnitedStates384141407.9%0.0%-1.0%Restofworld12111213-1.4%2.9%3.8%World2942952883060.1%-2.4%2.1%Notes:CAAGR=compoundaverageannualgrowthrate.Datafor2020and2021arefromIEAstatistics;2021arepreliminary;2022areestimated;2025areforecasts.Differencesintotalsareduetorounding.Coal2022PAGE122AnnexesIEA.CCBY4.0.CoalminingprojectsCountryProjectCompanyTypeEarliestproposedstart-upProposedfullcapacity(Mtpa)ResourceStatusAustraliaAngusPlaceWestCentennialCoalN2024+2TCLAAustraliaBaralabaSouthBaralabaCoalE..5PCILAAustraliaBelviewStanmoreCoalN2027+2.6TC,CC,PCILAAustraliaBulga(Mod3andMod7)GlencoreE2026+6.6TCLAAustraliaBurtonBowenCokingCoalN20222TC,CCMAAustraliaCarboroughDownsFitzroyAustraliaResourcesE..5CC,PCILAAustraliaCarmichaelCoalProjectStage2AdaniE..18TCLAAustraliaCavalRidgeExtensionE2026+15CCLAAustraliaChainValleyExtensionDeltaCoalE2023+2TCMAAustraliaChinaStoneMacMinesAustasiaN..38TCLAAustraliaCooroorahBowencokincoalN....CC,PCILAAustraliaCurraghExtensionCoronadoGlobalE20233TC,CCMAAustraliaDartbrookAustralianPacificCoalR20236TCLAAustraliaDysartEastBengalEnergyN20251.2CCLAAustraliaEagleDownsSouth32/AquilaResourcesN20254.5TC,CCLAAustraliaElimattaNewHopeN2027+4TC,CCLACoal2022PAGE123AnnexesIEA.CCBY4.0.CountryProjectCompanyTypeEarliestproposedstart-upProposedfullcapacity(Mtpa)ResourceStatusAustraliaGalileeCoalProjectWaratahCoalN2027+40TC,CCLAAustraliaGeminiCoalMineMagneticSouthN2025+1.9CCLAAustraliaGormanNorthCoalProjectWhitehavenCoalN....TCLAAustraliaGrosvenorPhase2AngloAmericanE2026+6TC,CCLAAustraliaHillalongShandongEnergyGroupN2023+4.2TC,CCMAAustraliaHunterValleyOperationsContinuationsProjectYancoal/GlencoreE2025+42TC,CCLAAustraliaJellinbahCentralNorthExtensionJellinbahGroupN2025+1PCILAAustraliaIronbarkNo.1(Ellensfield)FitzroyAustraliaResourcesN2023+2.7TC,CCMAAustraliaIsaacPlainsComplex-IsaacDownsProjectStanmoreCoalN2024+2.4TC,CCMAAustraliaIsaacPlainsComplex-UndergroundextensionStanmoreCoalE20291.2TC,CCLAAustraliaKarinVitrinite/ItochuCorporationN..1.7CCLAAustraliaKevin'sCornerGVKN2027+10.6TCLAAustraliaLakeVermontMeadowbrookProjectLakeVermontJointVentureE2027+5.5CCLAAustraliaMandalongSouthernExtensionProjectCentennialCoalE2022+..TCMAAustraliaMangoolaCoalContinuedOperationsProjectGlencoreE2023+5TCLACoal2022PAGE124AnnexesIEA.CCBY4.0.CountryProjectCompanyTypeEarliestproposedstart-upProposedfullcapacity(Mtpa)ResourceStatusAustraliaMaxwellProjectMalabarCoalN2023+3.6TC,CCMAAustraliaMavisDowns-MilleniumMetResE20221.2CC,PCIMAAustraliaMeanduKing2EastProjectStanwellE20245TCLAAustraliaMinyangoQcoalN2027+7TCLAAustraliaMoorlandsCuestaCoalN2027+1.9TCLAAustraliaMountOwen(GlendellMine)ContinuedOperationsProjectGlencoreE2024+7TC,CCLAAustraliaMtPleasantOptimisationProjectMACHEnergyAustraliaE2026+10.5TCLAAustraliaNarrabriStage3WhitehavenCoalE2026+9TCLAAustraliaNewAcland(Stage3)NewHopeE20237.5TCLAAustraliaNewLentonBowenCokingCoalN20291.5TC,CC,PCILAAustraliaNewstanMineExtensionProjectCentennialCoalE2027+1.6TC,CCLAAustraliaNorthernGalileeCoalProjectTerraComN....TCLAAustraliaNorthSurat-CollingwoodProjectNewHopeCoalN2027+4TCLAAustraliaNorthSurat-TaroomProjectNewHopeCoalN2027+8TCLAAustraliaNorthSurat-WooriProjectNewHopeCoalN2027+2.5TCLAAustraliaOliveDownsSouthPembrokeResourcesN20234.5CCMACoal2022PAGE125AnnexesIEA.CCBY4.0.CountryProjectCompanyTypeEarliestproposedstart-upProposedfullcapacity(Mtpa)ResourceStatusAustraliaOliveDownsSouthStage2PembrokeResourcesE2027+4.5CCLAAustraliaRedHillMiningBHPBilliton/MitsubishiAllianceN202714CCLAAustraliaRollestonExpansionProjectGlencoreE2025+5TCLAAustraliaRussellValeUndergroundExpansionRevisedProjectWollongongCoalE20211CCMAAustraliaSarajiEastBHPBilliton/MitsubishiAllianceN20247CCLAAustraliaSouthGalileeCoalProjectAlphaCoalPtyLtdandAMCI(Alpha)PtyLtdN2027+3TCLAAustraliaSpringsureCreekAdameliaGroupN2027+11TCLAAustraliaSpurHillUndergroundCoalProjectMalabarCoalN2026+6TC,CCLAAustraliaStratfordextensionYancoalAustraliaE20221.2TCMAAustraliaStyx(CentralQueenslandCoalProject)CentralQueenslandCoalPtyLtdN2027+2TC,CCLAAustraliaTahmoorSouthCoalProjectSIMECGroupE20221CCMAAustraliaTheRangeProjectStanmoreCoalN2026+5TCLAAustraliaVickeryExtensionProjectWhitehavenN20255.5TC,CCLAAustraliaVulcanMineComplexVitriniteN20221.9CCMAAustraliaWallarah2CoalProjectKoreaResourcesCorpN2027+4TCLACoal2022PAGE126AnnexesIEA.CCBY4.0.CountryProjectCompanyTypeEarliestproposedstart-upProposedfullcapacity(Mtpa)ResourceStatusAustraliaWaltonAquilaResourcesN2024+1.6PCILAAustraliaWandoanGlencoreN2027+22TCLAAustraliaWardsWellBHPBilliton/MitsubishiAllianceN20275CCLAAustraliaWillunga/VermontEastPembrokeResourcesE20294TC,CC,PCILAAustraliaWilton-FairhillFuturaResourcesN20232.6CCMAAustraliaWinchesterSouthWhitehavenCoalN2027+8.5TC,CCLABotswanaBoomslangProjectTlouEnergyN....TCLABotswanaMmamabulaCoalProjectMaatlaN20231.2TCMACanadaCrownMountainJamesonResourcesN20251.9CC,PCILACanadaElkoPacificAmericanCoalN..1.25CCLACanadaFordingRiverExtensionProjectTeckCoalE202710CCLACanadaChinookMontemResourcesN....CCLACanadaGrandeCacheCSTN20221.7CCMACanadaGrassyMountainBegaMiningN2023+4.5CCLACanadaGroundhogAtrumCoalN..0.9TCLACanadaMurrayRiverHDMiningN..6CCLACanadaMichelCoalProjectNorthCoalN20242CCLACanadaSukunkaGlencoreN..3CCLACoal2022PAGE127AnnexesIEA.CCBY4.0.CountryProjectCompanyTypeEarliestproposedstart-upProposedfullcapacity(Mtpa)ResourceStatusCanadaTenasAllegianceCoal/ItochuN20240.75CCLACanadaTentMountainMontemE20231.1TCLACanadaWolverine-HermannAmendmentProjectConumaCoalResourcesLtd.N20221CCLAColombiaCanaveralesYildirimHoldingN20212.5TCLAColombiaPapayalYildirimHoldingN20222.4TCLAColombiaSanJuanYildirimHoldingN202316TC,PCILAColombiaLaFranciaandElHatilloColombianNaturalResources(CNR)E20212TCMAIndonesiaAdaroMetCoalCompanies(AMC)ConcessionsAdaroN....CCLAIndonesiaArthacoPrimaEnergiIATAN....TCLAIndonesiaBukitEnimEnergiAdaroN....TCLAIndonesiaTambangBenuaAlamRaya(TBAR)projectCokalN....CCLAIndonesiaTeknoOrbitPersadaMECCoalN..5TCLAMongoliaNuursteiCokingProjectAspireMiningN20191CCLAMongoliaOvootAspireMiningN20214CCMAMongoliaShinejinstSakerResourcesN20213CCMAMongoliaTavanTolgoiExtensionErdenesTavanTolgoiE202119CCLAMozambiqueMoatizeCoalMineVulcanMinerals(JindalGroup)E202115TC,CCLACoal2022PAGE128AnnexesIEA.CCBY4.0.CountryProjectCompanyTypeEarliestproposedstart-upProposedfullcapacity(Mtpa)ResourceStatusMozambiqueNcondeziNcondeziEnergyN20221.5TCLAMozambiqueRevuboeTalbotGroup,NipponSteelandPOSCON..7TC,CCLAMozambiqueZambezeICVLN202312CCLAPolandJanKarskiProjectPrairieMiningN..6.3CCLARussiaAmaamTigerRealmCoalN20225CCLARussiaChernogorskySUEKE20233.5TCMARussiaElegestExpansionTuvaEnergyIndustryCorporation(TEPK)E..10CCLARussiaInaglinsky-2KolmarE..8CCLARussiaKarakansky(StageIII)/KarakanskyGlobokyKarakanInvestN20193TCLARussiaPravoberezhnySUEKE20243TCLARussiaWest-TaymyrIndustrialClusterAEONN20235CCMARussiaTikhovaStage2IndustrialMetallurgicalHoldingE20251.3CCLASouthAfricaArgentCollieryGlencore/ShandukaN..1.2TCLASouthAfricaUmzilacoalmineCanyonCoalN20233.6TCMASouthAfricaBoikarabeloStage2ResourceGenerationE2025+6TCLACoal2022PAGE129AnnexesIEA.CCBY4.0.CountryProjectCompanyTypeEarliestproposedstart-upProposedfullcapacity(Mtpa)ResourceStatusSouthAfricaEloffcoalprojectUniversalCoalE..2.4TCMASouthAfricaGilacoalmineCanyonCoalN..1.8TCLASouthAfricaGugulethucoalmineCanyonCoalN20233.6TCMASouthAfricaKhwezelaextensionThungelaResourcesLimitedE20304.6TCLASouthAfricaKoornfonteinOCBlackRoyaltyMineralsE20233TCMASouthAfricaLibertyCoalMineExpansionTemplarCapitalE..12TCLASouthAfricaMakhadoPhase1MCMiningN20231.1TC,CCMASouthAfricaMakhadoPhase2MCMiningE20250.6TC,CCLASouthAfricaNewLargoSeritiN..12TCLASouthAfricaUkwenamacoalmineCanyonCoalN..0.6TCLASouthAfricaWeltevredencoalprojectSeritiE....TCMASouthAfricaSukumacoalmineCanyonCoalN20237TCLASouthAfricaThusocoalprojectCanyonCoalN20231.2TCLAUkraineLubelLubelCoalCompanyN..5.2CCLAUnitedKingdomLochinvarNewAgeExplorationN..1.4CCLAUnitedKingdomWoodhouseCollieryWestCumbriaMiningN20242.5CCLAUnitedStatesBlueCreekNo.1WarriorMetCoalE20254.3CCLACoal2022PAGE130AnnexesIEA.CCBY4.0.CountryProjectCompanyTypeEarliestproposedstart-upProposedfullcapacity(Mtpa)ResourceStatusUnitedStatesElkCreekRamacoCarbonLCCE20230.9CCMAUnitedStatesItmannConsolEnergyN20220.6CCMAUnitedStatesLongviewNorthCentralRessources,LLCN20233CCMAUnitedStatesRAMMineRamacoResources,Inc.N20230.5CCLAUnitedStatesRiverViewHendersonPortal1AllianceCoalLLCN2025..TCLACoal2022PAGE131AnnexesIEA.CCBY4.0.DefinitionsCoal:Asolid,combustiblefossilsedimentaryrock.Coalcomesfromburiedvegetationtransformedbytheactionofstrongpressureandhightemperaturesovermillionsofyears.Coalrank:Thedegreeoftransformationfromtheoriginalplantsource.Itislooselyrelatedtotheageofthecoalandismainlydeterminedfromrandomreflectanceofthevitrinite,oneofcoal’sorganiccomponents.Theranksofcoal,indecreasingorderoftransformationfromhightolow,are:anthracite,bituminouscoal,sub-bituminouscoal,ligniteandpeat.Thisreportdistinguishesbetweenhardcoal(anthracite,bituminousandsub-bituminouscoal)andlignite,whilepeatisnotconsidered.Coalclassification:Referstoarangeofcoalage,compositionandotherproperties.Manyclassificationsareusedaroundtheworldwiththemainparameterbeingthecoalrank,supplementedbyitsintendeduse,i.e.thermalormetallurgicalapplications.Coalquality:Representsavarietyofpropertiesexhibitedbycoalwhenitisused.Calorificvalueandimpuritycontentarethemainparametersdefiningthequalityofthermalcoal,whereascakingproperties,resistanceandimpuritycontentarethedistinguishingcharacteristicsforcokingcoal.Thermal(orsteam)coal:Referstohardcoalusedforpurposesotherthanmetallurgyinthisreport.Cokingcoal:High-qualitycoaltoproducecokeusedinblastfurnacestomakepigiron.Cokingcoalandmetallurgicalcoalaretermssometimesusedinterchangeably.Semi-softcoal:High-qualitysteamcoalmixedwithcokingcoaltoproducecokeforblastfurnaces.Pulverisedcoalinjection(PCI)coal:Ahigh-qualitysteamcoalinjectedintoablastfurnacetoreducecokeconsumption.Metallurgicalcoal:Referstocokingcoal,semi-softcoalandpulverisedcoalInjectioncoalinthisreport.Althoughanthraciteisoftenusedformetallurgicalpurposes,itisclassifiedasthermalcoalinthisreport.Run-of-minecoal:Rawcoalasitisminedprevioustoanyprocessing.Tonneofcoalequivalent(tce):Aunitofenergywidelyusedintheinternationalcoalindustry.Itisdefinedas7millionkilocalories(kcal).Therefore,therelationshipbetweentceandphysicaltonnesdependsonthenetcalorificvalueofthecoal.Onetonneofcoalwithanetcalorificvalueof7000kcalperkilogramme(kcal/kg)represents1tce.Coalmining:Atechniqueusedtoremovecoalfromanaturaldeposit.CoaldepositsintheEarth’scrustoccuratvariousdepthsandseamconfigurations,whichdeterminetheminingmethodused.Generally,deepdepositsareminedundergroundandshallowdepositsareexploitedthroughopencastmines.Thestripratiolargelydetermineswhetheranopencastmineisprofitableornot.Stripratio:Theoverburdenorwastematerialremoved,usuallyexpressedascubicmetrespertonneofcoalextracted.Highstripratiosmakeopencastminingunprofitable.Opencastmining:Amethodinwhichtheoverburdenisfirstdrilled,thenblasted,andwhenthedepositisaccessible,coalisremovedinasimilarwaytotheoverburden.Toremovethecoal,powershovels,conveyorbeltsandtrucksmaybeused,aswellassomeextremelylargemachinerysuchasdraglinesandbucketwheels.Opencastminingisusuallylesslabour-intensivethanundergroundmining,buthashigherconsumablecosts,e.g.fortyres,dieselandexplosives.Generally,opencastmethodsimplygreaterenvironmentalimpactthanundergroundmining.Coal2022PAGE132AnnexesIEA.CCBY4.0.Undergroundmining:Amethodinwhichaccesstocoalseamsisgainedthroughundergroundshafts,galleriesandtunnels.Althoughtherearemanywaystomineanundergrounddeposit,coalisusuallystrippedbyautomaticshearersorcontinuousmechanicalminersusingeithershort/longwallsorroom-and-pillarexploitations.Undergroundminingisgenerallymorelabour-intensiveandrequireshighercapitalinvestmentsthanopencastmining.Coalwashing/upgrading:Aprocessinwhichimpurities(i.e.ash,moisture)arepartiallyremovedfromrawcoaltoproduceahigher-qualitycoal.Coal2022PAGE133AnnexesIEA.CCBY4.0.RegionalgroupingsAfrica:Algeria,Angola,Benin,Botswana,Cameroon,RepublicoftheCongo(Congo),Côted’Ivoire,DemocraticRepublicoftheCongo,Egypt,Eritrea,Ethiopia,Gabon,Ghana,Kenya,Libya,Mauritius,Morocco,Mozambique,Namibia,Niger,Nigeria,Senegal,SouthAfrica,SouthSudan,Sudan,UnitedRepublicofTanzania(Tanzania),Togo,Tunisia,Zambia,ZimbabweandotherAfricancountriesandterritories.AsiaPacific:SoutheastAsiaregionalgroupingandAustralia,Bangladesh,thePeople’sRepublicofChinaandHongKong(China),ChineseTaipei,India,Japan,Korea,DemocraticPeople’sRepublicofKorea(NorthKorea),Mongolia,Nepal,NewZealand,Pakistan,SriLanka,andotherAsiancountriesandterritories.CentralandSouthAmerica:Argentina,PlurinationalStateofBolivia(Bolivia),Brazil,Chile,Colombia,CostaRica,Cuba,Curaçao,DominicanRepublic,Ecuador,ElSalvador,Guatemala,Haiti,Honduras,Jamaica,Nicaragua,Panama,Paraguay,Peru,Suriname,TrinidadandTobago,Uruguay,BolivarianRepublicofVenezuela(Venezuela),andotherCentralandSouthAmericancountriesandterritories.China:ThePeople'sRepublicofChinaandHongKong.Eurasia:Armenia,Azerbaijan,Belarus,Georgia,Kazakhstan,Kyrgyzstan,RepublicofMoldova,RussianFederation(Russia),Tajikistan,Turkmenistan,UkraineandUzbekistanEurope:EuropeanUnionregionalgroupingandAlbania,BosniaandHerzegovina,Iceland,Gibraltar,Kosovo,Montenegro,Norway,RepublicofNorthMacedonia,Serbia,Switzerland,RepublicofTürkiyeandtheUnitedKingdom.EuropeanUnion(EU):Austria,Belgium,Bulgaria,Croatia,Cyprus,CzechRepublic,Denmark,Estonia,Finland,France,Germany,Greece,Hungary,Ireland,Italy,Latvia,Lithuania,Luxembourg,Malta,Netherlands,Poland,Portugal,Romania,SlovakRepublic,Slovenia,SpainandSweden.MiddleEast:Bahrain,IslamicRepublicofIran(Iran),Iraq,Israel,Jordan,Kuwait,Lebanon,Oman,Qatar,SaudiArabia,SyrianArabRepublic(Syria),theUnitedArabEmiratesandYemen.NorthAmerica:Canada,MexicoandUnitedStates.SoutheastAsia:BruneiDarussalam,Cambodia,Indonesia,LaoPeople’sDemocraticRepublic(LaoPDR),Malaysia,Myanmar,Philippines,Singapore,ThailandandVietNam.ThesecountriesareallmembersoftheAssociationofSoutheastAsianNations(ASEAN).Coal2022PAGE134AnnexesIEA.CCBY4.0.AbbreviationsandacronymsAPIArgus/McCloskey’sCoalPriceIndexARAAmsterdam,Rotterdam,andAntwerpCCUScarboncapture,utilisationandstorageCFRcostandfreightCIFcost,insuranceandfreightCRUCRUGroupCVcalorificvalueEIAEnergyInformationAdministration(UnitedStates)EUEuropeanUnionFOBfreeonboardGDPgrossdomesticproductIEAInternationalEnergyAgencymetmetallurgicalOECDOrganisationforEconomicCo-operationandDevelopmentLNGliquefiednaturalgasTTFTitleTransferFacility(Netherlands)USUnitedStatesUSDUnitedStatesdollary-o-yyear-on-yearUnitsofmeasurebtbilliontonnesGWgigawattkcalkilocaloriekgkilogrammekmkilometrektkilotonnesMBtumillionBritishthermalunitsMtmilliontonnesMtpamilliontonnesperannumMWmegawattttonneTWhterawatthoursCoal2022PAGE135AnnexesIEA.CCBY4.0.Acknowledgements,contributorsandcreditsThispublicationhasbeenpreparedbytheGas,CoalandPowerMarketsDivision(GCP)oftheInternationalEnergyAgency(IEA).Theanalysiswasledandco-ordinatedbyCarlosFernándezAlvarez,actingHeadofGCP.ArneLilienkamp,JonasZinkeandCarlosFernándezAlvarezaretheauthors.KeisukeSadamori,DirectoroftheEnergyMarketsandSecurity(EMS)Directorate,providedexpertguidanceandadvice.OtherIEAcolleaguesprovidedimportantcontributions,includingYasminaAbdelilah,HeymiBahar,LouisChambeau,JoelCouse,LauraCozzi,Jean-BaptisteDubreuil,TimGould,AsthaGupta,TetsuroHattori,CiaránHealy,MartinHusek,YuJinJeong,JavierJorquera,AkosLosz,GergelyMolnár,JinseokRhoandHiroyasuSakaguchi.TimelyandcomprehensivedatafromtheEnergyDataCentrewerefundamentaltothereport.LauraMartínezandNicolaDraguiprovidedinvaluablesupportduringtheprocess.ThanksgoalsototheIEAChinadesk,particularlyRebeccaMcKimm,YangZhiyuandYangBiqing,fortheirresearchonChina.TheIEACommunicationandDigitalOffice(CDO)providedproductionandlaunchsupport.ParticularthanksgotoJadMouawad,HeadofCDO,andhisteam:AstridDummond,JethroMullen,GregViscusi,IsabelleNonain-SemelinandThereseWalsh.DianeMunroeditedthereport.OurgratitudegoestotheInstituteofEnergyEconomicsattheUniversityofCologne(EWI)forsharingtheirextensivecoalexpertiseandmodellinginsights.CRUprovidedinvaluabledataandinformationforthisreport.ThankstoDmitryPopovforhissupportandsuggestions.OurgratitudegoestotheIEACoalIndustryAdvisoryBoard(CIAB)fortheirsupport.Specialthankstotheinternationalexpertswhohaveprovidedinputduringtheprocessand/orreviewedthedraftofthereport.Theyinclude:KevinBall(WhiteheavenCoal),MickBuffier(Glencore),MichaelCaravaggio(EPRI),RodrigoEcheverri(NobleResources),NikkiFisher(ThungelaResources),JustinFlood(DeltaElectricity),FabioGabrieli(Skatkraft),LiuYunhui(TsinghuaUniversity),PatriciaNaulitaLumbanGaol(Adaro),LukazsMazanek(PolskaGroupaGornicza),PeterMorris(MineralsCouncilofAustralia),HansWilhemSchiffer(RWE),PaulSimons(YaleUniversity)andAkiraYabumoto(J-POWER).Theindividualsandorganisationsthatcontributedtothisreportarenotresponsibleforanyopinionorjudgementitcontains.AnyerrororomissionisthesoleresponsibilityoftheIEA.Forquestionsandcomments,pleasecontactCarlosFernándezAlvarez(Carlos.Fernandez@iea.org).InternationalEnergyAgency(IEA)ThisworkreflectstheviewsoftheIEASecretariatbutdoesnotnecessarilyreflectthoseoftheIEA’sindividualMembercountriesorofanyparticularfunderorcollaborator.Theworkdoesnotconstituteprofessionaladviceonanyspecificissueorsituation.TheIEAmakesnorepresentationorwarranty,expressorimplied,inrespectofthework’scontents(includingitscompletenessoraccuracy)andshallnotberesponsibleforanyuseof,orrelianceon,thework.Thisdocumentandanymapincludedhereinarewithoutprejudicetothestatusoforsovereigntyoveranyterritory,tothedelimitationofinternationalfrontiersandboundariesandtothenameofanyterritory,cityorarea.Unlessotherwiseindicated,allmaterialpresentedinfiguresandtablesisderivedfromIEAdataandanalysis.IEAPublicationsInternationalEnergyAgencyWebsite:www.iea.orgContactinformation:www.iea.org/contactTypesetinFrancebyIEA-December2022Coverdesign:IEAPhotocredits:©GettyImagesSubjecttotheIEA’sNoticeforCC-licencedContent,thisworkislicencedunderaCreativeCommonsAttribution4.0InternationalLicence.

1、当您付费下载文档后,您只拥有了使用权限,并不意味着购买了版权,文档只能用于自身使用,不得用于其他商业用途(如 [转卖]进行直接盈利或[编辑后售卖]进行间接盈利)。
2、本站所有内容均由合作方或网友上传,本站不对文档的完整性、权威性及其观点立场正确性做任何保证或承诺!文档内容仅供研究参考,付费前请自行鉴别。
3、如文档内容存在违规,或者侵犯商业秘密、侵犯著作权等,请点击“违规举报”。

碎片内容

碳中和
已认证
内容提供者

碳中和

确认删除?
回到顶部
微信客服
  • 管理员微信
QQ客服
  • QQ客服点击这里给我发消息
客服邮箱