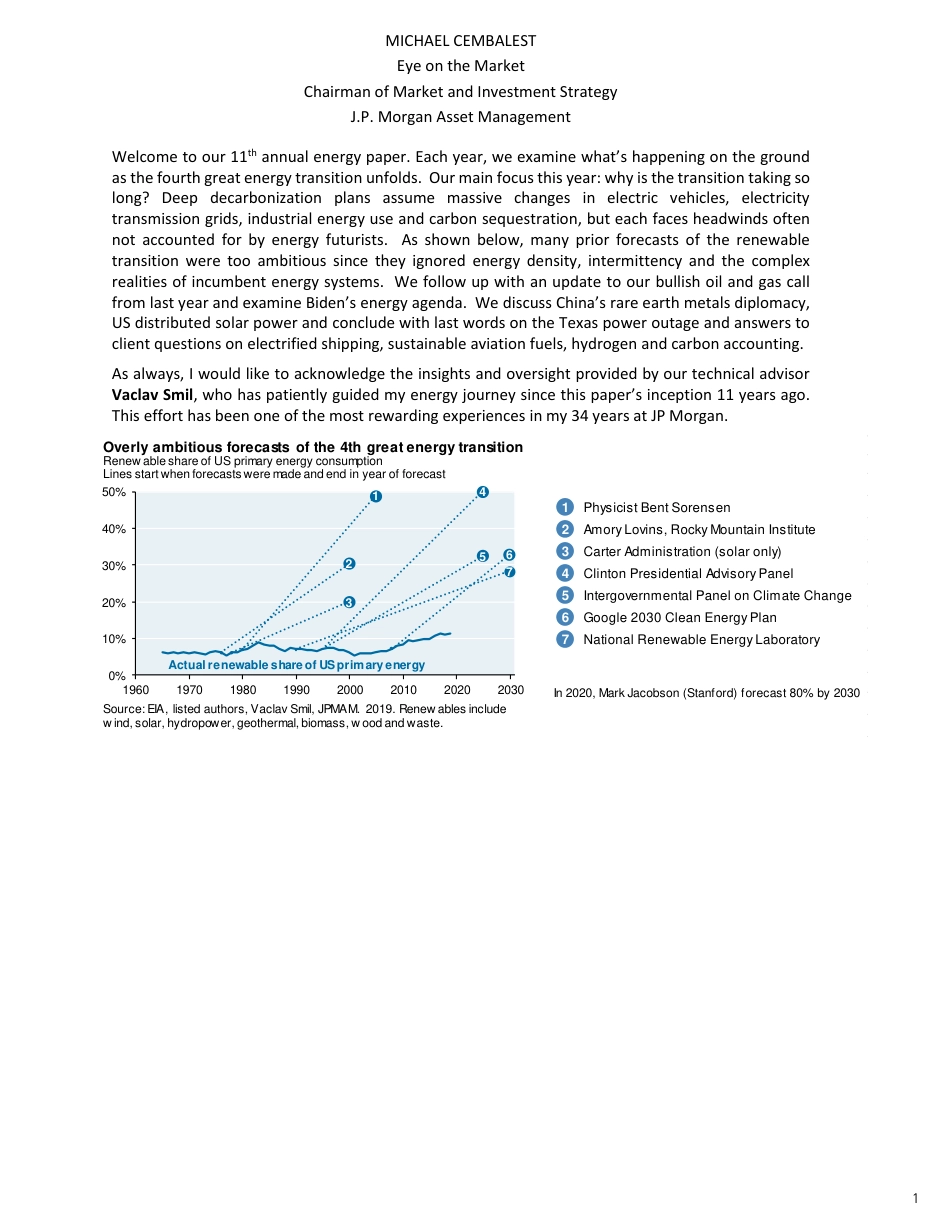
EYEONTHEMARKET2021AnnualEnergyPaperMICHAELCEMBALESTJPMORGANASSETANDWEALTHMANAGEMENTFutureshock.Absentdecarbonizationshocktreatment,humanswillbeweddedtopetroleumandotherfossilfuelsforlongerthantheywouldlike.Windandsolarpowerreachnewheightseveryyearbutstillrepresentjust5%ofglobalprimaryenergyconsumption.Inthisyear’senergypaper,wereviewwhydecarbonizationistakingsolong:transmissionobstacles,industrialenergyuse,thegargantuanmineralandpipelinedemandsofsequestrationandtheslowmotionEVrevolution.Othertopicsincludeouroil&gasviews,PresidentBiden’senergyagenda,China,theTexaspoweroutageandclientquestionsonelectrifiedshipping,sustainableaviationfuels,lowenergynuclearpower,hydrogenandcarbonaccounting.1MICHAELCEMBALESTEyeontheMarketChairmanofMarketandInvestmentStrategyJ.P.MorganAssetManagementWelcometoour11thannualenergypaper.Eachyear,weexaminewhat’shappeningonthegroundasthefourthgreatenergytransitionunfolds.Ourmainfocusthisyear:whyisthetransitiontakingsolong?Deepdecarbonizationplansassumemassivechangesinelectricvehicles,electricitytransmissiongrids,industrialenergyuseandcarbonsequestration,buteachfacesheadwindsoftennotaccountedforbyenergyfuturists.Asshownbelow,manypriorforecastsoftherenewabletransitionweretooambitioussincetheyignoredenergydensity,intermittencyandthecomplexrealitiesofincumbentenergysystems.WefollowupwithanupdatetoourbullishoilandgascallfromlastyearandexamineBiden’senergyagenda.WediscussChina’srareearthmetalsdiplomacy,USdistributedsolarpowerandconcludewithlastwordsontheTexaspoweroutageandanswerstoclientquestionsonelectrifiedshipping,sustainableaviationfuels,hydrogenandcarbonaccounting.Asalways,IwouldliketoacknowledgetheinsightsandoversightprovidedbyourtechnicaladvisorVaclavSmil,whohaspatientlyguidedmyenergyjourneysincethispaper’sinception11yearsago.Thisefforthasbeenoneofthemostrewardingexperiencesinmy34yearsatJPMorgan.PhysicistBentSorensenAmoryLovins,RockyMountainInstituteCarterAdministration(solaronly)ClintonPresidentialAdvisoryPanelIntergovernmentalPanelonClimateChangeGoogle2030CleanEnergyPlanNationalRenewableEnergyLaboratoryIn2020,MarkJacobson(Stanford)forecast80%by203023176540%10%20%30%40%50%19601970198019902000201020202030Source:EIA,listedauthors,VaclavSmil,JPMAM.2019.Renewablesincludewind,solar,hydropower,geothermal,biomass,woodandwaste.Overlyambitiousforecastsofthe4thgreatenergytransitionRenewableshareofUSprimaryenergyconsumptionLinesstartwhenforecastsweremadeandendinyearofforecastActualrenewableshareofUSprimaryenergy12345672ExecutiveSummaryPresidentBidenjustannouncedanewGHGemissionstarget:a50%declineby2030vsa2005baseline.Thisveryambitioustargetimpliesadecarbonizationpaceinthenext10yearsthat’sfourtimesfasterthaninthelast15years.Evenwiththeamountofmoneytheadministrationplanstodedicatetothetask,it’sanenormoushurdle.Inthispaper,wewillbediscussingsomeofthereasonswhy.2345678199019952000200520102015202020252030TheBidenplan:halvingemissionsfrom2005to2030GHGemissions,billiontonnesofCO2equivalentSource:EPA,UN,JPMAM.2019.Biden2030plan0%10%20%30%40%50%60%70%80%90%100%1995201919982020199820191998202020052019Source:UNDept.ofSocialandEconomicAffairs,Worldsteel,PlasticsEurope,USGS.2020.Ashiftinenergyintensivemanufacturingtotheemergingworld,%ofglobalproductionManufacturingSteelAmmoniaCementDevelopedeconomiesEmergingeconomiesPlasticTheevenmoreimportantandlargerquestion:eveniftheUSsucceeds,whatabouteveryoneelse?Overthelast25years,thedevelopedworldshiftedmuchofitscarbon-intensivemanufacturingofsteel,cement,ammoniaandplasticstothedevelopingworld.Asaresult,developingworldadoptionofwind,solar,storageandnuclearpowermayendupbeingtheprimarydeterminantoffutureglobalemissionsoutcomes.Thathascertainlybeenthecaseoverthelastdecade:EuropeandJapanreducedprimaryenergyuse1by4%-6%butdevelopingworldincreaseswere6xhigherthantheirreductions;China/Indiaenergyuseisstillsoaring;andAfrica’senergyuseisrisingfrompercapitalevelsseeninEuropeinthe19thcentury.Theworldgetsmoreenergyefficienteveryyear,butlevelsofemissionskeeprising.That’swhymostdeepdecarbonizationideasrelyonreplacementoffossilfuelsratherthanreducingfossilfuelconsumptionpercapitaorperunitofperformance.-400-2000200400600800EUJapanUSLatinAmericaSEAsiaex-Ch/IndiaMiddleEastAfricaChinaIndiaHistoricalchange2010to2019Projectedchange2019to2040Source:InternationalEnergyAgencyStatedPoliciesScenario.2020.Changeinprimaryenergyuse,pastandfutureMilliontonnesofoilequivalent1015202530350.200.250.300.350.400.450.500.550.60196519701975198019851990199520002005201020152020Source:BPStatisticalReviewofWorldEnergy,ConferenceBoard.2020.GlobalCO2intensitydeclining,CO2emissionsrisingTonnesofCO2/thousand$2019GDPBilliontonnesCO2intensityCO2emissions1Primaryenergyreferstothermalenergycontainedinfossilandbiomassfuelsandalsotothermalequivalentsofprimaryelectricitygeneratedfromnuclearandrenewablesources.Convertingprimaryelectricitytoprimaryenergycanbedonebyusingitsthermalequivalent(1kWh=3.6MJor3,412BTU)orbyusinganaverageannualheatrateoffossilfuelplants(40%efficiency,equalto9MJ/kWhor8,530BTU).Finalenergyconsumptionisequaltoprimaryenergyless(a)energylostintheconversionoffossilfuels(crudeoilrefining,naturalgasprocessing)(b)energylostinconversionoffossilfuelstoelectricity,(c)powerplantconsumptionofelectricityand(d)transmissionlosses.3Howistheglobalenergytransitiongoing?Takentogether,theaggregateimpactofnuclear,hydroelectricandsolar/windgenerationreducedglobalrelianceonfossilfuelsfrom~95%ofprimaryenergyin1975to~85%in2020.Inotherwords,energytransitionstakealongtimeandlotsofmoney.TheIEAexpectsfossilfuelreliancetodeclineatamorerapidpacenow,fueledinpartby“BigOil”companiesbecoming“BigEnergy”companiesandbyafasterglobalEVtransition.In2021renewablesareforthefirsttimeexpectedtogarnermorecapitalspendingthanupstreamoil&gas.Thisprocessisinfluencedbydivergingcostsofcapital:3%-5%forsolarandwind,10%-15%fornaturalgasandupto20%foroilprojects.However,theIEAstillprojectsthat70%-75%ofglobalprimaryenergyconsumptionmaybemetviafossilfuelsintheyear2040.Whydon’trapidwindandsolarpricedeclinestranslateintofasterdecarbonization?Aswewilldiscuss,renewableenergyisstillmostlyusedtogenerateelectricity,andelectricityasashareoffinalenergyconsumptiononaglobalbasisisstilljust18%.Inotherwords,directuseoffossilfuelsisstilltheprimarymoverinthemodernworld,asthedemiseoffossilfuelscontinuestobeprematurelydeclaredbyenergyfuturists2.Asshowninthelastthreecharts,wind/solarcapacityisgrowingandgainsinrenewableelectricitygenerationareimpressive,butinprimaryenergytermstheyaremuchsmaller.2Anexample:theCEOoftheRockyMountainInstitutewrotelastyear,citingCarbonTracker,thatpost-COVIDglobalfossilfuelconsumptionmayneversurpass2019levels.Really?TheEIAprojectsafullrecoveryinliquidfuelsconsumptionby2022andprojectsthesamefornaturalgas.Globalcoalconsumptionisprojectedtodeclineby240millionmetrictonsfrom2019to2025,buttheIEA’sprojectedincreaseforglobalnaturalgasconsumptionby2025of390billioncubicmetersis2.8xthedeclineincoalinenergy(exajoule)terms.So,evenifliquidfuelsconsumptionplateausat2019levels,worldfossilfueldemandhasalmostcertainlynotpeakedyet.Also:December2020globalCO2emissionswerealreadyaboveDecember2019levels(IEA).70%75%80%85%90%95%100%'65'70'75'80'85'90'95'00'05'10'15'20'25'30'35'40Source:BPStatisticalReviewofWorldEnergy,IEA.2020.Theworldusesfossilfuelsfor~85%ofitsenergy%ofglobalprimaryenergyconsumptionfromcoal,oilandnatgasNuclearadoptioneraSolar/winderabeginsIEAStatedPoliciesScenarioPre-existinghydropower$0$20$40$60$80$100$120$140$160$180$200$220201020122014201620182020Source:LawrenceBerkeleyNationalLaboratory,IRENA.2020.Averagepowerpurchaseagreementpricesforwindandsolar,Real2019$permegawatthourUSwindGlobalwindUSsolarphotovoltaicGlobalsolarphotovoltaicNote:PPAsreflectthebenefitofsubsidiessuchastheUSITC01020304050607019982001200420072010201320162019Windandsolarcapacityadditionsy/ychange,gigawattsSource:BPStatisticalReviewofEnergy.2020.ChinaEuropeUSIndia0%2%4%6%8%10%12%14%16%18%19982001200420072010201320162019Windandsolarshareoftotalelectricitygeneration,%Source:BPStatisticalReviewofEnergy.2020.ChinaEuropeUSIndia0%1%2%3%4%5%6%7%19982001200420072010201320162019Windandsolarshareoftotalprimaryenergyconsumption,%Source:BPStatisticalReviewofEnergy.2020.ChinaEuropeUSIndia4Let’stakeacloserlookatenergyconsumptionintheUS,EuropeandChinawhichcollectivelyrepresentalittleoverhalfoftheglobaltotal.Thechartsshowfinalenergyconsumptionbyend-userandtypeoffuel,withthedottedsegmentsindicatingelectricityconsumption,alsobrokendownbyfuel.UnitedStatesKeystatsQuadsofprimaryenergyconsumption99.9Quadsoffinalenergyconsumption75.1Electricity%ofenergyconsumed17%Electricity%ofindustrialenergyconsumed12%Electricity%oftransportenergyconsumed0%Fossilfuels%ofprimaryenergy80%Passengercarenergy%oftransportenergy60%Passengercarenergy%ofprimaryenergy17%Industrialfossilfuels%ofprimaryenergy27%Renewable%ofelectricitygeneration18%Renewableenergy%ofprimaryenergy11%Lowcarbon%ofelectricitygeneration40%Lowcarbonenergy%ofprimaryenergy20%Coaltonaturalgasratioinprimaryenergy0.4Hydropowershareofrenewableelectricity40%051015202530INDUSTRIALTRANSPORTRESIDENTIALCOMMERCIALOILCOALNATGASRENEWABLENUCLEARUSenergyconsumedbyend-usesectorandfueltypeQuadrillionBTUsoffinalenergyconsumed;dottedsegments=electricityconsumedSource:EnergyInformationAdministration,JPMorganAssetManagement.2019.Electricitygenerationsegmentsarenetofthermalconversion,powerplantconsumptionandtransmissionlosses."Lowcarbon"referstorenewablegenerationplusnucleargeneration.TheUSisstillhighlyreliantonfossilfuelswhichaccountfor80%ofprimaryenergy.Renewableelectricityisthelowestofthe3regionsat18%,althoughnuclearaddssignificantcarbon-freeelectricity.Electrificationofindustryisthelowestofthethreeregionsat12%,andelectrificationoftransportisalmostnon-existent.Around5%oftransportfuelcomesfromcornethanolwhoseGHGbenefitsvsgasolinearestillhotlydebated3.TheUScoal-to-naturalgasratiohasfallenwaybelowone,adevelopmentwhichreducesairpollutionandgroundwaterrisksbutwhoseGHGbenefitsarestilldebatedaswell.AsperLBNL,50%ofthedeclineinpower-relatedCO2emissionsintheUSsince2005isattributabletocoal-to-gasswitching,aprocesswhichisnow~80%complete.•NaturalgasispreferabletocoalfromaGHGperspective.Inits2019assessmentoflifecycleemissionsfromnaturalgasandcoal,theIEAconcludedthatover98%ofgasconsumedtodayhasalowerlifecycleemissionsintensitythancoalwhenusedforpowerorheat.Inits2020assessment,theIEAconcludedthatswitchingtogasresultsinaveragedeclinesof33%perunitofheatusedinindustryandbuildings,and50%whengeneratingelectricity.Moreover,theIEAfoundthataboutthree-quartersoftoday’smethaneemissionsfromtheoilandgasindustrycanbecontrolledbydeployingknowntechnicalfixes•NaturalgasGHGbenefitsvscoalarestillunclear.Someclimatescientistsarere-evaluatingtheshareofmethaneemissionsthatcomefrompre-Industrialgeologicsourcesvsthosefromcoalandnaturalgascombustion.Estimatesofthelatterarerising4,leadingtodownwardrevisionsinthemethaneleakagebreak-evenratethatrendersnaturalgasbetterthancoalfromaGHGperspective.Estimatesofnaturalgasmethaneleakageratesrangefrom2%to6%,andthebreak-evenratevscoalmaybeaslowas1%53EESI,ArgonneLabsandtheUSDAcite70%-95%reductionsincarcinogenicparticulatesfromE10/E85ethanolblendsand20%-50%reductionsinGHGemissions.However,most“EROI”analysesforcornethanolrangefrom0.9to1.6(“energyout”isnotmuchdifferentfrom“energyin”),implyingthatethanolGHGsavingsareatthelowendofthatrange.UnlikeBrazilianethanolwhosebagasseisusedinproduction,USethanolproductionreliesonnaturalgas.CornethanolhasoneofthelowestEROImeasuresofallformsoffuel/power;asinexactasEROImeasuresare,theysuggestthatcornethanolisapoliticaldecisionandnotjustanenvironmentalone.Also:fertilizationandirrigationofcornleadstoenhancednitrogenlossesandaquiferdepletion.4“PreindustrialCH4indicatesgreateranthropogenicfossilCH4emissions”,Nature,Hmieletal,February2020.5“Naturalgasisadirtierenergysourcethanwethought”,NatGeo,Feb2020citingRobertHowarth(Cornell).5ChinaKeystatsQuadsofprimaryenergyconsumption151.0Quadsoffinalenergyconsumption101.5Electricity%ofenergyconsumed23%Electricity%ofindustrialenergyconsumed23%Electricity%oftransportenergyconsumed4%Fossilfuels%ofprimaryenergy81%Passengercarenergy%oftransportenergy25%Passengercarenergy%ofprimaryenergy3%Industrialfossilfuels%ofprimaryenergy57%Renewable%ofelectricitygeneration31%Renewableenergy%ofprimaryenergy17%Lowcarbon%ofelectricitygeneration35%Lowcarbonenergy%ofprimaryenergy19%Coaltonaturalgasratioinprimaryenergy10.6Hydropowershareofrenewableelectricity58%01020304050607080INDUSTRIALTRANSPORTRESIDENTIALCOMMERCIALOILCOALNATGASRENEWABLENUCLEARChinaenergyconsumedbyend-usesectorandfueltypeQuadrillionBTUsoffinalenergyconsumed;dottedsegments=electricityconsumedSource:EnergyInformationAdministration,JPMorganAssetManagement.2019.Electricitygenerationsegmentsarenetofthermalconversion,powerplantconsumptionandtransmissionlosses."Lowcarbon"referstorenewablegenerationplusnucleargeneration.ItwouldbegreatnewsifChinasucceedswithitsplanfor25%EVsasashareofvehiclesalesby2025.EventhoughChina’spassengercarsrepresentonly25%ofitstransportenergyconsumptionvs60%intheUS,thatwouldstillbealotofChineseelectriccars.But…putEVsasideforamomentandfocusontheelephantintheroom:thenumberoneissueforChinaandtheworldisdecarbonizationofChina’smassiveindustrialsector,whichconsumes4xmoreprimaryenergythanitstransportsectorandmoreprimaryenergythanUSandEuropeanindustrialsectorscombined.ChinahaselectrifiedlargerpartsofitsindustrialsectorthantheUS(23%vs12%),butsinceChina’sgridissoreliantoncoal,electrificationprovidesfewerclimatebenefits.IncontrasttotheUS,Chinauses10xmorecoalthannaturalgas.In2020,Chinabuiltover3xasmuchnewcoalcapacityasallothercountriescombined,equaltoonelargecoalplantperweek.Chinacommissioned38.4GWofnewcoalplantsin2020,over3xtheamountcommissionedintherestoftheworld.Itscoalfleetgrewbynet29.8GWin2020whilenon-Chinanetcapacitydeclinedby17.2GW.Chinainitiated73.5GWofnewcoalplantproposalsin2020,over5xtherestoftheworldcombined.Yougetthepoint.There’salotofdiscussiononChina’splantoforgeaheadwithnuclearasthedevelopedworldretreatsfromit.Chinacurrentlyhas50GWofnuclearandplanstoincreasethisfigureto130GWby2030.Thenewnuclearplantswillrepresent~6%ofChina’s2030electricitygenerationand~3%ofitsprimaryenergy.So,nuclearisamaterialpartofChina’sdecarbonizationagendabuthardlyagamechangeronitsown.-40-2002040608010020002002200420062008201020122014201620182020ChinaandcoalCoalcapacity:additionsandretirements,gigawattsSource:CentreforResearchonEnergyandCleanAir.February2021.OtheradditionsChinanetadditionsUS/EUnetretirementsOtherretirements6EuropeKeystatsQuadsofprimaryenergyconsumption82.5Quadsoffinalenergyconsumption59.4Electricity%ofenergyconsumed19%Electricity%ofindustrialenergyconsumed19%Electricity%oftransportenergyconsumed1%Fossilfuels%ofprimaryenergy66%Passengercarenergy%oftransportenergy50%Passengercarenergy%ofprimaryenergy11%Industrialfossilfuels%ofprimaryenergy24%Renewable%ofelectricitygeneration47%Renewableenergy%ofprimaryenergy23%Lowcarbon%ofelectricitygeneration71%Lowcarbonenergy%ofprimaryenergy34%Coaltonaturalgasratioinprimaryenergy0.4Hydropowershareofrenewableelectricity46%0510152025INDUSTRIALTRANSPORTRESIDENTIALCOMMERCIALOILCOALNATGASRENEWABLENUCLEAROECDEuropeenergyconsumedbyend-usesectorandfueltypeQuadrillionBTUsoffinalenergyconsumed;dottedsegments=electricityconsumedSource:EnergyInformationAdministration,JPMorganAssetManagement.2019.Electricitygenerationsegmentsarenetofthermalconversion,powerplantconsumptionandtransmissionlosses."Lowcarbon"referstorenewablegenerationplusnucleargeneration.EuropeisfurtheralongthantheUSandChinaonrenewable/nuclearpenetrationonthegridandonreducingfossilfuelsasashareofprimaryenergy.Evenso,electrificationofEurope’stransportsectorwasstilljust1%attheendof2019,anditsindustrialsectorisstillheavilyreliantonfossilfuels.Europealsofacesauniquechallenge:whileitscoaltonaturalgasratioisthesame(0.4)asintheUS,thisisthebyproductoflargeamountsofnaturalgasimportedfromRussiaeveryyear.Asshownbelow,EuropeanoilandgasimportsfromRussiahavenowconvergedwithtotalEuropeanoilandgasproduction.ThereareahostofgeopoliticalandenergysecurityissuesherethatarenotinEurope’sfavor.EuropecouldimportLNGfromtheUS,QatarandAustraliabutatahighercostthanpipelineimportsfromRussia.02,0004,0006,0008,00010,00012,00014,000'80'82'84'86'88'90'92'94'96'98'00'02'04'06'08'10'12'14'16'18Source:BPStatisticalReviewofWorldEnergy,Gazprom,Eurostat,Perovicetal,JPMAMcalculations.2019.EuropeincludesEU,NorwayandTurkey.EuropeanproductionvsEuropeanimportsfromRussiaThousandbarrelsperdayofoilequivalentEuropeanoilandgasproductionEuropeanoilandgasimportsfromRussia7Theworldisgearinguptospendtrillionsofdollarstoacceleratethefourthgreatenergytransition6,thistimetorenewables.Marketvaluationsofrenewablecompaniesskyrocketedinearly2020;I’mnotsureallofthemmakesense.Oneexample:whydidthetotalvaluationoftheworld’scompetitive,high-volumeautoindustrygain70%inmarketcapitalizationinthethreeyearsendingJanuary2021?Asubsequentsellofferodedsomeofthegainsbuttheincreasessince2019arestillamongthelargestonrecord.Belowwecomparetheserenewablegainstopriorepisodes,someofwhichweresustainablewhileotherswerenot.Generoussubsidies,taxincentivesandgridpreferenceswillsustainmanyofthemeveniftheyareunprofitable.Forinvestors,thechallengewillbesortingoutthelong-termwinnersthatwillsurviveevenwhen/ifthesubsidiesgoaway.CollapsedCollapsedCollapsedUnknownCollapsedKeptgoingKeptgoing0%200%400%600%800%1000%1200%1400%ELECVEH(M)2019-currentELECVEH(E)2019-currentSOLAR2019-currentHYDROGEN2019-currentBATTERY2019-currentNIKKEIindex1985-1989NASDAQ1001997-2000COMMODITIES2005-2008FANG2017-2021AGRICULTURE2003-2006INTERACTIVEHOMEENT.2012-2015HEALTHCAREFACILITIES2009-2012Renewablestockpricesurge(2019-2021)vspriorsector/countrystockpricegainsof200%+in3yearsorlessLabelsindicatewhathappened3yearsafterthestockpricesurgeSource:Bloomberg,JPMAM.April26,2021.EVcompaniespresentedbothmarket-cap(M)andequal(E)weightedgivenTesla'soutsizedimpactontheformer.Jan2021Peak$0.0$0.5$1.0$1.5$2.0$2.5Jan'18Jul'18Jan'19Jul'19Jan'20Jul'20Jan'21MillionsMarketvalueofglobalautoindustryMarketcapitalization,US$,trillionsSource:"BigMarketDelusion:ElectricVehicles".March2021.EVspecialistsTraditionalautomakersTotal(Traditional+EV)Thisyearwestartwiththefourbigobstaclestofasterdeepdecarbonization:slowpenetrationofEVs,requiredupgradestotransmissioninfrastructure,geologiccarbonsequestrationandelectrificationofindustrialenergyuse.Theoverarchingmessageofthispaperisnotclimatenihilism;it’sthatthebehavioral,politicalandstructuralchangesrequiredfordeepdecarbonizationarestillgrosslyunderestimated.Ifso,thecompaniesweallrelyonfordispatchable,thermalpowerandenergywillneedtosurviveandprosperuntilwegetthere.MichaelCembalestJPMorganAssetManagement6Thefirstthree:[i]masteryoffire;[ii]ashiftfromforagingtoagricultureanddomesticatedanimalsand[iii]ashiftfrombiomassandhuman/animallabortocombustionoffossilfuelsandtomechanicalprimemovers.8TableofContents[1]Electricvehicles,WillFerrell,Norwayandtherestoftheworld......................................................................10ForgetaboutNorway:howistheEVrevolutiongoingeverywhereelse?ThelatestonEVpenetration,vehiclereplacementcycles,ICEcarbreak-evenmileageandwhyhybridsdon’tcount(asmuch)[2]TransmissionDreams....................................................................................................................................15MITandPrincetonhavelaidoutgrandscaledeepdecarbonizationideasthatacknowledgetheneedformassiveelectricitygridexpansion[3]…andTransmissionRealities..........................................................................................................................18Gridexpansioncanbeahornet'snestofcost,complexityandNIMBYism,particularlyintheUS[4]TheSongRemainstheSame:geologicsequestrationofcarbonmayfacethesteepestclimbofall..................22Thehighestratiointhehistoryofscience:CCSacademicpublicationsvsreal-lifeCCSimplementation[5]Decarbonizationoftheindustrialsector:costs,challengesandlimitations.....................................................24Evenassuminggreaterrenewableelectricity,onlysomeindustrialprocessescanbeeasilyelectrified[6]Oilandgasupdate:ourbullishcallonthesector,oneyearlater....................................................................27Asthesectorrefocusesonprofitability,valuationsarerisingandhavemoretogo[7]Biden’senergyagenda:howmuchoilandgaswilltheUSneedinthefuture?................................................30Theenergymathongriddecarbonization,Federallandproductionbans,EVincentivesandmileagetargets[8]China’srareearthmetaldiplomacyrevvingupagain.....................................................................................34Chinasaber-rattlingonrareearthmetalexportsisleadingothercountriestodeveloptheirown[9]China:hownewlawsonresidentialheatingsystemsactuallyleadtogreaterGHGemissions.........................35Replacingcoal-firedresidentialheatingwithelectricheaterssolvesoneproblem,causesanother[10]USsolarpower:distributedsmall-scalegenerationisgrowing,butcustomersfaceheadwinds.....................36ManyutilitiesnolongerpaysolarcustomersataretailrateforelectricityexportedtothegridEpilogue:LastwordsontheTexaspoweroutageandwhyIwritethispaper.......................................................37“Whatabout…”:Answerstoclientenergyquestions...........................................................................................39Q&Aonelectrifiedshipping,sustainableaviationfuels,lowenergynuclearpower,SaudiArabia'sgreenhydrogenplantandtheunintendedconsequencesofMSCI'scarbonaccountingmethodology9AcknowledgementsandaquicknoteonourprocessOurenergypaperisoverseenbyVaclavSmil,DistinguishedProfessorEmeritusintheFacultyofEnvironmentattheUniversityofManitobaandaFellowoftheRoyalSocietyofCanada.Hisinter-disciplinaryresearchincludesstudiesofenergysystems(resources,conversionsandimpact),environmentalchange(particularlyglobalbiogeochemicalcycles),andthehistoryoftechnicaladvancesandinteractionsamongenergy,environment,food,economy,andpopulation.Heistheauthorofmorethan40books(thelatesttwo,GrandTransitions:HowtheModernWorldWasMadeandNumbersDon’tLiewerepublishedlastyear)andmorethan400papersonenergysubjectsandhaslecturedinNorthAmerica,Europe,andAsia.In2015,hereceivedtheOPECawardforresearch,in2019AmericanEnergySocietynamedhimEnergyWriteroftheYear,andheisdescribedbyBillGatesashisfavoriteauthor.VaclavandIagreedupfrontthatwewouldcoverenergysourceswhichreach,attheminimum,earlystagesofcommercialization.Manyideasworkonpaperorinsmall-scalelabsettingsbutarenotwidelycommercializedandthushavenorealworldimpact,eitherforcostoroperationalreasons.Examplesincludeadvancedbiofuelslikecellulosicethanol,lowenergynuclearreactions,quantumglassbatteries,undergroundthermalenergystorage,geoengineering(solarradiationmanagement),oceanthermalenergyconversion,liquidfuelsfromgeneticallymodifiedalgaeandelectricitygeneratedfromthecoldnessoftheuniverse.Linkstotopicsfrompriorpapers,whichyoucanaccesshere•Theenvironmentalimpactofrenewableenergy(2020)•Costdeclinesrequiredtomakethehydrogeneconomyareality(2020)•Measuringclimatebenefitsofreforestation(2020)•Howmuchenergyisstored,andhow?(2020)•Thewaterintensityofhydraulicfracking(2020)•Geothermalupdate:presentandfuture(2020)•GermanyandEnergiewende:Adispassionateassessment(2019)•Wildfires:anthropogenicclimatechangeandrisksforutilitiesinfire-proneareas(2019)•Highvoltagedirectcurrentlines:Chinaleads,USlags(2018)•TheDreamTeamrebuttaloftheJacobson“100%renewableelectricityby2050”plan(2018)•Bettersafethansorry:sealevelrise,coastalexposureandfloodmitigation(2018)•Hydraulicfracturing:thelatestfromtheEPAandsomeconflictingviewsfromitsAdvisoryBoard(2017)•Forestbiomass:notasgreenasyoumightthink(2017)•Themythofcarbon-freecollegecampuses(2017)•UShydropower:howmuchpotentialforexpansion?(2016)•Nuclearpower:skyrocketingcostsinthedevelopedworld(2014and2015)AcronymsBEVbatteryelectricvehicle;BTUBritishthermalunit;CCGTcombinedcyclegasturbine;CCScarboncaptureandstorage;CH4methane;DACCdirectaircarboncapture;E&Pexplorationandproduction;EIAEnergyInformationAgency;EPAEnvironmentalProtectionAgency;ERCOTElectricReliabilityCouncilOfTexas;EROIEnergyreturnoninvestment;EVelectricvehicle;FERCFederalEnergyRegulatoryCommission;GHGgreenhousegas;GWgigawatt;HVDChighvoltagedirectcurrent;ICEinternalcombustionengine;IEAInternationalEnergyAgency;IRENAInternationalRenewableEnergyAgency;kgkilogram;kmkilometer;kVkilovolt;kWhkilowatthour;LBNLLawrenceBerkeleyNationalLaboratory;LENRlowenergynuclearreactions;LMPlocationalmarginalpricing;LNGliquidnaturalgas;m3cubicmeter;MJmegajoule;MMTmillionmetrictonnes;mpgmilespergallon;Mtoemilliontonsofoilequivalent;MWhmegawatthour;NaOHsodiumhydroxide;NGLnaturalgasliquid;NIMBYnotinmybackyard;NOAANationalOceanicandAtmosphericAdministration;NOxnitrogenoxides;NRELNationalRenewableEnergyLab;OECDOrganisationforEconomicCo-operationandDevelopment;OPECOrganizationofthePetroleumExportingCountries;PHEVplug-inelectricvehicle;REErareearthelement;RNGrenewablenaturalgas;SUVsportutilityvehicle;TWhterawatthour;USGSUSGeologicalSurvey;Whwatthour.10[1]Electricvehicles,WillFerrell,NorwayandtherestoftheworldPassengercarsandlightvehiclesaccountfor40%-50%ofglobaltransportenergyuse.Othercategoriescouldbeelectrified(buses,heavytrucks)whilesomearemoredifficult(shipping,seep.39).AfasterEVrevolutionintheUScouldhavealargeclimatebenefitsincetheUSaccountsfor25%ofglobaltransportenergyconsumptionandsincelightvehiclesrepresent60%ofthisamount,bothfiguresbeingthehighestintheworld.Light-dutyvehicleAirBusOtherHeavytruckMarineOthertruckRail0102030405060PassengerFreightSource:EnergyInformationAdministration.2016.WorldtransportationenergyconsumptionbymodeQuadrillionBTUsAustralia/NewZealandSouthKoreaRussiaIndiaChinaOECDEuropeUS2%2%3%3%12%18%25%0%20%40%60%80%100%PassengervehicleRoadfreightvehicleAirMarineRailTransportationenergyconsumptionbyregionandmode%ofworldtransportationenergyconsumptionSource:EnergyInformationAdministration.2016.%ofregiontotalbymode(2012)IenjoyedtheWillFerrellcommercialforGMduringtheSuperBowlwhichstatedthatNorwayis“eatingourlunch”onEVs.Asshownbelow,theysureare:NorwayEVsaleswere60%ofallvehiclesaleslastyearcomparedto2%intheUS.ButthereareafewthingsaboutNorwaythatareimportanttounderstand:•Norwayhas5millionpeopleandapopulationdensitythatis5%-15%ofmostotherEuropeannations•97%ofNorway’selectricitycomesfromhydropower;itselectricitypricesare40%-70%ofEuropeanlevels•InNorway,EVsareexemptfromVATtaxesandreceivea50%discountontollroadsandparkingfeeswhileICEcarsaresubjecttoa25%VAT,aCO2tax,anNOxtaxandaweighttax.Asaresult,NorwegianICEcarsaremoreexpensivetobuyand75%moreexpensivetooperate•AfullconversiontoEVswouldputitsEVsubsidiesatthesecondlargestgov’texpenditurebehindpensionsSo,let’sdispensewithNorwayasaparadigmfortheworld’shighdensity,car-lovingcountriesandseehowtheEVrevolutionisgoingelsewhere.OtherthaninafewsmallNorthernEuropeancountries,EVsalesasashareofvehiclesalesarestillmostlylessthan10%7.Globally,theEVsharein2020was4.5%,upfrom~2.5%in2018and2019.NotehowthiscomparestoIEAscenariosof20%-40%EVsharesintheyear2030.NorwayIcelandSwedenNetherlandsFinlandDenmarkSwitzerlandGermanyHongKongPortugalBelgiumFranceUnitedKingdomAustriaChinaSpainItalySouthKoreaCanadaNewZealandUnitedStates0%10%20%30%40%50%60%70%80%90%100%FossilfuelsNuclearHydroandGeoWindandsolar2020EVshareofsalesEVshareof2020salesvselectricitygenerationmixSource:IRENA,EIA,EVVolumes,JPMAM.2020.IEAStatedPoliciesScenarioIEASustainableDevelopmentScenario0%10%20%30%40%50%20182019202020302030GlobalEVshareoflightvehiclesalesBEVandPHEVsalesas%oflightvehiclesalesSource:EVVolumes,IEA,JPMAM.2020.7Lightvehiclesales>500kunitsandEVshares<2%:JPN,INDIA,BRA,RUS,MEX,AUSTRA,TUR,THAandMAL.11EVanalysesaredefinedbythescopeofwhatanEVisassumedtobe.Ourdefinitionincludesbatteryelectricvehicles(BEV)andplug-inhybridelectricvehicles(PHEV)sincetheprimemoverinbothcasesistheelectricmotor,eventhoughsomePHEVshavelargebackupfueltanksaswell.Wedonotincludehybridelectricvehicles(HEV)sinceitsprimarymoverisusuallyaninternalcombustionengine(thisdependsonthelengthofaveragetripsandotherdrivingbehaviors).Weincludelighttrucksandnotjustpassengercarssincetheformeris75%(!!!)ofallvehiclesalesintheUS.ThenextchartillustratesbatterycapacitybyEVtypeandisanotherindicationofwhyweonlyincludeBEVsandPHEVsinourEVanalysis,andnothybrids.TeslaModelXTeslaModelSAudie-tronPorscheTaycanTurboJaguarI-PACEPorscheTaycan4SPolestar2TeslaModelYChevroletBoltHyundaiKonaTeslaModel3BMWi3/i3sNissanLEAFHyundaiIoniqVWE-GolfMiniCooperElectricFiat500eChevyVoltPorscheCayennePorschePanameraChryslerPacificaBMW330eBMWi8MiniCooperSEHyundaiSonataKiaOptimaPHEVBMWX5xdrive40eVolvoXC90T8MercedesGLE550eFordFusionEnergiToyotaPriusPrimeAudiA3E-TronMercedesS550eFordC-MaxEnergiMercedesC350eToyotaCamryHybridKiaOptimaHybridToyotaPriusHybridHondaInsightHybridBuickRegalw/eAssistDodgeRam1500eTorqueBMWActiveHybrid7020406080100120Batteryelectricvehicle(BEV)Plug-inhybrid(PHEV)Hybrid(HEV)Mildhybrid(MHEV)ElectricvehiclebatterycapacitybytypeKilowatthour,sortedindescendingorderbycapacitySource:CarandDriver,AutomotiveWorld,vehiclemanufacturers.February2021.Tobeclear,hybridvehiclescanmakesubstantialcontributionstofueleconomy;the2021ToyotaPriusisEPAratedatupto58mpgincitydriving.Buttheworldenvisionedindeepdecarbonizationplansinvolveslargefleetsofelectricvehiclespoweredbygreenelectricity8,inwhichcaseourEVdefinitionisabettermeasureofhowthetransitionisgoing.Answer:inmostplaceswithalotofpeople,graduallysofar.Therehasbeenanenormousdeclineinbatterycostsoverthelastdecade,whichinprincipleshouldboostthepaceofEVsales.SomeanalystsprojectEVcostparityby2023.$10$100$1,000$10,000101,000100,00010,000,000LithiumionbatterylearningcurveBatterycost$perkWhCumulativebatteryMWhproducedSource:ARKInvestmentManagement.2021.TeslaModelXPorscheTaycanTeslaModelSAudie-tronTeslaModelYTeslaModel3ChevyBoltNissanLeafGMCSierra1500Ram1500FordF-150ChevroletSilverado1500ToyotaRAV4ToyotaCamryHondaCR-VChevroletEquinoxToyotaCamryHybridToyotaCorollaHybridHondaInsight$0$10$20$30$40$50$60$70$80$90$100ElectricvehiclesTraditionalvehiclesHybridsTop-sellingEV,traditionalvehicle&hybridvehicleprices$,thousands,manufacturersuggestedretailpriceSource:Edmunds,CarandDriver,CleanTechnica.2021.Excludessubsidies.8Gridexpansionrequired:40%EVpenetrationwouldincreaseelectricityconsumptionby440TWhcomparedtocurrentgenerationof4,400TWh(a10%increase),andbymoreinthefuturedependingonthegrowthrateofthetotalvehiclestock.Loadmanagementinvestmentswouldbeneededtopreventsurgesindemandthatcouldoverwhelmtransmissionnetworks.Householdsgenerallyconsume1-2kWhperhourwhileaLevel2EVchargercanconsume8-9kWhperhour.12Nowthatbatterycostshavefallen,manycountriesandcarcompanieshavemadecommitmentstorapidlyrampupEVpenetrationandproductionintheyearsahead.We’llsee;IthinkitmakesmoresensetotrackhowquicklyEVsareactuallysellingandactualCO2emissionsfromthetransportationsectorratherthantrackingnon-bindingfuturemilestones9.TherearefourkeythingstounderstandabouttheEVrevolution:[i]thegoodnews:inmostpartsoftheworld,EVsentailGHGbenefitspermilevsinternalcombustionengine(ICE)carsirrespectiveofthefuelcompositionoftheelectricitygrid;but…[ii]thelifecycleoftoday’slightvehiclesisgettinglongerwhichdelaysvehiclereplacement[iii]EVsstillcostmorethancomparableICEvehicleswhenlookingatthehighestsellingcars/trucksintheUS[iv]someresearchindicatesbehavioralissueswhichmayreduceassumedGHGbenefitsfromtheEVtransitionLet’stakeacloserlook.[i]EVGHGbenefitspermilegenerallyexistirrespectiveofthefuelcompositionofthegridThroughoutmostoftheUSandEurope(butnotnecessarilyChina),EVsentailpositiveGHGbenefitspermilevsmostICEcars.Howcanwetell?TheUnionforConcernedScientistsestimates“break-even”mileagebyUSregion,whichisthemileageyourICEcarmustachievetoproducethesameemissionsastheaverageEV10.Seetheblueandgolddotsinthechart:fromCaliforniaatthetopoftherangetotheMidwestatthebottom,themileageofalltopsellingUScarsandlighttrucksarewaybelowthesebreak-evenlevels.Theonlyoverlapisthegreydots:ToyotaandHyundaihybridsincoal-andgas-dependentregions.AsmorerenewablesareaddedtothegridandifEVfuelefficiencyimproves,thesebreak-evenfiguresmayrise.However,ICEmileagecouldimproveaswell,suchasMazda’sSkyActiv-Xenginewhichmayimprovefueleconomyby20%-30%.CaliforniaFloridaNYCLongIslandNYTexasNorthwestIllinoisRockiesVirginia/CarolinaNewEnglandMidwestSoutheastPenn./Delaware1234567891011122030405060708090100110120130HowefficientdoesyourICEcarneedtobeforitsemissionstobethesameasanEV?MilespergallonSource:UnionofConcernedScientists,USDepartmentofEnergy.2021.ICE=internalcombustionengineNote:Milespergallon=combinedcity/highwaymileageTopsellingcarsandlighttrucksintheUSsortedbymilespergallon:1.Ram15002.FordF-1503.ChevroletSilverado4.ToyotaRAV45.HondaCR-V6.ChevroletEquinoxHighestmileagecars:7.HondaInsight8.ToyotaCamryHybrid9.ToyotaCorollaHybrid10.HyundaiElantraHybrid11.ToyotaPriusEco12.HyundaiIoniqBlueICEcarmpgatwhichemissions=averageEVemissionsmpgoftopsellingUScarsandlighttrucksmpgofhighestmileagecars9Example:JapanhadaverylowshareofEVsin2020atjust0.7%ofvehiclesales.TheJapanesegovernmentplanstophaseoutICEcarsinthemid2030’satwhichpointallcarsmustbehybridorfullyelectric.That’sanaggressivetimetablecomparedtocurrentproduction.10UCSanalyzedemissionsfromfuelinganddrivingbothtypesofvehicles.ForICEcars:emissionsfromextractingcrudeoil,movingoiltorefineries,gasolinerefining,gasolinedistributionandtailpipeemissions.ForEVs:powerplantemissionsandemissionsfromproductionofcoal,naturalgasandotherfuels.13[ii]LongervehiclelivesdelaytheEVrevolutionMycollegeroommateboughtanewFordMustangin1983.Itwasanotaverygoodcar;itwasintheshopalot,andonedayIrecallsomeonealmostpunchingaholethroughthedoor.Sincethenthequalityofdomesticandimportedcarshasimproved,leadingtolongerusefullives.Theaverageageoflightvehiclesinoperationhasdoubledsince1972.That’sgreatforproductivityandhouseholdwealthbuthastheunintendedconsequenceofdelayingpenetrationofnewtechnologieslikeEVs.MisunderstandingofthisdynamicmaypartiallyexplainwhysomanyprojectionsoftheUSEVshareofsalesin2020madetenyearsagowerewrong(DeutscheBank11%,PwC10%,BNEF9%,RolandBerger7%,BCG5%vsactual2020USlevelsof2%).Thechartontherightshowsaproxyforthevehiclereplacementcycleinyears(i.e.,dividethestockofcarsbyannualsales,andthat’sthenumberofyearsitcouldtakefortheentirestocktobeelectrifiedifEVswere100%ofnewvehiclesales).EVpenetrationasa%ofthestockdependsonprojectionsoftheannualEVshareoftotalsales,thegrowthrateinoverallvehiclesalesandvehiclescrappagerates.BloombergNewEnergyFinance(BNEF)nowprojects30%USEVpenetrationby2037,andIthinktheywillbetoohighagain.67891011121972197719821987199219972002200720122017AverageageofUSlightvehiclesinoperationYearsSource:USBureauofTransportationStatistics,IHSMarkit.2020.NewZealandFinlandPortugalItalySpainNetherlandsIcelandSwitzerlandNorwayUSAHongKongUnitedKingdomFranceAustriaSwedenSouthKoreaGermanyCanadaDenmarkChinaBelgium0510152025303540VehiclereplacementcycleinyearsTotallightvehicleregistrationsdividedbylightvehiclesalesSource:EuropeanAutomobileManufacturersAssociation,countrydepartmentsoftransportation,EVVolumes.2019.[iii]WhenconsideringthekindofcarsandlighttrucksUSbuyersprefer,theEVpricegapisstilllargeInsomeresearchwe’veseen,analystscomparethepriceofaToyotaCamrytoanEVliketheChevyBoltorNissanLeaftoillustratethedecliningpricegapbetweenEVsandICEcars.However,asmentionedearlier,SUVsandotherlighttrucksaccountfor75%ofUSlightvehiclesales.Asaresult,theBoltandLeafarenotreallyproductsubstitutesforpeoplebuyinglighttrucksandSUVs.Thetableshowswhatweseeasmorerelevantcomparisons.Thepricegaps(measuredindollarsand%terms)arelargerthanCamry-Boltcomparisons,andtherangedifferentialsinmilesareoftenlargeraswell.LearningcurvesmaydriveallEVcostsdownfurther,butweconsiderthemostrelevantICE-EVpricegapstobelargerthantheonesoftenreported.Electricvehicle:ChevyBoltFordF150EVChevySilveradoEVDodgeRamEVSUVEVCompositeSUVEVCompositeICEvehicle:ToyotaCamryFordF150ChevySilveradoDodgeRamToyotaRAV4HondaCRVEVprice($,thousands)$32.0$70.0$50.0$70.0$44.8$44.8ICEprice($,thousands)$26.0$30.6$29.0$30.5$27.4$26.5Pricegap($,thousands)$6.0$39.4$21.0$39.5$17.4$18.3Pricegap(%)23%129%72%130%64%69%ICErange-EVrange(miles)193320208268155134ICEunitssold(2020)294,000787,000593,000564,000430,000324,000Sources:CarandDriver,JPMAM.2021.EVandICEmodelcostsbasedonentrylevelvehicles.ICEmileagefromDepartmentofEnergy.SUVEVcompositebasedonaverageofVolkswagenID4,HyundaiKonaEVandVolvoXC40Recharge.Note:theIEAconcludedthatby2040,theglobalascentofSUVshasthepotentialtooffsetcarbonsavingsfrommorethan100millionEVs14[iv]ResearchpointstobehavioralissueswhichmayreduceGHGbenefitsfromtheEVtransitionTrackingactualCO2emissionsfromthetransportsectorwillbethebestwayofmeasuringthecontributionofEVstoclimatemitigation.•WillEVsreplaceICEcarsorsupplementthem?InNorway,subsidiespromotednewEVpurchasesbuttwo-thirdsoffamiliessupplementedtheirICEcarsinsteadofreplacingthem,with60%ofdrivingmilesbytwo-carfamiliesviatheirICEcarsvs40%fromtheirEVs11.OtheranalysesonNorwayfoundthatEVsubsidiesresultedinasharpreductioninpublictransitandbicycleusecomparedtopeopleowningICEcars•WhatkindofcarswouldmostEVbuyershaveboughtinstead?AstudyfromUCDavisfoundthatmanyEVbuyerswouldhaveboughthighermileagecarsinstead,whichcouldmeanthattheemissionssavingsfromEVtransitionscouldbeoverstatedbyasmuchas50%12•WhydoEVownerstendtodrivetheircarsformuchfewermilesperyearthanICEcars?Whethertheanswerisrangeanxietyortheirstatusasasecondcarratherthanareplacement,theimplicationsarenotpositiveforEVadoptiontrendsandGHGbenefits.UniversityofChicagoresearchersextrapolatedmilesdrivenbymonitoringtheirelectricitybillsbeforeandafterpurchase.AdoptinganEVincreasedhouseholdelectricityconsumptionby2.9kWhperday.Aftercorrectingforout-of-homecharging,thistranslatedtoapproximately5,300milestraveledperyearbyEVowners,whichisunderhalfoftheUSfleetaverage13PullingitalltogetherBiden’spolicies(seeSection7)maysubstantiallyincreaseUSEVpenetration.Butasthingsstandnow,theUShasthehighestshareofglobaltransportenergyconsumption,thehighestvehicleshareoftransportenergy,thehighestnumberofvehiclespercapita,thelongestdistancedrivenpercapita,thelowestpublictransitusage,thelowestgasolinepricesANDalmostthelowestEVpenetrationaswell.NowonderWillFerrellissomad.EVshareoflightvehiclesalesAvggasolineprice%incomespentongasolineCarsper1,000peopleVehiclekmpercapitaBikingfrequencyPublictransitusageRoadfuelconsum.percapitaAustralia1%3.781.5374110,8000.0227580Canada3%4.062.926678,5000.0323886Denmark14%7.020.955086,3000.25–244France9%6.560.595906,2500.0428106Germany13%6.161.096107,0000.1333222Italy4%6.810.997076,2500.12–158Japan1%5.021.387184,0000.1631329Netherlands22%7.191.175436,1500.25–242Norway62%7.350.537546,5000.16–213Sweden30%6.471.235427,0000.1632302UK9%5.991.085446,2500.0437220UnitedStates2%3.052.1687514,0000.02121,106Source:CaliforniaStateUniversity,EVVolumes.2020.11StatisticsNorway,August15201912“CorrectingEstimatesofElectricVehicleEmissionsAbatement:ImplicationsforClimatePolicy”,MuehleggerandRapson(UCDavis,NBER),January202113“LowEnergy:EstimatingElectricVehicleElectricityUse”,Burligetal.(UniversityofChicago),February202115[2]TransmissionDreamsMostdeepdecarbonizationplansacknowledgetheneedformassivetransmissiongridupdates.Inthissection,welookattworecentones:anMITstudyonelectricityoptimizationbetweenCanadaandNewEngland,andaPrincetonanalysisaimingforfulldecarbonizationby2050.MIT:ElectricityoptimizationinNewEngland14Thegoal:decarbonizeNewEnglandelectricityandexaminebenefitsofnewtransmissiontoallowgreatertradeofCanadahydropowerandNewEnglandwind/solarpower.Thefirstchartshowsthecapacitymixrequiredfor80%decarbonizationofNewEnglandelectricityby2050.Nowlet’slookatgeneration.Thechartbelow(left)showsmodeledNewEnglandelectricitygenerationfora2-weekperiodinOctober2050resultingfromthenewcapacitymix.There’ssomebilateraltradeofhydro,windandsolarusing2.2GWofexistingcross-bordertransmissioncapacity(red&greensegments),butit’sprettysmall.NewEnglandCO2emissionswouldfallfrom27.5millionmetrictons(MMT)peryeartodayto6.7MMTperyearin2050.0510152025303540455020192050w/80%decarbonization2050w/80%decarbonization&4GWtransmissionOtherSolarWindHydroNuclearCoalPetroleumNaturalGasNewEnglandcapacitymixbyenergysourceGigawattsSource:EIA,EmilDimanchev,MITCenterforEnergyandEnvironmentalPolicyResearch.February2020.Nowlet’saddsomemoretransmission.Thechartontherightassumes4GWinnewtransmissionlineswhichwouldallowNewEnglandtodoubleitselectricityimports/exports.MITestimatesthatthefinancialcostofbuildingnewtransmissionwouldbeoffsetbylowercostCanadianhydropower,andthatNewEnglandCO2emissionswouldfallfrom6.7MMTperyeartojust2.0MMTperyear.So:itlookslikethere’sapositivecost/benefitfromalotmoretransmissioninthisdecarbonizedsystem.Soundsgreatonpaper,untiltheNewHampshiresitingcommitteegetsinvolved…whichwediscussinthenextsecetion.-10-5051015202510/110/210/310/410/510/610/710/810/910/1010/1110/1210/1310/1410/15CurtailmentIMPORTSCCGTCCSPumpedHydroHydroSolarOffshoreWindOnshoreWindNewCCGTExistingCCGTExistingNuclearStorageChargingEXPORTSModeledhourlyNewEnglandgenerationusing2050capacitymixGigawatthoursSource:"Two-WayTradeinGreenElectrons:DeepDecarbonizationoftheNortheasternUSandtheRoleofCanadianHydropower."EmilDimanchevetal.,MIT.February2020.-10-5051015202510/110/210/310/410/510/610/710/810/910/1010/1110/1210/1310/1410/15ModeledhourlyNewEnglandgenerationusing2050capacitymix+4gigawattsofnewtransmission,Gigawatthours14“Two-WayTradeinGreenElectrons:DeepDecarbonizationoftheNortheasternUSandtheRoleofCanadianHydropower”,Dimanchevetal,MITCenterforEnergyandEnvironmentalPolicyResearch,February2020.16ThePrincetonpaperproposesNetZeroprimaryenergyby205015(i.e.,notjustdecarbonizationofelectricity,butdecarbonizationofeverything).Asillustratedinthefirstchartbelow,thistransformativeproposalincludesa14xbuildoutofwindandsolarcapacityanda3x-5xbuildoutoftransmissioncapacity16.ConsiderthepaceofPrinceton’stransmissionexpansionrelativetohistory.Thebasecase$76billionperyearcostofthisproposalisthreetimeshigherthanprevailingspendingontransmissioninfrastructure(secondchart).Furthermore,somecurrentinvestmentisreplacingoldtransmissioninfrastructureratherthanaddingnewcapacity.Thethirdchartisquitethehockeystick:from2004to2020,UStransmissiongridmilesonlygrewby1.2%peryearandwouldhavetoaccelerateto3.9%-5.7%(theseareverybigdifferenceswhencompoundedoverdecades).Finally,lookinthefourthchartatwherethisnewcapacitywouldneedtobebuilt:Texas,butalsoCaliforniaandtheNortheast,regionswithNIMBYandotherobstaclestodevelopment.Asaresult,anyanalysisofTransmissionDreamsalsohastoconfrontTransmissionRealities…whichweaddressnext.Current(2020)Basecase(2030)Basecase(2040)Basecase(2050)Landconstrainedcase(2050)Renewablecase(2050)0.00.20.40.60.81.01.21.41.61.80123456PrincetonNetZeroplanTransmissionlines>345kilovolts,milliongigawatt-kilometersSource:"NetZeroAmerica",Larsonetal.,Princeton.2020.Windandsolarcapacityinstalled(terawatts)Basecase:netzero,fossilfuelCO2emissionsoffsetbyCCSRenewablecase:netzero,nofossilfuels,noCCS20142015201620172018201920202020-2050projected$0$10$20$30$40$50$60$70$80$90HistoricalandprojectedtransmissioninvestmentUS$peryear,billionsSource:EdisonElectricInstitute,"NetZeroAmerica",Larsonetal.,Princeton.2020.PrincetonbasecaseannualtransmissioninvestmentBasecase(2030)Basecase(2040)Basecase(2050)2020Basecase:noCCS(2050)01002003004005006007008009001,0001,1001,20019781988199820082018202820382048PrincetonNetZeroHistoricalUStransmissioninfrastructureThousandsofgigawatt-milesSource:DOE,UTAustin,"NetZeroAmerica",Larsonetal.,Princeton.2020.Dept.ofEnergyUTAustinMontanaMaineNebraskaMissouriNewMexicoMassachusettsNewYorkNewJerseyCaliforniaTexas$0$20$40$60$80$100$120$140$160BulktransmissionSolarconnectionsOnshorewindconnectionsOffshorewindconnectionsPrincetonplantransmissionrequiredbystateToptenstatessortedbyrequiredinvestmentfrom2020-2050Source:"NetZeroAmerica",Larsonetal.,Princeton.2020.2018US$,billions15Larson,Greig,Jenkins,Mayfield,Pascale,Zhang,Drossman,Williams,Pacala,Socolow,Baik,Birdsey,Duke,Jones,Haley,Leslie,PaustianandSwan,“Net-ZeroAmerica:PotentialPathways,Infrastructure,andImpacts”,interimreport,PrincetonUniversity,December15,2020.16OtherNetZeroproposalshavelowertransmissiontargetsfor2050thanPrincetonbuttheyarestillenormousrelativetotoday’sgrid.ExamplesincludetheZeroCarbonConsortiumDeepDecarbonizationPathwaysProjectandtheCarbonNeutralPathwaysProjectfromJamesWilliamsattheUniversityofSanFrancisco.Bothentailtransmissionbuildoutsthatare65%-80%ofPrincetonlevels.17AbriefcommentonthepaceofwindandsolarexpansionassumedinthePrincetonpaperTheprimarypurposeofSections2and3istoexaminenewtransmissionrequiredindeeplydecarbonizedsystems.Thatsaid,it’salsoworthexaminingthegenerationexpansioninthePrincetonreport.Thechartbelowshowsgenerationcapacityadditionsmeasuredaswattspercapitaperyear,highlightingpeaksbyfueltype.ThechallengewiththePrincetonplanisnotjustitslevelbutitsconsistency:whilepeakcapacityadditionsintheUSwere2/3ofthe300wattfigureinthePrincetonplan,theywereonlysustainedforacoupleofyears.ThePrincetonplanrequires300wattseveryyearfor30years.Itremainstobeseeniftheclimatethreat(seebottomchartonwarmingoceans)translatesintosupportforthismagnitudeofcapacityexpansion.Foranyonethinkingthatenergyefficiencieswillreduceelectricitydemand,remembertheparableoftheairlineindustry:despitea75%declineinjetaircraftfuelconsumptionperkilometersince1960,aircraftfuelconsumptionandrelatedCO2emissionsquadrupledasdecliningticketpricesledtoasurgeinaviation.Inotherwords,increasedusecanmorethanoffsetanyefficiencygains.0501001502002503003501960197019801990200020102020203020402050Historical(US)Historical(Germany)Historical(China)Source:"NetZeroAmerica"(Princetonstudy),AmericanPublicPowerAssociation,EIA,ChinaElectricityCouncil,FraunhoferISE,Clacketal.(pre-2014data).2020.Historicalratesofinstalledelectric-generatingcapacitypercapitaCapacityadditions,wattsperyearpercapitaCoalandnuclearpeak2ndnuclearpeakNaturalgaspeakGermanysolarPVpeakGermanywindpeakPrincetonNetZeroby2050basecasewindandsolarcapacityadditions-150-100-500501001502002501958196419691974197919841989199419992004200920142019Source:Cheng,L.etal.,AdvancesinAtmosphericSciences;DahlmanandLindsey,NationalOceanicandAtmosphericAdministration.February2020.WarmingoceansZettajoulesOceanheatcontentchangeinupper2000mvs1981-2010baseline(Cheng)Oceanheatcontentchangeinupper700mvs1955-2006baseline(NOAA)0.00.20.40.60.81.01.2194019501960197019801990200020102020GlobalcarbondioxideemissionsfromaviationBilliontonnesofCO2emissionsSource:OurWorldinData.2018.18[3]…andTransmissionRealitiesWhileMITandPrincetonassumerapidgrowthintransmissioninfrastructure,actualdevelopmentcanbeahornet’snestofsitingchallengesandlegalcostsevenwhenprojectsareeventuallybuiltafteryearsofplanning.Let’sstartwithHydroQuebec’splantosellhydropowertotheUS.NewYorksharesaborderwithCanadaandisplanninga1.3GWtransmissionlinefromtheQuebec-NYbordertoNYC,buriedunderLakeChamplainandtheHudsonRiver.SameforMinnesota,whichincreaseditsimportsofhydropowerfromManitobaviaanew500kVtransmissionlinecompletedin2020.However,astatelikeMassachusettshasnosuchluck.TakeNorthernPass,a1.1GWtransmissionprojecttobringhydropowerfromQuebectotheNortheastthroughNewHampshire(80%viaexistingright-of-waysorundergroundlines).HydropowerthatdisplacesnaturalgashasclearclimatebenefitsgivenlifetimehydropowerCO2emissionsthatare5%ofnaturalgaslevels[IPCC].Assuming5%transmissionlossesand83%utilization17,NorthernPasscoulddeliver7.5TWhofhydropowertoNewEnglandandreduceemissionsby3.0millionmetrictonsofCO2everyyear.Thechartbelowonneighboringgenerationmixesmakesitclearwhycross-borderelectricitytradingcouldresultinmoreoptimaloutcomes.However,aNewHampshiresitingcommitteeblockedNorthernPass18,givingnewmeaningtoNewHampshire’sstatemotto“LiveFreeorDie”.NowMassachusettsistryingtoimportCanadianhydropowerthroughMaine(“NewEnglandCleanEnergyConnect”)buthasalreadyrunintoaninjunctionduetooppositionfromenvironmentalgroups.Asdescribedonp.15,MITbelievesthatthebestanswerforNewEnglandis4GWofnewtwo-waytransmissionlinesbetweenNewEnglandandQuebec.So,4newNorthernPassprojects?Goodluckwiththat.Offshorewindplannedforcompletionby2035inNewEnglandcouldeventuallyreplaceCanadianhydropowermultipletimesover,butthere’salongwaytogofromtoday’sdemonstrationprojects19.Notethepathoftheoffshorewindlearningcurvevsonshorewindatthelowerright.0%20%40%60%80%100%MassachusettsQuebecOtherHydroSolarWindBiomassNuclearNaturalgasElectricitygenerationbysource%oftotalSource:EIA,CanadaEnergyRegulator.2019.$10$100$1,00001101001,000Levelizedcostofenergy(LCOE)vsinstalledcapacityLCOE(2019US$/megawatthour)Source:NREL,Beiteretal.February2021.Totalinstalledcapacity(gigawatts)OnshorewindOffshorewind200820192019200219832008Windlearningcurves17“CostbenefitandlocaleconomicimpactofNorthernPasstransmissionproject”,LondonEconomics,201518TheDeathofNorthernPass.Theprojectwaskilledbythe“NewHampshireSiteEvaluationCommittee”.OurunderstandingisthatprimaryobjectionscamefromenvironmentalgroupsandalsofromNewHampshirepowergeneratorsconcernedaboutsurplusCanadianhydropowerputtingdownwardpressureonelectricitypriceswithintheNewEnglandISO.19Offshorewind.WhilethereareonlytwosmalloffshorewindpilotprojectsoperatingintheUSrightnow,EasternUSstateshavecommittedtobuild25-30GWby2035.ProjectsrequireapprovalfromtheBureauofOceanandEnergyManagement;theBidenadministrationwillreportedlyaccelerateapprovalsmorequicklynow.Around5.2GWareplannedforMAandCT;assuminga50%capacityfactor,offshorewindcouldgenerate23TWhperyearcomparedto7.5TWhfromNorthernPass.Currently,LBNLestimatesoffshorewindcostsat8to12centsperkWhcomparedtothemostproductiveonshorewindprojectsat3-4centsperkWh,andcomparedtoCanadianHydropowerat6centsperkWh.19WhataboutoutsidetheNortheast?We’vewrittenbeforeaboutthefateofCleanLine’sPlains&EasternprojectwhichaimedtoconnectOklahomawindandTennessee.WhileFederalcourtseventuallyoverrodeArkansaslandownerobjections,mountingcourtcostscrippledtheproject’sfinances.TheTennesseeValleyAuthoritydeclinedtosupportit(reportedlyattheurgingofTen.SenatorLamarAlexander),andtheTVAstuckwithitsmixofnuclear,gasandcoal.CleanLinesoldtheprojecttoNextEraEnergy,buttheywereunabletogetanywhereeither:ArkansasSenatorsCottonandBoozmanarguedtoTrumpEnergySecretaryPerrythattheObamaadministrationviolatedArkansaspropertyrightsinapprovingtheprojectinthefirstplace.Theprojectwasfinallyeuthanizedin2018,andCleanLineeventuallysoldorliquidateditsotherprojectsafteryearsofendlesscourtfightsatstateandcountylevels20.AnotherlegacyCleanLineprojectisontheropesaswell:theGrainBeltExpress,designedtobringwindpowerfromKansastotheEastCoastbyjoiningSPP,MISOandPJMgrids.InFebruary2021,theMissouriStateHousepassedabillbanningtheuseofeminentdomainforabove-groundutilityprojects;itsStateSenatewillreviewnext.Meanwhile,fivehundredMissourilandownersalongtheroutecontinuetheirfightagainsttheproject.Easementpaymentsof$150,000havebeenoffered(110%ofassessedlandvalue)andlandownerscancontinuetofarmorbuildontheeasements,butsofaronlyathirdoflandownershaveaccepted.Somedeveloperstakeadvantageofcorridorsusedforexistinginfrastructure.Siemensisworkingona350-mile2.1GWundergroundHVDCconnectionbetweenIowa’swindfarmsandChicago.Themajorityofthelinewillrunalongsidearailroadcorridorrightofway,whichshouldmakeiteasiertoobtainpermits,astrategyusedtoexpandhigh-speedinternetnetworks.Othergoodnews:theSouthernCrossprojectwilljoinERCOTwiththeSPPregion(OK,KS,NEandtheDakotas)andbeginsconstructionin2022.However,evenwhenprojectsareapproved,they’rebuiltatasnail’spacecomparedtodeepdecarbonizationrequirements.TheTransWestExpressproject,designedtobringwindpowerfromWyomingtoCalifornia,hasbeenindevelopmentsince2007despitebeingfast-trackedbytheObamaadministration,despitebeingonly15%reliantonprivatelands,anddespitehavingbeengrantedeminentdomainstatusbythe4statesittraverses.TransWestisprojectedtobegindeliveringpowerin2023.TransmissionchallengesinGermanywereaddressedthroughundergroundcablingandlegislation.Insomeplaces,buryingtransmissioncablesreducedresistancealthoughatalargeincreaseincost.Germanypassedan“accelerationlaw”in2019tostreamlineandsimplifytransmissionapprovalprocedures.AsofQ32020,Germanyhadcompleted20%ofplannedtransmissionbuild-outwithanother11%approvedforconstruction.Evenso,bottleneckshampertransmissionofitswindgeneration:GermanyisreportedlyexportingwindpowertoDenmarkandpayingDanishwindfarmsnottogeneratepower.ReportsciteDanishwindcurtailmentashighas6%asaresult21.Germanyintendstoshutdownitslastremainingnuclearplantsin2022whichwillamplifytheimportanceofcompletingNorth-Southtransmissionlinesforwind.Chinarelocated1.3millionpeopleduringtheconstructionoftheThreeGorgesDamandrelatedtransmissionnetworks.ChinadoesnotfacethesameconstraintsasWesterncountrieswithrespecttobuildingtransmissionlinesoverobjectionsfromlocalmunicipalities.Let’sjustleaveitatthat.20“AmbitiousCleanLineenergy:WrappingUp”,WindPowerMonthly,February2019.21“Germany’sMaxed-OutGridIsCausingTroubleAcrossEurope”,GreentechMedia,March31,2020.20Thetransmissionroadnottaken:Federaloverrideofstateobjections•Unlikenaturalgaspipelinesinthe1930’sandtheinterstatehighwaysysteminthe1950’s,thereisnobroadlegislationsupportingFederaleminentdomainforelectricitytransmissionprojects•Since2005,transmissionprojectscanqualifyas“nationalinterestelectrictransmissioncorridors”accordingtotheUSDoE,inwhichcaseFERCstatutesallowsuchprojectstoproceedevenifstatesdonotgrantapproval(Section1221oftheEnergyPolicyAct)•However,2010/2011CourtofAppealsjudgmentslimitedSection1221FERCbackstopsitingauthorityandprovokedastatebacklash.Nationalinterestelectricitycorridorshaven’tbeenusedsince•AformerNYUlawprofessornowattheDoEbelievesthatSection1222canbeusedinstead.WhileitsgeographicscopeexcludestheNortheastandFlorida,thisstatuteinvolvestheFederalgov’tparticipatingintheprojectitself,inwhichcaseithaspre-emptivesitingauthoritythatoverridesanystateobjections.AFederalDistrictcourtinArkansasupheldthisstatutein2017.We’rewatchingtoseeifit’susedmoreactivelybytheBidenadministrationWhataboutdistributedstorage?Distributedstoragecanmakesense(itcertainlywouldhavehelpedTexaslastFebruary),andcanbeapartialalternativetotransmissionupgradesinsomelocations.Storageideallymovespowerfromoff-peakperiodstopeakperiods,inwhichcasetransmissioncapacitydoesnotalwayshavetoequalpeakdemand.Butinadeeplydecarbonizedsystem,youstillneedalotoftransmissiontohandle10x-15xincreasesinwindandsolarcapacity.There’salsotheissueofcost.MITpublishedastudyonthevalueofstorageindeeplydecarbonizedsystems22.Theauthorsfoundthatstoragecandisplacetransmissioninvestmentatlowlevelsofstoragepenetration,butthatitsvalueisquicklyexhausted:oncestoragecapacityreached4%ofpeakdemand,furtherstorageinvestmentdidn’treducetransmissionrequirementsfurtherwhenassuminglithiumionbatterycostsof$320perkWhfor4hoursofstorage.Assumingfuturecostsof$150perkWhfor4hoursofstorage,cost-effectivestoragepenetrationrangedbetween4%and16%ofpeakdemand.Inotherwords,youstillneedalotofnewtransmissionindeeplydecarbonizedgrids.05001,0001,5002,0002,500Q12013Q12014Q12015Q12016Q12017Q12018Q12019Q12020Front-of-the-meterNon-residentialResidentialUSenergystoragedeploymentsMegawatthoursSource:WoodMackenzie,USEnergyStorageAssociation.Q42020.EnergystoragecomparisonsItcosts$15-$18perbarreltopurchaseanoilstoragetank.Tostoreanamountofelectricityequaltotheenergyinonebarrelofoil(1,700kWh),itwouldcost$510,000basedonthe$300perkWhcostoftheTeslaMegapack,softwarecostsincluded.22“Long-runsystemvalueofbatteryenergystorageinfuturegridswithincreasingwindandsolargeneration”,Mallapragadaetal,AppliedEnergy,July2020.21Whatcanhappenwhenthereisn’tenoughtransmissioninareaswithalotofrenewableenergy?Negativewholesaleelectricitypricing…andthejuryisoutonconsequencesforconsumersThemapshowsUSregionsaccordingtofrequencyof“negativemarginalpricing”.Inotherwords,thepercentageoftimepowerproducersarepaidbelowzerofortheirgeneration.Youmightthink,“whywouldapowerproducereveracceptnegativeprices??”Oneexample23:windoperatorsfloodingMidwesterngridsatthesametimesincethere’snotenoughinterstatetransmissiontoexportsurpluselectricitytootherplaces,andnotenoughdistributedstoragetosaveitforperiodsofhigherdemand.Asaresult,windoperatorsmightacceptnegativepricingof-$5perMWhsincewithoutit,theywouldnotcollecttaxcreditsworth$24perMWhthatareonlypayableiftheygenerateelectricity.CAISOERCOTMISOPJMNYISOISO-NESPPSource:RyanWiser,LawrenceBerkeleyNationalLaboratory.March2021.ATBEBGCYCZDKEEFIFRDEGRHUIEITLVLTNLPLPTROSKSIESSEBAUK0.050.100.150.200.250.300.350%10%20%30%40%50%60%70%Europeanhouseholdelectricitypricesvswindandsolarpenetration,EurosperkilowatthourSource:Eurostat,EMBER.2020.Electricitypricesincludealltaxesandlevies.Windandsolargenerationas%ofelectricitygenerationNegativewholesaleelectricitypricessoundlikeagoodthing,butarethey?Notnecessarily;negativepricesmeanthatatcertaintimesofday,there’ssomuchwind/solaroversupplyinthatlocationthatpricesdeclineuntilsomeproducers(wind,gas,solarornuclear)agreeforeconomicreasonstocutbackuntilgenerationequalsdemand.Laterthatday,therecouldbeasharpdeclineinwind/solargeneration,inwhichcaseotherformsofdispatchablepowerarestillneeded(that’swhathappensinCaliforniaforthosefamiliarwiththe“duckcurve”).Thatpowercouldcomefromnaturalgas;orfromutility-scalepumpedstorage,lithiumionbatteriesorfuelcells;orimportedfromotherregions.Eitherway,ithastocomefromsomeplace.Andiftherearetoomanyhoursoflowornegativepricesforthermalproducers,theymaystopaddingnewcapacitytothegrid,leavingitexposedtobrownoutsandinstability.Ultimately,thepriceofelectricityincorporatesthecostoftheecosystemneededtomeetdemand,includingperiodsofunanticipatedspikes,andincludingwhateverbackupthermalcapacity,storagecapacityandnewtransmissionareneededtoaccompanygrowingrenewables.That’sthereasonthatIdonotpaymuchattentionto“levelizedcostsofenergy”asestimatedbytheEIAandLazard,sincetheydonotincorporatetheentirecostimplicationsofhighlyrenewablegrids.Europeisfurtheralonginitsrenewabletransition,andhighersharesofwindandsolarareinmanycasesassociatedwithhigherelectricityprices(seechartaboveright).23Anotherreason:nuclearfacilitiescannotbeeasilyrampedupanddownduringtheday.Tobepresentonthegridwhenintradaypricesarehigh,nuclearoperatorsalsoparticipateduringperiodsofnegativeprices.22[4]TheSongRemainstheSame:geologicsequestrationofcarbonmayfacethesteepestclimbofallAfter20yearsofplanningandconjecture,bytheendof2020carboncaptureandstorage(CCS)facilitiesstoredjust0.1%ofglobalCO2emissions.Challengesincludecostoverruns,failureofbellwetherprojects(KemperMississippi),theUSDep’tofEnergywithdrawingsupportfordemonstrationprojects(FutureGen),cancellationsinEurope,legaluncertaintiesaboutliabilityanda20%-40%energydragrequiredtoperformCCSinthefirstplace.NorwegianAuthoritiesjustapprovedtheNorthernLightssequestrationprojectinvolvingTotal,EquinorandShellwhose2024capacitywillbejust0.0045%ofglobalemissions.Thehighestratiointhehistoryofscience:thenumberofacademicpaperswrittenonCCSdividedbyreal-lifeimplementationofit.02004006008001,0001,200196519751985199520052015AcademicpapersoncarboncaptureNumberofpaperspublishedperyearSource:PubMed.2020.PrincetonCCSproposalfortheUSBuildout=850milliontonnesofCO2storedperyearvia65,000milesofpipelineinfrastructureSupercriticalCO2storage=800kg/m3SupercriticalCO2storedperyear=1.1billionm3USannualoilproduction2019=746milliontonnesdistributedandrefinedacross190,000milesofpipelinesDensityofoil=1.15m3pertonneUSannualoilproduction=858millionm3Asaresult,I’mnotsurewhattomakeofthePrincetonstudy’ssequestrationassumptions.Theauthorsassumethat65,000milesofCO2pipelineinfrastructurewilldivert929milliontonnesofCO2eachyearfromcement,gas-poweredgeneration,naturalgasreformingandbiofuelproductionfacilitiestocentralizedlocationswheretheywillbemostlysequesteredunderground(asmallamountisassumedtobeconvertedintosyntheticfuels).ThiscomparestocurrentUSCCSinfrastructureof5,280milesand80milliontonnesperyear,mostlyusedforenhancedoilrecovery24.ThePrincetonCCSbuildout,justtosequesteranamountequalto15%ofcurrentUSGHGemissions,wouldrequireinfrastructurewhosethroughputvolumewouldbehigherthanthevolumeofoilflowingthroughUSdistributionandrefiningpipelines,asystemwhichhastakenover100yearstobuild(seebox).Princeton’sCCSprojectionsarenotthatdifferentfromtheonesfoundinpiecesfromMorganStanley,Goldmanandotherresearchhouses.WehadaconversationwithPeterHaugan,DirectoroftheGeophysicalInstituteattheUniversityofBergen(Norway).WetalkedabouttheSleipnerFieldintheNorthSea,oneofthefewexistingCCSlocationsontheplanet.Asitturnsout,CCSisaverycomplexprocess:somenearbyCO2injectionsiteswereabandonedsincetheyturnedouttobemuchlesspermeablethanoriginallyanticipated,inwhichcasehigherlevelsofpressurecouldhavecausedcracks;andinotherlocations,pollutedwaterinjectionsitesdidcausecrackssinceinjectedwaterwasfoundatthesurfaceoftheocean.Inotherwords,thesuccessofSleipnersofarisnotaclearsignalregardingtheeaseofCCSinjection,eveninwell-knownformationsliketheonesintheNorthSea.24A2021paperbyDavidVictor(Brookings/DeepDecarbonizationInitiative)andagroupofcolleaguesexaminedattemptedCCSprojectsandfoundthatcapitalcost,technologicalreadinessandcredibilityofprojectrevenueswerethemostimportantfactorsingettingprojectscompleted(comparedtopopulationproximity,employmentimpactorlocalopposition).23Whataboutcarbonmineralization?Carbonmineralizationisaformofstorageinwhichcarbondioxide,ratherthanbeingstoredasacompressedgasunderground,reactswithcertainrocks(magnesite,basalt,etc)andispermanentlymineralized.It’snotaseasyasitsounds…•Inex-situversionsofthisidea,billionsoftonsofcalciteormagnesitewouldneedtobeminedeachyearevenifjustasmallamountofannualCO2emissionswereremovedfromtheatmosphere.Tomineralize15%ofglobalCO2emissions,muchmoremagnesitewouldneedtobeminedeveryyearthanannualglobalminingofironore,forexample.Thematerialshandlingcostswouldbeenormous,andeffortstoacceleratethechemicalreactionvsitsnaturalratehavebeenverychallenging•Thein-situversionoftheideainvolvesinjectionofCO2(mixedinwater)intobasaltrocks,andinwhichthecarbonmineralizationreactioncanoccurinjustayearortwo.However,whileyoudon’thavetomineandmoverocksinthisversion,youdoneedtomovetheCO2towherethebasaltrocksare…whichbringsusbacktotheneedforamassivebuild-outofCCSinfrastructure(pipelines,compression,storageetc)tomakeevenasmalldifferenceWhataboutdirectaircarboncaptureasanoptionforgatheringCO2emissionsfromdistributedsources(i.e.,vehicles)?Somenet-zerostudiesallowforsmallamountsoffossilfuelcombustionthatareoffsetbydirectaircarboncapture(DACC).However,thematerialandenergydemandsofDACCarebeyonddaunting:•Themostpromisingdirectaircapturemethodisbasedonaqueoushydroxidesolutions•Let’sassumethat10gigatonsofCO2arecapturedeachyear,around25%ofglobalemissions•Somewherebetween1.7and3.0gigatonsofNaOH(causticsoda)wouldbeneeded;NaOHreactswithCO2tocreatewaterandsodiumcarbonateNa2CO3,whichcanbeheatedtoproduceagaseousCO2stream…•ThisamountofNaOHis20-40timesitsrecentannualproduction,andalsoequivalentto40%-67%ofrecentglobalcrudeoilextractionbyweight•ElectrolysisrequiredtoproducetheNaOHwouldconsume25%-40%ofworldelectricity,andhydroxideregeneration(usedtoreduceNaOHrequirementsbyregeneratingandreusingmostofthereactant)wouldclaimanother11%-17%ofglobalprimaryenergy.Puttingbothpiecestogether,NaOHelectrolysisplusregenerationwouldrequire15%-24%ofglobalprimaryenergytocapture25%ofCO2emissions•Alastnailinthecoffin:2,400–3,800kWhpertonneofcapturedCO2viaDACCwouldbeneededbeforewhateverenergyisrequiredtoactuallystoretheCO2underground;DACCenergyneedsappeartobe6x-10xhigherthantraditionalCCSenergyestimates,aprocesswhichitselfisstuckinneutralAsperauthorsofthepapercitedbelow,“DACCisunfortunatelyanenergeticallyandfinanciallycostlydistractionineffectivemitigationofclimatechangesatameaningfulscale”25.Sequestrationsummary•Tosequester15%-20%ofUSCO2emissions,CCSvolumeswouldneedtoexceedoilproduction,refininganddistributionvolumes•Mineralizing15%ofglobalCO2emissionswouldrequiremoretonsofminedmagnesiteandbasaltthancurrentglobalminedtonsofironore•Sequestering25%ofglobalCO2throughdirectaircapturewouldrequire25%-40%oftheworld’selectricitygenerationplus11%-17%ofitsprimaryenergy25“Unrealisticenergyandmaterialsrequirementfordirectaircaptureindeepmitigationpathways”,ChatterjeeandHuang,NatureCommunications,2020.24[5]Decarbonizationoftheindustrialsector:costs,challengesandlimitationsTheindustrialsectoristhelargestfossilfuelend-useronaglobalbasis.Couldsomeindustrialprocessesbeelectrifiedtoeventuallyusemorerenewableenergyasthegridisdecarbonized?In2018,LawrenceBerkeleyLaboratoryoutlinedthepossibilities:someprimarymetals,secondarysteel,machinery,woodproducts,plasticsandrubber.Whatdotheyhaveincommon?Mostusefossilfuelsprimarilyfor“processheat”whichcouldbereplacedbyelectricheat.Wealsoassumehighelectrificationpotentialforcertainminingactivitiesrelatedtotransport,excavation,pitcrushingandbeltconveyingsystems.Forotheruses,itgetsharder.Chemicals,pulp/paperandfoodtakeadvantageofintegratedsystemsinwhichfuelcombustionwasteheatpowersrelatedprocesses,referredtoasCHP(combinedheatandpower).CHP-intensivesectorsarehardertoelectrifysinceproducerswouldneedtopurchaseenergypreviouslyobtainedatlittletonocost,and/orredesigntheentireprocess.Otherhardtoelectrifysectorsincludenon-metallicmineralssuchasglass,brickandcementwhichrequiretemperaturesinexcessof1400°C,andwhicharenon-conductivesolids(i.e.,hardertoelectrifyproductionofthingsthatdonotconductelectricity).Finally,oil/coalrefiningexploits“own-use”fuelconsumption,asourceofenergylostwhenswitchingtoelectricity.IndustrialsectorswithhighelectrificationpotentialSectorHeatrequirementHVACProcessHeatCHPPrimarymetalsex.steel1200°C6%75%7%Fabricatedmetal430°C-680°C20%61%7%Machinery730°C46%39%4%Secondarysteel1425°C-1540°C4%87%0%Woodproducts180°C10%50%14%Vehicleparts(drying)150°C31%33%12%Plasticsandrubber260°C20%33%24%Source:LBNL,"Electrificationofbuildingsandindustry",March2018.Fuelconsumptionshares:Industrialsectorswithmedium/lowelectrificationpotentialSectorHeatrequirementHVACProcessHeatCHPFood/beverages120°C-500°C4%25%40%Chemicals100°C-850°C1%32%43%Pulpandpaper650°C2%21%63%Non-metallicminerals870°C-1600°C3%90%1%Oil/coalproducts220°C-540°C0%58%22%Source:LBNL,"Electrificationofbuildingsandindustry",March2018.Fuelconsumptionshares:Thechallenge:low/mediumelectrificationpotentialsectorsuse2.5xtheenergyashighpotentialsectors.Evenifweassumethatallsectorsareeventuallyelectrifiedusingnewtechnologies26,there’sstillalargeincreaseincost.Inadditiontoupfrontswitchingcosts,industrialcompanieswouldfacecostsperunitofenergythatare3x-6xhigherforelectricitythanfordirectnaturalgas.Electricheatingefficiencygainsvscombustioncouldoffsetpartofthiscost,butnotallofit.High23%5.9quadBTUsMedium(Chemicals,foodprocessing)33%8.7quadBTUsLow(Refining,paper,cement,glass,primarysteel)28%7.2quadBTUsUSindustrialenergyusebyelectrificationpotentialSource:EIA(2020),LBNL,"Electrificationofbuildingsandindustry",2018.Includes:iron,secondarysteel,aluminum,metalproducts,wood,plasticsandminingTexasCaliforniaLouisianaIndianaIllinoisOhioPennsylvaniaUKGermanyItalyFranceJapanChina0x1x2x3x4x5x6x7xSource:EIA,Eurostat,IAEE,CEIC,IFPEN,JPMAM,WorldBank.2019.StatesshownarelargestindustrialusersofUSprimaryenergy.Electricityis3x-6xmoreexpensivethannaturalgasCostpermegajouleofenergy,electricitypricedividedbynaturalgasprice;forindustrialusers26Forcement(8%ofglobalCO2emissions),therearepilotprojectsunderwayto(a)uselesslimestone,lessheatandmoreclay;(b)curecementwithcapturedCO2insteadofwater;(c)addbacteriatoconcretethatabsorbsCO2fromtheair;and(d)createcementbricksfrombacteriaandaggregate.Someapproachescouldonlybeusedforlight-dutyload-bearingmaterialssuchaspavers,facadesandtemporarystructures.25Bottomline:chemistryandcostexplainthelowrateofindustrialelectrificationaroundtheworld,andwhytheelectricityshareofUSindustrialenergyusehasbeenroughlyunchangedat12%-15%sincetheearly1980’s.0%5%10%15%20%25%30%35%40%45%19501960197019801990200020102020IndustrialenergyusebytypeShareofindustrialenergyuseSource:EIA.2020.NaturalgasElectricityAcommentonprimarysteelproductionSecondary(recycled)steelisproducedinelectricarcfurnaces,whichallowsforgreenelectricitytobeusedwhenavailable.However,primarysteelproductionaccountsfor~70%ofglobalsteelproductionandismuchhardertodecarbonize.Mostprimarysteelproductionreliesoncokeovensandblastfurnacesthatusecarbonasareducingagenttostripoxygenfromironoxide,aprocesswhichproducesCO2.Around5%isproducedusingdirectreducediron(DRI)whoseCO2footprintpertonisroughlyhalfoftheblastfurnacemethod.DRIusesnaturalgastogeneratecarbonmonoxideandhydrogen,whichisusedtoreduceironoreinafurnace,whichisthencombinedwithscrapsteelinanelectricarcfurnace.ThelowercarboncontentofnaturalgasvscoalispartofthereasonforDRI’slowercarbonfootprint.Somepilotprojectsaimtodecreasethecarbonfootprintofprimarysteelbyusinggreenhydrogenasthereducingagenttostripoxygenfromironoxide.AconsortiumofSwedishcompanies(Vattenfall,LKABandSSAB)aimstodojustthat,planningforsomecommercialproductionin2026.However,theNordicsteelindustryproducesjust6millionmetrictonsperyear,whichis0.35%ofglobalproduction.So,eveniftheentireNordicsteelindustryadoptsthisnewapproachby2045(thestatedroadmap),itwon’thavemuchofanimpactunlessothercountriesadoptthesameapproach,anddosomuchfaster.Asareminder,ChinaandotheremergingcountryproductionmethodswillbetheprimarydriversoffutureglobalemissionchangesgivenWesterndeindustrializationoverthelast25years.Atlastcount,Chinamade50%oftheworld’ssteel,33%oftheworld’sammonia,61%oftheworld’scementand31%oftheworld’splastics.Itstransitiontocleanerenergyandmoremodernproductionmethodsmaybethesinglelargestdeterminantoftheplanet’sfutureoverthenexttwodecades.Steelproductionvolumesbytype,MMTperyearPrimaryBlastfurnace:basicoxygenfurnace(BF-BOF)1,186PrimaryDirectreductionofiron:electricarcfurnace(DRI-EAF)89PrimaryOther8SecondaryElectricarcfurnace388SecondaryBasicoxygenfurnace60Total1,731Source:WorldSteelAssociation.2019.Blastfurnace:basicoxygenfurnaceDirectreductionofiron:electricarcfurnaceElectricity87312Coal1,59244Naturalgas50508Total1,729864CurrentprimarysteelmakingemissionsKilogramsofCO2pertonofsteelSource:ResourcesfortheFuture,"Potentialofhydrogenfordecarbonization",2021.26Whataboutfossilfuelsusedasrawmaterialfeedstocks?Inadditiontousingfossilfuelsforprocessheat,industrialproducersalsousethemasrawmaterials.It’stemptingtobelievethatsincethey’reembeddedintophysicalproducts(i.e.,plasticinsodabottlesortherubberinyourcartires),theywouldnotcontributetoincreasedGHGemissions.Butnoneoftheseproductslastsforever,andusuallyendupinwasteincinerationplants,indecomposinglandfillsorintheocean27.Asaresult,there’sresearchunderwaytoreplacefossilfuelswith(forexample)CO2capturedfromindustrialemitters,whichisthenconvertedintopolyethyleneusinga“methanoltoolefins”approach.Anotherapproachinvolvesgasificationofcropresiduetoproduceolefins,whichareusedtomakeplastics.However,thecostofsuchfeedstockalternativesmaybeprohibitiveandfewhavebeencommercializedatanymeaningfulscale.Hydrocarbongasliquids(HGLs)45%Naturalgas10%Coal9%Cokeandbreeze2%Other(fueloils,asphalt,lubricants,waxes,petrochemicals)34%EnergysourcesusedasrawmaterialsbyUSindustrialproducersSource:EIA.2020.IndustrialuseoffossilfuelsasrawmaterialsMetallurgicalcokePig(cast)ironsmelting(carbonsource),whicheventuallybecomessteelMethaneSynthesisofammonia(hydrogensource),mostlyusedforfertilizingcropsMethane,naphthaandethaneSynthesisofplastics(sourcesofmonomers)HeavypetroleumproductsProductionofcarbonblack(rubberfiller),usedintires&otherindustrialproductsLubricantsderivedfromcrudeoilminimizefrictionineverythingfromairlineturbofanenginestominiaturebearings,anddifferfromotherfractionsofcrudeoilbytheirveryhighboilingpoint.Theycanbeforintermittentuse(motorandaviationoils)orcontinuousservice(turbineoils).Globally,theautoindustryisthelargestconsumer,followedbytextiles,energy,chemicalsandfoodprocessing.Annualuseoflubricantssurpasses120megatons;forcomparison,globaloutputofalledibleoilssuchasoliveoilandsoybeanoilis200megatonsayear.Syntheticlubricantsmadefromsimplercompoundsaremoreexpensive,sodemandforlubricantsfromcrudeoilmaykeeprising.Anotherproductderivedfromcrudeoil:asphalt.Globaloutputisnowaround100megatons,with85percentusedforpavingandmostoftherestforroofing.Source:Smil,V.2022(forthcoming).“HowtheWorldReallyWorks”27TheDoEandEIAmadedetailedpermanentcarbonstorageassumptionsbyproductina260-pagedocumentin2008whichisstillinusetoday.Carboninasphaltisconsidered100%storedwhileforlubricantsstorageisassumedtobe50%.TheIPCCassumes80%carbonstorageinplastics,butasdescribedabove,actualstorageratesmaybelowerduetoincinerationordecompositioninlandfills.27[6]Oilandgasupdate:ourbullishcallonthesector,oneyearlaterInlastyear’spaperwemadeabullishcallontheoil&gassector.Sincethen,energyreboundedandoutperformedtheoverallmarket.Werecommendthatinvestorsstickwiththeoil&gassectorfornow.Duringthepriordecade,investingintheUSshalerevolutionwasoftenatrainwreck.Takea23-stockuniverseofcompaniesassociatedwiththeUSshaleboomfrom2010-201928:•Asagroup,theiraggregatefreecashflowwasnegativeineveryyear•Sevenofthesecompaniesneverexperiencedasingleyearofpositivecashflow•Anotherelevencompaniesonlyexperiencedpositivefreecashflowin3orfeweryearsoutof10Wefeltthatthispoorperformancewasbasedon(a)thecollapseincapitaldisciplinebymanagementandbyinvestorsand(b)thesupplyshockfromhydraulicfracturingratherthan(c)asignthatdemandforfossilfuelswasatapermanent,downwardinflectionpoint.Inotherwords,investorsandmanagementcouldsolvethisproblemafteraperiodofbankruptcies,consolidationandarenewedfocusonfreecashflow.Sincelastsummer,signalsaremostlypositive.Theindustryisnowmorefocusedongeneratingcashflowforinvestors,andbothrigcountsandcapitalspendinghavebottomedout.-$80-$60-$40-$20$0$20$40$6020102011201220132014201520162017201820192020ThousandsSource:Bloomberg.2020.Shalerevolution:arevolutioninsupply,notprofitSelectcashflowmeasuresfor23shalecompanies,US$,billionsOperatingcashflowCapitalexpenditureFreecashflow-$12-$8-$4$0$4$82013201420152016201720182019202020212022Source:Bloomberg.Q42020.Dotsrepresentestimates.EnergysectorfreecashflowUS$,billionsS&P1500OilandGasE&PIndexShalerevolutionportfolio(23companies)2505007501,0001,2501,5001,7502,0002,2502012201320142015201620172018201920202021Source:BakerHughes,Bloomberg.April23,2021.NumberofUSoilandgasrigsJan1,2020-80%-60%-40%-20%0%20%40%60%201620172018201920202021HundredsSource:FederalReserveBankofDallas.Q42020.E&PyearaheadcapitalspendingexpectationsShareoffirmsexpectingincreasedcapex-expectingdecreasedcapexJan1,202028The23companiesinourshaleuniverse:Antero,Apache,Cabot,Callon,Chesapeake,Cimarex,Continental,Denbury,Diamondback,EOG,EQT,Hess,Laredo,Marathon,Matador,Murphy,Oasis,PDC,Pioneer,Range,SM,Southwestern,andWhiting.Thefollowing6companieswereincludedintheshaleanalysisinour2020energypaper,buthavesincebeenacquired:Anadarko,Carrizo,Concho,Noble,WPXandQEP.28Marketresults.Shalestocksreboundedfrom2020lowsandoutperformedthebroadmarketsinceourenergypaperlastyear.However,thesegainsareeclipsedbytheriseinrenewableenergystocks.Despitetherebound,theoil&gassectorstilltradesclosetothelargestdiscountvsthemarketinits90-yearhistory.0100200300400500600201320142015201620172018201920202021Source:Bloomberg.April26,2021.EnergyreboundvsthemarketsinceJune2020Cumulativetotalreturnindex,January2013=100S&P500Shalerevolutionportfolio(23companies)Avg.of5renewableenergyindexes63%40%123%ReturnssinceJune20200.30.60.91.21.51.82.12.42.71928193819481958196819781988199820082018Source:EmpiricalResearchPartners.March2021.Equalweightedportfolio.Energysectorvaluationsatall-timelowsvsthemarketEnergystockspricetobookdividedbymarketpricetobook1928-2021averageWerecommendthatinvestorsstickwithoil&gasfornow.WorlddemandforliquidfuelsshouldcontinuetoreboundasCOVIDvaccinationsincreaseandeconomiesreopen.Asdemandgrows,weexpectsupplytorecovermoreslowly.“BigOil”returnoncapitalfelltosingledigitsby2016duetoexcesscompetition;weexpectthesereturnstorisebackto1990’slevelsof10%-15%.Andwhilepubliclytradedoilcompaniesonlyrepresent2/3ofglobalproduction,theirtrendsarenotable:60%declineinreservelivessince2014,steepeningoilcostcurvessince2017anddecliningcapitalcommitments29.$0$20$40$60$80$100$120$140$16005,00010,00015,00020,00025,00030,00035,00040,00045,000Costcurvefornewoilprojects(pre-sanction,underdevelopmentandproducing)2009-2020Breakevenprices(US$/barrel)Source:GoldmanSachs.2021.Identifiedprojects(pre-sanction,underdevelopmentandproducing)areevaluatedeachyearandassignedabreakevenpriceandpeakoilproduction.Theoilcostcurvedepictsthecumulativepeakoilproductionofidentifiedprojects.Cumulativepeakoilproduction(thousandbarrelsofoilequivalentperday)200920112013202020152019201729“TopProjects2021:ShrinkingReservesandRisingProfits”,GoldmanSachs,March24,2021.SeeExhibits1-4.29Lastly,theworldisnotontracktostrandalotofoilandgasinthefutureandismuchclosertotheIEAStatedPoliciesscenariothanitsSustainableDevelopmentscenario30.Onlyinthelatterareoil,gasandcoalassetsprojectedtobeleftstrandedintheground,whichyoucanseeinthetable.Asaresult,peakoildemandforecastsmayendupbeingjustaswrongaspeakoilsupplyforecastswereagenerationago31.758085909510010511020182019202020212022WorldliquidfuelsconsumptionMillionbarrelsperdaySource:EIAShort-termEnergyOutlook.March2021.ComparingstrandedassetrisksinIEAscenariosProvenreserves,2018Cumul.extraction,2019-2070Strandedin2070PercentstrandedOil235,931265,35300%Natgas169,334228,26600%Coal596,540197,890398,65067%Provenreserves,2018Cumul.extraction,2019-2070Strandedin2070PercentstrandedOil235,931137,47898,45442%Natgas169,334125,25944,07526%Coal596,54077,560518,98087%Source:BP,IEA,JPM.Unitsshownaremilliontonsofoilequivalent.2019.SustainableDevelopmentScenario:largeamountsofstrandedoil,gas&coalStatedPoliciesScenario:onlycoalassetsstrandedThisisthe“oilwedge”chart:itshowsdifferentprojectionsoffutureoildemandandtheamountofoilsupplyfromexistingfieldsassumingnonewdevelopment.EvenintheIEA’shighlyambitiousSustainableDevelopmentscenario,worldoildemandin2040isstilltwicethelevelofsupplyfromexistingfields.Iseveryonesurethatweshouldstarvethisindustryofcapitalstartingnow?2040608010012014019701980199020002010202020302040Oil"futureproductionwedge":demandvsexistingfieldsupplyMillionbarrelsperdaySource:BP.2019.OilsupplyOilsupply(assumingnonewdevelopment)DemandforecastsBP(basecase)WoodMackenzieBP(EvenFasterTransition)EIAIEACurrentPoliciesOPECIEANewPoliciesIEASustainableDevelopment30TheIEAStatedPoliciesscenarioisnotthestatusquo;itreflectssomefar-reachingandambitioustargetsthathavebeenlegislatedorannouncedbygovt’saroundtheworld.TheIEASustainableDevelopmentscenarioisevenmoreambitious,andassumesthefollowingby2030:globalprimaryenergyusedeclines7%from2019to2030(comparedtoa20%increaseovertheprior11years);solargenerationgrowsbyafactorof5.6x,windgenerationgrowsbyafactorof2.4x;nucleargenerationincreasesby23%(nodecommissioning);coaluseforpower/heatdeclinesby51%;andelectricvehiclessalesreach40%fromtoday’s4.5%levels.31SeeVaclav’s2006“PeakOil:ACatastrophicCultandComplexRealities”.Globaloilproductionhasrisenby20%-60%sincethedatesofvariouspeakoilsupplyforecastsmadeinpriordecades.30[7]Biden’senergyagenda:howmuchoilandgaswilltheUSneedinthefuture?ForthefirsttimeinmylifetimetheUSis“energyindependent”,atleastonanetbasis.However,60%-80%ofUSoil,gasandNGLproductionisreliantonhydraulicfracturing,andtheUSisstill75%-80%reliantonfossilfuelsforprimaryenergy.Againstthisbackdrop,theBidenadministrationannouncedpoliciestoreduceoil&gassupplyanddemandandtodecarbonizetheelectricitygridby2035.Inthissection,weanalyzeeach.Tostartout,herearesomechartsonUSenergyindependenceandUSrelianceonhydraulicfracturing.-200-1000100200300400500600700800197219781984199019962002200820142020Source:EIA,JPMAM.December2020.USnetenergydeficit,inenergytermsNetimportsofoil,naturalgasandcoalinmilliontonnesofoilequiv.MaximumUSenergydependence2020USenergyindependence7080901001101205678910111213'10'11'12'13'14'15'16'17'18'19'20'21UScrudeoilandnaturalgasproductionMillionbarrelsperdayBillioncubicfeetperdaySource:EIA.January2021.NaturalgasproductionCrudeoilproduction0246810122000200320062009201220152018Source:EIA.2019.USoilproductionbytypeMillionbarrelsperdayTightoil(frackingdependent)GulfofMexicoAlaskaConventionalonshore051015202530352000200320062009201220152018Source:EIA.2019.USdrynaturalgasproductionbytypeTrillioncubicfeetperyearShalegasConventionalonshoreConventionaloffshoreOtherTightgasFrackingdependent[a]OilsupplyanddemandBiden’senergyagendaincludesthefollowingpolicieswhichimpactoil/gasoline:•Banonnewleasesforoil&gasproductiononFederallands,whichcurrentlyaccountfor9%ofonshoreoil,9%ofonshoregas,16%ofoffshoreoiland3%ofoffshoregas(executiveaction)•Terminationof500,000barrelperdayKeystoneXL32pipelineproject(executiveaction)•ElectrificationoftheFederalvehiclefleet(executiveaction)•$100billionovertenyearsforextensionofFederalincometaxcreditsforEVsbyeliminatingthe200,000unitcap,taxcreditsforusedEVpurchasesandpoint-of-saletrade-inrebatesforEVs(legislation)•Improvementinpublictransitinfrastructure,designedtoreducecarownership(legislation)•A6%annualemissionsreductioninnewmodelyears2026-2030vs2020baseline(executiveaction)32GasolineisonlypartoftheenergysupplylostfromtheKeystoneXLcancellation.Otherannualenergysupplylossesinclude2.3billiongallonsofdistillatefuelsand800milliongallonsofjetfuel,bothofwhichwouldneedtobeproducedonUSprivatelandsorimportedfromsomeplaceotherthanCanada.31ThetableshowsthepotentialimpactofeachpolicyonUSgasolinedemandusingourassumptions33.Theprojectedreductioningasolinedemandexceedsthereductionindomesticsupplyby2.6billiongallonsperyear.Asaresult,thesepolicieswouldnotunderourassumptionsworsenUSenergyindependence.However,givenannualgasolineconsumptionof142billiongallonsperyear(2019),12.4billionindemandreductionwouldonlybea9%decline.Inotherwords,theUSwouldstillneedplentyofgasolinein2030andbeyondeveniftheBidenagendaisimplementedusingourassumptions.Furthermore,alotisridingonimprovedmileagestandardsfornewcarsandEVincentives.Asdescribedearlier,USEVsaleslastyearwerejust2%.Ourassumptionsimplyaquickjumptoaround12%,whichwouldcatapulttheUSfromoneofthelowestEVcountriestooneofthehighest.It’sunclearifUSconsumerpreferenceswillchangethatquickly,andwehavealreadydiscussedonpage14howbehavioralissuesmayreducetheassumedGHGbenefitsintheEVtransition.Bottomline:thereductioninUSgasolinesupplyhasalotmorecertaintytoitthantheprojecteddeclineinUSgasolinedemand.PolicyLegislative/ExecutiveSupply/DemandEstimatedimpactinyear5billiongallonsofgasolineperyear[a]Banonnewoil&gasleasesExecutiveSupply(6.4)[b]KeystoneXLPipelineExecutiveSupply(3.5)Totalsupplydecline(9.8)[c]ElectrificationoffederalfleetExecutiveDemand(0.4)[d]EVincentivesLegislativeDemand(4.9)[e]PublictransitimprovementsLegislativeDemand(0.5)[f]Mileage/emissionsimprovementsExecutiveDemand(6.6)Totaldemanddecline(12.4)Netdemanddecline(2.6)Source:EIA,DOT,BTS,WSJ,EVVolumes,JPMAM.2020.33Keyassumptionsforthetableabove:•After5years,onshore/offshoreoilproductiononFederallandsdeclinesby50%/20%,withthedifferencereflectingthemuchlongerleasetermsofoffshorefacilities•ConsistentwithresearchfromEurope,publictransitinvestmentsreducecarownershipby3%;only5%-10%ofAmericansusepublictransportregularlyand45%currentlyhavenoaccesstopublictransport•EVincentives:$100bnbasedonGoldmanSachsEconomicResearchApril16thanalysisofBidenenergyproposals;subsidypervehiclebasedonSenatorSchumer’s2019planof$6,000pervehicle•Realworldmpgonnewcarsincreasesto34mpgby2030comparedto22.3mpgontheexistingstockofcarsand25realworldmpgoncurrentnewcarssold[EPAdata].Realworldmpgdifferssubstantiallyfromratedmileageduetotesting,roadconditionsanddriverbehavior.EPAestimatesofrealworldmpgfornewcarssoldare10mpgbelowaunit-weightedaverageofnewcarfueleconomysourcedfromtheDoT•USmilesdrivenforaveragepassengercar/lightvehicle:13,500peryear;unitsales17millionperyear32[b]HowmuchnaturalgaswilltheUSneedinthefuture(i.e.,2035)?TheBidenadministrationaimstodecarbonizetheUSelectricitygridby2035.InthissectionweexamineimplicationsfortheUSnaturalgasindustry.By2035,weassumethefollowing:•Sincemostnuclearplantswillbe50yearsoldormoreandsincemanyarealreadyunprofitable,2/3willbedecommissioned;coalplantswillbedecommissionedaswell;hydropowergrowsby5%asperpriorstudies•USelectricitydemandgrowsby10%toaccommodate30%EVpenetrationwithEVs@3.3milesperkWh;theoveralllightvehiclefleetgrowsby1%peryear;non-EVelectricitydemandremainsconstantasefficiencyimprovementsoffsetaprojectedriseinpopulation(ashasbeenthecasesince2005)•Mediannationalcapacityfactorsof25%forutility-scaletrackingsolarand35%foronshorewindIfwestopthere,theUSnaturalgasindustrywouldneedtoincreaseitsshareofelectricitygenerationfrom39%to77%[ScenarioB].Next,weincludewindandsolargrowthof25-30GWperyearprojectedbyLBNLbeforetheimpactofanyBideninfrastructurespending,inwhichcasethenaturalgasshareofgenerationwouldbe57%[ScenarioC].Finally,weassumeafaster73GWpaceofwind/solargrowthbasedontherateofpeakUScapacityadditionsduringthenaturalgasboomofthelate1990’s.Thisisveryaggressivesincethatcapacityboomonlylastedtwoyears,andweassumethispaceissustainedfor15years.Inthiscase,thenaturalgasshareofgenerationwouldfallto23%in2035[ScenarioD].TheScenarioDwind/solarcapacityexpansionwouldrequirealotofnewtransmissioninfrastructureaswell.ThethirdchartillustratesjusthowmuchofachallengethiswillbegivenFederal,stateandlocaltransmissionbottlenecksdiscussedinSections2and3.Withoutadequateinterstatetransmissionexpansion,renewablepenetrationofthismagnitudewouldbeclosetoimpossible,evenwithgrowthindistributedstorage.05001,0001,5002,0002,5003,0003,5004,0004,5005,0005,500A:currentB:coalshutdown2/3nuclearshutdown30%EVpenetrationC:B+currentwind/solarprojectionsD:B+wind/solargrowthathistoricalpeakpaceOtherSolarWindHydroNuclearCoalPetroleumNat.gasUSelectricitygenerationmixTerawatthoursSource:BP,EIA,LawrenceBerkeleyNationalLaboratory,JPMAM.2019.201920352035203505010015020025030019601970198019902000201020202030Source:AmericanPublicPowerAssociation,EIA,ChinaElectricityCouncil,FraunhoferISE,BP,LBNL,Clacketal.(pre-2014data),JPMAM.2020.Historicalratesofinstalledelectric-generatingcapacityCapacityadditions,wattsperyearpercapitaCoalandnuclearpeak2ndnuclearpeakNaturalgaspeakScenarioDScenarioC2020ScenarioD(2035)ScenarioC(2035)01002003004001978198819982008201820282038UStransmissioninfrastructureThousandgigawatt-milesSource:DOE,UTAustin,BP,EIA,PrincetonNetZero,LBNL,JPMAM.2020.Dept.ofEnergyUTAustin33UnderScenarioD,naturalgasusedforelectricitygenerationdeclinesbyone-third.However,asdiscussedintheExecutiveSummary,electricityaccountsforjust17%oftotalUSfinalenergyconsumption.Directenergyusebyindustry,intransportationandforheatingismuchlarger.Thesameistruefornaturalgas:only35%isusedforelectricitywhilelargeramountsareusedbyUSindustrypluscommercialandresidentialheating.Lookingat2035.Electrificationofindustrialenergyuseisaveryslowprocess(seeSection5),andweseenobasisforassumingrapidchangesinthenextdecade.Naturalgasusedforresidentialandcommercialheatinghasbeenstablesincethe1970’s,andweexpectanyelectrificationtobeminor.Inotherwords,naturalgasdemandfornon-gridreasonsisassumedtoremainthesame.WeassumethatUSprimaryenergyuseremainsroughlyflat,asithassince2010,withefficiencygainsoffsettingagrowingpopulation.Thelastchartshowsnaturalgasconsumptionbysector,todayandin2035accordingtoScenarioD’srapidsolar/windexpansion.Evenwhenassumingapaceofwind/solarexpansionthatmatchespeak1990’scapacityadditions,demandsonthenaturalgasindustryin2035wouldonlydeclineby13%vstoday’slevels.OurbasecaseisinbetweenScenarioCandD,andresultsinnaturalgasdemandin2035thatisroughlyunchangedvstoday.Importanttounderstand:ifyouassumeafasterpaceofelectrifiedtransport,industryorheating,theincrementalkWhwouldhavetocomefromnaturalgasunlessyouassumeanevenfasterpaceofsolar/windexpansion.Asaresult,evenwithplanstoachievegreatergriddecarbonization,itwouldbeprematuretolimitthenaturalgasindustry’sabilitytoprovideareliablesourceofbaseload,dispatchablepoweranddirectprimaryenergytotheUSeconomy.Policymakersalsoneedtoplanfortheunexpected;shouldwindandsolargrowthnotachievepeakgrowth,USnaturalgasdemandin2035mightnotbethatdifferentthanitistoday.Fora7-pagecompilationofourviewsonthefutureofUSnaturalgas(i.e.,this2-pagesectionandothernaturalgasmaterialscitedelsewhereinthispaper),pleaseclickhere.05101520253035Current2035assumingwind/solargrowthathistoricalpeakpaceElectricityResidentialheatingCommercialheatingTransportIndustryEvenassumingambitioussolar/windgridexpansion,overallnaturalgasneedsfallbyonly13%by2035QuadrillionBTUsofnaturalgasconsumptionSource:BP,EIA,LBNL,JPMAM.2019.280290300310320330340010203040506070809020002005201020152020USprimaryenergyuse,electricitygeneration&populationExajoulesPopulation,millionsSource:BP,Census.2019.ElectricitygenerationUSpopulationPrimaryenergy0246810152025303540455055606570AgedistributionofexistingUSnuclearreactorsin2035NumberofplantsSource:InternationalAtomicEnergyAgency.2019.Ageofpowerplant(years)051015202519501960197019801990200020102020ResidentialandcommercialenergyusebytypeQuadrillionBTUsSource:EIA.2020.NaturalgasElectricityCoal&petroleum34[8]China’srareearthmetaldiplomacyrevvingupagainFormanyyearsChinahadaneffectivemonopolyonproductionofrareearthelements(REE)usedtomakerechargeablebatteries,windturbinesandenergyefficientlightbulbs(andF-35fighterjetsandnuclearsubs).Whilerest-of-worldREEproductionhasbeenrising,Chinastillproducesmostofthe“heavy”REEsthatarescarcer;thelightREEsaremuchmoreabundant.Almost90%ofChina’sREEexportsgoto5countries:Japan,US,Netherlands,SouthKoreaandItaly.Demandforrareearthmetalsisexpectedtodoubleby2030asrenewableenergydemandsincrease.WhilethevalueofglobalREEimportsin2019wassmall($1billioncomparedto$1+trillioninglobaloilimports),theyarecriticaltoavarietyofrenewablesupplychains.Chinahasusedrareearthmetalsdiplomacyinthepast:in2010,ChinacutitsREEexportquotasby37%.Thisledtoatemporaryten-foldincreaseinREEpricespermetricton,aWorldTradeOrganizationrulingagainstChina,aresumptionofexportsandacollapseinREEpricesbacktopriorlevels.Butsomethinghappenedthat’sworthnoting:atthetime,higherpricesledto200newREEprojectsoutsideChina.Manyneversurvivedsincepricescollapsed,butitdoessignifytheabilityofothercountriestotakeonREEproductionandrefiningifitmakeseconomicsense,andifthey’rewillingtotakeontheinherentenvironmentalrisks.Aftera2010disputewithJapanoverafishingboatincidentandChina’sdecisiontocutoffREEexportsfor2months,JapaninvestedinLynasCorp,anAustraliancompanywhichsurvivedandistheonlysupplieroutsideChinaabletoprocessREE.LynasnowsuppliesJapanwithone-thirdofitsREEimports.Wemaybeinforarepeatofthe2010episode.ChinesePresidentXimadeapublicvisittoanREEfacilityinJiangxiin2019,andin2021China’sMinistryofIndustryandInformationTechnologyproposedcontrolsonproductionandexportofREE.Responses:in2018aUSrareearthmineinCaliforniareopened,aTexasREEprocessingfacilitywasapprovedbytheDep’tofDefenseinApril2020,theEUhasfundedaninitiativetorecyclepermanentmagnetwaste,anAustraliancompanyhasraisedfinancingforaprojectinUganda,andJapanaimstoreducerelianceonChineseREEbelow50%by2025.Inotherwords,wemightseeanotherspikeinglobalREEprojectsandpricesifChinaisgoingtopreserveitsREEfordomesticuseorforuseintradedisputes34.030,00060,00090,000120,000150,0001996200020042008201220162020ProductionofrareearthelementsTonnesSource:USGeologicalSurveys(1996-2021).2020estimatesasofJan2021.ChinaRestofworldRareearthproductionandreserves(tonnes)2019%2020%2020%UnitedStates28,00013%38,00016%1,500,0001%Australia20,0009%17,0007%4,100,0004%Brazil7100%1,0000%21,000,00018%China132,00060%140,00058%44,000,00038%India2,9001%3,0001%6,900,0006%Russia2,7001%2,7001%12,000,00010%Vietnam1,3001%1,0000%22,000,00019%Othercountries31,16614%40,60017%4,320,0004%Worldtotal218,776100%243,300100%115,820,000100%ReservesMineproductionSource:USGeologicalSurvey.2021.2020estimatesasofJanuary2021.LightREEs:Lanthanum,cerium,praseodymium,neodymium,promethium,samarium,europium,gadoliniumandscandiumHeavyREEs:Terbium,dysprosium,holmium,erbium,thulium,ytterbium,lutetiumandyttrium34China’suseoftradeindiplomaticdisputes.AfterAustraliacalledforaninternationalinquiryintotheoriginsofCOVID-19,ChinarespondedbyraisingtradebarriersonimportedAustralianbarley,timber,sugar,seafood,wineandcoal.Butnotironore,sinceChinaishighlydependentonAustraliaforthat.35[9]China:hownewlawsonresidentialheatingsystemsactuallyleadtogreaterGHGemissionsDuetoitslowpriceandhighheatvalue,coalisaprimarywinterheatingfuelinNorthernChina.Inruralcommunities,coal-fueled“kang”bed-stoveshavebeenaroundforalmost2,000years.However,withoutdesulfurizationanddenitrification,kangbed-stovecombustionofcoalreleasessulfurdioxide,nitrogenoxideandotherairpollutantsdirectlyintotheatmosphere.IntheBeijing/Tianjin/Hebeiregion,annualruralcoalconsumptioncanexceed40milliontons,contributingto~15%ofthatregion’soverallsulfurdioxide,4%ofitsnitrogenoxideand23%ofitsairbornenanoparticles.ThefirstchartillustratesthehugeseasonalswinginCentralandNorthernChinaairqualityinwinterwhencoalusagerises,andhowparticulatemattersurgesaboverecommendedlimitsinWesterncountries.AnalternativeairqualitymeasureshowsthatinsomeNorthernChinaregions,airqualitysometimesregistersas“terrible”or“poisonous”inwintermonths.Theproblem:directcombustionofcoalforheatismoreefficientthancombustionofcoaltomakeelectricitytopowerelectricheaters,andChina’sgridisstillhighlyreliantoncoal.Ontheright,weshowtheestimatedheatingefficiencyofkangbed-stoves(62%)comparedtotheefficiencyofChina’selectricitygrid(38%,netoftransmissionlosses).Also:China’selectricitygridis65%reliantoncoal.Puttingthepiecestogether,a2020paperestimatedthatforevery1kgofcoalconsumedbyakangbed-stove,1.9-2.2kgofcoalwouldbeneededtoindirectlypoweranelectricheaterinthesamehome35.Theauthorsestimate200millionmetrictonsofadditionalCO2emissionsthisyearinChinasimplyduetotheshiftfromkangbed-stovestoelectricheating(around2%ofChina’soverallCO2emissions).Asperthechartontheleft,thepolicymaybehelpingtoreduceparticulatematterasintended,alongwithotherdecarbonizationsteps.UrbanizationandfurtherpenetrationofrenewablesonthegridwillsolvepartofthisprobleminChina,butthere’sabroaderissueatworkhere.“Electrificationofeverything”canimproveairandwaterqualityincountrieswithsubstantialruralcombustionoffossilfuels,andprovidesameanstoeventuallyusegreenerpoweronthegrid.However,electrificationbeforegriddecarbonizationcanimprovesomeenvironmentalissueswhileatthesametimemakingothersworse.0255075100125150201320142015201620172018201920202021ChinaparticulatematterMicrogramspercubicmeter,particulatematter(<2.5micrometers)Source:Bloomberg,EPA,JPMAM.March31,2021.Regionsincluded:Beijing,Shanghai,Shenyang,ChengduUSEPAprimaryannualstandardUSEPA24-hourstandard0%10%20%30%40%50%60%70%KangheatingsystemElectricheaterspoweredbyelectricitygridEfficiencyofChineseheatingsystems%Source:Kammen,UCBerkeley;Zheng,NorthChinaElectricPowerUniversity.November2020.35“Exploringthetrade-offsbetweenelectricheatingpolicyandcarbonmitigationinChina”,Kammenetal,NatureCommunications,2020.36[10]USsolarpower:distributedsmall-scalegenerationisgrowing,butcustomersfaceheadwindsUSsolarpowerisstillasmallcontributorat2.8%ofelectricitygenerationand1.2%ofprimaryenergy.WoodMacKenzieexpectssolargenerationtodoubleby2025,butthat’sstillsingledigitsinshareterms.Onanationallevel,utility-scalesolarpoweronthegridaccountsfor2/3ofsolargenerationwhilesmall-scaledistributedsolaronresidential,commercialandindustrialrooftopsaccountsfortherest.Insomestates,distributedsolaraccountsformoregenerationthangridsolar(MA,HI,VT,NJ,MD).Inthethirdchart,weshowsolarcapacityfactorsbystate;fixed-tiltisanupperlimitproxyfordistributedrooftopsolar.Industrialandcommercialutility-scaleResidentialsmall-scaleIndustrialsmall-scaleCommercialsmall-scaleGridelectricityUSsolargenerationbysourceSource:EnergyInformationAdministration,JPMAM.2019.0%2%4%6%8%10%12%14%16%18%20%CAMANVHIVTUTAZNCNMNJMDIDDECORISmall-scalesolarGridelectricity+non-gridutilityscalesolarTop15statesbysolarshareofelectricitygeneration%oftotalelectricitygenerationSource:EnergyInformationAdministration,JPMAM.2019.AZNVCAUTNMCOIDNCHIMDDENJMAVT-5%0%5%10%15%20%25%30%35%TrackingmountFixedtiltmountUtilityscalesolarcapacityfactorsbystateSource:LawrenceBerkeleyNationalLab,JPMAM.2019.Graybar=estimate.SelectreimbursementapproachesbystateAZinitial30%belowToDretailrate,reimbursementdeclinesovertime;CAfullToDretailrate;ifpositivenetbalanceatendofyear,reimbursedat3-4¢perkWh;monthlytransmissioncharge;HIwholesalerate(~50%ofretailrate)plusmonthlytransmissioncharge;MAfullretailrate,60%ofretailrateforpositiveexportbalance;MDfullretailrate;NJfullretailrate,avoidedcostforpositiveexportbalance;NMutility-dependent(fullretailrateornetavoidedcost);NV75%-95%ofretailrate;UTfullretailrate;VTfullretailrate,10%-20%belowretailrateforpositiveexportbalanceManystatesnolongerreimbursesolarcustomersatthefullretailrateirrespectiveoftimeofday.Manynowpayafixeddiscounttotheretailrate,oratime-of-useamountwhichdependsonthetimeofday(ToD),orawholesalerate.Someutilitiestakeanevenmorelocalizedapproach,onlymaintaininggenerousincentivesforcustomersinplaceswithstrained,over-utilizedtransmissiongrids.Fallingcompensationratesincreasethevalueofdistributedstoragetosuchcustomers,allowingthemtoforgoelectricitypurchasesathigherprices;butthishasitsownpaybackperiodduetotheadditionalcapitalcostofstoragecapacity.Lessgenerousreimbursementapproacheshavebeenadoptedsince(a)manysolarcustomersfloodthegridwithelectricitywhenit’sabundant,reducingitsvalue;and(b)customersthatexportsolarneedinsomewaytobearagreatercostoftransmissionupgradesthatareoftenrequiredtoaccommodatetwo-wayelectricityflows.AccordingtoastudyofindustrialsolarcustomersinCalifornia,changestonetmeteringrulesreducedelectricitysavingsby30%andsubstantiallylengthenedpaybackperiods.37Epilogue:LastwordsontheTexaspoweroutageandwhyIwritethispapereachyearHere’sachartontheoutageandatableshowingERCOT’sseasonalresourceadequacyassessment.010,00020,00030,00040,00050,00060,00070,000Feb12Feb13Feb14Feb15Feb16Feb17Feb18ElectricitygenerationinTexasMegawatthoursSource:EIA.February22,2021.Renewableincludeswind,solarandhydroelectric.Thermalincludesnaturalgas,coalandnuclear.BlackoutsbeganThermalRenewableCoalNuclearGasWindTotalcapacity13.65.248.425.0Expectedoffline2.81.110.023.2Expectedonline10.84.138.31.8Minimumduringcrisis(Feb.15)7.63.827.50.6Underperformance3.20.310.81.1Source:ERCOT2020SARAreport,EIA,JPMAM.2021.ERCOTseasonalresourceadequacyassessment:winterworstcase,gigawattsNowlet’slookatwhatsomepoliticians,regulatorsandjournalistshadtosayaboutthis.“BadTakesDepartment”:somepeopleblamedtheTexaspoweroutageprimarilyonwind“Thisiswhathappenswhenyouforcethegridtorelyinpartonwindasapowersource.Whenweatherconditionsgetbadastheydidthisweek,intermittentrenewableenergylikewindisn’ttherewhenyouneedit.”–U.S.RepresentativeDanCrenshaw(TexasTribune)“WeshouldneverbuildanotherwindturbineinTexas.”–SidMiller,Texasagriculturecommissioner(TexasTribune)“Thewindmillsfailed,likethesillyfashionaccessoriestheyare,andpeopleinTexasdied.”–TuckerCarlson,FoxNews(AustinAmerican-Statesman)“[Theoutages]areproofthatgreenenergyisnotreadyforprimetime.[Insub-freezingtemperatures],windandsolarjustdon’tworkforpower.”–LarryKudlow,FoxNews(AustinAmerican-Statesman)“Thecold-drivenFebruary2021shortageinTexaswascausedbyover-reliance,notunder-reliance,onweather-dependentrenewableslikesolarpanelsandwindturbines.”–MichaelShellenberger(energyjournalist)Inmyview,thesearehighlyinaccuratediagnosesoftheoutagegiventhefollowingreadilyavailableinformation:•ThedeclineinTexasnaturalgasgenerationwasfourtimeslargerthanthedeclineinwind•ERCOTsaidtheoutagewasprimarilyduetonaturalgassupplyissuesduetofreezingofgatheringlinesandfailureofelectricpumps.ThetableaboveshowstheunderperformancebyfueltypeaccordingtoERCOT’sownworst-caseriskassessmentanalysispreparedin2020•Texashasa“criticalloop”problem:manyofitsnaturalgasproductionsites,compressionfacilitiesandhubsareelectrifiedinsteadofusingnaturalgastopowertheiroperations.Asaresult,iftheirelectricityiscutforsomereason,itcreatesadownwardspiralsincethesefacilitiescannolongersupplynaturalgastopowerplants,creatingtheneedforevengreateroutagesthataffectmorenaturalgasoperators.ThisiswhathappenedduringtheoutagewhenTexasutilityOncorcutpowertodozensofnaturalgasfacilities➢There’saneasysolutionhere:naturalgasoperatorsaresupposedtofileaformsothattheyareona“criticalinfrastructurelist”.However,asreportedintheTexasTribune,manynaturalgasoperatorshadn’tfilledouttheformordidn’tevenknowitexisted(!!).Aftertheoutage,Oncoradded168naturalgasfacilitiestoitscriticallist,afive-foldincreasefromJanuaryofthisyear38•Anotherproblem:inTexas,naturalgaspipelinesarecontractuallyobligatedtoprioritizeresidentialcustomerswhilepowerplantsusuallydon’thavecontractsthatguaranteesupply.Whendemandfornaturalgasspikedduringthecoldweather,mostresidencesreceiveduninterruptednaturalgaswhilemanypowerplantsdidn’t➢Remarkably,thepresidentoftheNorthAmericanElectricReliabilityCorporation(NERC)saidthis:“Ourgassystem,quitefrankly,isdesignedforindustrialuseandspaceheating.It’snotdesignedtoservelargepowerplants.Wedon’tthinkofgasasthesamecriticalityaswedopower.Thatmakessense,exceptwhenyourealizeapowersystemwithoutreliablegassupplyisnotthatuseful”•NERCandtheTexasPublicPolicyFoundationwarnedyearsagothatERCOT’sloadvsitscapacityreservemarginwastoosmall•Texasreliesheavilyonjust-in-timeproductionofnaturalgasandhaslessgasstoragethanotherstateswithhighsharesofgas-poweredelectricitygeneration;moregasstorageshouldbetheeasiestfixratherthanmorecostlywinterizationofequipment•TexasdecidedyearsagonottoparticipateintheTresAmigasinterconnectionprojectwhichcouldhaveprovidedbackuppowerfromWesternandEasterngrids.OnereasonTexasreportedlydeclinedtoparticipate:itwouldhaverequiredthestatetoberegulatedbyFERC(national)insteadofERCOT(state)Iunderstandconcernsaboutlargesharesofwindpower.It’sintermittent,requiresnewtransmissionlinesandsuffersfromenergydensityproblemsthatwedescribeelsewhere.AndincontrasttonormalyearswhenTexaswindgenerateshighcapacityfactorsinwinter,TexaswindoutputcollapsedthisFebruary.However,asshowninthetableonthepriorpage,awinddeclinewassomethingERCOThadplannedfor;thelargerandsuddencollapseinnaturalgasgenerationwasnot.Asaresult,theoutageisprimarilyanaturalgasstoryandtosayotherwiseindicatestomethatsomeonehasanagendathey’repushing.TheTexasoutageanditsmisdiagnosesareonereasonIwritethispapereveryyear:aslongasthere’smisinformation36aboutenergyoutthere(whetheraccidentalorintentional),there’sstillmoreworktodo.Seeyounextyear.0%10%20%30%40%50%JanFebMarAprMayJunJulAugSepOctNovDecTexaswindvsCaliforniasolarcapacityfactorsbymonth%,2019capacityfactorSource:EIA.2019.TexaswindCaliforniasolar36MisinformationinTexaswasnotconfinedtoenergyin2021.TwoofthemoreabsurdelectionlawsuitswerefiledinTexasthisyear.TheyrhymewithcontentionsthatwindwastheprimaryissueintheTexaspoweroutage.[1]AnoriginaljurisdictionSupremeCourtcasefiledbyTexasAGPaxtonwhichallegedthatotherstatesviolatedTexasrightsbyusingnon-legislativemeanstochangeelectionrules.UTprofessorStephenVladeckcalledthesuitthe“craziest”lawsuitfiledduringtheelectionseason,andelectionlawexpertRickHasenatUCIrvinecharacterizeditas“thedumbestcaseI'veeverseenfiledonanemergencybasisattheSupremeCourt”.[2]ThelawsuitfiledbyTexasRepGohmertwhichpetitionedtheUSDistrictCourtforEasternTexastograntVPPencethe“exclusiveauthorityandsolediscretionunderthe12thAmendmenttodeterminewhichslatesofelectorsforaState,orneither,maybecounted”.ConstitutionalscholarNedFoleyatOhioStatedescribedthesuitas“breathtakingandpreposterous”;eventheTrumpDoJdescribeditasa“walkinglegalcontradiction”.39“Whatabout…”AnswerstoclientenergyquestionsWhataboutlowenergynuclearreactionswhicharesupposedtoproduceenergyatroomtemperature?Currently,LENRdoesnotmeetourcommercializationtest.Iwillwriteaboutitwhen/ifacommercialapplicationgivesoffsubstantiallevelsofheatwithoutradiation.There’sstillplentyofskepticism:inMay2019,researchersfromBritishColumbia,MIT,Maryland,LawrenceBerkeleyNationalLaboratoryandGooglerevisitedLENRandfailedtofindevidenceoffusionorheat.WhataboutthatSaudigreenhydrogenplantunderconstruction?SaudiArabiaisbuildingahydrogenplantpoweredby4GWofwindandsolartoproduce650tonnesofgreenhydrogendailyin2025.Mosthydrogenisusedtodayinoilandgasrefiningtoremovesulfurortoproduceammonia,80%ofwhichisusedasfertilizer.TheSaudiplant’sgreenhydrogenoutputwillbejust0.3%ofglobal“brown”hydrogengeneratedviasteamreformationofnaturalgas.Somepeopleenvisionhydrogenusedinstationaryfuelcellsforbackupelectricitygeneration.So,nowlet’slookatitthisway:assuming60%roundtripfuelcellefficiency,theSaudifacility’soutputcouldinsteadbeusedtogenerate4.74TWhperyear.Thatwouldrepresentjust1.3%ofSaudielectricityconsumptionand0.018%ofglobalelectricityconsumption.Whataboutsustainableaviationfuelsandrenewablenaturalgas?Sustainableaviationfuels(SAF)aremadefromusedcookingoils,solidwasteandfoodwaste.They’reexpensivetoproducegiventheaggregationanddistillationrequired,andcurrentlycost2xregularjetfuel.In2019,lessthan200,000metrictonsofSAFwereproducedglobally,equaltolessthan0.1%ofcommercialairlinesjetfuelconsumption.EvenifallannouncedSAFprojectswerecompleted,volumeswouldreachjust~1%ofexpectedglobaljetfueldemandin203037.So,nothingtogettooexcitedaboutyet.Samegoesforrenewablenaturalgas(RNG).USRNGvolumesare200-300mmgallonsperyear.AccordingtoPlatts,potentialfromUSlandfillsis2.9billiongasolinegallonequivalents(GGE)peryear,whileNRELestimatespotentialat4.8billionGGEperyearfromlandfills,agriculturalwaste,wastewaterandotherorganicwaste.In2019,142billiongallonsofgasolinewereconsumedintheUS.So,evenifRNGfromalllandfillsandothersiteswerechanneledintocentralprocessingfacilities,RNGcouldoffset~2.5%ofannualUSgasolinedemand.Similarpercentagesapplytorenewabledieselmadefromanimalfats,wasteandusedcookingoilsonaglobalscale.Germanyhasbeenconvertingwastetoenergyaswellusingbiogasfromcrops,wasteandlandfillstogenerateelectricity.Thisisnotcheap,nearly20cents/kWhcomparedto9cents/kWhforonshoreGermanwind.Renewableenergysolutionsthatcontribute1%-3%ofagivenfuelsupplyafteradecadeormoreofinvestmentathighcostentailcarbonreductionsthatcouldmuchmorereadilybeachievedbyretiringold,lessenergy-efficientequipment,pricingkilometersflownordrivenclosertotheirtrueall-incost,investinginlightervehiclematerialsandmostofall,puttingcurbweightlimitsonsportutilityvehiclesastheiradoptionspreadsglobally.Whataboutelectrifyingtheworld’scontainerships?Thefirstonewasscheduledtobeginoperatingin2020butwasdelayedbyCOVID.Itsspecifications:capableofcarrying120twentyfootequivalentunits(TEUs)ataspeedof6knotsfor30nauticalmiles.ComparethattoMaersk’sTriple-Eclassshipswhichcarry150xasmuchcargooverdistances400xgreateratspeeds3x-4xfaster.WhatwouldittaketomakeanelectricversionofMaersk’sship,matchingitsspeedandperformance?Evenwhenincorporatingthehigherefficiencyofelectricmotors,usingtoday’sstateoftheartelectricbatterieswith300Wh/kgofenergydensity,theelectricversionoftheMaerskshipwouldhavetodedicate40%ofitscargocapacitytothebatteriesthemselves(obviouslyaneconomicnon-starter)38.Ortoputitanotherway:anelectricshipwhosebatteriesandmotorsweighednomorethanthefuelanddieselengineintoday’scontainershipswouldneedbatteryenergydensitiestoimproveby10xvscurrentlevels.Finalbitofcontext:inthepast70years,energydensitiesofthebestcommercialbatterieshaven’tevenquadrupled.37“SustainableAviationFuelsasaPathwaytoNet-ZeroAviation”,KevinSoublyetal,McKinsey/WEF,2020.38Smil,V.2019.“Electriccontainershipsareahardsail”.IEEESpectrumMarch2019:22.40WhataboutMSCI’scarbonaccountingideaforportfolioinvestors:aratioofemissionstosales?MSCI’scarbonaccountingapproachforportfolioinvestorsusesanintensitymeasurebasedontheratioofacompany’semissionstosales39.Iunderstandwhatitscreatorsaretryingtodo:ifacompanygrowsrevenueswhilekeepingitscarbonfootprintthesame,thismayindicatethatthecompanyhasfiguredouthowtoimproveitsenergyefficiency.Sorry,butIstillhavealotofquestions.•Twopharmaceuticalcompanieshavethesameemissionsfootprint,exceptCompanyAisintheUSandchargesalotmoreforthesameexactdrugsthatCompanyBsellsinGermany,whosegov’tnegotiatesdrugpricesaspartofitssinglepayersystem.IfIsellCompanyBstockandbuyCompanyAstock,myportfoliocarbonaccountingwillimprovefornoclimate-relatedreasonatall,right?•Imanageafundthatinvestsincompaniesthatproducecement,steel,glass,rubberandplastic;inotherwords,thematerialsthatmakemodernenergy-efficientmegacitiespossible.CompanyAisanindustrialcompanyinFrance,whileCompanyBmakesthesameproductsandislocatedinItaly.IsellmyCompanyBstockandbuyCompanyAstock.MyportfoliocarbonaccountingimprovessinceFrance’sgridismorereliantonnuclearpowerwhileItalyismorereliantonfossilfuels.ShouldCompanyBbe“penalized”bycapitalallocatorsduetosomethingcompletelyoutsidethecompany’scontrol?•I’masmallcapmanagerwitha3%trackingerrorbudgetvstheRussell2000,whileFirmB’sbudgetis7%.ThisallowedFirmBtorunalargerunderweighttoenergythanIdidfrom2019to2020.IsBarron’sgoingtowriteanarticleonsmallcapmanagerssayingthatIdon’tpayenoughattentiontoclimateissueslikeFirmBdoes,eventhoughtheresultsaretheby-productoftemporarysectorpreferences?•Arecessionhitsandtherevenuesofthecompaniesinmyportfoliodropby20%whiletheiremissionsdropby5%.AremystakeholdersgoingtoaskmeifIhavelostmyfocusonclimateissues?There’salotofgoodthatcancomefrommoreaccurateaccountingofemissions.Inourassetmanagementbusiness,weusequantitativeandqualitativesignalstoinformourclimatejudgmentsofcompanies.Manysimplifiedaccountingformulasdon’tseparateclimateissuesthatcompaniescontrolvsonestheydon’t,andmayconveysignalstoinvestorsthatarenotinlinewithsustainabledecarbonizationgoals.39TheformulaisbasedontheratioofScope1emissionsplusScope2emissions,dividedbythecompany’ssales.Scope1referstodirectemissions,forexampleresultingfromon-sitefossilfuelcombustion.Scope2referstoindirectemissions,forexampleresultingfrompurchaseofelectricityfromautility.See“Carbonfootprintingmethodologyforunderwritingportfolios”,CROForum(Netherlands),April2020;and“MSCICarbonFootprintIndexRatiosMethodology”,MSCI,January2018.41IMPORTANTINFORMATIONTheviews,opinionsandestimatesexpressedhereinconstituteMichaelCembalest’sjudgmentbasedoncurrentmarketconditionsandaresubjecttochangewithoutnotice.InformationhereinmaydifferfromthoseexpressedbyotherareasofJ.P.Morgan.ThisinformationinnowayconstitutesJ.P.MorganResearchandshouldnotbetreatedassuch.Theviewscontainedhereinarenottobetakenasadviceorarecommendationtobuyorsellanyinvestmentinanyjurisdiction,norisitacommitmentfromJ.P.Morganoranyofitssubsidiariestoparticipateinanyofthetransactionsmentionedherein.Anyforecasts,figures,opinionsorinvestmenttechniquesandstrategiessetoutareforinformationpurposesonly,basedoncertainassumptionsandcurrentmarketconditionsandaresubjecttochangewithoutpriornotice.Allinformationpresentedhereinisconsideredtobeaccurateatthetimeofproduction.Thismaterialdoesnotcontainsufficientinformationtosupportaninvestmentdecisionanditshouldnotberelieduponbyyouinevaluatingthemeritsofinvestinginanysecuritiesorproducts.Inaddition,usersshouldmakeanindependentassessmentofthelegal,regulatory,tax,creditandaccountingimplicationsanddetermine,togetherwiththeirownprofessionaladvisers,ifanyinvestmentmentionedhereinisbelievedtobesuitabletotheirpersonalgoals.Investorsshouldensurethattheyobtainallavailablerelevantinformationbeforemakinganyinvestment.Itshouldbenotedthatinvestmentinvolvesrisks,thevalueofinvestmentsandtheincomefromthemmayfluctuateinaccordancewithmarketconditionsandtaxationagreementsandinvestorsmaynotgetbackthefullamountinvested.Bothpastperformanceandyieldsarenotreliableindicatorsofcurrentandfutureresults.Non-affiliatedentitiesmentionedareforinformationalpurposesonlyandshouldnotbeconstruedasanendorsementorsponsorshipofJ.P.MorganChase&Co.oritsaffiliates.ForJ.P.MorganAssetManagementClients:J.P.MorganAssetManagementisthebrandfortheassetmanagementbusinessofJPMorganChase&Co.anditsaffiliatesworldwide.Totheextentpermittedbyapplicablelaw,wemayrecordtelephonecallsandmonitorelectroniccommunicationstocomplywithourlegalandregulatoryobligationsandinternalpolicies.Personaldatawillbecollected,storedandprocessedbyJ.P.MorganAssetManagementinaccordancewithourprivacypoliciesathttps://am.jpmorgan.com/global/privacy.ACCESSIBILITYForU.S.only:Ifyouareapersonwithadisabilityandneedadditionalsupportinviewingthematerial,pleasecallusat1-800-343-1113forassistance.Thiscommunicationisissuedbythefollowingentities:IntheUnitedStates,byJ.P.MorganInvestmentManagementInc.orJ.P.MorganAlternativeAssetManagement,Inc.,bothregulatedbytheSecuritiesandExchangeCommission;inLatinAmerica,forintendedrecipients’useonly,bylocalJ.P.Morganentities,asthecasemaybe.;inCanada,forinstitutionalclients’useonly,byJPMorganAssetManagement(Canada)Inc.,whichisaregisteredPortfolioManagerandExemptMarketDealerinallCanadianprovincesandterritoriesexcepttheYukonandisalsoregisteredasanInvestmentFundManagerinBritishColumbia,Ontario,QuebecandNewfoundlandandLabrador.IntheUnitedKingdom,byJPMorganAssetManagement(UK)Limited,whichisauthorizedandregulatedbytheFinancialConductAuthority;inotherEuropeanjurisdictions,byJPMorganAssetManagement(Europe)S.àr.l.InAsiaPacific(“APAC”),bythefollowingissuingentitiesandintherespectivejurisdictionsinwhichtheyareprimarilyregulated:JPMorganAssetManagement(AsiaPacific)Limited,orJPMorganFunds(Asia)Limited,orJPMorganAssetManagementRealAssets(Asia)Limited,eachofwhichisregulatedbytheSecuritiesandFuturesCommissionofHongKong;JPMorganAssetManagement(Singapore)Limited(Co.Reg.No.197601586K),whichthisadvertisementorpublicationhasnotbeenreviewedbytheMonetaryAuthorityofSingapore;JPMorganAssetManagement(Taiwan)Limited;JPMorganAssetManagement(Japan)Limited,whichisamemberoftheInvestmentTrustsAssociation,Japan,theJapanInvestmentAdvisersAssociation,TypeIIFinancialInstrumentsFirmsAssociationandtheJapanSecuritiesDealersAssociationandisregulatedbytheFinancialServicesAgency(registrationnumber“KantoLocalFinanceBureau(FinancialInstrumentsFirm)No.330”);inAustralia,towholesaleclientsonlyasdefinedinsection761Aand761GoftheCorporationsAct2001(Commonwealth),byJPMorganAssetManagement(Australia)Limited(ABN55143832080)(AFSL376919).ForallothermarketsinAPAC,tointendedrecipientsonly.ForJ.P.MorganPrivateBankClients:ACCESSIBILITYJ.P.Morganiscommittedtomakingourproductsandservicesaccessibletomeetthefinancialservicesneedsofallourclients.PleasedirectanyaccessibilityissuestothePrivateBankClientServiceCenterat1-866-265-1727.LEGALENTITY,BRAND®ULATORYINFORMATIONIntheUnitedStates,bankdepositaccountsandrelatedservices,suchaschecking,savingsandbanklending,areofferedbyJPMorganChaseBank,N.A.MemberFDIC.JPMorganChaseBank,N.A.anditsaffiliates(collectively“JPMCB”)offerinvestmentproducts,whichmayincludebank-managedinvestmentaccountsandcustody,aspartofitstrustandfiduciaryservices.Otherinvestmentproductsandservices,suchasbrokerageandadvisoryaccounts,areofferedthroughJ.P.MorganSecuritiesLLC(“JPMS”),amemberofFINRAandSIPC.AnnuitiesaremadeavailablethroughChaseInsuranceAgency,Inc.(CIA),alicensedinsuranceagency,doingbusinessasChaseInsuranceAgencyServices,Inc.inFlorida.JPMCB,JPMSandCIAareaffiliatedcompaniesunderthecommoncontrolofJPMorganChase&Co.Productsnotavailableinallstates.InLuxembourg,thismaterialisissuedbyJ.P.MorganBankLuxembourgS.A.(JPMBL),withregisteredofficeatEuropeanBankandBusinessCentre,6routedeTreves,L-2633,Senningerberg,Luxembourg.R.C.SLuxembourgB10.958.AuthorisedandregulatedbyCommissiondeSurveillanceduSecteurFinancier(CSSF)andjointlysupervisedbytheEuropeanCentralBank(ECB)andtheCSSF.J.P.MorganBankLuxembourgS.A.isauthorizedasacreditinstitutioninaccordancewiththeLawof5thApril1993.IntheUnitedKingdom,thismaterialisissuedbyJ.P.MorganBankLuxembourgS.A–LondonBranch.PriortoBrexit,(BrexitmeaningthattheUKleavestheEuropeanUnionunderArticle50oftheTreatyonEuropeanUnion,or,iflater,losesitsabilitytopassportfinancialservicesbetweentheUKandtheremainderoftheEEA),J.P.MorganBankLuxembourgS.A–LondonBranchissubjecttolimitedregulationbytheFinancialConductAuthorityandthePrudentialRegulationAuthority.DetailsabouttheextentofourregulationbytheFinancialConductAuthorityandthePrudentialRegulationAuthorityareavailablefromusonrequest.IntheeventofBrexit,intheUK,J.P.MorganBankLuxembourgS.A.–LondonBranchisauthorisedbythePrudentialRegulationAuthority,subjecttoregulationbytheFinancialConductAuthorityandlimitedregulationbythePrudentialRegulationAuthority.DetailsabouttheextentofourregulationbythePrudentialRegulationAuthorityareavailablefromusonrequest.InSpain,thismaterialisdistributedbyJ.P.MorganBankLuxembourgS.A.,SucursalenEspaña,withregisteredofficeatPaseodelaCastellana,31,28046Madrid,Spain.J.P.MorganBankLuxembourgS.A.,SucursalenEspañaisregisteredundernumber1516withintheadministrativeregistryoftheBankofSpainandsupervisedbytheSpanishSecuritiesMarketCommission(CNMV).InGermany,thismaterialisdistributedbyJ.P.MorganBankLuxembourgS.A.,FrankfurtBranch,registeredofficeatTaunustor1(TaunusTurm),60310Frankfurt,Germany,jointlysupervisedbytheCommissiondeSurveillanceduSecteurFinancier(CSSF)andtheEuropeanCentralBank(ECB),andincertainareasalsosupervisedbytheBundesanstaltfürFinanzdienstleistungsaufsicht(BaFin).InItaly,thismaterialisdistributedbyJ.P.MorganBankLuxembourgS.A–MilanBranch,registeredofficeatViaCatenaAdalberto4,Milan20121,ItalyandregulatedbyBankofItalyandtheCommissioneNazionaleperleSocietàelaBorsa(CONSOB).IntheNetherlands,thismaterialisdistributedbyJ.P.MorganBankLuxembourgS.A.,AmsterdamBranch,withregisteredofficeatWorldTrade42Centre,TowerB,Strawinskylaan1135,1077XX,Amsterdam,TheNetherlands.J.P.MorganBankLuxembourgS.A.,AmsterdamBranchisauthorisedandregulatedbytheCommissiondeSurveillanceduSecteurFinancier(CSSF)andjointlysupervisedbytheEuropeanCentralBank(ECB)andtheCSSFinLuxembourg;J.P.MorganBankLuxembourgS.A.,AmsterdamBranchisalsoauthorisedandsupervisedbyDeNederlandscheBank(DNB)andtheAutoriteitFinanciëleMarkten(AFM)intheNetherlands.RegisteredwiththeKamervanKoophandelasabranchofJ.P.MorganBankLuxembourgS.A.underregistrationnumber71651845.InDenmark,thismaterialisdistributedbyJ.P.MorganBankLuxembourg,CopenhagenBr,filialafJ.P.MorganBankLuxembourgS.A.withregisteredofficeatKalvebodBrygge39-41,1560KøbenhavnV,Denmark.J.P.MorganBankLuxembourg,CopenhagenBr,filialafJ.P.MorganBankLuxembourgS.A.isauthorisedandregulatedbyCommissiondeSurveillanceduSecteurFinancier(CSSF)andjointlysupervisedbytheEuropeanCentralBank(ECB)andtheCSSF.J.P.MorganBankLuxembourg,CopenhagenBr,filialafJ.P.MorganBankLuxembourgS.A.isalsosubjecttothesupervisionofFinanstilsynet(DanishFSA)andregisteredwithFinanstilsynetasabranchofJ.P.MorganBankLuxembourgS.A.undercode29009.InSweden,thismaterialisdistributedbyJ.P.MorganBankLuxembourgS.A.-StockholmBankfilial,withregisteredofficeatHamngatan15,Stockholm,11147,Sweden.J.P.MorganBankLuxembourgS.A.-StockholmBankfilialisauthorisedandregulatedbyCommissiondeSurveillanceduSecteurFinancier(CSSF)andjointlysupervisedbytheEuropeanCentralBank(ECB)andtheCSSF.J.P.MorganBankLuxembourgS.A.,StockholmBranchisalsosubjecttothesupervisionofFinansinspektionen(SwedishFSA).RegisteredwithFinansinspektionenasabranchofJ.P.MorganBankLuxembourgS.A..InFrance,thismaterialisdistributedbyJPMorganChaseBank,N.A.(“JPMCB”),Parisbranch,whichisregulatedbytheFrenchbankingauthoritiesAutoritédeContrôlePrudentieletdeRésolutionandAutoritédesMarchésFinanciers.InSwitzerland,thismaterialisdistributedbyJ.P.Morgan(Suisse)SA,whichisregulatedinSwitzerlandbytheSwissFinancialMarketSupervisoryAuthority(FINMA).InHongKong,thismaterialisdistributedbyJPMCB,HongKongbranch.JPMCB,HongKongbranchisregulatedbytheHongKongMonetaryAuthorityandtheSecuritiesandFuturesCommissionofHongKong.InHongKong,wewillceasetouseyourpersonaldataforourmarketingpurposeswithoutchargeifyousorequest.InSingapore,thismaterialisdistributedbyJPMCB,Singaporebranch.JPMCB,SingaporebranchisregulatedbytheMonetaryAuthorityofSingapore.DealingandadvisoryservicesanddiscretionaryinvestmentmanagementservicesareprovidedtoyoubyJPMCB,HongKong/Singaporebranch(asnotifiedtoyou).BankingandcustodyservicesareprovidedtoyoubyJPMCBSingaporeBranch.ThecontentsofthisdocumenthavenotbeenreviewedbyanyregulatoryauthorityinHongKong,Singaporeoranyotherjurisdictions.ThisadvertisementhasnotbeenreviewedbytheMonetaryAuthorityofSingapore.JPMorganChaseBank,N.A.,anationalbankingassociationcharteredunderthelawsoftheUnitedStates,andasabodycorporate,itsshareholder’sliabilityislimited.JPMorganChaseBank,N.A.(JPMCBNA)(ABN43074112011/AFSLicenceNo:238367)isregulatedbytheAustralianSecuritiesandInvestmentCommissionandtheAustralianPrudentialRegulationAuthority.MaterialprovidedbyJPMCBNAinAustraliaisto“wholesaleclients”only.Forthepurposesofthisparagraphtheterm“wholesaleclient”hasthemeaninggiveninsection761GoftheCorporationsAct2001(Cth).PleaseinformusifyouarenotaWholesaleClientnoworifyouceasetobeaWholesaleClientatanytimeinthefuture.JPMSisaregisteredforeigncompany(overseas)(ARBN109293610)incorporatedinDelaware,U.S.A.UnderAustralianfinancialserviceslicensingrequirements,carryingonafinancialservicesbusinessinAustraliarequiresafinancialserviceprovider,suchasJ.P.MorganSecuritiesLLC(JPMS),toholdanAustralianFinancialServicesLicence(AFSL),unlessanexemptionapplies.JPMSisexemptfromtherequirementtoholdanAFSLundertheCorporationsAct2001(Cth)(Act)inrespectoffinancialservicesitprovidestoyou,andisregulatedbytheSEC,FINRAandCFTCunderUSlaws,whichdifferfromAustralianlaws.MaterialprovidedbyJPMSinAustraliaisto“wholesaleclients”only.Theinformationprovidedinthismaterialisnotintendedtobe,andmustnotbe,distributedorpassedon,directlyorindirectly,toanyotherclassofpersonsinAustralia.Forthepurposesofthisparagraphtheterm“wholesaleclient”hasthemeaninggiveninsection761GoftheAct.PleaseinformusimmediatelyifyouarenotaWholesaleClientnoworifyouceasetobeaWholesaleClientatanytimeinthefuture.ThismaterialhasnotbeenpreparedspecificallyforAustralianinvestors.It:maycontainreferencestodollaramountswhicharenotAustraliandollars;maycontainfinancialinformationwhichisnotpreparedinaccordancewithAustralianlaworpractices;maynotaddressrisksassociatedwithinvestmentinforeigncurrencydenominatedinvestments;anddoesnotaddressAustraliantaxissues.WithrespecttocountriesinLatinAmerica,thedistributionofthismaterialmayberestrictedincertainjurisdictions.Wemayofferand/orselltoyousecuritiesorotherfinancialinstrumentswhichmaynotberegisteredunder,andarenotthesubjectofapublicofferingunder,thesecuritiesorotherfinancialregulatorylawsofyourhomecountry.Suchsecuritiesorinstrumentsareofferedand/orsoldtoyouonaprivatebasisonly.Anycommunicationbyustoyouregardingsuchsecuritiesorinstruments,includingwithoutlimitationthedeliveryofaprospectus,termsheetorotherofferingdocument,isnotintendedbyusasanoffertosellorasolicitationofanoffertobuyanysecuritiesorinstrumentsinanyjurisdictioninwhichsuchanofferorasolicitationisunlawful.Furthermore,suchsecuritiesorinstrumentsmaybesubjecttocertainregulatoryand/orcontractualrestrictionsonsubsequenttransferbyyou,andyouaresolelyresponsibleforascertainingandcomplyingwithsuchrestrictions.Totheextentthiscontentmakesreferencetoafund,theFundmaynotbepubliclyofferedinanyLatinAmericancountry,withoutpreviousregistrationofsuchfund´ssecuritiesincompliancewiththelawsofthecorrespondingjurisdiction.Publicofferingofanysecurity,includingthesharesoftheFund,withoutpreviousregistrationatBrazilianSecuritiesandExchangeCommission–CVMiscompletelyprohibited.SomeproductsorservicescontainedinthematerialsmightnotbecurrentlyprovidedbytheBrazilianandMexicanplatforms.Referencesto“J.P.Morgan”aretoJPM,itssubsidiariesandaffiliatesworldwide.“J.P.MorganPrivateBank”isthebrandnamefortheprivatebankingbusinessconductedbyJPM.Thismaterialisintendedforyourpersonaluseandshouldnotbecirculatedtoorusedbyanyotherperson,orduplicatedfornon-personaluse,withoutourpermission.Ifyouhaveanyquestionsornolongerwishtoreceivethesecommunications,pleasecontactyourJ.P.Morganrepresentative.©2021JPMorganChase&Co.Allrightsreserved.