2021年全球气候状况报告(英)-世界气象组织VIP专享VIP免费

State of the Global Climate
2021
WMO-No. 1290
WEATHER CLIMATE WATER
B
WMO-No. 1290
© World Meteorological Organization, 2022
The right of publication in print, electronic and any other form and in any language is reserved by WMO.
Short extracts from WMO publications may be reproduced without authorization, provided that the complete source
is clearly indicated. Editorial correspondence and requests to publish, reproduce or translate this publication in
part or in whole should be addressed to:
Chair, Publications Board
World Meteorological Organization (WMO)
7 bis, avenue de la Paix Tel.: +41 (0) 22 730 84 03
P.O. Box 2300 Fax: +41 (0) 22 730 81 17
CH-1211 Geneva 2, Switzerland Email: publications@wmo.int
ISBN 978-92-63-11290-3
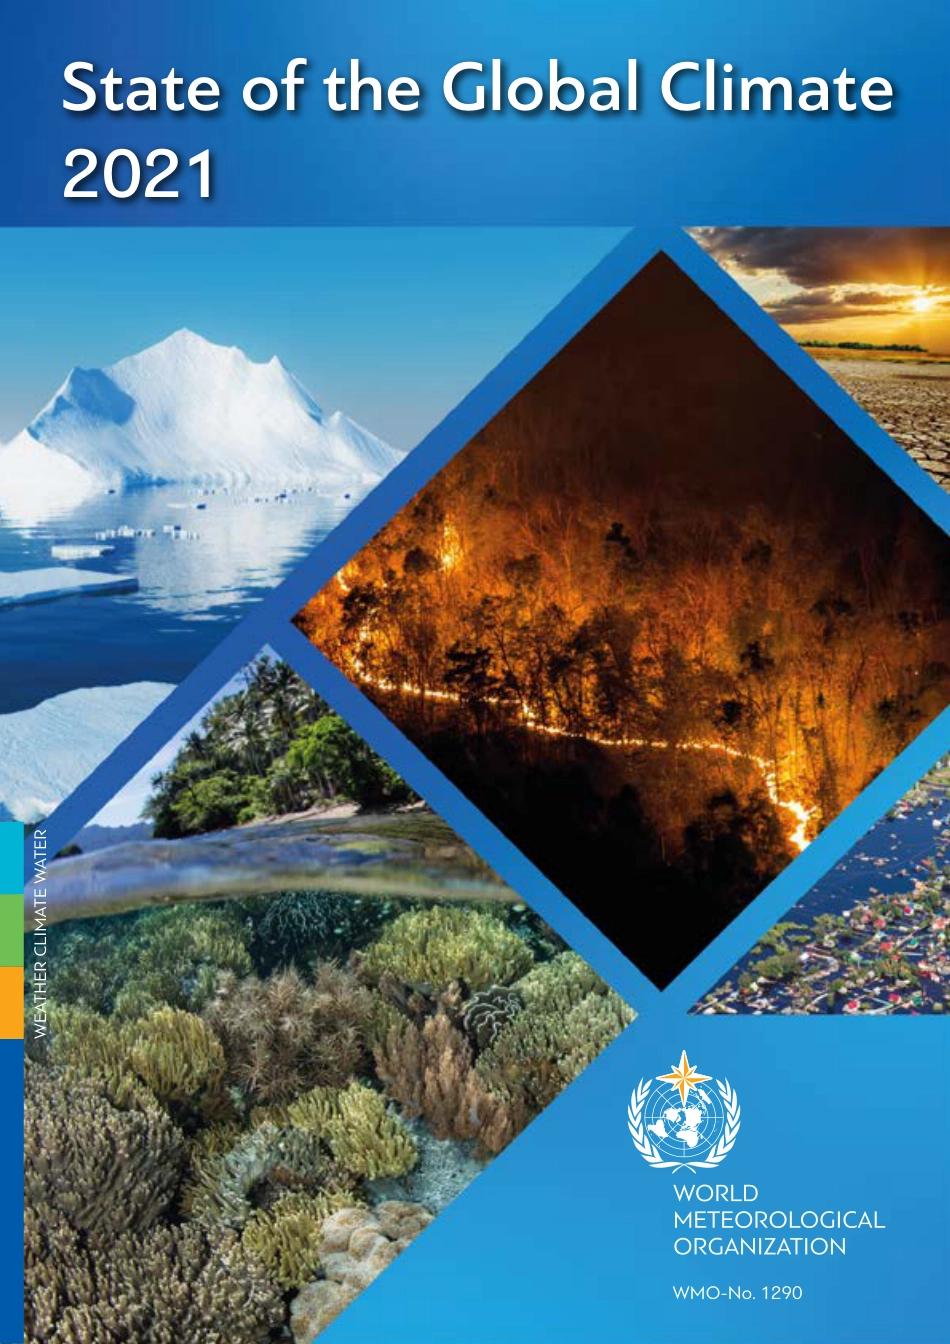
Cover illustration from Adobe Stock: Icebergs (Photo credits: z576); Forest fires, red and orange forest fires at night in the dry season (Photo credits:
prirach); Shallow Coral Reef and Island in Raja Ampat (Photo credits: ead72); Flooded terrain in lowlend of Great river (Photo credits: Vladimir Mel-
nikov). iSTOCK: Terre de sécheresse au coucher du soleil. Ciel dramatique de désert. changement climatique (Photo credits: mycola).
NOTE
The designations employed in WMO publications and the presentation of material in this publication do not imply the expression of any opinion
whatsoever on the part of WMO concerning the legal status of any country, territory, city or area, or of its authorities, or concerning the delimitation
of its frontiers or boundaries.
The mention of specific companies or products does not imply that they are endorsed or recommended by WMO in preference to others of a similar
nature which are not mentioned or advertised.
The findings, interpretations and conclusions expressed in WMO publications with named authors are those of the authors alone and do not necessarily
reflect those of WMO or its Members.
1
Contents
Key messages. . . . . . . . . . . . . . . . . . . . . . . . . . . . . . . . . . . . . . . . . . . 2
Foreword . . . . . . . . . . . . . . . . . . . . . . . . . . . . . . . . . . . . . . . . . . . . . 3
Global climate indicators . . . . . . . . . . . . . . . . . . . . . . . . . . . . . . . . . . . . 4
Baselines. . . . . . . . . . . . . . . . . . . . . . . . . . . . . . . . . . . . . . . . . . . . 4
Greenhouse gases . . . . . . . . . . . . . . . . . . . . . . . . . . . . . . . . . . . . . . 4
Temperature . . . . . . . . . . . . . . . . . . . . . . . . . . . . . . . . . . . . . . . . . . 6
Ocean . . . . . . . . . . . . . . . . . . . . . . . . . . . . . . . . . . . . . . . . . . . . . 7
Cryosphere . . . . . . . . . . . . . . . . . . . . . . . . . . . . . . . . . . . . . . . . . .12
Stratospheric ozone . . . . . . . . . . . . . . . . . . . . . . . . . . . . . . . . . . . . . .19
Drivers of short-term variability . . . . . . . . . . . . . . . . . . . . . . . . . . . . . . .20
High-impact events in 2021 . . . . . . . . . . . . . . . . . . . . . . . . . . . . . . . . . . .24
Heatwaves and wildfires . . . . . . . . . . . . . . . . . . . . . . . . . . . . . . . . . . .24
Cold spells and snow . . . . . . . . . . . . . . . . . . . . . . . . . . . . . . . . . . . . .25
Precipitation . . . . . . . . . . . . . . . . . . . . . . . . . . . . . . . . . . . . . . . . . .26
Flood . . . . . . . . . . . . . . . . . . . . . . . . . . . . . . . . . . . . . . . . . . . . . .27
Drought . . . . . . . . . . . . . . . . . . . . . . . . . . . . . . . . . . . . . . . . . . . .28
Tropical cyclones . . . . . . . . . . . . . . . . . . . . . . . . . . . . . . . . . . . . . . .29
Severe storms . . . . . . . . . . . . . . . . . . . . . . . . . . . . . . . . . . . . . . . . .31
Attribution . . . . . . . . . . . . . . . . . . . . . . . . . . . . . . . . . . . . . . . . . . .31
Risks and impacts . . . . . . . . . . . . . . . . . . . . . . . . . . . . . . . . . . . . . . . .33
Food security . . . . . . . . . . . . . . . . . . . . . . . . . . . . . . . . . . . . . . . . .33
Humanitarian impacts and population displacement . . . . . . . . . . . . . . . . . . .35
Climate impacts on ecosystems . . . . . . . . . . . . . . . . . . . . . . . . . . . . . . .38
Northern hemisphere summer extremes: the role of the quasi-stationary Northern hemisphere summer extremes: the role of the quasi-stationary
planetary waves and the Arctic warming amplification planetary waves and the Arctic warming amplification . . . . . . . . . . . . . . . . . . . . . . . . . . . . . . . . . . . . . . . . . . 4040
Observational basis for climate monitoringObservational basis for climate monitoring . . . . . . . . . . . . . . . . . . . . . . . . . . . . . . . . . . . . . . . . . . . . . . . . . . . . . . 4444
Can sub-seasonal-to-seasonal predictions improve disaster risk preparedness for Can sub-seasonal-to-seasonal predictions improve disaster risk preparedness for
theSouth-east Asiaregion? A review of the 2026 September 2021 case studytheSouth-east Asiaregion? A review of the 2026 September 2021 case study . . . . . . . . . . . . . . 4646
Data sets and methods . . . . . . . . . . . . . . . . . . . . . . . . . . . . . . . . . . . . .47
List of contributors . . . . . . . . . . . . . . . . . . . . . . . . . . . . . . . . . . . . . . . .53
StateoftheGlobalClimate2021WMO-No.1290WEATHERCLIMATEWATERBWMO-No.1290©WorldMeteorologicalOrganization,2022Therightofpublicationinprint,electronicandanyotherformandinanylanguageisreservedbyWMO.ShortextractsfromWMOpublicationsmaybereproducedwithoutauthorization,providedthatthecompletesourceisclearlyindicated.Editorialcorrespondenceandrequeststopublish,reproduceortranslatethispublicationinpartorinwholeshouldbeaddressedto:Chair,PublicationsBoardWorldMeteorologicalOrganization(WMO)7bis,avenuedelaPaixTel.:+41(0)227308403P.O.Box2300Fax:+41(0)227308117CH-1211Geneva2,SwitzerlandEmail:publications@wmo.intISBN978-92-63-11290-3CoverillustrationfromAdobeStock:Icebergs(Photocredits:z576);Forestfires,redandorangeforestfiresatnightinthedryseason(Photocredits:prirach);ShallowCoralReefandIslandinRajaAmpat(Photocredits:ead72);FloodedterraininlowlendofGreatriver(Photocredits:VladimirMel-nikov).iSTOCK:Terredesécheresseaucoucherdusoleil.Cieldramatiquededésert.changementclimatique(Photocredits:mycola).NOTEThedesignationsemployedinWMOpublicationsandthepresentationofmaterialinthispublicationdonotimplytheexpressionofanyopinionwhatsoeveronthepartofWMOconcerningthelegalstatusofanycountry,territory,cityorarea,orofitsauthorities,orconcerningthedelimitationofitsfrontiersorboundaries.ThementionofspecificcompaniesorproductsdoesnotimplythattheyareendorsedorrecommendedbyWMOinpreferencetoothersofasimilarnaturewhicharenotmentionedoradvertised.Thefindings,interpretationsandconclusionsexpressedinWMOpublicationswithnamedauthorsarethoseoftheauthorsaloneanddonotnecessarilyreflectthoseofWMOoritsMembers.1ContentsKeymessages...........................................2Foreword..............................................3Globalclimateindicators.....................................4Baselines............................................4Greenhousegases.......................................4Temperature..........................................6Ocean..............................................7Cryosphere..........................................12Stratosphericozone.....................................19Driversofshort-termvariability...............................20High-impacteventsin2021..................................24Heatwavesandwildfires...................................24Coldspellsandsnow.....................................25Precipitation..........................................26Flood..............................................27Drought............................................28Tropicalcyclones.......................................29Severestorms.........................................31Attribution...........................................31Risksandimpacts........................................33Foodsecurity.........................................33Humanitarianimpactsandpopulationdisplacement...................35Climateimpactsonecosystems...............................38Northernhemispheresummerextremes:theroleofthequasi-stationaryNorthernhemispheresummerextremes:theroleofthequasi-stationaryplanetarywavesandtheArcticwarmingamplificationplanetarywavesandtheArcticwarmingamplification..........................................4040ObservationalbasisforclimatemonitoringObservationalbasisforclimatemonitoring........................................................4444Cansub-seasonal-to-seasonalpredictionsimprovedisasterriskpreparednessforCansub-seasonal-to-seasonalpredictionsimprovedisasterriskpreparednessfortheSouth-eastAsiaregion?Areviewofthe20–26September2021casestudytheSouth-eastAsiaregion?Areviewofthe20–26September2021casestudy................4646Datasetsandmethods.....................................47Listofcontributors.......................................532KeymessagesTheglobalmeantemperaturein2021wasaround1.11±0.13°Cabovethe1850–1900pre‑industrialaverage.ThisislesswarmthansomerecentyearsduetotheinfluenceofLaNiñaconditionsatthestartandendoftheyear.Themostrecentsevenyears,2015to2021,werethesevenwarmestyearsonrecord.Globalmeansealevelreachedanewrecordhighin2021,risinganaverageof4.5mmperyearovertheperiod2013–2021.TheAntarcticozoneholereachedamaximumareaof24.8millionkm2in2021.Thisunusuallydeepandlargeozoneholewasdrivenbyastrongandstablepolarvortexandcolder-than-averageconditionsinthelowerstratosphere.Greenlandexperiencedanexceptionalmid-Augustmelteventandthefirst-everrecordedrainfallatSummitStation,thehighestpointontheGreenlandicesheetatanaltitudeof3216m.ExceptionalheatwavesbrokerecordsacrosswesternNorthAmericaandtheMediterranean.DeathValley,Californiareached54.4°Con9July,equallingasimilar2020valueasthehighestrecordedintheworldsinceatleastthe1930s,andSyracuseinSicilyreached48.8°C.HurricaneIdawasthemostsignificantoftheNorthAtlanticseason,makinglandfallinLouisianaon29August,equallingthestrongestlandfallonrecordforthestate,witheconomiclossesintheUnitedStatesestimatedatUS$75billion.DeadlyandcostlyfloodinginducedeconomiclossesofUS$17.7billioninHenanprovinceofChina,andWesternEuropeexperiencedsomeofitsmostseverefloodingonrecordinmid‑July.ThiseventwasassociatedwitheconomiclossesinGermanyexceedingUS$20billion.Droughtaffectedmanypartsoftheworld,includingareasinCanada,UnitedStates,IslamicRepublicofIran,Afghanistan,Pakistan,TurkeyandTurkmenistan.InCanada,severedroughtledtoforecastwheatandcanolacropproductionlevelsbeing35%–40%below2020levels,whileintheUnitedStates,thelevelofLakeMeadontheColoradoRiverfellinJulyto47mbelowfullsupplylevel,thelowestlevelonrecord.Thecompoundedeffectsofconflict,extremeweathereventsandeconomicshocks,furtherexacerbatedbytheCOVID-19pandemic,undermineddecadesofprogresstowardsimprovingfoodsecurityglobally.Hydro-meteorologicalhazardscontinuedtocontributetointernaldisplacement.ThecountrieswiththehighestnumbersofdisplacementsrecordedasofOctober2021wereChina(morethan1.4million),VietNam(morethan664000)andthePhilippines(morethan600000).3ThereleaseoftheWorldMeteorologicalOrganizationStateoftheGlobalClimate2021reportcomesafewmonthsafterthereleaseoftheWorkingGroupI,IIandIIIcontribu-tionstotheSixthAssessmentReportoftheIntergovernmentalPanelonClimateChange(IPCC).ThepresentWMOreportprovidesanupdateontheannualstateoftheclimateobservedintheyear2021,andshowscontinuedtrends(alsoreportedintheIPCCreports)intermsofkeyindicators.Theseincludeconcentrationsofgreenhousegases,globalannualmeansurfacetemper-ature,globalmeansealevel,oceanheatcontent,oceanacidification,sea-iceextentandchangesinmassoftheicesheetsandglaciers.Whilethekeyindicatorsshowthatclimatecontinuestochange,informationonsocioeconomicimpactshighlightsthevulnerabilityofpopulationstocurrentweatherandclimateevents.LossanddamagesofmorethanUS$100billion,aswellassevereimpactsonfoodsecurityandhumanitarianaspectsduetohigh-impactweatherandclimateeventshavebeenreported.TheincreaseinatmosphericconcentrationofCO2from2019to2020wasslightlylowerthanthatobservedfrom2018to2019,buthigherthantheaverageannualgrowthrateoverthelastdecade.ThisisdespiteadecreaseinfossilfuelCO2emissionsofapproximately5.6%in2020duetorestrictionsrelatedtotheCOVID-19pandemic.Stabilizingglobalmeantemperatureat1.5°Cto2°Cabovepre-industrial(1850–1900)levelsbytheendofthiscenturywillrequireanambitiousreductionofgreenhousegasemissions,whichmustaccelerateduringthisdecade.Earlywarningsystemsarecriticallyrequiredacrosssectorsforclimateadaptation.Howev-er,lessthanhalftheMembersreporthavingearlywarningsystemsinplace.WMOanditsMembersareworkingcloselytosubstantiallyimprovethissituationinthenearfuture.Itakethisopportunitytocongratulatetheexpertsandtheleadauthor,whocompiledthisreportusingphysicaldataanalysesandimpactassessments.Ithankallthecontrib-utors,particularlyWMOMemberNationalMeteorologicalandHydrologicalServicesandRegionalClimateCentresandUnitedNationsagencies,fortheircollaborationandinput.ThepresentreportisintendedtohelpourorganizationstoupdateworldleadersandcitizensonthelatestinformationaboutthestateoftheEarthsystem,theweatherandclimateconditionsin2021,andtheimpactsofweatherandclimateevents.WMOremainscommittedtosupportingthispublicationandcommunicatingitwidelyforthispurpose.(Prof.PetteriTaalas)Secretary-GeneralForeword4Globalclimateindicators1provideabroadviewofclimatechangeataglobalscale,encompassingthecompositionoftheatmos-phere,energychanges,andtheresponseoftheland,oceanandice.Theseindicatorsarecloselyinterrelated.Forexample,theriseinCO2andothergreenhousegasesintheatmos-phereleadstoanimbalanceofenergyandthuswarmingoftheatmosphereandocean.Warmingoftheoceaninturnleadstorisingsealevels,towhichisaddedthemeltingoficeonlandinresponsetoincreasingatmospherictemperatures.Theglobalindicatorsdrawonawiderangeofdatasetsthatarelistedattheendofthepresentreportandwhicharebasedonmultipleobservingsystems(seeObservationalbasisforclimatemonitoring).Together,theindicatorsbuildaconsistentpictureofawarmingworldthattouchesallpartsoftheEarthsystem.TheconnectionsbetweenglobalclimateindicatorsandtheSustainableDevelopmentGoalswerehighlightedinClimateIndicatorsandSustainableDevelopment:DemonstratingtheInterconnections(WMO-No.1271).Thatreporttracesthelinksandfeedbackloopsamongthekeyclimateindicatorsasaphys-icalsystemandthecascadingriskstomostofthe17SustainableDevelopmentGoals.Monitoringtheglobalclimateindicators,aswellastheirrelatedrisksandimpacts,isthereforeofcriticalimportanceforachievingtheSustainableDevelopmentGoalsby2030.BASELINESBaselinesarespecificperiods,usuallyspan-ningoneormoredecades,thatareusedasafixedperiodagainstwhichcurrentconditionscanbecompared.Avarietyofbaselinesare1Trewin,B.;Cazenave,A.;Howell,S.etal.HeadlineIndicatorsforGlobalClimateMonitoring,BulletinoftheAmericanMeteorologicalSociety2021,102(1),E20–E37.https://journals.ametsoc.org/view/journals/bams/102/1/BAMS-D-19-0196.1.xml.21981–2010isusedinpreferenceto1991–2020,forconsistencywithclimatereportsfromWMOMembers,notallofwhomhaveyettransitionedtousingthemorerecentperiod.3IntergovernmentalPanelonClimateChange(IPCC),2021:AR6ClimateChange2021:ThePhysicalScienceBasis,https://www.ipcc.ch/report/ar6/wg1/.4IntergovernmentalPanelonClimateChange(IPCC),2018:IPCCSpecialReport:GlobalWarmingof1.5°C,https://www.ipcc.ch/sr15/.usedinthisreport,andthesearespecifiedinthetextandfigureswhereappropriate.Wherepossible,theWMOclimatologicalstandardnormal,1981–2010,isusedasabaselineforconsistentreporting.2Forsomeindicators,however,itisnotpossibletousethisbaseline,duetoeitheralackofmeasurementduringthewholeperiod,orbecausealongerperiodisneededtocalculaterepresentativestatistics.Therearetwonotableexceptions.Firstly,forglobalmeantemperature,abaselineof1850–1900isused.ThisisthebaselineusedinrecentIPCCreports(SixthAssessmentReport,3SpecialReport:GlobalWarmingof1.5°C4)asareferenceperiodforpre-industrialtemper-atures,andisrelevantforunderstandingprogressrelativetothegoaloftheParisAgreement.Secondly,forgreenhousegases,atmosphericconcentrationscanbeestimatedmuchfurtherbackintime,usinggasbubblestrappedinicecores.Theyear1750isthereforeusedinthisreporttorepresentpre-industrialgreenhousegasconcentrations.GREENHOUSEGASESAtmosphericconcentrationsofgreenhousegasesreflectabalancebetweenemissionsfromhumanactivities,naturalsources,andsinksinthebiosphereandocean.Increasinglevelsofgreenhousegasesintheatmos-phereduetohumanactivitieshavebeenthemajordriverofclimatechangesincethemid-twentiethcentury.GlobalaveragemolefractionsofgreenhousegasesarecalculatedfrominsituobservationsmadeatmultiplesitesintheGlobalAtmosphereWatch(GAW)ProgrammeofWMOandpartnernetworks.Globalclimateindicators5In2020,greenhousegasmolefractionsreachednewhighs,withgloballyaveragedsurfacemolefractionsofcarbondioxide(CO2)at413.2±0.2partspermillion(ppm),meth-ane(CH4)at1889±2partsperbillion(ppb)andnitrousoxide(N2O)at333.2±0.1ppb,respec-tively149%,262%and123%ofpre-industrial(1750)levels(Figure1).Theincreaseinatmos-phericconcentrationinCO2from2019to2020wasslightlylowerthanthatobservedfrom2018to2019,buthigherthantheaverageannualgrowthrateoverthelastdecade.ThisisdespiteadecreaseinfossilfuelCO2emissionsofapproximately5.6%in2020duetorestrictionsrelatedtotheCOVID-19pandemic.5ForCH4andN2O,theincreasefrom2019to2020washigherthanthatobservedfrom2018to2019andalsohigherthantheaverageannualgrowthrateoverthelastdecade.Real-timedatafromspecificlocations,in-cludingMaunaLoa(Hawaii)andCapeGrim(Tasmania)indicatethatlevelsofCO2,CH4andN2Ocontinuedtoincreasein2021.5https://public.wmo.int/en/resources/united_in_science;https://library.wmo.int/index.php?lvl=notice_display&id=219466https://www.unep.org/resources/report/global-methane-assessment-benefits-and-costs-mitigating-methane-emissions7Nisbet,E.G.;Manning,M.R.;Dlugokencky,E.J.etal.VeryStrongAtmosphericMethaneGrowthinthe4Years2014–2017:ImplicationsfortheParisAgreement.GlobalBiogeochemicalCycles2019,33(3),318–342.https://doi.org/10.1029/2018GB006009.8https://www.unep.org/resources/report/global-methane-assessment-benefits-and-costs-mitigating-methane-emissionsAtmosphericmethane(CH4)increaseisanissueofconcernbecauseitisnotonlyapow-erfulgreenhousegas,butitisalsoaprecursoroftroposphericozone,withimplicationsforhumanhealth,agricultureandecosystems.6ThemeanannualincreaseofCH4decreasedfromapproximately12ppbperyearduringthelate1980stonearlyzerobetween1999and2006.Since2007,atmosphericCH4hasbeenincreasing,andin2020itincreasedby11ppbover2019levels.StudiesusingGAWCH4measurementsindicatethatincreasedCH4emissionsfromwetlandsinthetropicsandfromanthropogenicsourcesatthemid-latitudesofthenorthernhemispherearethelikelycausesofthisrecentincrease.7Thesestudieshavealsopointedtotheshort-termclimatebenefitsandcost-effectivenessofmitigatingCH4emissions.SuchmitigationmeasureswerepresentedintheUnitedNationsEnvironmentProgramme(UNEP)methaneassessment8andaddressmajoremittingsectors,namelyoilandgas,agri-cultureandwastemanagement.1600165017001750180018501900195019851990199520002005201020152020CH4molefraction(ppb)Year0.01.02.03.04.019851990199520002005201020152020YearCO2growthrate(ppm/yr)-50510152019851990199520002005201020152020YearCH4growthrate(ppb/yr)30030531031532032533033519851990199520002005201020152020YearN2Omolefraction(ppb)0.00.51.01.52.019851990199520002005201020152020YearN2Ogrowthrate(ppb/yr)34035036037038039040041042019851990199520002005201020152020YearCO2molefraction(ppm)Figure1.Toprow:Globallyaveragedmolefraction(measureofconcentration),from1984to2020,ofCO2inpartspermillion(left),CH4inpartsperbillion(centre)andN2Oinpartsperbillion(right).Theredlineisthemonthlymeanmolefractionwiththeseasonalvariationsremoved;thebluedotsandlineshowthemonthlyaverages.Bottomrow:ThegrowthratesrepresentingincreasesinsuccessiveannualmeansofmolefractionsareshownasgreycolumnsforCO2inpartspermillionperyear(left),CH4inpartsperbillionperyear(centre)andN2Oinpartsperbillionperyear(right).Source:WMOGlobalAtmosphereWatch.6TEMPERATURETheglobalmeantemperaturein2021was1.11±0.13°Cabovethe1850–1900average(Figure2).Thesixdatasetsusedintheanal-ysis(seeGlobaltemperaturedata)place2021betweenthefifthandseventhwarmestyearonrecordglobally,andallsixshowthatthemostrecentsevenyears,2015to2021,werethesevenwarmestyearsonrecord.Theyear2021waslesswarmthansomerecentyearsduetotheinfluenceofmoderateLaNiñaeventsatthestartandendoftheyear,knownasa“double-dip”LaNiña(seeDriversofshort-termvariability).LaNiñahasatemporarycoolingeffectontheglobalmeantemperature,whichisstrongestintheyearfollowinganevent.AsidefromtheweakLaNiñaof2018,thelastsignificantLaNiñaeventwasin2011.Theyear2021wasaround0.22°Cto0.29°Cwarmerthan2011.Theyear2016,whichstartedduringastrongElNiño,9IntergovernmentalPanelonClimateChange(IPCC),2021:SummaryforPolicymakers.In:AR6ClimateChange2021:ThePhysicalScienceBasis,https://www.ipcc.ch/report/ar6/wg1/downloads/report/IPCC_AR6_WGI_SPM_final.pdf.10IntergovernmentalPanelonClimateChange(IPCC),2021:SummaryforPolicymakers,A.1.2.In:AR6ClimateChange2021:ThePhysicalScienceBasis,https://www.ipcc.ch/report/ar6/wg1/downloads/report/IPCC_AR6_WGI_SPM_final.pdf.TheIPCCaveragewasbasedonfourdatasets:HadCRUT5,NOAAGlobalTemp—Interim,BerkeleyEarthandKadow,C.;Hall,D.M.;Ulbrich,U.ArtificialIntelligenceReconstructsMissingClimateInformation.NatureGeoscience2020,13(6),408–413.https://doi.org/10.1038/s41561-020-0582-5.Bracketedvaluesindicatethe5%–95%confidencerange.remainsthewarmestyearonrecordinmostofthedatasetssurveyed.Themethodforcalculatingglobaltemper-atureanomaliesrelativetothe1850–1900baselinehasbeenupdatedfrompreviousstateoftheglobalclimatereports.ThenewmethodusestheassessmentoftemperaturechangeanditsuncertaintiesfromtheIPCCSixthAssessmentReportasafoundationforestimatingchangessince1850–1900.DetailsaregiveninthesectiononGlobaltemperaturedata.IntheIPCCSixthAssessmentReport,SummaryforPolicymakers,9temperaturecrossingpoints–thepointatwhichlong-termwarmingexceedsaparticularlevel–wereassessedusinga20-yearaveragecentredonthecrossingpoint.Fortheperiod2001–2020,theaveragewasestimated10tobe0.99[0.84–1.10]°C.Theprovisional20-yearaveragefortheperiod2002–2021,basedonYear©CrownCopyright.Source:MetOce185018751900192519501975200020251.41.21.00.80.60.40.20.0–0.2°CHadCRUT5analysisNOAAGlobalTempGISTEMPERA5JRA-55BerkeleyEarthFigure2.Globalannualmeantemperaturedifferencefrompre-industrialconditions(1850–1900)forsixglobaltemperaturedatasets(1850–2021).FordetailsofthedatasetsandprocessingseeDatasetsandmethods.Source:MetOffice,UnitedKingdomofGreatBritainandNorthernIreland.7theaverageofthesixdatasetsusedinthepresentreport,was1.01±0.12°Cabovethe1850–1900average.Near-surfacetemperaturesin2021wereabovethe1981–2010averageacrossabroadswathofNorthAmericaandGreenland,NorthernandTropicalAfrica,theMiddleEastandSouthernAsia(Figure3).Areaswithbelow-averagetemperaturesincludedpartsofNorthernAsia,Australia,SouthernAfricaandNorth-westNorthAmerica.TheimprintofLaNiñacanclearlybeseenintheTropicalPacific.CoolerconditionsinSouthernAfrica,India,andeasternAustraliaarecharacteristicofLaNiña.Thecooler-than-averageareainNorthernAsiastandsincontrastto2020,whichsawexceptionallyhightemperaturesintheregion.ThisispartlyassociatedwiththedifferentphasesoftheArcticOscillationinearly2020(stronglypositive)andearly2021(stronglynegative,seethesectiononArcticOscillation(AO)),whichhadanimprintontheaverageforthewholeyear.OCEANMostoftheexcessenergythataccumulatesintheEarthsystemduetoincreasingcon-centrationsofgreenhousegasesistakenupbytheocean.Theaddedenergywarmstheocean,andtheconsequentthermalexpansionofthewaterleadstosea-levelrise,towhichisaddedmeltinglandice.Thesurfacelayersoftheoceanhavewarmedmorerapidlythantheinterior,mirroredintheriseofglobalmeansea-surfacetemperatureandintheincreasedincidenceofmarineheatwaves.AstheconcentrationofCO2intheatmosphereincreases,sotoodoestheconcentrationof11Gruber,N.;Boyd,P.W.;Frölicher,T.L.etal.Biogeochemicalextremesandcompoundeventsintheocean.Nature2021,600,395–407.https://doi.org/10.1038/s41586-021-03981-7.12Hansen,J.;Sato,M.;Kharecha,P.etal.Earth’senergyimbalanceandimplications.AtmosphericChemistryandPhysics2011,11(24),13421–13449.https://doi.org/10.5194/acp-11-13421-2011.13IntergovernmentalPanelonClimateChange(IPCC),2013:Climatechange2013:Thephysicalsciencebasis,Chapter3,https://www.ipcc.ch/report/ar5/wg1/.14vonSchuckmann,K.;Palmer,M.D.;Trenberth,K.E.etal.AnimperativetomonitorEarth’senergyimbalance.NatureClimateChange2016,6,138–144.https://doi.org/10.1038/nclimate2876.15Hansen,J.;Nazarenko,L.;Ruedy,R.etal.Earth’sEnergyImbalance:ConfirmationandImplications.Science2005,308(5727),1431–1435.https://doi.org/10.1126/science.1110252.16Hansen,J.;Sato,M.;Kharecha,P.etal.Youngpeople’sburden:requirementofnegativeCO2emissions.EarthSystemDynamics2017,8(3),577–616.https://doi.org/10.5194/esd-8-577-2017.CO2intheocean.Thisaffectsoceanchemistry,loweringtheaveragepHofthewater,apro-cessknownasoceanacidification.Allthesechangeshaveabroadrangeofimpactsandinteractions11intheoceanandcoastalareas.OCEANHEATCONTENTIncreasinghumanemissionsofCO2andothergreenhousegasescauseapositiveradiativeimbalanceatthetopoftheatmosphere–theEarthenergyimbalance(EEI)–leadingtoanaccumulationofenergyintheformofheatintheEarthsystemwhichisdrivingglobalwarming.12,13,14Around90%ofthisac-cumulatedheatintheEarthsystemisstoredintheocean,whichismeasuredthroughoceanheatcontent(OHC).ApositiveEEIsignalsthattheEarth’sclimatesystemisstillrespondingtothecurrentforcing15andthatmorewarmingwilloccureveniftheforcingdoesnotincreasefurther.16Thisinturnisreflectedinacontinuedincreaseof–10.0–5.0–3.0–2.0–1.0–0.500.51.02.03.05.010.0°CFigure3.Near-surfacetemperaturedifferencesrelativetothe1981–2010averagefor2021.Themapshowsthemediananomalycalculatedfromfivedatasets:HadCRUT5,ERA5,GISTEMP,NOAAGlobalTempandBerkeleyEarth.Source:MetOffice,UnitedKingdom.8oceanheatcontent.TheIPCCconcludedthatitisunequivocalthathumaninfluencehaswarmedtheatmosphere,oceanandland,andthatitisextremelylikelythathumaninfluencewasthemaindriveroftheoceanheatincreaseobservedsincethe1970s.17Historicalmeasurementsofsubsurfacetemperaturebacktothe1940smostlyrelyonshipboardmeasurementsystems,whichconstraintheavailabilityofsubsurfacetem-peratureobservationsataglobalscaleand17IntergovernmentalPanelonClimateChange(IPCC),2021:SummaryforPolicymakers.In:AR6ClimateChange2021:ThePhysicalScienceBasis,https://www.ipcc.ch/report/ar6/wg1/downloads/report/IPCC_AR6_WGI_SPM_final.pdf.18Abraham,J.P.;Barlinger,M.;Bindoff,N.L.etal.Areviewofglobaloceantemperatureobservations:Implicationsforoceanheatcontentestimatesandclimatechange.ReviewsofGeophysics2013,51(3),450–483.https://doi.org/10.1002/rog.20022.19Riser,S.C.;Freeland,H.J.;Roemmich,D.etal.FifteenyearsofoceanobservationswiththeglobalArgoarray.NatureClimateChange2016,6(2),145–153.https://doi.org/10.1038/nclimate2872.20Roemmich,D.;Alford,M.H.;Claustre,H.etal.OntheFutureofArgo:AGlobal,Full-Depth,Multi-DisciplinaryArray.FrontiersinMarineScience2019,6,439.https://www.frontiersin.org/article/10.3389/fmars.2019.00439.21Boyer,T.;Domingues,C.M.;Good,S.A.etal.SensitivityofGlobalUpper-OceanHeatContentEstimatestoMappingMethods,XBTBiasCorrections,andBaselineClimatologies.JournalofClimate2016,29(13),4817–4842.https://doi.org/10.1175/JCLI-D-15-0801.1.22vonSchuckmann,K.;Palmer,M.D.;Trenberth,K.E.etal.AnimperativetomonitorEarth’senergyimbalance.NatureClimateChange2016,6,138–144.https://doi.org/10.1038/nclimate2876.23Cheng,L.;Abraham,J.;Goni,G.etal.XBTScience:AssessmentofInstrumentalBiasesandErrors.BulletinoftheAmericanMeteorologicalSociety2016,97(6),924–933.https://journals.ametsoc.org/view/journals/bams/97/6/bams-d-15-00031.1.xml.24vonSchuckmann,K.;Cheng,L.;Palmer,M.D.etal.HeatstoredintheEarthsystem:wheredoestheenergygo?EarthSystemScienceData2020,12(3),2013–2041.https://doi.org/10.5194/essd-12-2013-2020.25IntergovernmentalPanelonClimateChange(IPCC),2021:SummaryforPolicymakers.In:AR6ClimateChange2021:ThePhysicalScienceBasis,https://www.ipcc.ch/report/ar6/wg1/downloads/report/IPCC_AR6_WGI_SPM_final.pdf.26IntergovernmentalPanelonClimateChange(IPCC),2019:SummaryforPolicymakers.In:IPCCSpecialReportontheOceanandCryosphereinaChangingClimate,https://www.ipcc.ch/site/assets/uploads/sites/3/2022/03/01_SROCC_SPM_FINAL.pdf.atdepth.18WiththedeploymentoftheArgonetworkofautonomousprofilingfloats,whichfirstachieveditstargetnear-globalcover-agein2006,itisnowpossibletoroutinelymeasureOHCchangesdowntoadepthof2000m.19,20VariousresearchgroupshavedevelopedestimatesofglobalOHC,andallresultsshowcontinuedoceanwarming(Figure4).Differencesbetweentheestimatesatannualtodecadalscalearisefromthevarioussta-tisticaltreatmentsofdatagaps,thechoiceofclimatologyandtheapproachusedtoaccountforinstrumentalbiases.21,22,23Aconcertedefforthasbeenestablishedtoprovideaninternationalviewontheglobalevolutionofoceanwarminguptotheyear2021.24Theupper2000mdepthoftheoceancontin-uedtowarmin2021anditisexpectedthatitwillcontinuetowarminthefuture–achangewhichisirreversibleoncentennialtomillen-nialtimescales.25,26Theoceanheatcontentin2021wasthehighestonrecord,exceedingthe2020valueby14±9ZJ(Figure4).Alldatasetsagreethatoceanwarmingratesshowaparticularlystrongincreaseinthepasttwodecades.Oceanwarmingratesforthe0–2000mdepthlayer(relativetotheoceansurface)reached1.0(0.6)±0.1Wm-2Figure4.1960–2021ensemblemeantimeseriesandensemblestandarddeviation(2standarddeviations,shaded)ofglobalOHCanomaliesrelativetothe2005–2017averageforthe0–300m(grey),0–700m(blue),0–2000m(yellow)and700–2000m(green)depthlayers.Theensemblemeanisanupdateoftheoutcomeofaconcertedinternationaldataandanalysiseffort(seefootnote24),andallproductsusedarereferencedinthesectiononOceanheatcontentdata.Notethatvaluesaregivenfortheoceansurfaceareabetween60°Sand60°Nandlimitedtothe300mbathymetryofeachproduct.Theensemble-meanOHC(0–2000m)anomaliesfor2021havebeenaddedasseparatepoints,togetherwiththeensemblespread,andarebasedonthefourproductslistedinOceanheatcontentdata.Source:UpdatedfromvonSchuckmannetal.,2016(seefootnote22).OHC(ZJ)100500–50–100–150–200–2501960196519701975198019851990199520002005201020152020YearOHC0–300mOHC0–700mOHC0–2000mOHC700–2000mEnsemblemean9overtheperiod2006–2021(1971–2021).Forcomparison,thevaluesfortheupper700mdepthamountto0.7(0.4)±0.1Wm-2overtheperiod2006–2021(1971–2021).Belowthe2000mdepth,theoceanalsowarmed,albeitatthelowerrate27of0.07±0.04Wm-2.SEALEVELGlobalmeansealevel(GMSL)integrateschangesoccurringinmanycomponentsoftheclimatesystem.Oninterannualtomultidecadaltimescales,changestoGMSLresultfromoceanwarmingviathermalexpansionofseawater,meltingoflandiceandexchangeofwaterwithwaterbodiesonland.Measuredsincetheearly1990sbyhigh-precisionaltimetersatellites,theGMSLroseby2.1mmperyearbetween1993and2002,andby4.5mmperyearbetween2013and2021,anincreasebyafactoroftwobetweentheperiods,mostlyduetotheacceleratedlossoficemassfromtheicesheets.28In2021,GMSLreachedanewrecordhigh.ComparedtopreviousElNiñoandLaNiñayears(forexample,in1997/1998,2010/2011,2015/2016),duringwhichtheGMSLdisplayedtemporarypositiveornegativeanomaliesofseveralmillimetres,2021wasmarkedbyanincreaseoftheGMSLthatwasclosetothelong-termtrend(Figure5).27UpdatefromPurkey,S.G.;Johnson,G.C.WarmingofGlobalAbyssalandDeepSouthernOceanWatersbetweenthe1990sand2000s:ContributionstoGlobalHeatandSeaLevelRiseBudgets.JournalofClimate2010,23,6336–6351.https://doi.org/10.1175/2010JCLI3682.1.28WCRPGlobalSeaLevelBudgetGroup.Globalsea-levelbudget1993–present.EarthSystemScienceData2018,10(3),1551–1590,https://doi.org/10.5194/essd-10-1551-2018.Althoughsealevelhasrisenalmostevery-wheresince1993,ithasnotrisenequallyeverywhere.Regionalpatternsofsea-levelchangearedominatedbylocalchangesinoceanheatcontentandsalinity.Severalregionscontinuetobeaffectedbyarateofsea-levelrisesubstantiallyfasterthantheglobalmean(seeFigure6,whichshowsthedifferencebetweenlocalandglobalsealevel).ThisisparticularlythecaseinthewesternTropicalPacific,theSouth-westPacific,theNorthPacific,theSouth-westIndianOceanandtheSouthAtlantic.Inotherregions,local2.1mm/yr(Jan1993—Dec2002)2.9mm/yr(Jan2003—Dec2012)SatelliteAltimetryAveragetrend:3.33+/–0.4mm/yr4.5mm/yr(Jan2013—Jan2022)1993199519971999200120032005200720092011201320152017201920212023YearSealevel(mm)1009080706050403020100Figure5.GlobalmeansealevelevolutionfromJanuary1993toJanuary2022(blackcurve)basedonhigh-precisionsatellitealtimetry.Thecolouredstraightlinesrepresenttheaveragelineartrendoverthreesuccessivetimespans(January1993toDecember2002;January2003toDecember2012;January2013toJanuary2022).Source:AVISOaltimetry(https://www.aviso.altimetry.fr).Figure6.Regionaltrendpatternsinsealevelaftertheglobalmeantrendhasbeenremoved(mm/yr),from1993to2020,basedonsatellitealtimetry.Notethattheactualsealevelhasincreasedalmosteverywhere.Source:CopernicusClimateChangeService(https://climate.copernicus.eu).Latitude60°N30°N0°30°S60°S0°60°E120°E180°120°W60°W0°Longitude1050–5–10mm/yr10sealevelhasrisenmoreslowlythantheglobalmean,suchasaroundGreenlandandsouthofIceland,andintheSouthernOceanaroundAntarctica.Thepatternsoftrendsinsealevelhaveonlyvariedalittleoverthelast30yearsofthealtimetryera,andchangesfromoneyeartoanotheraresmall.MARINEHEATWAVESANDCOLDSPELLSAnalogoustoheatwavesandcoldspellsonland,marineheatwaves(MHW)andmarinecoldspells(MCS)areprolongedperiodsofextremeheatorcoldthataffecttheocean.Theycanhavearangeofconsequencesformarinelifeanddependentcommunities,29andMHWshavebecomemorefrequentoverthetwentiethcentury.Satelliteretrievalsofsea-surfacetemperatureareusedtomon-itorMHWsandMCSs,categorizedhereasmoderate,strong,severeorextreme(fordefinitions,seeMarineheatwaveandmarinecoldspelldata).29Smale,D.A.;Wernberg,T.;Oliver,E.C.J.etal.Marineheatwavesthreatenglobalbiodiversityandtheprovisionofecosystemservices.NatureClimateChange2019,9(4),306–312.https://www.nature.com/articles/s41558-019-0412-1.Muchoftheoceanexperiencedatleastone“strong”MHWatsomepointin2021(Figure7).Duetothebelow-averagesea-surfacetemperaturesassociatedwiththedouble-dipLaNiña(seeElNiño–SouthernOscillation(ENSO)),MHWswereconspic-uouslyabsentintheeasternEquatorialPacificOcean,whichwasalsooneoftheonlyregionsoftheglobaloceantoseebroadcoverageofMCSs(Figure8).TheLaptevandBeaufortSeasexperienced“se-vere”and“extreme”MHWsfromJanuarytoApril2021.Theice-edgeregionstotheeastofGreenland(August),northofSvalbard(October),andeastoftheRossSea(December)experiencednotable“ex-treme”MHWs.In2021,almostallMCSswere“moderate”,exceptinareasofhighvariabilitysuchasthepolewardextensionoftheGulfStream.MHWsin2021showedanaveragedailycov-erageof13%,whichislessthantherecordof17%in2016and16%in2020.FortheeighthDailyMHWcoverageforocean(non-cumulative)2021-22021-42021-62021-82021-102021-12Dayoftheyear80%60%40%20%2021-22021-42021-62021-82021-102021-12Dayoffirstoccurrence80%60%40%20%TopMHWcategoryforocean(cumulative)Dayoftheyear2021-22021-42021-62021-82021-102021-12362412AverageMHWdaysforocean(cumulative)(b)(c)(d)CategoryIModerateIIStrongIIISevereIVExtreme(a)Figure7.(a)GlobalmapshowingthehighestMHWcategory(fordefinitions,seeMarineheatwaveandmarinecoldspelldata)experiencedateachpixelin2021(referenceperiod1982–2011).LightgreyindicatesthatnoMHWoccurredinapixelovertheentireyear.(b)StackedbarplotshowingthepercentageofthesurfaceoftheoceanexperiencinganMHWonanygivendayoftheyear.(c)StackedbarplotshowingthecumulativepercentageofthesurfaceoftheoceanthatexperiencedanMHWovertheyear.Note:ThesevaluesarebasedonwhenintheyearapixelfirstexperienceditshighestMHWcategory,sonopixeliscountedtwice.HorizontallinesinthisfigureshowthefinalpercentagesforeachcategoryofMHW.(d)StackedbarplotshowingthecumulativenumberofMHWdaysaveragedoverthesurfaceoftheocean.Note:ThisaverageiscalculatedbydividingthecumulativesumofMHWdaysperpixelweightedbythesurfaceareaofthosepixels.DataarefromtheNationalOceanicandAtmosphericAdministrationOptimumInterpolationSeaSurfaceTemperature(NOAAOISST).Source:RobertSchlegel.11consecutiveyear,themostcommoncategoryofMHWin2021was“strong”(28%).Overall,57%oftheoceansurfaceexperiencedatleastoneMHWduring2021(Figure7c)–lessthantherecordof65%in2016,andthelowestannualcoveragesince2012(57%).TheaveragedailycoverageoftheglobaloceanbyMCSsin2021was4%(Figure8b)–alowervaluethantherecordhighin1982(7%)andcomparableto2020(4%).Intotal,25%oftheoceansurfaceexperiencedatleastoneMCSduring2021(Figure8c),whichiscomparableto2020(25%),butmuchlessthanthe1985record(63%).30IntergovernmentalPanelonClimateChange(IPCC),2019:SummaryforPolicymakers.In:IPCCSpecialReportontheOceanandCryosphereinaChangingClimate,https://www.ipcc.ch/site/assets/uploads/sites/3/2022/03/01_SROCC_SPM_FINAL.pdf.31WorldMeteorologicalOrganization(WMO).WMOGreenhouseGasBulletin(GHGBulletin)-No.15:TheStateofGreenhouseGasesintheAtmosphereBasedonGlobalObservationsthrough2018.Geneva,2019.32LeQuéré,C.;Andrew,R.M.;Friedlingstein,P.etal.Globalcarbonbudget2017.EarthSystemScienceData2018,10,405–448.https://doi.org/10.5194/essd-10-405-2018.33IntergovernmentalPanelonClimateChange(IPCC),2021:ClimateChange2021:ThePhysicalScienceBasis,https://www.ipcc.ch/report/ar6/wg1/#FullReport.34IntergovernmentalPanelonClimateChange(IPCC),2021:ClimateChange2021:ThePhysicalScienceBasis,Chapter2,section2.3.3.5OceanpH,https://www.ipcc.ch/report/ar6/wg1/.OCEANACIDIFICATIONTheoceanabsorbsaround23%ofthean-nualemissionsofanthropogenicCO2intotheatmosphere.30,31WhilethisslowstheriseofatmosphericconcentrationofCO2,32CO2reactswithseawaterandreducesthepHoftheocean,33aprocessknownasoceanacidification(Figure9).Thecurrentglobalrateofoceanacidificationexceeds,byatleastanorderofmagnitude,theratesinferredforthePaleocene–Eocenethermalmaximum(PETM),whichoccurredaround56millionyearsagoandwasassociatedwithlargeperturbationsoftheglobalcarboncycle.34TheIPCCSixth11Figure8.AsforFigure7,butshowingMCSsratherthanMHWs.DataarefromtheNationalOceanicandAtmosphericAdministrationOptimumInterpolationSeaSurfaceTemperature(NOAAOISST).Source:RobertSchlegel.CategoryIModerateIIStrongIIISevereIVExtremeDailyMCScoverageforocean(non-cumulative)2021-22021-42021-62021-82021-102021-12Dayoftheyear80%60%40%20%2021-22021-42021-62021-82021-102021-12Dayoffirstoccurrence80%60%40%20%TopMCScategoryforocean(cumulative)Dayoftheyear2021-22021-42021-62021-82021-102021-121073AverageMCSdaysforocean(cumulative)(b)(c)(d)(a)12AssessmentReportconcludedthat“[t]hereisveryhighconfidencethatopenoceansurfacepHisnowthelowestithasbeenforatleast26kyrandcurrentratesofpHchangeareunprecedentedsinceatleastthattime”.AsthepHoftheoceandecreases,itscapacitytoabsorbCO2fromtheatmospherealsodeclines.35Oceanacidificationthreatensorganismsandecosystemservices,andhencefoodsecurity,tourismandcoastalprotection.Localandregionalacidificationisofgreatrelevancetomarineorganismsandbiologicalprocesses.However,thereishighvariabilityincoastalareasduetoarangeoffactorsaffectingCO2levels.Nationaldatasetsofoceanacidifi-cationobservationssubmittedtowardstheSustainableDevelopmentGoal(SDG)14.3andtheassociatedSDGIndicator14.3.1(“Averagemarineacidity(pH)measuredatagreedsuiteofrepresentativesampling35Middelburg,J.J.;Soetaert,K.;Hagens,M.OceanAlkalinity,BufferingandBiogeochemicalProcesses.ReviewsofGeophysics2020,58,e2019RG000681.https://doi.org/10.1029/2019RG000681.36Mallett,R.D.C.;Stroeve,J.C.;Cornish,S.B.etal.Recordwinterwindsin2020/21droveexceptionalArcticseaicetransport.CommunicationsEarth&Environment2021,2,149.https://doi.org/10.1038/s43247-021-00221-8.37https://nsidc.org/arcticseaicenews/2021/03/arctic-sea-ice-reaches-uneventful-maximumstations”)highlighttheneedforsustained,repeatedobservationandmeasurementofoceanacidificationalongthecoastlinesandintheopenocean.Whiletherearecurrentlystillgapsintheglobalcoverage,capacitybuildingeffortsincreasethecapabilityofmanynationstomeasure,manageandreportoceanacid-ificationdata,asconfirmedbythegrowingnumberofcountriesparticipatingindatacollectiontowardstheSDGIndicator14.3.1.CRYOSPHEREThecryospherecomprisesthefrozenpartsoftheEarth.Thisincludesseaice,glaciers,icesheets,snowandpermafrost.SEAICEArcticseaiceThe2020/2021Arcticwintersawanomalouslyhighsea-levelpressureoverthecentralArcticOcean(seeArcticOscillation(AO)).There-sultinganticyclonicwindpatterndrovethickermulti-yeariceintotheBeaufortSea.36ThemaximumArcticsea-iceextentfortheyearwasreached37on21March,at14.8millionkm2.March2021wastheninthortenthlowestextentonrecord(1979–2021),dependingonthedatasource(Figure10).Formoredetailsonthedatasetsused,seeSea-icedata.12Figure9.GlobalmeanoceansurfacepH(blue)coveringtheperiod1985–2020.Theshadedareaindicatestheestimateduncertaintyineachestimate.DatafromCopernicusMarineEnvironmentMonitoringService.Source:MetOffice,UnitedKingdom.Figure10.Sea-iceextentdifferencefromthe1981–2010averageintheArctic(left)andAntarctic(right)forthemonthswithmaximumicecover(Arctic:March;Antarctic:September)andminimumicecover(Arctic:September;Antarctic:February)from1979to2021.Source:DatafromEUMETSATOSISAFv2p1andNationalSnowandIceDataCentre(NSIDC)v3(Fettereretal.,2017)(seereferencedetailsinSea-icedata).CMEMS19851990199520002005201020152020Year8.118.108.098.088.078.068.05pH©CrownCopyright.Source:MetOcemillionkm2NSIDCv3(September)NSIDCv3(March)OSISAFv2p1(September)OSISAFv2p1(March)Year19801990200020102020–3–2–101millionkm2Year19801990200020102020–3–2–101NSIDCv3(September)NSIDCv3(February)OSISAFv2p1(September)OSISAFv2p1(February)13Meltrateswereclosetothe1981–2010av-erageearlyinthemeltseason.However,sea-iceextentdecreasedveryrapidlyinJuneandearlyJulyintheLaptevSeaandeastGreenlandSearegions.Asaresult,theArctic-widesea-iceextentreachedarecordlowforthetimeofyearinthefirsthalfofJuly.ThemonthlyJulyaveragewasthesecondtofourthlowestonrecord(tiedwith2012and2019),withstrongregionalcontrasts38(Figure11).Moreicethannormal(1981–2010)wasfoundintheBeaufortandChukchiSeas,buttheSiberianandEuropeansectors(LaptevSeaandEastGreenlandSea)hadmuchlessseaicethannormal.OneexceptionwastheeasternKaraSea,wheresomeseaicepersistedforthewholeseason.ConditionsshiftedrapidlyafterJuly,withasustainedperiodofcolderweatheracrosstheArcticOcean.Thisslowedthesea-icemeltandAugust2021endedupwiththetenthlowestextentonrecord.WiththeslowdowninmeltinAugust,theminimumSeptemberextentwasgreaterthaninrecentyearsbutstillwellbelowthe1981–2010average,representingthetwelfthlowestminimumiceextentinthe43-yearsatelliterecord(Figure10).The2021minimumextentwasobserved39on16Septemberat4.72millionkm2,whilethemeanSeptembericeextentwas4.92millionkm2,wellbelowthe1981–2010average.AntarcticseaiceSea-iceextentacrosstheSouthernOceanin2021wasgenerallybelowthe1981–2010mean,withbelow-averageextentsbeforetheFebruaryminimum,slightlyabove-averageextentsduringmostofthewinter,anexcep-tionallyearlymaximumiceextentattheendofAugust,andtheestablishmentofextentsthatwerewellbelowaveragebytheendoftheyear.Theminimuminthe2021annualcycleoc-curredon19February,whenseaicecovered2.60millionkm2,thefifteenthlowestextentintherecord(1979–present).Theextentof38Sea-icecoverforJuly2021:https://climate.copernicus.eu/sea-ice-cover-july-202139https://nsidc.org/arcticseaicenews/2021/09/arctic-sea-ice-at-highest-minimum-since-2014iceattheannualminimabegantoincreaseinmagnitudeintheearly1990s,reachingamaximumof3.68millionkm2in2013,beforedroppingsharplyto2.08millionkm2in2017,thelowesticeextentintheperiod1979–2021.Sincethen,theextentsattheannualminimahaveincreasedslowly.InFebruary,mostAntarcticseaicewasfoundintheWeddellSeaandthereforethesea-iceextentsattheannualminimalargelyreflectregionalchangesinthatarea.Antarcticseaicereacheditsmaximumannualextentof18.80millionkm2on30August2021.Thiswasclosetotheaveragemagnitudeintermsofextent,andthetwenty-secondlargestinthe43yearsofdata.However,thiswasthesecondearliestmaximum,withonlyoneothermaximumhavingoccurredinAugust(thatof2016).AfterthemiddleofSeptember,thesea-iceextentforthewholeSouthernOceanwasper-sistentlybelowaverage,withtheiceextentde-creasingto6.77millionkm2(–1.82millionkm2belowaverage)on24December,thethirdlowestforthatdayintherecord.Atthattime,iceextentswerebelowaverageinallsectorsaroundthecontinent,butthelackoficeintheWeddell,BellingshausenandRossSeashadthegreatestimpactontheAntarctic-wideanomaly.Concentration(%)100–1000Figure11.Arcticsea-iceconcentrationanomaliesforJuly2021(differencefromthe1981–2010average).Redrepresentsareaswithlessicethannormal,bluerepresentsmoreice.Source:EUMETSATOSISAFdatawithresearchanddevelopmentinputfromtheEuropeanSpaceAgencyClimateChangeInitiative(ESACCI).14GLACIERSGlaciersareformedfromsnowthathascompactedtoformice,whichcandeformandflowdownhilltolowerandwarmeralti-tudes,whereitmelts.Iftheglacierterminatesinalakeortheocean,icelossalsooccursthroughmelting,whereiceandwatermeet,orbycalvingoftheglacierfronttoformicebergs.Glaciersaresensitivetochangesintemperature,precipitationandsunlight,aswellasotherfactors,suchaschangesinbasallubrication,warmingoceanwatersorthelossofbuttressingiceshelves.Overtheperiod2000–2019,globalglaciersandicecaps(excludingtheGreenlandandAntarcticicesheets)experienced40anav-eragemasslossof267±16Gtperyear.Masslosswashigher,at298±24Gtperyear,inthelaterpartoftheperiodfrom2015–2019.Glaciersinseveralmid-latituderegionsthinnedatmorethandoubletheglobalaverage(0.52±0.03mperyear)from40Hugonnet,R.;McNabb,R.;Berthier,E.etal.Acceleratedglobalglaciermasslossintheearlytwenty-firstcentury.Nature2021,592(7856),726–731.https://www.nature.com/articles/s41586-021-03436-z.41Metreswaterequivalentisthedepthofwaterthatwouldresultifthelosticeweremeltedandspreadacrossthesurfaceareaoftheglacier.42Hugonnet,R.;McNabb,R.;Berthier,E.etal.Acceleratedglobalglaciermasslossintheearlytwenty-firstcentury.Nature2021,592(7856),726–731.https://www.nature.com/articles/s41586-021-03436-z.2015to2019.Examplesincludethinningof1.52mperyearinNewZealand,1.24mperyearinAlaska,1.11mperyearinCentralEurope,and1.05mperyearinWesternNorthAmerica(notincludingAlaska).TheWorldGlacierMonitoringServicecollatesandanalysesglobalglaciermassbalancedata,includingasetof42referenceglacierswithlong-termobservations.Fortheglaci-ologicalyear2020/2021,preliminarydataavailablefrom32ofthesereferenceglaciersindicateanaverageglobalmassbalanceof–0.77mwaterequivalent(mw.e.41Figure12).Thisisasmallermasslossthantheaverageforthelastdecade(–0.94mw.e.from2011to2020),butislargerthantheaveragemasslossfortheperiod1991–2020,–0.66mw.e.Althoughtheglaciologicalyear2020/2021wascharacterizedbyalessnegativeglaciermassbalancethaninrecentyears,thereisacleartrendtowardsanaccelerationofmasslossonmultidecadaltimescales(Figure12).Onaverage,thereferenceglaciershavethinnedby33.5m(iceequivalent)since1950,with76%ofthisthinning(25.5m)occurringsince1980.ExceptionalglaciermasslossinwesternCanadaMasslossfromNorthAmericanglaciersacceleratedoverthelasttwodecades.GlaciermasslossinWesternNorthAmericaincreasedfrom53±13Gtperyearfortheperiod2000–2004to100±17Gtperyearfor2015–2019.42Anexceptionallywarm,drynorthernhem-ispheresummerin2021(seeHeatwavesandwildfires)exacerbatedmasslossformostglaciersinAlbertaandsouthernBritishColumbiainCanada,andthePacificNorthwestoftheUnitedStatesofAmerica.IntheCoastMountainsofBritishColumbia,PlaceandHelmGlacierslostmoremassduringtheperiod2020–2021thaninanyyearsinceFigure12.Globalglaciermassbalance1950–2021,fromasetofapproximately40globalreferenceglaciers.(a)Averageannualmassbalanceforthesetofreferenceglaciers.(b)Cumulativemassbalancesince1950.Unitsaremw.e.Source:DataareprovidedbytheWorldGlacierMonitoringService,http://www.wgms.ch.19501960197019801990200020102020Year19501960197019801990200020102020Year(a)(b)Annualmassbalance(mw.e.)0–0.5–1.0Cumulativemassbalance(mw.e.)0–10–20–3015measurementsbeganin1965(Figure13a).IntheCanadianRockyMountains,masslossfromPeytoGlacierwasthesecondgreatestsince1965,afterthestrongElNiñoyearof1998(Figure13b).RepeatLiDARsurveys43indicatemassbalancesof–2.66,–3.30,and–1.95mw.e.onPlace,HelmandPeytoGlaciers,respectively.Thisrepresentsroughlytwicethemeanregionalrateofthinningfrom2015to2019.Littlesnowremainedonmostofthemountainglaciersinthisregionbymid-August2021,andmanyoftheseglaciershavelosttheirfirnzone,wheremulti-yearsnowundergoesthetransformationfromsnowtoglacialice.Particulatedeposition–includingsootandash–fromextensiveregionalwildfireactivityinsummer2021meantthatthesurfacesoftheglacierswereunusuallydarkinJulyandAugustandabsorbedmoresunlight43Pelto,B.M.;Menounos,B.;Marshall,S.J.Multi-yearevaluationofairbornegeodeticsurveystoestimateseasonalmassbalance,ColumbiaandRockyMountains,Canada.TheCryosphere2019,13,1709–1727.https://doi.org/10.5194/tc-13-1709-2019.thanusual,contributingtotheextrememassloss.KokaneeGlacier,BritishColumbia,lost5%–6%ofitstotalvolumein2021,whileColumbiaIcefield,thelargesticefieldintheRockyMountains(210km2),lostabout0.34Gtofice(Figure13c).ICESHEETSIcesheetsareexpansesofglacialicethatcoveranarealargerthan50000km2.Inthecurrentclimate,therearetwoicesheets,foundonGreenlandandAntarctica.GreenlandicesheetChangesinthetotalmassbalanceoftheGreenlandicesheetreflectthecombinedef-fectsof:surfacemassbalance,definedasthedifferencebetweensnowfallandmeltwaterFigure13.Glaciermassbalancerecordsfrom(a)PlaceGlacier,BritishColumbia,and(b)PeytoGlacier,Albertafrom1965to2021.Datafor1965–2019arefromtheWorldGlacierMonitoringService.Massbalanceestimatesfor2021arefromLiDARsurveys,withfirn-densitycorrectionsbasedonPeltoetal.(2019)(seeGlaciermassbalancedata).TheblueandyellowhorizontalbarsindicatedecadalmeanvaluesfortheregionfromHugonnetetal.(2021)(seeGlaciermassbalancedata).Datafrom2021indicatetheuncertainty(pinkbar),themassbalancecalculationusingthecontemporaneousLiDAR-derivedglacierarea(redcircles),andthespecificmassbalancecalculatedfromtheRandolphGlacierInventoryglacierareas/outlinesasusedbyHugonnetetal.(2021)(blackcrosshairs).(c)LiDAR-derivedelevationchangeontheColumbiaIcefield,CanadianRockyMountains,forthe2020/2021massbalanceyear.25.5km0PlaceGlacier,CoastMountains,B.C.PeytoGlacier,RockyMountains,AlbertaGlacierelevationchange,2020/2021:ColumbiaIcefield,RockyMountains,Canada(b)(a)1.00.50.0–0.5–1.0–1.5–2.0–2.5–3.0Netmassbalance(mw.e.)0.50.0–0.5–1.0–1.5–2.0Netmassbalance(mw.e.)197019801990200020102020Year(c)–10–8–5–301Elevationchange(m)197019801990200020102020Year16run-offfromtheicesheet;themarinemassbalance,whichisthesumofmasslossesattheperipheryfromthecalvingoficebergsandthemeltingofglaciertonguesoncontactwiththeocean;andthebasalmassbalance,whichconsistsofbasalmeltingduetogeothermalheatandfrictionalheatgeneratedbyslidingatthebaseoftheglacierandbydeformationoftheice.ForGreenland,anensembleofregionalcli-matemodels44givesanestimatedtotalmassbalance45of–166Gtforthe2021massbalanceyear(1September2020to31August2021).EstimatesbasedonsatelliteobservationsandthePROMICEsurfaceweatherstationnetworkgiveatotalmassbalanceof–85Gtover44Basedontheaverageofthreeregionalclimateandmassbalancemodels.SeeMankoff,K.D.;Fettweis,X.;Langen,P.L.etal.Greenlandicesheetmassbalancefrom1840throughnextweek.EarthSystemScienceData2021,13,5001–5025.https://doi.org/10.5194/essd-13-5001-2021.45Anegativemassbalanceindicatesalossoficemass;apositivemassbalanceindicatesagain.46Moon,T.A.;Tedesco,M.;Box,J.E.etal.GreenlandIceSheet.InArcticReportCard2021;Moon,T.A.;Druckenmiller,M.L.;Thoman,R.L.,Eds.;NationalOceanicandAtmosphericAdministration,2021.https://doi.org/10.25923/546g-ms61.47https://climate.nasa.gov/vital-signs/ice-sheets/.48Wiese,D.N.;Yuan,D.-N.;Boening,C.etal.2019.JPLGRACEandGRACE-FOMasconOcean,Ice,andHydrologyEquivalentWaterHeightRL06MCRIFilteredVersion2.0,Ver.2.0,PO.DAAC,CA,USA.http://dx.doi.org/10.5067/TEMSC-3MJ62.49Basedontheaverageofthreeregionalclimateandmassbalancemodels.SeeMankoff,K.D.;Fettweis,X.;Langen,P.L.etal.Greenlandicesheetmassbalancefrom1840throughnextweek.EarthSystemScienceData2021,13,5001–5025.https://doi.org/10.5194/essd-13-5001-2021.50Wiese,D.N.;Yuan,D.-N.;Boening,C.etal.2019.JPLGRACEandGRACE-FOMasconOcean,Ice,andHydrologyEquivalentWaterHeightRL06MCRIFilteredVersion2.0,Ver.2.0,PO.DAAC,CA,USA.http://dx.doi.org/10.5067/TEMSC-3MJ62.thesameperiod.46GRACEsatellitegravitydataprocessedbyNASA47giveatotalmassbalanceof–126Gtforthissameperiod.48Theestimatedmagnitudeofmasslossdiffersduetodifferentmethodsandassumptions,butthereisagreementthattheGreenlandicesheethadanegativemassbalanceforthetwenty-fifthyearinarow.OvertheperiodSeptember1986toAugust2021,climatemodellingindicatesthattheGreenlandicesheetlostatotalof5511Gtofice,49anaveragemasslossof157Gtperyear(Figure14).Masslosshasacceleratedoverthepasttwodecades.BasedontheGRACEandGRACE-FOsatellitegravitydata,50Greenlandlost5151GtoficefromApril2002Massbalance(Gt/yr)BasalmassbalanceMarinemassbalanceSurfacemassbalanceTotalmassbalance19851990199520002005201020152020Year6005004003002001000–100–200–300–400–500–600Figure14.ComponentsofthetotalmassbalanceoftheGreenlandicesheet1987–2021.Blue:surfacemassbalance(SMB);green:marinemassbalance(MMB,alsoreferredtoasdischarge);orange/yellow:basalmassbalance(BMB),red:totalmassbalance(TMB),thesumofSMB,MMBandBMB(seefootnote44).Source:Mankoff,K.D.;Solgaard,A.;Colgan.W.etal.GreenlandIceSheetsolidicedischargefrom1986throughMarch2020.EarthSystemScienceData2020,12(2),1367–1383.https://doi.org/10.5194/essd-12-1367-2020.17toNovember2021,anaveragerateofmasslossof276Gtperyear(Figure15).Greenland’smassbalancein2021wasclosetothe35-yearnormal,butmasslosswasbelowtheaveragefortheperiod2002–2020forwhichsatellitegravitydataareavailable.Forthesummer2021meltseasoninGreenland,meltextentwasclosetothelong-termaveragethroughtheearlysummer,buttemperaturesandmeltwaterrun-offwere51http://nsidc.org/greenland-today/2021/08/rain-at-the-summit-of-greenland/52Moon,T.A.;Tedesco,M.;Box,J.E.etal.GreenlandIceSheet.InArcticReportCard2021;Moon,T.A.;Druckenmiller,M.L.;Thoman,R.L.,Eds.;NationalOceanicandAtmosphericAdministration,2021.https://doi.org/10.25923/546g-ms61.53http://nsidc.org/greenland-today/2021/08/rain-at-the-summit-of-greenland/wellabovenormalinlateJulyandAugust2021(Figure16).51TheAugusteventwasassociatedwithawarm,humidairmassthatmovedinfromBaffinBayandcoveredmuchofsouth-westernandcentralGreenland.On14August,rainwasobservedforseveralhoursatSummitStation,thehighestpointontheGreenlandicesheet(3216m),andairtemperaturesremainedabovefreezingforaboutninehours.52,53ThereisnopreviousreportofrainfallatSummit,andthisistheFigure16.(a)CumulativemeltdaysontheGreenlandicesheet,2021,indicatingmeltimpactsovermostoftheicesheetinsummer2021.(b)Meltextent(%)overtheicesheetthroughthe2021meltseasononGreenland,relativetothemedianmeltextentfrom1981to2010.(c)Greenlandmeltwaterrun-offthroughJuly–August2021relativetotherecentextensivemeltseasonsof2012and2019,indicatingtherecordamountoflate-seasonicesheetmeltingassociatedwiththemid-AugustrainfalleventatSummit.Source:AllimagesarecourtesyoftheUSANationalSnowandIceDataCenterhttp://nsidc.org/greenland-today/,withthankstoTedScambosandtheGreenlandIceSheetTodayteam.Analysisin(a)and(b)isfromThomasMote,UniversityofGeorgia,USA,andmeltwaterrun-offin(c)isestimatedfromtheregionalclimatemodelMARv3.12,courtesyofXavierFettweis,UniversityofLiège,Belgium.Figure15.GRACEandGRACE-FOsatellitegravitydataofGreenlandandAntarcticicesheetmasschangefromApril2002toNovember2021(seefootnote48).TheGreenlandicesheetlostmassatanaveragerateof276Gtperyearoverthisperiod,whiletheaveragerateofmasslossinAntarcticawas152Gtperyear.Combined,thisisequivalenttoabout1.2mmperyearofglobalsea-levelrise.GreenlandIceSheet(a)Masschange(Gt)20022004200620082010201220142016201820202022Year0–1000–2000–3000–4000–50000AntarcticIceSheet(b)Masschange(Gt)20022004200620082010201220142016201820202022Year–1000–2000–3000(b)Meltwaterruno(Gt)Meltextent(%)Greenlandmeltextent2021Apr.MayJun.Jul.Aug.Sep.Oct.15Oct.2021Modelledmeltwaterrun-o,July–August20211981–2010median2021meltpercentageInterquartilerange(c)(a)Numberofmeltdays80706050403020100Jul.Aug.1981–2010maximum1981–2010average201220192021Greenlandcumulativemeltdays1Jan.–15Oct.202151015202530510152020161284018latestdateintheyearthatabove-freezingtemperatureshavebeenrecordedatthislocation.MelteventsatSummitwerealsoobservedin1995,2012and2019.Icecorerecordsindicatethatpriorto1995,thelasttimemeltingoccurredatSummitwasinthelatenineteenthcentury.54AntarcticicesheetTheAntarcticicesheetexperiencesnegligiblesurfacemeltcomparedtoGreenland,butsomemelttypicallyoccursontheAntarcticPeninsulabetweenNovemberandFebruary,aswellasonsomeofthelow-lyingiceshelvesandincoastalzones.Thesummer2020/2021meltseasoninAntarcticawasmoderateandwasbelowthe1990–2020average.55ThenorthernFilchnerIceShelfintheWeddellSeaexperiencedastrongbutbriefmelteventinmid-December2020.Thesummermeltsea-soninAntarcticaconcludedinmid-February2021.Thestrongestpositivemeltanomalies54Meese,D.A.;Gow,A.J.;Grootes,P.etal.TheAccumulationRecordfromtheGISP2CoreasanIndicatorofClimateChangeThroughouttheHolocene.Science1994,266(5191),1680–1682.https://doi.org/10.1126/science.266.5191.1680.55http://nsidc.org/greenland-today/2021/04/the-antarctic-2020-to-2021-melt-season-in-review/56Velicogna,I.;Mohajerani,Y.;Landerer,G.A.F.etal.ContinuityofIceSheetMassLossinGreenlandandAntarcticafromtheGRACEandGRACEFollow-OnMissions.GeophysicalResearchLetters2020,47(8),e2020GL087291.https://doi.org/10.1029/2020GL087291.SeealsoRignot,E.;Mouginot,J.;Scheuchl,B.etal.FourdecadesofAntarcticIceSheetmassbalancefrom1979–2017.ProceedingsoftheNationalAcademyofSciences2019,116(4)1095–1103.https://doi.org/10.1073/pnas.1812883116.57Wiese,D.N.;Yuan,D.-N.;Boening,C.etal.2019.JPLGRACEandGRACE-FOMasconOcean,Ice,andHydrologyEquivalentWaterHeightRL06MCRIFilteredVersion2.0,Ver.2.0,PO.DAAC,CA,USA.http://dx.doi.org/10.5067/TEMSC-3MJ62.58IntergovernmentalPanelonClimateChange(IPCC),2021:SummaryforPolicymakers.In:AR6ClimateChange2021:ThePhysicalScienceBasis,https://www.ipcc.ch/report/ar6/wg1/downloads/report/IPCC_AR6_WGI_SPM_final.pdf.59https://snowcover.orgoftheyearwereovertheremnantLarsenBandCiceshelvesontheAntarcticPeninsula;mostotherlocationsexperiencednear-normalmeltextentrelativetothemean1990–2020conditions.Despitenear-normalsurfacemeltinginAntarcticainsummer2020/2021,GRACE-FOsatellitegravitydataindicatethattheAntarcticicesheetcontinuedtolosemassinearly2021(Figure15),associatedwithcalvingandmarineicesheetmeltingintheAmundsenSeasectorofWestAntarctica.Antarcticicesheetmasslosssince2010islargelydrivenbythinningandgrounding-lineretreatofThwaitesGlacier,triggeredbyoceanwarminginthissectoroftheicesheet.56GRACE-FOdata57indicatethatAntarcticalostamassof296GtfromNovember2020toNovember2021,whichisroughlydoubletheaveragerateoficelossinAntarcticafrom2002to2021(Figure15).SNOWSeasonalsnowcoverinthenorthernhemi-sphere(NH)hasbeenexperiencingalong-termdeclineinthelatespringandsummer,alongwithevidenceofrelativestabilityorincreasesinsnowextentintheautumn.58Snow-coverextent(SCE)in2021wasconsist-entwiththeselong-termtrends,withaMayNHsnowcoveranomalyof–2millionkm2,thethirdlowestintheSCErecordfrom1970–2021(Figure17),basedonanalysesoftheRutgersNorthernHemisphere(NH)SnowCoverExtent(SCE)product.59Reductionsinnorthernhemispherespringsnowextentareconsistentacrossdatasets,andin2021thiswasdrivenbybelow-normalsnowcoverinFigure17.Maysnow-coverextent(SCE)anomalyinthenorthernhemisphere(NH)fortheperiod1970–2021,relativetothe1991–2020average.Source:RutgersNorthernHemisphereSnowCoverExtentproduct:https://snowcover.org.–3–2–101234519701972197419761978198019821984198619881990199219941996199820002002200420062008201020122014201620182020Millionskm22021Year19Eurasianhighlatitudes.EurasianArcticsnowextentinMayandJune2021werethefifthandthirdlowestonrecordfortheperiod1967–2021.60PERMAFROSTPermafrostoccursbeneathaboutoneeighthofEarth’sexposedlandarea.Itisgroundthatremainsatorbelow0°Cforatleasttwoconsecutiveyears.Permafrostthawcanleadtolandscapeinstabilityandotherimpacts,includingtheemissionofgreenhousegasesfrompreviouslyfrozenorganicmaterial.Aspermafrosttemperatureapproaches0°C,changesintemperatureintheice-richgroundarestalledduetothephasechangebetweeniceandwater.Whiletemperatureincreasemayleveloffnear0°Cforseveralyearsordecadesduetothephasechange,theimpactsofpermafrostwarmingandthawongroundstability(includingsubsidenceandmassmovements),hydrology,ecosystemsandinfrastructureareoftenclearlyvisible(Figure18).Sincethe1990s,theGlobalTerrestrialNetworkforPermafrost(GTN‐P)hascompileddatasets60Mudryk,L.;Chereque,A.E.;Derksen,C.etal.TerrestrialSnowCover.InArcticReportCard2021;Moon,T.A.;Druckenmiller,M.L.;Thoman,R.L.,Eds.;NationalOceanicandAtmosphericAdministration,2021.https://doi.org/10.25923/16xy-9h55.ofpermafrosttemperatures(temperaturemeasuredinboreholes)andactivelayerthickness(themaximumthicknessofthesea-sonallythawedlayerabovethepermafrost).GTN-Pproductsrelymostlyonresearchprojectstosustainactivities.Long-termdataseriesfromnationalandregionalnetworksoperatinginmountainandpolarareasshowacontinuationofpastwarmingtrendsupto2020,whichisthemostrecentdataavailable.STRATOSPHERICOZONEFollowingthesuccessoftheMontrealProtocol,theuseofhalonsandchlorofluor-ocarbons(CFCs)hasbeenreportedasdiscon-tinued,althoughtheirlevelsintheatmospherecontinuetobemonitored.Becauseoftheirlonglifetime,thesecompoundswillremainintheatmosphereformanydecades.Eveniftherewerenonewemissions,thereisstillmorethanenoughchlorineandbrominepresenttocausethecompletedestructionofozoneoverAntarcticafromAugusttoDecember.Asaresult,theformationoftheAntarcticozonehole–anareaoflowozoneconcentration–continuestobeanannualFigure18.Recentslopeinstabilityassociatedwithpermafrostthaw,includingactivelayerdetachmentslidesandretrogressivethawslumps.Intheforeground,largeamountsofmaterialhavepushedintotherivertoformadebristongue.FoothillsoftheMackenzieMountainssouthofNormanWells,north-westernCanada.Credit:GovernmentofNorthwestTerritories,Canada.20springevent,withtheyear-to-yearvariationinitssizeanddepthgovernedtoalargedegreebymeteorologicalconditions.The2021Antarcticozoneholedevelopedrelativelyearlyandcontinuedgrowing,resultinginalargeanddeepozonehole.Itexpandedto24millionkm2on24Septemberandremainedclosetothisvalueuntilmid-October2021.Thedevelopmentofthehole,anditsextentandseverity,wereclosetothatforthe2020and2018seasons.Theozoneholereacheditsmaximumareaof24.8millionkm2on7October2021,similartotheareasin2020and2018,andclosetothehighestvaluesobservedinearlieryears,suchas28.2millionkm2in2015and29.6millionkm2in2006,accordingtoananalysisfromtheNationalAeronauticsandSpaceAdministration(NASA)(Figure19,left).Intermsofthetotalozonecolumn,NASAreportedaminimumozoneof92DU(DobsonUnits)on7October2021,whichwasthelow-estvalueforthe2021seasonandforthepast17years(Figure19,right).AfterSeptember2021,theconcentrationofstratosphericozonewaspersistentlyreducedtonear-zerovaluesbetween15and20kmaltitudeoverAntarctica.Togetherwiththe2020season,thesearesomeofthelowestozonevaluesevermeasuredviasondesattheAntarcticstations,asreportedbytheNationalOceanicandAtmosphericAdministration(NOAA).The2021holewaslargeranddeeperthan70%oftheozoneholessince1979,andremainedassuchuntiltheclosingoftheholeinthesecondhalfofDecember.Itrankedasthethirteenthlargestozoneholebyareaandthesixthdeepestozoneholeintermsofminimumozone.Theunusuallydeepandlargeozoneholein2021wasdrivenbyastrongandstablepolarvortexandcolder-than-averageconditionsin2021inthestratosphere.DRIVERSOFSHORT-TERMVARIABILITYTherearemanydifferentnaturalphenomena,oftenreferredtoasclimatepatternsorclimatemodes,thataffectweatherattimescalesrangingfromdaystoseveralmonths.Surfacetemperatureschangerelativelyslowlyovertheocean,sorecurringpatternsinsea-surfacetemperaturecanbeusedtounderstandand,insomecases,predictthemorerapidlychangingpatternsofweatheroverlandonseasonaltimescales.Similarly,albeitatafasterrate,knownpressurechangesintheatmospherecanhelpexplaincertainregionalweatherpatterns.In2021,theElNiño–SouthernOscillation(ENSO),theIndianOceanDipole(IOD),theArcticOscillation(AO)andtheSouthernAnnularMode(SAM)eachcontributedtoFigure19.Left:Ozoneholearea(millionsofkm2).Right:Minimumozone,wherethetotalozonecolumnislessthan220DobsonUnits.Theyear2021isshowninred.Themostrecentyearsareshownforcomparisonasindicatedbythelegend.Thesmooth,thickgreylineisthe1979–2020average.Theblueshadedarearepresentsthe10thto90thpercentiles,andthegreenshadedarearepresentsthe30thto70thpercentilesfortheperiod1979–2020.Thethinblacklinesshowthemaximumandminimumvaluesforeachdayinthe1979–2020period.Source:TheplotwasgeneratedatWMOonthebasisofdatadownloadedfromtheNASAOzoneWatch(https://ozonewatch.gsfc.nasa.gov/).TheNASAdataarebasedonsatelliteobservationsfromtheOMIandTOMSinstruments.Ozoneholearea–Southernhemisphere1979–202020172018201920202021Area(millionsofkm2)302520151050Jul.Aug.Sept.Oct.Nov.Dec.Months(a)Jul.Aug.Sept.Oct.Nov.Dec.Minimumozone–SouthernhemisphereOzone(DU)300250200150100Months(b)1979–20202017201820192020202121majorweatherandclimateeventsindifferentpartsoftheworld,andaredescribedinfurtherdetailbelow.ELNIÑO–SOUTHERNOSCILLATIONENSOisoneofthemostimportantdriversofyear-to-yearvariabilityinweatherpatternsworldwide.Itislinkedtohazardssuchasheavyrains,floodsanddrought.ElNiño,char-acterizedbyhigher-than-averagesea-surfacetemperaturesintheeasternTropicalPacificandaweakeningofthetradewinds,typicallyhasawarminginfluenceonglobaltemper-atures.LaNiña,whichischaracterizedbybelow-averagesea-surfacetemperaturesinthecentralandeasternTropicalPacificandastrengtheningofthetradewinds,hastheoppositeeffect.LaNiñaconditionsemergedinmid-2020andpeakedintheOctober–Decemberperiodatmoderatestrength,withaveragesea-surfacetemperatures1.3°Cbelowthe1991–2020normalintheNiño3.4region(5°N–5°S,120°W–170°W).LaNiñaweakenedthroughthefirsthalfof2021,reachinganENSO-neutralstate(temperatureswithin0.5°Cofnormal)inMay,accordingtobothoceanicandatmosphericindicators.However,sea-surfacetemperaturescooledaftermid-year,reachingLaNiñathresholdsonceagainbytheJuly–Septemberperiod.BytheOctober–Decemberperiod,averagesea-surfacetemperaturesonceagainreachedmoderatestrength,at1.0°Cbelownormal.InadditiontohavingatemporarycoolinginfluenceonEarth’sglobaltemperature,LaNiñaisassociatedwithdrier-than-normalconditionsinEastAfrica.Kenya,EthiopiaandSomaliaexperiencedconsecutivebelow-averagerainfallseasonsinlate2020,early2021andlate2021,whichledtodroughtintheregion.Inearly2021,precipitationwashigherthannormalovertheMaritimeContinent61(theclimatologicallyimportantregionofislandsandseasbetweenmainlandSouth-eastAsiaandAustraliaandbetween61Ramage,C.S.RoleofaTropical“MaritimeContinent”intheAtmosphericCirculation.MonthlyWeatherReview1968,96(6),365–370.https://journals.ametsoc.org/view/journals/mwre/96/6/1520-0493_1968_096_0365_roatmc_2_0_co_2.xml.62http://www.bom.gov.au/climate/enso/history/ln-2010-12/IOD-what.shtml63http://www.bom.gov.au/climate/current/statements/scs75.pdftheIndianandPacificOceans)andlowerthannormalinPatagoniaatthebeginningoftheyear,whicharetypicalpatternsassociatedwithLaNiña.Additionally,LaNiñaconditionscancontributetoabove-averagehurricaneactivityintheNorthAtlantic,whichexpe-rienced21namedtropicalcyclonesduringits2021hurricaneseason(the1981–2010averagefortheentireseasonis14).LaNiñaisalsoassociatedwithwarmeranddrierareasacrossthesoutherntieroftheUnitedStatesofAmerica.InDecember,moststatesinthisregionreportedrecordornear-recordhightemperatures,andseveralstateswerealsodrierthanaverage.INDIANOCEANDIPOLEThepositivephaseoftheIODischaracterizedbybelow-averagesea-surfacetemperaturesintheEasternIndianOceanandabove-averagesea-surfacetemperaturesinthewest.Thenegativephasehastheoppositepattern.Theresultingchangeinthegradientofsea-surfacetemperatureacrosstheoceanbasinaffectstheweatherofthesurroundingcontinents,primarilyinthesouthernhemisphere.PositiveIODeventsareoftenassociatedwithElNiñoandnegativeeventswithLaNiña.62AnegativeIODdevelopedduringJuly2021andreturnedtoneutral,althoughonthenegativeside,bytheendoftheyear.ThismarkedthefirstnegativeIODsince2016.IncombinationwithLaNiña,thisphasecontributedtowetconditionsinmuchofAustraliainthelateaustralwinterandspring.South-westWesternAustraliareporteditshighestJulyrainfalltotalssince1996,asdidmanylocationsinSouthAustralia.Australiaasawholeobserveditstenthwettestspringinits122-yearrecord,withthestateofNewSouthWalesobservingitsfourthwettest.NovemberwasthewettestNovembersincerecordsbeganforbothNewSouthWalesandAustraliaasawhole.63Conversely,thenegativeIOD,againincombinationwithLaNiña,likelycontributedtotheextremedryconditionsinEasternAfrica.22ARCTICOSCILLATIONTheAOisalarge-scaleatmosphericpat-ternthatinfluencesweatherthroughoutthenorthernhemisphere.64Thepositivephaseischaracterizedbylower-than-averageairpres-sureovertheArcticandhigher-than-averagepressureovertheNorthernPacificandAtlanticOceans.Thejetstreamrunsparalleltothelinesoflatitudeandfarthernorththanaverage,lockingupcoldArcticair,andstormscanbeshiftednorthwardoftheirusualpaths.Themid-latitudesofNorthAmerica,Europe,SiberiaandEastAsiagenerallyseefewercoldairoutbreaksthanusualduringthepositivephaseoftheAO.AnegativeAOhastheoppositeeffect,associatedwithamoremeanderingjetstreamandcoldairspillingsouthintothemid-latitudeswherethejetstreamdipssouthward.TheAOwasnegativeduringthenorthernhemisphere2020/2021winterand,seasonally,wasthemostnegativeonrecordsincewinter2009/2010(Figure20).ThejetstreamsweptdownoverNorthAmerica,contributingtothecoldestFebruaryforthecontinentsince1994.However,thesamewavyjetstreamalsocontributedtoextremewarmthinpartsofNorthernandEasternAsiainFebruary2021asitsurgednorthwardoverthearea,with64Thompson,D.W.J.;Wallace,J.M.TheArcticOscillationsignatureinthewintertimegeopotentialheightandtemperaturefields.GeophysicalResearchLetters1998,25(9),1297–1300.65Rigor,I.G.;Wallace,J.M.;Colony,R.L.ResponseofSeaIcetotheArcticOscillation.JournalofClimate2002,15(18),2648–2663.https://doi.org/10.1175/1520-0442(2002)015<2648:ROSITT>2.0.CO;2.regionsinMongolia,China,JapanandtheRepublicofKoreareportingrecordhightem-peraturesforthistimeofyear.ThecontrastbetweenthepositiveAO(winter2019/2020)andthenegativeAO(winter2020/2021)couldexplainsomeofthedifferencesbetweentemperaturepatternsinthefirstquartersof2020and2021.ThenegativewinterphaseoftheArcticOscillationhasalsobeenlinkedtomoremoderateArcticsea-icelossthefollowingsummer65(seeArcticseaice).SOUTHERNANNULARMODEOntheoppositesideoftheworld,theSAM(alsoreferredtoastheAntarcticOscillation,AAO)isalarge-scaleatmosphericpatternthatinfluencesweatherinthesouthernhem-isphere.Itismeasuredbythenorth–southmovementofthewesterlywindbeltthatcirclesAntarctica,dominatingthemiddletohigherlatitudesofthesouthernhemisphere.ThepositivephaseischaracterizedbythebeltofstrongwesterlywindscontractingtowardsAntarcticaandislinkedtotheLaNiñaphaseofENSO.DuringapositiveSAM,warmandmoistwesterlyflowoverthenorthernPeninsulaleadstofoehnwarmingontheeasternsideandanomalouswarmth.Thenegativephase,incontrast,ischaracterized43210–1–2–3–4–52000/20012001/20022002/20032003/20042004/20052005/20062006/20072007/20082008/20092009/20102010/20112011/20122012/20132013/20142014/20152015/20162016/20172017/20182018/20192019/20202020/2021FebruaryJanuaryDecemberMonthlyindexvaluesFigure20.ArcticOscillationmonthlyindexvaluesfornorthernhemispherewintermonths2000/2021.Decemberisinblue,JanuaryinorangeandFebruaryingrey.Source:NationalOceanicandAtmosphericAdministration(NOAA)ClimatePredictionCenter.23byanexpansionofthebeltofstrongwesterlywindstowardstheequator.66Notably,theSAMcanhavelargeimpactsonAntarcticsurfacetemperatures,oceancirculationandrainfallpatternsinpartsofAustralia.TheSAMwasprimarilypositiveorneutralthroughout2021,andwasstronglypositivebothatthebeginningoftheyearandneartheendoftheyear.67Thispositivepatternlikelycontributedtotherecordcoldaustralwinter66http://www.bom.gov.au/climate/sam/67http://www.nerc-bas.ac.uk/icd/gjma/sam.htmlandApril–SeptembercoldseasonattheSouthPole,asitcreatedanomalouslowwindspeedandwinddirectionspredominantlyfromthenortheastatthepoleandpreventedwarmairmassesfromreachingthearea.Conversely,EsperanzaStation,onthenorth-eastAntarcticPeninsula,experienceditswarmestyearonrecord,withanaveragetemperatureof−2.6°C.On18December,thetemperaturereached14.6°C,anall-timeDecemberhighforthestation.24Althoughunderstandingbroad-scalechangesintheclimateisimportant,theacuteimpactsofweatherandclimatearemostoftenfeltduringextrememeteorologicaleventssuchasheavyrainandsnow,droughts,heatwaves,coldwavesandstorms,includingtropicalstormsandcyclones.Thesecanleadtoorexacerbateotherhigh-impacteventssuchasflooding,landslides,wildfiresandavalanches.ThissectionisbasedlargelyoninputfromWMOMembers.ThewidersocioeconomicrisksandimpactsassociatedwiththeseeventsaredescribedinRisksandimpacts.HEATWAVESANDWILDFIRESExceptionalheatwavesaffectedWesternNorthAmericaonseveraloccasionsduringJuneandJuly.Bysomemeasures,themostextremewasinlateJuneinthenorth-westernUnitedStatesandwesternCanada.Lytton,insouth-centralBritishColumbia,reached49.6°Con29June,breakingthepreviousCanadiannationalre-cordby4.6°C,withtemperaturesreachingthemid-40sasfarwestastheeasternsuburbsofVancouverandtheinteriorofVancouverIsland.Itwasalsomorethan5°Chigherthantheprevioushighestknowntemperaturenorthof50°N.Largenumbersofheat-relateddeathsoccurred,with569reportedinBritishColumbiaalonebetween20Juneand29July,68and185inAlberta,69whileintheUnitedStatesoverasimilarperiod,154heat-relateddeathswerereportedinWashington70andatleast83inOregon.71Manylong-termstationsbrokerecordsby4°Cto6°C,includingPortland,Oregon(46.7°C).Therewerealsomultipleheatwavesinthesouth-westernUnitedStates.DeathValley,Californiareached54.4°Con9July,equallingasimilar2020valueasthehighestrecordedintheworldsinceatleastthe1930s.Itwentontobethehottestsum-meronrecordaveragedoverthecontinentalUnitedStates.68https://www2.gov.bc.ca/gov/content/life-events/death/coroners-service/news-and-updates/heat-related69https://www.canada.ca/en/environment-climate-change/services/top-ten-weather-stories/2021.html70https://www.doh.wa.gov/Emergencies/BePreparedBeSafe/SevereWeatherandNaturalDisasters/HotWeatherSafety/HeatWave2021#heading8845571OregonMedicalExaminer’sOffice,quotedinmediareports,https://flashalert.net/id/OSPOre/14635272https://www.nifc.gov/73https://www.emdat.be/Therewerenumerousmajorwildfiresduringandaftertheheatwaves(includingonewhichlargelydestroyedthetownofLyttonthedayafteritsrecordtemperature).TheDixiefireinnorthernCalifornia,whichstartedon13July,burnedabout390000hectaresbeforebeingfullycontainedinOctober,makingitthelargestsinglefireonrecordinCalifornia.ArarewinterwildfirecausedmajorpropertylosseseastofBoulder,Coloradoon30December,withmorethan1000homesandotherbuildingsdestroyedordamaged.TheoverallareaburnedduringtheseasonintheUnitedStateswasslightlybelowaver-age,72butinCanadaitwaswellaboveaverage,withOntariohavingitslargestseasonalareaburnedonrecordandBritishColumbiaitsthirdlargest.ProlongedsmokepollutionaffectedmanypartsofNorthAmericaduringthesummer,withCalgaryreportingarecord512hoursofsmokeorhaze,comparedwiththelong-termaverageof12.ExtremeheataffectedthebroaderMediterraneanregiononseveraloccasionsduringthesecondhalfofthenorthernhemispheresummer.ThemostexceptionalheatwasinthesecondweekofAugust.On11August,anagrometeorologicalsta-tionnearSyracuseinSicily,Italy,reached48.8°C,aprovisionalEuropeanrecord,whileKairouan(Tunisia)reachedarecord50.3°C.Montoro(47.4°C)setanationalrecordforSpainon14August,whileonthesamedayMadrid(BarajasAirport)haditshottestdayonrecordwith42.7°C.Earlier,on20July,Cizre(49.1°C)setaTurkishnationalrecordandTbilisi(Georgia)haditshottestdayonrecord(40.6°C).Majorwildfiresoccurredacrossmanypartsoftheregion,withAlgeria,southernTurkeyandGreeceespeciallybadlyaffected.Over40deaths73occurredintheAlgerianfires.France,Italy,NorthMacedonia,Lebanon,Israel,Libya,TunisiaandMoroccoalsoexperiencedsignificantwildfiresduringtheperiod.High-impacteventsin202125JunewasexceptionallywarminmanypartsofEasternandCentralEurope.NationalJunerecordsweresetforEstonia(34.6°C)andBelarus(37.1°C),whilelocationswhichhadtheirhottestJunedayonrecordincludedSt.Petersburg(35.9°C)andMoscow(34.8°C),bothon23June,Yerevan(Armenia,41.1°C)onthe24th,andBaku(Azerbaijan,40.5°C)onthe26th.TampereinFinlandreporteditshighesttemperatureonrecord(33.2°C)on22June.LatviahaditshottestJuneandsum-meronrecord.Furtherafield,LibyaalsosawaprolongedheatwaveinlateJune.Laterinthesummer,abnormalwarmthalsoreachedNorth-westEurope;31.3°CatCastledergon21JulywasarecordforNorthernIreland.TwotropicalnightswereobservedinIrelandinJuly,withdailyminimumtemperaturesexceeding20°CinCountyKerry.Forthethirdsuccessiveyear,thereweremajorwildfiresduringthesummerinSiberia,particularlyintheSakhaRepublicaroundYakutsk.AccordingtoareportbytheFederalForestryAgencyofRussia,thenumberoffiresinYakutiabytheendofthesummerwas2295,withanareaofabout8.9millionhectaresburnedsincethebeginningoftheforestfireseason.FireactivityintheAmazonregionduringtheAugust–Septemberpeakseasonwaslessthanin2019or2020,74buttherewasextensivefireactivityinotherpartsofBrazil,includingthePantanal.COLDSPELLSANDSNOWAbnormallycoldconditionsaffectedmanypartsofthecentralUnitedStatesandnorthernMexicoinmid-February.ThemostsevereimpactswereinTexas,whichgenerallyexperienceditslowesttemperaturessinceatleast1989,withtemperaturesinsomeareasstayingbelowfreezingcontinuouslyfor6to9days.On16February,OklahomaCityreached−25.6°CandDallas−18.9°C,theirlowesttemperaturessince1899and74https://queimadas.dgi.inpe.br/queimadas/portal-static/estatisticas_estados/75https://www.ncdc.noaa.gov/billions/events/US/202176http://www.aemet.es/en/conocermas/borrascas/2020-2021/estudios_e_impactos/filomena1949respectively.Electricitytransmissionwasseverelydisrupted,withpoweroutag-esaffectingnearly10millionpeopleattheevent’speak.Frozenpipeswereanothermajorcauseofdamage.Atotalof226deathswerereportedintheUnitedStatesalongwithanestimatedUS$24billionineconomiclosses,makingitthecostliestwinterstormonrecordfortheUnitedStates.75Thewinterof2020/2021wasacoldwinterinmanypartsofNorthernAsia.TheRussianFederationhaditscoldestwintersince2009/2010.Below-averagetemperaturesaffectedmuchofJapaninlateDecemberandearlyJanuary,withheavysnowfallsonanumberofoccasions.AnumberoflocationsontheSeaofJapancoastofHonshuhadtheirheaviest72-hoursnowfallonrecordinearlyJanuary.MuchofChinawasalsounusuallycoldduringthisperiod,withBeijingreaching−19.6°Con7January,itslowesttemperaturesince1966.AseveresnowstormhitmanypartsofSpainfrom7to10January,followedbyaweekoffreezingairtemperatures.Atotalof53cmofsnowfellatthecentralcitylocationofRetiro(Madrid),andheavyfallswerealsoreportedinmanyotherpartsofSpain.76Someloca-tions,includingToledo(−13.4°C)andTeruel(−21.0°C),hadtheirlowesttemperaturesonrecordon12Januaryinthewakeofthestorm.Thereweremajordisruptionstolandandairtransport.Laterinthewinter,inthesecondweekofFebruary,theNetherlandsexperienceditsmostsignificantsnowstormsince2010,withheavysnowalsofallinginGermany,PolandandtheUnitedKingdom;inthewakeofthestorm,Braemarrecorded−23.0°Con12February,thelowesttem-peratureintheUnitedKingdomsince1995.InSouth-easternEurope,Athenshaditsheaviestsnowsince2009on15February.Libyaexperiencedunusualsnowfallsbetween15and21Februaryandagain,onhighground,inlateDecember.AnabnormalspringcoldoutbreakaffectedmanypartsofEuropeinearlyApril.Record26lowApriltemperaturesinFranceincluded−7.4°CatSaint-Etienneonthe8thand−6.9°CatBeauvaisonthe6th,whileBelgrade(Serbia)haditsheaviestAprilsnowfallonrecordonthe7th.ItwasthecoldestAprilinPolandinthetwenty-firstcentury.Athighelevations,nationalrecordsforAprilweresetforSwitzerland(−26.3°CatJungfraujoch)andSlovenia(−20.6°CatNovavasnaBlokah).ThisfollowedaverywarmendtoMarchwithFrancehavingitswarmestMarchdayonrecordonthe31st.Frostdamagetoagriculturewaswidespreadandsevere,withlossestovineyardsandothercropsinFrancealoneexceedingUS$4.6billion.TheUnitedKingdomwentontohaveitslowestmonthlymeantemperatureforAprilsince1922.PRECIPITATIONComparedtotemperature,precipitationischaracterizedbyhigherspatialandtempo-ralvariability.In2021,largeregionswithabove-normalprecipitationtotals,relativetothechosenclimatologyperiod(1951–2000),wereEasternEurope,South-eastAsia,theMaritimeContinent,areasofNorthernSouthAmericaandpartsofSouth-easternNorthAmerica(Figure21).LargeregionswitharainfalldeficitincludedSouth-westAsiaandtheMiddleEast,partsofSouthernAfrica,partsofSouthernSouthAmericaandareasinCentralNorthAmerica.TheonsetoftheWestAfricanMonsoonwasdelayed.Laterintheseason,rainfalltotalswerehigherthannormal,especiallyinthewesternmonsoonregion.Intotal,theseason-alrainfallwasclosetonormal.InSouthernAfrica,inanareacentredonZambia,rainfallamountsduringthewetseasonuntilMaywerebelowthelong-termmean.Itwasatleastthesecondyearinarowwithbelow-normalrainfallforMadagascar;rainfalltotalshavebeenbelowaverageinmostyearssince2011.Inaddition,boththewetseasons(ApriltoMayandOctobertoNovember)weredrierthanusualintheGreaterHornofAfricaregion.AboveaveragerainfalltotalswereobservedinAlaskaandthenorthofCanada,andinthesouth-easternUnitedStatesandpartsoftheCaribbean.Betweenthesetwowetter-than-averagebandswasaswathofunusuallydryconditionsextendingacrossthewidthofthecontinent.Unusuallyhighprecipitationamounts,relativetothereferenceperiod,wererecordedinsouth-westernandsouth-easternAustralia.Ontheotherhand,abnormallylowprecipi-tationamountswerereceivedontheNorthIslandofNewZealand.Latitude90°N45°N0°45°S90°S180˚90˚W0˚90˚E180˚Longitude0.00.20.40.60.81.0QuantileFigure21.Totalprecipitationin2021,expressedasapercentileofthe1951–2010referenceperiod,forareasinthedriest20%(brown)andwettest20%(green)ofyearsduringthereferenceperiod,withdarkershadesofbrownandgreenindicatingthedriestandwettest10%,respectively.Source:GlobalPrecipitationClimatologyCentre(GPCC),DeutscherWetterdienst,Germany.27UnusuallylowprecipitationamountsfellaroundtheMediterraneanSea,whileunu-suallyhightotalsweredetectedaroundtheBlackSeaandinpartsofEasternEurope.FLOODExtremerainfall,whichwasenhancedbythemoistureinfluxaheadofTyphoonIn-fa,hitHenanprovinceincentralChinafrom17to21July.ThemostseverelyaffectedareawasaroundthecityofZhengzhou(thecapitalofHenanProvince),whichon20Julyreceived201.9mmofrainfallinonehour(aChinesenationalrecord)and382mmin6hours.Fortheeventasawhole,theareareceived720mm,morethanitsannualaverage.Thecityexperiencedextremeflashflooding,withmanybuildings,roadsandsubwaysinundated.Thefloodingwasassociatedwith380deathsormissingpersons,andeconomiclossesofUS$17.7billionwerereported.77Furtherlate-seasonfloodingoccurredinearlyOctober,focusedonShanxiandHebeiprovinces.WesternEuropeexperiencedsomeofitsmostseverefloodingonrecordinmid-July.Theworst-affectedareawaswesternGermanyandeasternBelgium,where100to150mmofrainfelloverawideareaon14–15Julyontogroundwhichwasalreadyunusuallywetafterhighrecentrainfall.Hagen(Germany)reported241mmofrainfallin22hours.Numerousriversexperiencedextremeflood-ing,withseveraltownsinundated,andtherewerealsoseverallandslides.France,theNetherlands,LuxembourgandSwitzerlandalsoexperiencedsignificantflooding.ThenumberofdeathsreportedinGermanywas183,andinBelgiumitwas36,witheconomiclossesinGermanyexceedingUS$20billion.78Persistentheavyrainfallinmid-MarchresultedinmajorfloodingineasternNewSouthWales77RM114.3billion,fromChina’snationalcontribution78Nationalcontribution,Germany79http://www.bom.gov.au/climate/current/statements/scs74.pdf?2021062180https://reliefweb.int/disaster/fl-2021-000050-afg81http://www.cprm.gov.br/sace/boletins/Amazonas/20211022_11-20211025%20-%20114229.pdfinAustralia.79Theweekfrom18to24MarchwasthewettestonrecordaveragedovercoastalNewSouthWales.ThemostseverefloodingwasalongtheHastings,KaruahandManningRiversnorthofSydney,buttherewasalsosignificantfloodinginotherareas,includingpartsofwesternSydney.Therewasalsofloodingonmanyinlandrivers,whichledtosubstantialrecoveryinwaterstoragesseverelydepletedbythe2017–2019drought.AtleastUS$2.1billionineconomiclosseswerereported.Twoflashfloodeventsassociatedwithlocal-izedheavyrainfalloccurredinAfghanistanduring2021,inearlyMayaroundHeratinthewest,andon28–29JulycentredonNuristanintheeast.Therewassignificantlossoflifeinbothevents,with61deathsreportedintheMayeventand113intheJulyevent.80FlashfloodingoccurredonseveraloccasionsaroundtheMediterraneanandBlackSeacoasts.ThemostimpactfuleventwasontheBlackSeacoastofTurkeyon10August,whereseveraltownsexperiencedseveredamageand77deathswerereported.Rainfallof399.9mmwasrecordedatBozkurtin24hours.Thiseventwasassociatedwitha“Medicane”–astormformingoutsidethetropicsthatneverthelesshascharacteristicsofatropicalstorm–intheBlackSea.ExtremerainfallandfloodingwerealsoreportedontheBlackSeacoastoftheRussianFederationfrom12to14August.On4October,exceptionalrainfallfellincoastalregionsofLiguria(north-westItaly),including496.0mmin6hoursatMontenotteInferioreand740.6mmin12hoursatRossiglione.Persistentabove-averagerainfallinthefirsthalfoftheyearinpartsofNorthernSouthAmerica,particularlythenorthernAmazonbasin,ledtosignificantandlong-livedflood-ingintheregion.TheRioNegroatManaus(Brazil)reacheditshighestlevelonrecord,peakingat30.02mon20June.81Themost28widespreadfloodingwasreportedinnorthernBrazil,butGuyana,BolivarianRepublicofVenezuelaandColombiawerealsoaffected.TheprogressandwithdrawaloftheIndianMonsoonwasdelayed,butoverallIndianmonsoonrainfallwasclosetoaverage,withabove-averagerainfallsinthewestoffsetbybelow-averagevaluesinthenorth-east.Duringthecourseoftheseason,529deathsinIndiaand198inPakistan(asof30September)wereattributedtoflooding,withfurtherdeathsinBangladeshandNepal.82TherewasfurtherfloodingineasternIndiaandNepalduringthenorth-eastmonsoonseasoninOctoberandNovember.InEasternAsia,easternChina(exceptforHenan)wasgen-erallylesswetduringthemonsoonseasonthanin2020,butAugustwasextremelywetinJapan.WesternJapanhaditswettestAugustonrecord,83withsomelocationsreceivingmorethan1400mmofrainbetween11and26August.AtropicaldepressionmadelandfallinMalaysiaon16December,leadingtoseverefloodinginSelangorandKualaLumpur,withatleast52deathsreported.AtKualaLumpurInternationalAirport,230mmofrainwasreportedin12hourson17–18December.84TherainyseasonintheAfricanSahelwasgenerallyclosetotheaverage(1951–2000),andlesswetthaninsomerecentyears,althoughtherewasstillsomesignificantfloodingreported,especiallyinNiger,SudanandSouthSudanaswellasMali.ElsewhereinAfrica,LakeTanganyikarosetomorethan3maboveitsnormallevelinMay,85displacinglakeshoreresidentsinBurundi,whileLakeVictoriarosetoitshighestlevelsincesatellitedatabeganin1992,surpassingitspeakfromthepreviousyear.HighflowsintheNiledownstreamofLakeVictoria,alongwithsubstantialstandingwaterstillremainingfromfloodsin2020,contributedtocontinuedfloodinginpartsofSouthSudan82NationalcontributionsofIndiaandPakistan;EM-DAThas120deathsinNepalovertwoincidentsand21inBangladeshfromone83https://ds.data.jma.go.jp/tcc/tcc/news/press_20210924.pdf84https://reliefweb.int/disaster/fl-2021-000209-mys85https://reliefweb.int/disaster/fl-2021-000039-bdi86https://clima.inmet.gov.br/prec87http://www.ons.org.br/Paginas/Noticias/20210707-escassez-hidrica-2021.aspxandSudandespitenear-normalrainfallin2021.InSouthernAfrica,muchofwhichhadbeenexperiencinglong-termdrought,rainfallduringthe2020/2021rainyseasonwasaboveaverageinsomeregions,includingnorthernSouthAfricaandZimbabwe,withsomefloodingreported,butwasnearorbelowaveragefurthernorth.WesternCanadawasaffectedbyseverefloodinginNovember.AtnumerouslocationsinsouthernBritishColumbia200to300mmofrainfellin60hours,causingfloodsandlandslides(insomecasesexacerbatedbyrunofffromfire-affectedareas).Transportwasseverelydisrupted,withmostmajorroutesconnectingVancouverwiththerestofCanadaclosedforseveralweeks,andseveralcommunitieswerepartlyorwhollyinundated.Sixdeathswerereported,andeconomiclossesexceededCan$2billion.Floodingalsoaffectedadjacentareasofthenorth-westernUnitedStates.SeattleandVancouverbothhadtheirwettestautumnsonrecord.DROUGHTSignificantdroughtaffectedmuchofsub-tropicalSouthAmericaforthesecondsuc-cessiveyear.RainfallwaswellbelowaverageovermuchofcentralandsouthernBrazil,86Paraguay,UruguayandnorthernArgentina.Thedroughtledtosignificantagriculturallosses,exacerbatedbyacoldoutbreakattheendofJuly,inwhichmaximumtemperatureswerebelow10°CforfiveconsecutivedaysoverhigherpartsofsouthernBrazilandwhichcontributedtodamageinmanyofBrazil’scoffee-growingregions.Lowriverlevelsalsoreducedhydroelectricityproduction87anddisruptedrivertransport.TheBraziliangovernmentdeclaredasituationofcriticalscarcityofwaterresourcesintheParaná29hydrographicregion,withnumerouswaterstoresatorneartheirlowestlevelsinthelast20years.88The24-monthStandardizedPrecipitationIndex(SPI)overtheregionreacheditslowestlevelsincethe1960s.TheParaguayRiveratAsuncionfelltoarecordlow0.75mbelowthereferencelevelon6October,0.21mbelowthepreviousrecordsetin2020.InChile,wherelong-termdroughthaspersistedforthelastdecade,2021wasanotherdryyear,withmostlocationshavingrainfallatleast30%belowaverage.AnumberoflocationssouthofSantiagohadtheirdriestyearonrecordin2021withtotals40%to50%belownormal,includingConcepción(559.2mm),Valdivia(949.0mm)andPuertoMontt(921.7mm).WidespreaddroughtinWesternNorthAmerica,whichhadbecomeestablishedduring2020,spreadandintensifiedin2021.BySeptember,extremetoexceptionaldroughtcoveredmostoftheUnitedStatesoverandwestoftheRockyMountains,despitesomeslighteasingfromJulyonwardsinpartsoftheinlandsouth-west,duetoanactivesummermonsoon.ExtremetoexceptionaldroughtalsoextendedeastwardsonbothsidesoftheUnitedStates–Canadaborder,affectingnorth-ernborderstatesasfareastasMinnesotaandthePrairieProvincesofCanada.The20monthsfromJanuary2020toAugust2021werethedriestonrecordforthesouth-westernUnitedStates,89withprecipitationmorethan10%belowthepreviousrecord.ForecastwheatandcanolacropproductionforCanadain2021was35%to40%below2020levels,90whileintheUnitedStates,thelevelofLakeMeadontheColoradoRiverfellinJulyto47mbelowfullsupplylevel,thelowestlevelonrecordsincethereservoirwasfullycommissioned.ThedroughtsituationinCaliforniawaseasedbyheavyraininlateOctoberandDecember–Sacramentohaditswettestdayonrecordwith138mmon24October,onlydaysafterendingarecord211-dayperiodwithnomeasurable88https://www.gov.br/ana/pt-br/assuntos/noticias-e-eventos/noticias/ana-declara-situacao-de-escassez-quantitativa-dos-recursos-hidricos-da-regiao-hidrografica-do-parana89https://www.drought.gov/news/new-noaa-report-exceptional-southwest-drought-exacerbated-human-caused-warming90https://www150.statcan.gc.ca/n1/daily-quotidien/210914/dq210914b-eng.htm91https://reliefweb.int/sites/reliefweb.int/files/resources/cb7310en.pdf92https://reliefweb.int/sites/reliefweb.int/files/resources/WFP%20Madagascar%20Country%20Brief%20-%20August%202021.pdfprecipitation–butdroughtcontinuedawayfromthewestcoastandextendedfarthereastthroughthesouth-centralUnitedStatesastheyearended.Significantdroughtaffectedlargear-easofSouth-westAsiaduring2021.Well-below-averageprecipitationfellduringthe2020/2021coolseasoninregionsin-cludingmostoftheIslamicRepublicofIran,Afghanistan,Pakistan,south-eastTurkey,andTurkmenistan.Pakistanhaditsthird-driestFebruaryandfifth-driestJanuary–Marchonrecord.Mountainsnowpackwasalsowellbelowaverage,withsnowcoverextentinIslamicRepublicofIranabouthalfthelong-termaverageformostofJanuaryandFebruary,leadingtoreducedstreamflowinriversdependingonsnowmelt,andreducedwateravailabilityforirrigation.DroughtdevelopedduringthecourseoftheyearintheGreaterHornofAfricaregion,par-ticularlyaffectingSomalia,KenyaandpartsofEthiopia,afterthreesuccessivebelow-averagerainyseasons.TheOctober–Decemberrainyseasonwasespeciallypoor,despitesomerainsinKenyalateintheseason.Aseveredrought,whichhaspersistedforatleasttwoyears,continuestoaffectsouthernMadagascar.91Rainfallforthe12monthsfromJuly2020toJune2021wasaround50%belownormalovertheregion.Thereweresignificantfoodsecurityissuesinthearea,with1.14millionpeopleclassifiedbytheWorldFoodProgrammeasneedingurgentassistanceasofAugust2021.92TROPICALCYCLONESTropicalcycloneactivityaroundtheglobein2021wasclosetoaverage(1981–2010).Forthesecondsuccessiveyear,theNorthAtlantic30hadaveryactiveseason,with21namedstorms,wellabovethe1981–2010averageof14.ItwasalsoanactiveseasonintheNorthIndianOcean,butactivityinthewesternNorthPacificandeasternNorthPacificwasneartoorbelowaverage.The2020/2021southernhemisphereseasonwasalsoslightlybelowaverageinboththePacificandIndianOceans.ThemostsignificanthurricaneoftheNorthAtlanticseasonwasIda.Idamadelandfallasacategory4systeminLouisiana(UnitedStates)on29Augustwithsustainedone-minutewindsof240kmperhour,equallingthestrongestlandfallonrecordforthestate,withmajorwinddamageandstormsurgeinundation.Thesystemthencontinuedonanorth-easttrackoverlandwithsignificantflooding,especiallyintheNewYorkCityarea.NewYork,whichhadalreadyexperiencedfloodingfromHurricaneHenritwoweeksearlier,hadarecordhourlyrainfallof80mm,with24-hourtotalsexceeding200mminpartsofthecity.Beforeitdevelopedintoatropicalcyclone,Ida’sprecursorsystemalsocausedsignificantfloodinginVenezuela.Intotal,72deathsweredirectlyattributedtoIdaand43deathswereindirectlyattributedtoitintheUnitedStatesandVenezuela,witheco-nomiclossesintheUnitedStatesestimatedatUS$75billion.93Anothersignificantland-fallduringtheseasonwasGrace,whichhitVeracruz(Mexico)asacategory3hurricane,havingearlierresultedinimpacts,mostlyfromflooding,inHaiti(whereithinderedpost-earthquakerecovery),theDominicanRepublic,Jamaica,andTrinidadandTobago.Inthesouthernhemisphere,2021’smostsignificantcyclone94wasSerojainApril.SerojaformedsouthofIndonesiaandtrackedsouth-easttowardsWesternAustralia.ItmadelandfallnearKalbarrion11Aprilasan(Australian)category3cyclone,thestrongestlandfallsofarsouthinWesternAustraliasince1956.Seroja’smostsevereimpactswere93https://www.ncdc.noaa.gov/billions/events/US/202194TropicalCycloneYasa(December2020)formspartof2020/2021seasonalstatisticsbutwasreportedoninthe2020StateoftheClimate.95https://reliefweb.int/disaster/tc-2021-000033-idn96https://rsmcnewdelhi.imd.gov.in/uploads/report/26/26_e0cc1a_Preliminary%20Report%20on%20ESCS%20TAUKTAE-19july.pdf97FromnationalcontributionsfromfloodingandassociatedlandslidesfromitsprecursorsysteminTimor-Leste,andtheIndonesianregionofEastNusaTenggara.Kupang(Timor)received700.4mmofrainfallinthefourdaysfrom2to5April.Atotalof226deathswereassociatedwithSeroja,181inIndonesia,44inTimor-LesteandoneinAustralia.95InJanuary,EloisecontributedtofloodinginSouthernAfrica,withdamageandcasualtiesreportedinMozambique,SouthAfrica,Zimbabwe,EswatiniandMadagascar,whileintheSouthPacific,AnaandNirancausedfloodingandpoweroutagesinFijiandNewCaledonia,respectively.ThemostseverecycloneoftheNorthIndianOceanseasonwasTauktae,whichtrackednorthoffthewestcoastofIndia,withapeakthree-minutesustainedwindspeed96of50–53mpersecond,beforemakinglandfallinGujaraton17Mayatslightlybelowpeakintensity,equallingthestrongestknownlandfallinGujarat.Atleast144deathswerereportedinIndiaand4inPakistan.97Laterintheseason,CycloneGulabcrossedtheeasterncoastofIndiafromtheBayofBengalinlateSeptember;theremnantsystemcrossedIndiabeforeemergingandre-intensifyingintheArabianSea,whereitwasrenamedShaheen.Shaheenmadelandfallon3OctoberonthenortherncoastofOmannorth-westofMuscat,thefirstcyclonesince1890tomakelandfallinthisarea.AlSuwaiqrecorded294mmrainin24hours,aboutthreetimestheregion’sannualaverage.Atotalof39deathswerereportedacrossIndia,Pakistan,OmanandtheIslamicRepublicofIran,mostlyfromflooding.ThemostsignificanttropicalcycloneoftheseasoninthewesternNorthPacificwasTyphoonRai(Odette),whichcrossedthecentralPhilippineson16December,makinglandfallatnearpeakintensity,withamini-mumcentralpressureof915hPa,afterrapidlyintensifyingpriortolandfall.Itreintensifiedon18DecemberafterenteringtheSouth31ChinaSea,beforeweakeninganddissipat-ingwithoutmakingfurtherlandfall.SeveredamageoccurredacrossthePhilippines,withatleast406deathsreported,whilefloodingalsooccurredinVietNam.Therewereseveralothersignificantlandfalls,mostnotablyfromTyphoonChanthuontheBatanesIslands(thePhilippines).ChanthuandTyphoonIn-fa,inJuly,alsobothcontributedtofloodinganddisruptionstoshippingaroundShanghai,whileDianmucontributedtofloodinginThailandinSeptemberaftermakinglandfallinVietNam.SEVERESTORMSThereweremultipleseverethunderstormoutbreaksinWesternandCentralEuropeinthesecondhalfofJuneandinJuly.AnF4tornado98struckseveralvillagesinsouthernMoraviaon24June,withmajordamageandsixdeathsreported.ThiswasthestrongesttornadoonrecordintheCzechRepublic.TornadoeswerealsoreportedduringthemonthinBelgium,FranceandPoland.Largehail(6–8cmindiameter)wasreportedinmultiplecountries,includingtheCzechRepublic,Slovakia,SwitzerlandandGermany.IntheCzechRepublicalone,losseswerearoundUS$700million.IntheUnitedStates,1376tornadoeswereprovisionallyreportedduring2021,abovethe1991–2010average.Asignificantoutbreakhitthesouth-easton25March,withthemostse-vereimpactsinAlabamaandwesternGeorgia.98OnboththeFujitascaleandtheEnhancedFujitascale,atornadothatcausesdevastatingdamageisclassifiedascategory4tornado(F4andEF4respectively).Thescalesdifferinthewindspeedsthoughttobeassociatedwith“devastatingdamage”,withlowerwindspeedsassumedintheenhancedsystemforthesamelevelofdamage.99https://www.worldweatherattribution.org/western-north-american-extreme-heat-virtually-impossible-without-human-caused-climate-change/100Philip,S.Y.;Kew,S.F.;vanOldenborgh,G.J.etal.RapidAttributionAnalysisoftheExtraordinaryHeatwaveonthePacificCoastoftheUSandCanadaJune2021.EarthSystemDynamicsDiscussions,Inreview,1–34.Preprint:https://doi.org/10.5194/esd-2021-90.101ChristidisN.,2021.UsingCMIP6Multi-modelEnsemblesforNearReal-timeAttributionofExtremeEvents;HadleyCentreTechnicalNotes107.UnitedKingdomMetOfficeHadleyCentre:Exeter,2021.https://digital.nmla.metoffice.gov.uk/IO_e2e76d02-d72e-49d6-8419-728fb313d075/;https://blog.metoffice.gov.uk/2021/06/29/heatwave-record-for-pacific-north-west/102https://www.worldweatherattribution.org/heavy-rainfall-which-led-to-severe-flooding-in-western-europe-made-more-likely-by-climate-change/103Gillett,N.;Cannon,A.;Malinina,E.etal.HumanInfluenceonthe2021BritishColumbiaFloods;SSRNScholarlyPaperID4025205;SocialScienceResearchNetwork:Rochester,2022.https://doi.org/10.2139/ssrn.4025205.SixdeathsandUS$1.8billionineconomiclosseswerereported.DuringDecember2021,therewere193confirmedtornadoreports,aroundeighttimesthe1991–2010Decemberaverageof24.Thiswasdoublethepreviousrecordof97from2002.On10Decembertherewasanhistoricoutbreakacrossseveralsouth-easternandcentralstatesinwhich93peoplediedandeconomiclossesofUS$3.9billionwerereported.ThiswasthedeadliestDecembertornadooutbreakintheUnitedStates,surpassingtheVicksburg,Mississippitornadoof5December1953,whichledto38deaths.HailstormsinTexasandOklahomaon27–28AprilresultedinUS$3.3billioninlosses.ATTRIBUTIONAttributionofindividualextremeeventscanoftentakeseveralmonthsbecauseoftheneedtocompletepeerreview.Butitisbecomingincreasinglypossibletocarryoutnear-real-timeattributionassessmentsthatusepeer-reviewedmethodstoreachconclusionswithinjustafewdaysofaweatherrecordbeingbroken.Such“rapidattribution”studieshavebeencarriedoutfortheheatwaveinWesternNorthAmericainJuneandJuly,99,100,101thefloodsinWesternEuropeinJuly102andtheBritishColumbiafloodsinNovember.103StudiesoftheWesternNorthAmericaheatwavefoundthatwhilesuchaheatwaveisrareintoday’sclimate,itwouldhavebeenvirtuallyimpossiblewithoutclimatechange.32FortheWesternEuropeflooding,therapidattributionstudyfoundthatthedetectionoftrendsinextremeprecipitationatthescaleoftheeventinquestionwaschallenging,andthatsaturatedsoilsandthelocalhydrologywerealsofactorsintheevent.However,significanttrendsinextremeprecipitationwerefoundacrossawiderareaofWesternEurope,andthestudyconcludedthatoverthisbroaderregion,human-inducedclimatechangehadincreasedthelikelihoodofanextremeprecipitationeventcomparabletothatwhichoccurred.104IntergovernmentalPanelonClimateChange(IPCC),2021:SummaryforPolicymakers.In:AR6ClimateChange2021:ThePhysicalScienceBasis,https://www.ipcc.ch/report/ar6/wg1/downloads/report/IPCC_AR6_WGI_SPM_final.pdf.Moregenerally,eventssuchasthesefitintoabroaderpatternofchange.TheIPCCassessed104thathotextremesintheregionsofWesternNorthAmericaandNorth-westernNorthAmericahaveincreased,andthatthereisatleastmediumconfidenceinahumancontributiontothisincrease.Similarly,theIPCCassessedthatheavyprecipitationhasincreasedintheregionofWesternandCentralEuropeaffectedbyflooding,butthatthereiscurrentlylowconfidenceintheattributionofthischangetohumaninfluence.339.2%720.4811.012.4%8.3%8.3%8.4%9.9%810.7606.9615.1650.3768.0010020030040050060070080090010005791113151719Millions%Prevalenceofundernourishment(percentage,leftaxis)Numberofundernourished(millions,rightaxis)10.4%2005200620072008200920102011201220132014201520162017201820192020YearFigure22.ThenumberofundernourishedpeopleintheworldsignificantlyincreasedduringtheCOVID-19pandemic,from650millionpeoplein2019to768millionpeoplein2020.Dottedlinesandemptycirclesillustrateprojectedvaluesinthefigure.Source:FoodandAgricultureOrganizationoftheUnitedNations(FAO).Theriskofclimate-relatedimpactsde-pendsoncomplexinteractionsbetweenclimate-relatedhazardsandthevulnerability,exposureandadaptivecapacityofhumanandnaturalsystems.Climate-relatedeventsposehumanitarianriskstosocietythroughimpactsonhealth,foodandwatersecurityaswellashumansecurity,humanmobility,livelihoods,economies,infrastructureandbiodiversity.Climateandextremeweathereventsalsoaffecttheuseanddistributionofnaturalresourcesacrossregionsandwithincountries,andhavelargenegativeimpactsontheenvironment.Thesenegativeenvironmentaleffectsincludeimpactsonthelandsuchasdroughts,wildfiresinforestandpeatlandareas,landdegradation,sandandduststorms,desertification,floodingandcoastalerosion.Atcurrentlevelsofglobalgreenhousegasemissions,theworldremainsoncoursetoexceedtheagreedtemperaturethresholdsofeither1.5°Cor2°Cabovepre-industriallevels,whichwouldincreasetherisksofpervasiveclimatechangeimpactsbeyondwhatisalreadybeingseen.105FoodandAgricultureOrganizationoftheUnitedNations(FAO),2021:TheStateofFoodSecurityandNutritionintheWorld2021:TransformingFoodSystemsforFoodSecurity,ImprovedNutritionandAffordableHealthyDietsforAll,https://docs.wfp.org/api/documents/WFP-0000130141/download/?_ga=2.47516911.931354890.1634299853-763856357.1633873374.FOODSECURITYGLOBALFOODSECURITYOUTLOOKIN2021Thecompoundedeffectsofconflict,extremeweathereventsandeconomicshocks,furtherexacerbatedbytheCOVID-19pandemic,haveledtoariseinhunger,underminingdecadesofprogresstowardsimprovingfoodsecurity(Figure22).Worseninghumanitariancrisesin2021havealsocausedthenumberofcountriesatriskoffaminetogrow.Ofthetotalnumberofundernourishedpeoplein2020,morethanhalfliveinAsia(418million)andathirdinAfrica(282million).Followingapeakinundernourishmentin2020(768millionpeople),projectionsindicatedadeclineinglobalhungertoaround710millionin2021(9%oftheworldpopulation).105However,asofOctober2021,thenumbersinmanycountrieswerealreadyhigherthanin2020.ThisstrikingincreasewasmostlyfeltamonggroupsalreadysufferingfromfoodcrisesRisksandimpacts34orworse(IPC/CHPhase3orabove106);thenumberofpeopleinthesegroupsrosefrom135millionin2020to161millionbySeptember2021,a19%increase.107Anotherconsequenceoftheseshockswasgrowthinthenumberofpeoplefacingstarvationandatotalcollapseoflivelihoods(IPC/CHPhase5);atotalof584000peoplewereinthisgroup,mostlyinEthiopia,SouthSudan,YemenandMadagascar.Thefirstquarterof2021alsosawthehighestglobalconsumerfoodpricesinthelastsixyears,concentratedinLatinAmericaandtheCaribbean.108InWestAfrica,pricesofcoarsegrainsincreased,drivingfoodpricestorecordandnear-recordhighsinseveralcountries.Thepriceincreaseswereexacerbatedbycivilinsecurityandtorrentialrains.InNorthAfrica,foodinflationratesremainedatmodestlevelsin2021,bufferedbysubsidiesonmanybasiccommoditiesthatpreventedpriceincreases.IMPACTSOFHYDRO-METEOROLOGICALHAZARDSONFOODPRODUCTIONThe2020/2021LaNiñaalteredrainfallsea-sons,disruptinglivelihoodsandagriculturalcampaignsacrosstheworld.Associatedextremeweather,waterandclimateeventsduringthe2021rainfallseasoncompound-edshocksfromthepreviousyearoryears,makingitincreasinglydifficulttoquanti-fyimpactsresultingfromasingleevent.ConsecutivedroughtsacrosslargepartsofAfrica,AsiaandLatinAmericaassociatedinplaceswiththedouble-dipLaNiña,aswell106TheIntegratedFoodSecurityPhaseClassification(IPC)isacommonglobalscaleforclassifyingtheseverityandmagnitudeoffoodinsecurityandmalnutrition.https://www.ipcinfo.org/ipcinfo-website/resources/ipc-manual/en/.TheCadreHarmonisé(CH)isaunifyingtoolforclassifyingthenatureandseverityofcurrentandprojectedacutefoodandnutritioninsecurity.107GlobalNetworkAgainstFoodCrises,2021:GlobalReportonFoodCrises:JointAnalysisforBetterDecisions.September2021Update,http://www.fightfoodcrises.net/fileadmin/user_upload/fightfoodcrises/doc/resources/FINAl_GRFC2021_Sept_Update.pdf.108FoodandAgricultureOrganizationoftheUnitedNations(FAO),2021:TheStateofFoodSecurityandNutritionintheWorld2021:TransformingFoodSystemsforFoodSecurity,ImprovedNutritionandAffordableHealthyDietsforAll,https://docs.wfp.org/api/documents/WFP-0000130141/download/?_ga=2.47516911.931354890.1634299853-763856357.1633873374.109FoodandAgricultureOrganizationoftheUnitedNations(FAO),2021:CropProspectsandFoodSituation:QuarterlyGlobalReport,https://www.fao.org/3/cb6901en/cb6901en.pdf.110FoodandAgricultureOrganizationoftheUnitedNations(FAO),2021:CropProspectsandFoodSituation:QuarterlyGlobalReport,https://www.fao.org/3/cb6901en/cb6901en.pdf.111FoodandAgricultureOrganizationoftheUnitedNations(FAO),2021:CropProspectsandFoodSituation:QuarterlyGlobalReport,https://www.fao.org/3/cb6901en/cb6901en.pdf.asregionalimpactsfromseverestorms,cyclonesandhurricanes,havesignificantlyaffectedlivelihoodsandtheabilitytorecoverfromrecurrentweathershocks.DryconditionsacrosswideareasofSouthAmericacouldfurtherthreatencropyieldswithinthisregion.However,largerplantingshavelargelycompensatedforcropproductiv-itylossesthroughoutthecontinent(−3.6%in2021comparedto2020).109IntheCaribbean,Haitihasbeentriplyhit–byearthquakes,irregularrainsandpoliticalinstability–contributingtoagriculturaldamageandsignificantlyworseningfoodinsecurity.InWestAfrica,floodsanddryspellshaveledtocropdamageandlossesinlocalizedareasresultinginsmallproductiondownturnsin2021,buttheforecastedaggregateoutputsforthewholecontinentofAfricaremainedaboveaverage(+2.9%in2021over2020).110The2021firstseasonharvestincentralandsouthernareasofEastAfricawasnegativelyaffectedbyprolongeddroughts,mostlyinKenyawheremaizeoutputswereofficiallyestimatedtobe42%–70%belowaverage.111InnorthernpartsofEastAfrica,thescaleofseasonalfloodinganditsimpactoncropswaslowerthanin2020.InSouthernAfrica,thesecondconsecutivebelow-averagerainfallseasoninMadagascarhasledtoaseverereductioninstaplefoodproduc-tionandadeclineinlivestockherdsize.Inaddition,weather-relatedhazards,pestsanddiseaseswereexpectedtoresultinsharpharvestdeclines,withyieldestimates3550%–70%belowthefive-yearaverage.112InMozambique,CycloneEloisemadelandfallinlateJanuaryduringtheregion’sleanseason,whenvulnerabilitiesareattheirhighest,affectingcommunitiesstillrecoveringfromCycloneIdaibarelytwoyearsago.AccordingtotheGovernmentofMozambique,morethan441000peoplewereaffectedbythecyclone,whichdisplacednearly44000anddestroyedmorethan45000hectaresofcropland.113DroughtconditionsinSouth-westAsiaandtheMiddleEastreducedcerealproductiontobelow-averagelevels,exacerbatingtheimpactsonagricultureandfoodsecurityinfragilecontexts,mostlyinAfghanistanandtheSyrianArabRepublic.Whilecerealpro-ductiondecreasedintheMiddleEast,wheatproductioninEasternAsiareachedarecordhighin2021,withpaddyriceoutputsathighlevelsduetosuitableweatherconditions.Incontrast,centralChinawashitbytorrentialrainsinmid-July2021,leadingtosignificantlossoflifeanddamagetoproperty.Thissparkedconcernsoverthenation’sfoodsupplies,as1millionhectaresofcropland–mostlycorn,soybeansandpeanuts–wereaffected,athirdofwhichwaswipedoutbyheavyrains.HUMANITARIANIMPACTSANDPOPULATIONDISPLACEMENTRefugees,internallydisplacedpeopleandstatelesspeopleareoftenamongthosemostvulnerabletoclimateandweather-relatedhazards.Manyvulnerableindividualswhoaredisplacedendupsettlinginhigh-riskareas,wheretheyareexposedtoclimateandweatherhazardsatarangeofscales.Hydrometeorologicalhazardsandhumanmobilitymayalsointersectwithsocialandpoliticaltensionsandconflictincomplexsettingsand,therefore,requiretheintegrated112FamineEarlyWarningSystemsNetwork(FEWSNET),2021:MadagascarFoodSecurityAlert,https://reliefweb.int/sites/reliefweb.int/files/resources/Madagascar%20Food%20Security%20Alert%20-%20June%2010%2C%202021.pdf.113https://www.fao.org/mozambique/news/detail-events/en/c/1393190/114https://www.unhcr.org/news/stories/2021/4/60806d124/data-reveals-impacts-climate-emergency-displacement.html115https://story.internal-displacement.org/2021-midyear-review/index.htmlconsiderationofmulti-hazarddisasterriskreductionmeasures,includingearlywarningsystemsandpreparedness,andlonger-termsustainabledevelopmentconcerns,suchaslanduseandurbanplanning.CLIMATE-RELATEDHAZARDSWEREAMAJORDRIVEROFNEWDISPLACEMENTExtremeweather,waterandclimateeventsandconditionshadmajoranddiverseim-pactsonpopulationdisplacementandonthevulnerabilityofpeoplealreadydisplacedthroughouttheyear.FromAfghanistantoCentralAmerica,droughts,floodingandotherextremeeventshitthoseleastequippedtorecoverandadapt.114Asinpreviousyears,manyofthelargest-scaledisplacementsin2021occurredinpopulousAsiancountries.Mostdisasterdisplacementsin2021resultedfromtropicalstormsandfloodsinEastAsiaandthePacific,SouthAsia,theAmericasandSub-SaharanAfrica.Overthecourseof2021,hazardoushydro-meteorologicaleventsandenvironmentaldegradationfurthercontributedtothedisplacementofmillionsmorepeopleinexposedandvulnerablesituations.Thisincludestheimpactofrapid-onseteventssuchasfloods,stormsandwildfires,aswellasslow-onsetprocessessuchasdroughtanddesertification.Thisaffectspeople’ssafetyandabilitytomeettheirbasicneedsforsurvivalsuchasfood,water,resilienthousingandproductiveland.OverthefirsthalfoftheyearinAfghanistan,forexample,disastersresultedinsome22500newdisplacements,primarilylinkedtofloods.115InJune,theGovernmentdeclaredanationaldrought,with80%ofthecountryclassifiedasbeingineithersevereorseriousdroughtstatus,ontopofescalatingconflict,foodinsecurity,andhealthandsocioeconomicimpactsofCOVID-19,withhumanitarian,developmentandgovernmentactorsforeseeingthat36agriculturalfamilieswouldverylikelybecomedisplaced.116Peopleforcedtoleavetheirhomeshadtoselltheirassetsandengageindangerousworktosurvive,whilesomechildrenweresenttoworkinotherareasorinneighbouringcountriesorweremarriedoffasawaytoreducefinancialburdens.117DisplacedpeopleintheSyrianArabRepublic,acountrydecimatedbyoveradecadeofconflict,alsofacedfloodingduetoheavyrainfall,withcloseto142000internallydisplacedpeopleaffectedinmid-January2021.118InIndia,morethan100000peopleweredisplacedbetweenNovemberandDecember2021.119Inlinewithestablishedtrends,2021sawtheoverwhelmingmajorityofnewdisplacementsrelatedtohazardousweathereventstakeplacewithinnationalborders.Mostoftheseinternaldisplacementsweretriggeredbytropicalcyclones,floods,earthquakesandvolcaniceruptions,especiallyintheEastAsiaandPacificregion.ThecountrieswiththelargestnumbersofdisplacementsrecordedasofOctober2021wereChina(morethan1.4milliondisplacementsrecordedinJuly),VietNam(morethan664000recordedinSeptember),andthePhilippines(morethan214000inJulyandmorethan386000inOctober).120InEastAfrica,floodsanddroughtsresultedinlarge-scaledisplacement,especiallyinSomaliaandEthiopia.Manyofthepeopleaffectedwerealreadylivinginovercrowdedandinsecurecampsforinternallydisplacedpeopletowhichmanynewlyflood-displacedpeoplealsomoved.Farmerswhosecropsweredevastatedbydesertlocustswerealsoforcedtomoveinsearchofsurvivalassistance.121InSudan,Alganaarefugeecamp116https://prod.drc.ngo/about-us/for-the-media/press-releases/2021/7/drought-crisis-in-afghanistan-intensifies-risk-of-displacement117https://prod.drc.ngo/about-us/for-the-media/press-releases/2021/7/drought-crisis-in-afghanistan-intensifies-risk-of-displacement118https://reliefweb.int/disaster/fl-2021-000007-syr119https://www.internal-displacement.org/global-displacement-map120https://www.internal-displacement.org/global-displacement-map121https://www.unhcr.org/news/stories/2021/8/611a2bca4/displaced-somalis-refugees-struggle-recover-climate-change-brings-new-threats.html122https://www.unhcr.org/news/stories/2021/11/619c9aea4/refugees-count-losses-floods-destroy-camp-sudan.html123https://story.internal-displacement.org/2021-midyear-review/index.html124https://www.internal-displacement.org/sites/default/files/publications/documents/grid2021_idmc.pdf125https://www.internal-displacement.org/global-displacement-mapwassubmergedbyfloodwatersinNovember2021,leaving35000SouthSudaneserefugeesinneedofurgentassistance.122High-incomecountrieswerealsoaffected.InthewesternpartsoftheUnitedStatesandCanadaexceptionalheatwaves,droughtandwildfiresdisplacedthousandsfromtheirhomes.Wildfiresalsocompoundedrisksrelat-edtootherhazards,furtherincreasingtheriskofdisplacement.Forinstance,15000peopleweredisplacedinCaliforniainJanuary2021,followingmandatorypre-emptiveevacuationordersfollowingheavyrains.123PROTRACTED,PROLONGEDANDREPEATEDDISPLACEMENTFUELLEDBYHYDROMETEOROLOGICALHAZARDSManydisplacementsituationstriggeredbyhydrometeorologicaleventshavebecomeprolongedorprotractedforpeopleunabletoreturntotheirformerhomesorwithoutoptionsforintegratinglocallyorsettlingelsewhere.Atthebeginningof2021,atleast7millionpeoplewerelivingininternaldisplacementfollowingdisasters124relatedtonaturalhazardeventsinpreviousyears,accordingtotheInternalDisplacementMonitoringCentre(IDMC).ThelargestnumbersofpeopleinthissituationwereinAfghanistan,IndiaandPakistan,followedbyEthiopia,Sudan,Bangladesh,NigerandYemen.125Duetocontinuingorgrowingriskintheirareasoforigin(andreturn)orsettlement,peoplewhohavebeendisplacedbyhydro-meteorologicaleventsmayalsobesubjecttorepeatedandfrequentdisplacement,leaving37littletimeforrecoverybetweenoneshockandthenext.InIndonesia,forexample,557000newdisasterdisplacementswererecordedinthefirsthalfoftheyear,mostlytriggeredbymajorrainyseasonfloods.Humanactivities,includingdeforestation,ur-banizationandlanddegradationhavereducedthecapacityofsomeregionsofIndonesiatoabsorbheavyrainfall.BetweenOctoberandNovember2021,wellbeforethepeakoftherainyseason,heavyrainfallandfloodingfurtherdisplacedmorethan50000,doublethefigurefor2020.126Suchsituationshighlighttheimportanceofdisasterpreparednessandriskmanagement,butalsotheimportanceofsupportingsolutionstodisplacementthataresustainableandsupportingtheresilienceofpeoplewhomightotherwiseseetheirlivingconditionsprogressivelyerodedthroughrepeateddisastersanddisplacement.HAZARDOUSEVENTSANDCHANGINGCLIMATICCONDITIONSALSOADDEDTOTHEMULTIPLERISKSFACEDINCONFLICT-AFFECTEDCOUNTRIESBYINTERNALLYDISPLACEDPEOPLEANDREFUGEESInYemen,people’svulnerabilitieswerefurtherexacerbatedbyhazardevents,suchasfloodsanddroughts,thathaveledtothedestructionofsheltersandinfrastructure,restrictedaccesstomarketsandbasicser-vices,wreckedlivelihoods,facilitatedthespreadofdeadlydiseasesandcontributedtofatalities.Inmid-April,heavyrainandfloodinghitseveralpartsofthecountry,affecting7000people,75%ofwhomwerein-ternallydisplacedpeoplelivinginprecariousconditions.127Thiscontributedtopopulationdisplacementinwhatwasalreadytheworld’s126https://story.internal-displacement.org/10-internal-displacement-situations-to-watch-in-2022/index.html127https://reliefweb.int/sites/reliefweb.int/files/resources/Humanitarian%20Update_May%202021%20v4.pdf128https://reliefweb.int/report/yemen/climate-crisis-exacerbates-humanitarian-situation-yemen-enar129https://www.unhcr.org/news/briefing/2021/4/606c17bf4/unhcr-scales-response-thousands-flee-attacks-northern-mozambique.html130https://displacement.iom.int/reports/mozambique-%E2%80%93-flash-report-16-tropical-cyclone-eloise-january-2021?close=true131https://reliefweb.int/report/afghanistan/internal-displacement-mid-year-10-situations-review132https://www.unhcr.org/news/stories/2020/3/5e6a6e50b/year-people-displaced-cyclone-idai-struggle-rebuild.html133https://www.unhcr.org/news/stories/2020/3/5e6a6e50b/year-people-displaced-cyclone-idai-struggle-rebuild.html134https://www.unhcr.org/news/stories/2020/3/5e6a6e50b/year-people-displaced-cyclone-idai-struggle-rebuild.htmlfourthbiggestinternaldisplacementcrisis,withover4millioninternallydisplacedpeo-ple.Theannualrainyseasonbringsheavyrainfall,highwindsandflooding,particularlytocoastalareas,withthousandsoffamiliesaffectedbyflashfloodsin2021.Floodingalsoblocksroads,impedingthedeliveryoflife-savingassistance.128InMozambique,multipletropicalstormsandfloods,ontopofrecurrentdiseaseoutbreaksandconflict,significantlyincreasedthevul-nerabilityofaffectedpeople,129includingthousandsoffamiliesstilldisplacedsinceCyclonesIdaiandKennethin2019.InJanuary,strongwindsandfloodsfromTropicalStormChalaneandthenCycloneEloisedamagedordestroyedthesheltersofover8700oftheseinternallydisplacedfamiliesaswellasschoolsandhospitals.130Theseeventsalsoresultedinnewdisplacement,withCycloneEloisedisplacingmorethan43300people.131Tensofthousandsofpeopleremaindisplacedandheldbackfromrecovery.132Theimpactsofcompoundingdisasters,recurrentdiseaseoutbreaksandconflictshavesignificantlyincreasedthevulnerabilityofpeopleintheregion.Thissituation,andsimilaronesinotherregions,couldbeamelioratedthroughgreaterefforttoreduceclimate-relatedvulner-abilityandrisksinfragileandconflict-affectedcontextsandtostrengthencommunity-basedpreparedness.133Nigeriaalsoexperienceddroughtandfloods,whichaffectedagriculturalactivities,resultinginlossofshelterandincreasedvulnerabilityofpeoplealreadydisplacedbyconflictinthenorth-east.Thesituationfurtherdeteri-oratedinthefirsthalfof2021,witharound294000newdisplacementsreportedbetweenJanuaryandJune2021.13438InBangladesh,monsoonrainsledtomassivefloodingandthedisplacementofmillionsofpeoplefollowingCycloneYaasinMayandJune2021.FloodinginJuly2021intheRohingyarefugeesitesinCox’sBazardamagedover6000sheltersandmorethan25000refugeeswereforcedtoseekshelterincommunalfacilitiesorwithotherfamilies.135FloodsalsoheavilyaffectedpeoplelivinginChina,NepalandthePhilippines,wherethou-sandsofpeopleweredisplacedbyTyphoonIn-fainJuly2021.Withoutpreparednessmeasuresundertakeninthecampareas,includingthestrengtheningofshelters,thebuildingofretainingstructuresonhillsidesandimproveddrainage,roadsandbridges,theseimpactswouldhavebeenfarworse.CLIMATEIMPACTSONECOSYSTEMSEcosystems–includingterrestrial,freshwa-ter,coastalandmarineecosystems–andtheservicestheyprovide,areaffectedbythechangingclimate,andsomearemorevulnerablethanothers.136Inaddition,someecosystemsaredegradingatanunprece-dentedrate,limitingtheirabilitytosupporthumanwell-beingandharmingtheiradaptivecapacitytobuildresilience.137Forexample,mountainecosystems–thewatertowersoftheworld–arevulnerableandcanbeprofoundlyaffectedbyclimatechangeduetotheirlowcapacitytoadapt.Thismay135https://www.unhcr.org/news/stories/2021/7/6103c43c4/floods-bring-new-misery-rohingya-refugees-bangladesh-camps.html136UnitedNationsEnvironmentProgramme(UNEP),2021:AdaptationGapReport2020,https://www.unep.org/resources/adaptation-gap-report-2020.137UnitedNationsEnvironmentProgramme(UNEP),2021:MakingPeacewithNature:AScientificBlueprinttoTackletheClimate,BiodiversityandPollutionEmergencies,https://www.unep.org/resources/making-peace-nature.138Immerzeel,W.W.;Lutz,A.F.;Andrade,M.etal.ImportanceandVulnerabilityoftheWorld’sWaterTowers.Nature2020,577(7790),364–369.https://doi.org/10.1038/s41586-019-1822-y.139UnitedNationsEnvironmentProgramme(UNEP),2021:MakingPeacewithNature:AScientificBlueprinttoTackletheClimate,BiodiversityandPollutionEmergencies,https://www.unep.org/resources/making-peace-nature.140Hemming,D.L.;Garforth,J.;Park,T.etal.PhenologyofPrimaryProducers.InStateoftheClimatein2020,supplement.BulletinoftheAmericanMeteorologicalSociety2021,102(8),S57–S60.https://doi.org/10.1175/BAMS-D-21-0098.1.141Scheffers,B.R.;DeMeester,L.;Bridge,T.C.etal.TheBroadFootprintofClimateChangefromGenestoBiomestoPeople.Science2016,354(6313),aaf7671.https://doi.org/10.1126/science.aaf7671.142Thackeray,S.J.;Henrys,P.A.;Hemming,D.etal.PhenologicalSensitivitytoClimateacrossTaxaandTrophicLevels.Nature2016,535(7611),241–245.https://doi.org/10.1038/nature18608.143UnitedNationsEnvironmentProgramme(UNEP),2021:MakingPeacewithNature:AScientificBlueprinttoTackletheClimate,BiodiversityandPollutionEmergencies,https://www.unep.org/resources/making-peace-nature.affectthe1.9billionpeoplelivinginmountainareasordirectlydownstreamfromthem.138Climatechangemayexacerbatewaterstress,especiallyinareasofdecreasedprecipitationandwheregroundwaterisalreadydepleted,affectingagriculturalproduction,arableland,andthemorethan2billionpeoplewhoal-readyexperiencewaterstress.139Climatechangeisalsoaffectingclimate­sensitivespecies.Thereisevidencethattemperature-sensitiveplantsarefloweringandstartingtoproduceleavesearlierinspringanddroppingtheirleaveslaterinautumn.140Also,therehasbeenaclearshiftinthetimingofmarineandfreshwaterfishspawningeventsandanimalmigrationsworldwide.Substantialchangesinspecies’abundanceanddistributionmayinturnaf-fecttheinteractionsbetweenspecies.141,142Riskstoecosystemsandindividualspeciesfrompests,pathogensanddiseasesarechanging.Climatechangealsoexacerbatesotherthreatstobiodiversity.Thenumberofspeciesprojectedtobecomeextinctincreasesdramaticallyasglobaltemperaturerises–andis30%higherat2°Cwarmingthanat1.5°Cwarming.143Meanwhile,large-scalechangeshavebeenobservedinmarineecosystems,includingdecliningoceanproductivity,migrationofspeciestohigherlatitudesandaltitudes,anddamagetocoralreefsandmangroves.Warmingtowards1.5°Cwillincreasewa-tertemperaturesandchangetheocean’s39chemistry(forexample,acidification),result-inginnewecosystems.Speciesthatarelessabletorelocateareprojectedtoexperiencehighratesofmortalityanddecline.144ClimatechangeisalsoaffectingtheGreenlandandAntarcticicesheetsandincreasingthechanc-esoftheArcticOceanbeingice-freeinthesummer,furtherdisruptingoceancirculationandArcticecosystems.145Risingtemperaturesheightentheriskofirreversiblelossofmarineandcoastal144IntergovernmentalPanelonClimateChange(IPCC),2019:Summaryforpolicymakers.In:GlobalWarmingof1.5°C:AnIPCCSpecialReportontheImpactsofGlobalWarmingof1.5°CabovePre-industrialLevelsandRelatedGlobalGreenhouseGasEmissionPathways,intheContextofStrengtheningtheGlobalResponsetotheThreatofClimateChange,SustainableDevelopment,andEffortstoEradicatePoverty,https://www.ipcc.ch/sr15/chapter/spm/.145UnitedNationsEnvironmentProgramme(UNEP),2021:MakingPeacewithNature:AScientificBlueprinttoTackletheClimate,BiodiversityandPollutionEmergencies,https://www.unep.org/resources/making-peace-nature.146UnitedNationsEnvironmentProgramme(UNEP),2021:MakingPeacewithNature:AScientificBlueprinttoTackletheClimate,BiodiversityandPollutionEmergencies,https://www.unep.org/resources/making-peace-nature.ecosystems,includingseagrassmeadowsandkelpforest.Coralreefsareespeciallyvulnerabletoclimatechange.Theyareprojectedtolosebetween70%and90%oftheirformercoverageareaat1.5°Cofwarmingandover99%at2°C.Between20%and90%ofcurrentcoastalwetlandsareatriskofbeinglostbytheendofthiscentury,dependingonhowfastsealevelsrise.Thiswillfurthercompromisefoodprovision,tourismandcoastalprotec-tion,amongotherecosystemservices.14640JoséÁlvaroSilva(WMO)2021NORTHERNHEMISPHEREEXTREMES:BRIEFDESCRIPTIONIn2021,duringtheborealsummer,severalextremeweatherandclimateeventsoc-curredinthemid-latituderegionsofthenorthernhemisphere(NH).Recordhotdaysandheatwaves,severedroughts,powerfulanddestructivewildfires,andheavyraineventsledtovastdamageandhighdeathtolls,asisdescribedindepthinthesectiononHigh-impacteventsin2021.Hotsummerconditionsstartedearly,andseveralNHregionsexperiencedextremeheatinJune,includingNorthAfrica,EasternEuropeandtheMiddleEast.Thehightem-peratureswereparticularlyexceptionalinthenorth-westernUnitedStatesandwesternCanadainlateJune(Figure23).Lytton,inBritishColumbia,recorded49.6°Con29June,whichwasanewrecordforCanada.On9July,duringoneofthemultipleheatwavesthataffectedthesouth-westernUnitedStatesduringthesummer,theFurnaceCreekweath-erstation(DeathValley,California),reached54.4°Cforthesecondyearinarow(theworld’shighestrecordedtemperatureinatleastthelast90years).On14and15July,exceptionalseverefloodsoccurredinsomecountriesintheWesternpartofEurope.PartsofwesternGermanyandeasternBelgiumwerethemostaffectedbythelong-lastingheavyprecipitation.Justafewdayslater,intheChineseprovinceofHenan,morerainfellonZhengzhoubetween17and21Julythanfallsthereinanaverageyear,andaone-hourrainfalltotalof201.9mm,on20July,wasanewrecordforChina.InAugust,theextremeheatwasassociatedwithpowerfulanddestructivewildfiresthataffectedsomeMediterraneancountries.On11August,astationnearSyracuse,inSicily,Italy,reached48.8°C,aprovisionalEuropeanrecord.POTENTIALCAUSESANDMECHANISMSOFNORTHERNHEMISPHERESUMMEREXTREMESFollowingthetrendthathasemergedinrecentdecades,NHsummer2021sawnu-merousweatherandclimateextremes.ButwhatmightbethecausesfortheincreaseinnumberandtheintensificationoftheNHsummerextremes?Thefrequencyofcertaintypesofweatherandclimateextremesisincreasingduetoclimatechange,1andsomeattributionstud-ies2,3,4,5,6,7,8haveshownthatithasmademanysinglerecenteventsmoreintense.Someofthesestudiessuggestthatawidediversityofspatio-temporalscalesandatmosphericprocessesareinvolvedintheevolutionofextremeevents,butitisusuallytheanom-alouslarge-scalecirculationpatternsthatsetthebackgroundfortheiroccurrence,andquasi-resonantcirculationregimesplayanimportantrolehere.Northernhemispheresummerextremes:theroleofthequasi-stationaryplanetarywavesandtheArcticwarmingamplificationFigure23.ERA5reanalysisofmaximumairtemperature(°C)on29June2021.Source:CopernicusClimateChangeServiceandKNMIClimateExplorer.Latitude60°N30°N0°30°S60°S180˚120˚W60˚W0˚60˚E120˚E180˚Longitude–50–40–30–20–101020304050°C4041THEQUASI-RESONANTAMPLIFICATIONThereisgrowingevidencethatphysicalmechanismsinvolvingatmosphericdynam-ics,inparticularplanetarywavedynamics,canexplainthecharacteristicsassociatedwithpersistentdisturbancesinthepolarjetstreamandNHsummerextremes.9,10,11TheRossbywaves12(Figure24),particularlythequasi-resonantamplification(QRA)13ofthesemid-latitudehigh-amplitudewaves(zonalwavenumber6–8),isanimportantmechanismdrivingtheconditionsassociatedwithextremes.14,15,16Thejetstreamplaysamajorroleinshapingweatherpatterns,andwhenitbecomesweakerandwavier,inassociationwiththeseslow-movingwaves,theairmotionfromwesttoeastisslowed,leadingtoblockingsituationsinwhichweathersystemsremainnear-stationaryoveraprolongedperiodwhichcanlastseveralweeks.17,18ARCTICWARMINGAMPLIFICATIONOverthepast50years,temperaturesintheArctichaveincreasedatmorethantwicetheglobalrate,19aprominentfeatureofclimatechangeknownasArcticamplification(AA).20TheAAinfluencesmid-latitudesummercirculationbyweakeningthestormtracks,shiftingthepositionofthejetstreamandamplifyingthequasi-stationarywaves.Whilesomeuncertaintiesrelatedtohowthesedynamicalchangesaffectregionalweatherconditionsremain,21itisgenerallyacceptedthatinrecentdecadestheoccurrenceofcon-ditionsfavourableforQRA22,23promotedtheoccurrenceofpersistentextremeweathereventsthatmightbelinkedtotheamplifiedArcticwarming,andthusthatclimatechangeinfluenceiscarriedthroughamplifiedarcticwarming.24Nevertheless,itisarguedthattheobservationsandclimate-modelsimulationsdonotsupportaclearcause–effectrelation,makingitdifficulttoestablishadefinitelink.ThecausesofAAarenotyetfullyunder-stood,butashighlightedinChapter4oftheWorkingGroupIcontributiontotheIPCCSixthAssessmentReport,theunderstandingofthephysicalmechanismsdrivingAAhasimprovedinthelastdecade,andtheresultsofseveralstudiesmentionedinthereportidentifyavarietyofprocessesandpositivefeedbackscontribut-ingtothesephenomena.25Thefirstisrelatedtosea-iceloss(Figure25),whichcausesachangeofsurfacealbedo(reflectiveiceisreplacedbythedarkerocean),leadingtomoreheatabsorptionfromsolarradiation.Thisisknownasthesea-icealbedofeedback.OtherimportantatmosphericprocessesinducingAAarethetemperature(bothPlanckandlapserate)andthecloudandwatervapourfeedbacks.26Increasesintheatmosphericandoceanicequator-to-poletransportofheatandmoisturehavealsobeenidentifiedasdriversofAA.Insummary,researchfocusingonsummercirculationandclimatechangeneedstobefurtherdevelopedtofillimportantknowledgegaps,butthereisevidencetosupporttheideathatchangesinmid-latitudesummercircula-tion–amplifiedandmorestationaryplanetarywaves,aweakerandwavierjetstream–asso-ciatedwithArcticwarming,maybelinkedtoincreasedblockingsituationsthusfavouringtheoccurrenceofextremeeventsintheNH.Figure24.Left:Schematicexampleofafiveplanetary-wavepattern.Source:NOAA/NWS.Right:Sealevelpressureanomalyfor29June2021(differencefrom1981–2010),associatedwithaslowandmeanderingjetstream.DatafromtheERA5reanalysisproduct.Source:CopernicusClimateChangeService.2021-06-29−30−20−100102030Anomalyrelativeto1981–2010(hPa)wavelengthxNorthPoleLLLLL54321Sea-iceconcentrationtrendsduring1979–2020MarchSeptember%perdecade1981–2010medianiceedge180º135ºE0º90ºE45ºE90ºW45ºW135ºW180º135ºE0º90ºE45ºE90ºW45ºW135ºWCredit:C3S/ECMWF.3024181260–6–12–18–24–30Figure25.Sea-iceconcentrationtrendsinMarchandSeptember,1979–2020.Source:C3S,https://climate.copernicus.eu/climate-indicators/sea-ice.4142REFERENCES1.IntergovernmentalPanelonClimateChange(IPCC),2021:AR6ClimateChange2021:ThePhysicalScienceBasis,https://www.ipcc.ch/report/ar6/wg1/.2.Philip,S.Y.;Kew,S.F.;vanOldenborgh,G.J.etal.RapidAttributionAnalysisoftheExtraordinaryHeatwaveonthePacificCoastoftheUSandCanadaJune2021.EarthSystemDynamicsDiscussions,Inreview,1–34.Preprint:https://doi.org/10.5194/esd-2021-90.3.Kreienkamp,F.;Philip,S.Y.;Tradowsky,J.S.etal.RapidAttributionofHeavyRainfallEventsLeadingtotheSevereFloodinginWesternEuropeDuringJuly2021.WorldWeatherAttribution,2021.https://www.worldweatherattribution.org/wp-content/uploads/Scientific-report-Western-Europe-floods-2021-attribution.pdf.4.vanOldenborgh,G.J.;vanderWiel,K.;Kew,S.etal.PathwaysandPitfallsinExtremeEventAttribution.ClimaticChange2021,166(1),13.https://doi.org/10.1007/s10584-021-03071-7.5.Herring,S.C.;Christidis,N.;Hoell,A.etal.,Eds.;ExplainingExtremeEventsof2017fromaClimatePerspective.BulletinoftheAmericanMeteorologicalSociety2019,100(1),S1–S117.https://doi.org/10.1175/BAMS-ExplainingExtremeEvents2017.1.6.Lu,C.;Lott,F.;SunY.etal.DetectableAnthropogenicInfluenceonChangesinSummerPrecipitationinChina.JournalofClimate2020,33(13),5357–5369.https://doi.org/10.1175/JCLI-D-19-0285.1.7.Kahraman,A.;Kendon,E.J.;Chan,S.C.etal.Quasi-stationaryIntenseRainstormsSpreadacrossEuropeunderClimateChange.GeophysicalResearchLetters2021,48(13),e2020GL092361.https://doi.org/10.1029/2020GL092361.8.Sun,Y.;Dong,S.;ZhangX.etal.AnthropogenicInfluenceontheHeaviestJunePrecipitationinSoutheasternChinasince1961.In:ExplainingExtremesof2017fromaClimatePerspective,supplement.BulletinoftheAmericanMeteorologicalSociety2019,100(1),S79–S84.https://doi.org/10.1175/BAMS-ExplainingExtremeEvents2017.1.9.Mann,M.E.;Rahmstorf,S.;Kornhuber,K.etal.ProjectedChangesinPersistentExtremeSummerWeatherEvents:TheRoleofQuasi-resonantAmplification.Sci.Advance2018,4(10),eaat3272.https://doi.org/10.1126/sciadv.aat3272.10.Coumou,D.;Petoukhov,V.;Rahmstorf,S.etal.Quasi-resonantCirculationRegimesandHemisphericSynchronizationofExtremeWeatherinBorealSummer.ProceedingsoftheNationalAcademyofSciences2014,111(34),12331–12336.https://doi.org/10.1073/pnas.1412797111.11.Petoukhov,V.;Petri,S.;Rahmstorf,S.etal.RoleofQuasiresonantPlanetaryWaveDynamicsinRecentBorealSpring-to-autumnExtremeEvents.ProceedingsoftheNationalAcademyofSciences2016,113(25),6862–6867.https://doi.org/10.1073/pnas.1606300113.12.ARossbywaveisalargehorizontalatmosphericundulationassociatedwiththepolarjetstreamandseparatescoldpolarairfromwarmtropicalair.Theseplanetarywavesplayanimportantroleinthepolewardtransportsofenergyandmoisture.13.TheamplifiedRossbywavesassociatedwithameanderingjetstreambecomeslowandcausewaveresonanceknownasquasi-resonantamplification(QRA).14.Petoukhov,V.;Rahmstorf,S.;Petri,S.etal.QuasiresonantAmplificationofPlanetaryWavesandRecentNorthernHemisphereWeatherExtremes.ProceedingsoftheNationalAcademyofSciences2013,110(14),5336–5341.https://doi.org/10.1073/pnas.1222000110.15.Kornhuber,K.;Petoukhov,V.;Petri,S.etal.EvidenceforWaveResonanceasaKeyMechanismforGeneratingHigh-amplitudeQuasi-stationaryWavesinBorealSummer.ClimateDynamics2016,49(5),1961–1979.https://doi.org/10.1007/s00382-016-3399-6.16.Kornhuber,K.;Coumou,D.;Vogel,E.etal.AmplifiedRossbyWavesEnhanceRiskofConcurrentHeatwavesinMajorBreadbasketRegions.NatureClimateChange2020,10(1),48–53.https://doi.org/10.1038/s41558-019-0637-z.17.Teng,H.;Branstator,G.;Wang,H.etal.ProbabilityofUSHeatWavesAffectedbyaSubseasonalPlanetaryWavePattern.NatureGeoscience2013,6(12),1056–1061.https://doi.org/10.1038/ngeo1988.18.Grams,C.M.;Binder,H.;Pfahl,S.etal.AtmosphericProcessesTriggeringtheCentralEuropeanFloodsinJune2013,NaturalHazardsandEarthSystemSciences2014,14(7),1691–1702.https://doi.org/10.5194/nhess-14-1691-2014.424319.IntergovernmentalPanelonClimateChange(IPCC),2021:AR6ClimateChange2021:ThePhysicalScienceBasis,https://www.ipcc.ch/report/ar6/wg1/.20.Francis,J.A.;Vavrus,S.J.EvidenceLinkingArcticAmplificationtoExtremeWeatherinMid-latitudes.GeophysicalResearchLetters2012,39(6),L06801.https://doi.org/10.1029/2012GL051000.21.Coumou,D.;DiCapua,G.;Vavrus,S.etal.TheInfluenceofArcticAmplificationonMid-latitudeSummerCirculation.NatureCommunications2018,9(1),2959.https://doi.org/10.1038/s41467-018-05256-8.22.Petoukhov,V.;Rahmstorf,S.;Petri,S.etal.QuasiresonantAmplificationofPlanetaryWavesandRecentNorthernHemisphereWeatherExtremes.ProceedingsoftheNationalAcademyofSciences2013,110(14),5336–5341.https://doi.org/10.1073/pnas.1222000110.23.Kornhuber,K.;Petoukhov,V.;Petri,S.etal.EvidenceforWaveResonanceasaKeyMechanismforGeneratingHigh-amplitudeQuasi-stationaryWavesinBorealSummer.ClimateDynamics2016,49(5),1961–1979.https://doi.org/10.1007/s00382-016-3399-6.24.Mann,M.;Rahmstorf,S.;Kornhuber,K.etal.InfluenceofAnthropogenicClimateChangeonPlanetaryWaveResonanceandExtremeWeatherEvents.ScientificReports2017,7(1),45242.https://doi.org/10.1038/srep45242.25.IntergovernmentalPanelonClimateChange(IPCC),2021:AR6ClimateChange2021:ThePhysicalScienceBasis,https://www.ipcc.ch/report/ar6/wg1/.26.Previdi,M.;Smith,K.L.;Polvani,L.M.ArcticAmplificationofClimateChange:AReviewofUnderlyingMechanisms.EnvironmentalResearchLetters2021,16(9),093003.https://doi.org/10.1088/1748-9326/ac1c29.4344Figure26.EssentialClimateVariables(ECVs)identifiedbyGCOSClimatemonitoringisperformedbyasystemofobservingsystemscoveringtheatmos-phere,theocean,hydrology,thecryosphereandthebiosphere.Eachoftheseareasismonitoredindifferentwaysbyarangeoforganizations.Cuttingacrossalltheseareas,satelliteobservationsprovidemajorcontri-butionstoglobalclimatemonitoring.In1992,theGlobalClimateObservingSystem(GCOS)wasestablishedbyWMO,theIntergovernmentalOceanographicCommission(IOC)oftheUnitedNationsEducational,ScientificandCulturalOrganization(UNESCO),theUnitedNationsEnvironmentProgramme(UNEP)andtheInternationalScienceCouncil(ISC)tocoor-dinateandfacilitatethedevelopmentandimprovementofglobalclimateobservations.GCOShasidentifiedasetofEssentialClimateVariables(ECVs)thattogetherprovidetheinformationnecessarytounderstand,modelandpredictthetrajectoryoftheclimateaswellasplanmitigationandadaptationstrategies(Figure26).ThestatusoftheobservationalbasisfortheseECVsispublishedinregularstatusreports.GCOSalsoidentifieswhatisneededtoimprovethesysteminimplemen-tationreports.InadditiontoobservationsprovidedbytheGCOS-coordinatedGlobalSurfaceNetwork(GSN)andGlobalUpper-AirNetwork(GUAN),NationalMeteorologicalandHydrologicalServices(NMHSs)ofWMOMemberspro-videamorecomprehensiveandwidespreadnetworkofobservation,acquiredprimarilyforoperationalweatherprediction.WMO’sGlobalBasicObservingNetwork(GBON),agloballydesignednetworkwithprescribedcapabilitiesandobservingschedulesandforwhichinternationaldataexchangeismandatory,willprovidecriticallyneededobservationsfornumericalweatherpredic-tionandwillhelpsubstantiallystrengthenclimatemonitoring.InordertoprovidethenecessaryfinancialandtechnicalassistancefortheimplementationandoperationofGBONinthepoorestandmostpoorlyobservedareasoftheglobe,WMOandthemembersoftheAllianceforAtmosphericSurfacePrecipitation,surfacepressure,surfaceradiationbudget,surfacewindspeedanddirection,surfacetemperature,surfacewatervapourUpperairEarthradiationbudget,lightning,upper-airtemperature,upperairwatervapor,upper-airwindspeedanddirectionCompositionAerosolproperties,carbondioxide,methaneandothergreenhousegases,cloudproperties,ozone,aerosolandozoneprecursorsPhysicalOceansurfaceheatflux,seaice,sealevel,seastate,sea-surfacesalinity,sea-surfacetemperaturesubsurfacecurrents,subsurfacesalinity,subsurfacetemperatureBiogeochemicalInorganiccarbon,nitrousoxide,nutrients,oceancolour,oxygen,transienttracersMarinehabitatproperties,planktonBiological/ecosystemsHydrologyGroundwater,lakes,riverdischarge,soilmoistureCryosphereGlaciers,icesheetsandiceshelves,permafrost,snowBiosphereAbove-groundbiomass,albedo,fire,fractionofabsorbedphotosyntheticallyactiveradiation,landcover,landsurfacetemperature,latentandsensibleheatfluxes,leafareaindex,soilcarbonHumanuseofnaturalresourcesAnthropogenicgreenhousegasfluxes,anthropogenicwateruse2016EssentialClimateVariables(ECVs)OceanicTerrestrial44Observationalbasisforclimatemonitoring45HydrometDevelopmentaareestablishingaSystematicObservationsFinancingFacility(SOFF).Complementingtheobservationsofthephysi-calanddynamicpropertiesoftheatmosphere,WMO’sGlobalAtmosphericWatch(GAW)coordinatesatmosphericcompositionmeas-urements,ensuringthatreliableandaccuratedataareobtainedfrommeasurementsmadebyWMOMembers,researchinstitutionsand/oragenciesandothercontributingnetworks.Oceanobservationsofoceanphysics,biogeo-chemistry,biologyandecosystemsarecoor-dinatedthroughtheGlobalOceanObservingSystem(GOOS).TheGOOSObservationsCoordinationGroup(OCG)monitorstheper-formanceoftheseobservationsbandproducesanannualOceanObservingSystemReportCard.Oceanobservationsaregenerallymadewidelyavailabletointernationalusers.Intheterrestrialdomain,thereisawidergroupofobservingnetworks.Hydrologicalobser-vationsaregenerallyoperatedbyNMHSsandcoordinatedthroughWMO.AnumberofspecializedGlobalTerrestrialNetworks(GTNs),forexample,onhydrology,perma-frost,glaciers,landuse,andbiomass,alsoreporttoGCOS.Dataexchangeagreementsaregenerallylessdevelopedfortheterrestrialnetworks,andmanyimportantobservationsarenotmadeavailabletointernationalusers.TheCommitteeonEarthObservationSatellites/CoordinationGroupforMeteorolo­gicalSatellites(CEOS/CGMS)JointWorkingGrouponClimate(WGClimate)basesthedevelopmentofsatelliteobservationsforclimateontheECVrequirementsestablishedbyGCOS.IthasproducedanECVInventorythatincludesrecordsfor766climatedatarecordsfor33ECVscovering72separateECVproducts,withmoreplanned.Satelliteobservationshavesomeadvantages–theyhavenear-globalcoverage–butopticalobservationscanbeinterruptedbyclouds.Usedwithground-basedobservations,eitherascomplementarydatasets,orforvalidationandcalibration,theyformaninvaluablepartoftheglobalobservingsystem.Figure27.DuststormintheSaharaDeserton18February2021.Thiseventledtowidespreadpoorairqualityforseveraldaysandfollowedanotherone,earlierinthemonth,thatcoatedthesnowinthePyreneesandAlpsandturnedskiesorangeinsomepartsofEurope,includingFrance,GermanyandSwitzerland.ahttps://public.wmo.int/en/our-mandate/how-we-do-it/partnerships/wmo-office-of-development-partnershipsbhttps://www.ocean-ops.org/4546Cansub-seasonal-to-seasonalpredictionsimprovedisasterriskpreparednessfortheSouth-eastAsiaregion?Areviewofthe20–26September2021casestudyEstelleDeConing1,TheaTurkington2,FredericVitart3,AndrewRobertson4,RyanKang2,WeeLengTan21WMO2NationalEnvironmentAgency,Singapore3S2SCo-chair,EuropeanCentreforMediumRangeWeatherForecasts4S2SCo-chair,InternationalResearchInstituteforClimateandSocietySouth-eastAsia(SEA)isinaprimelocationtobenefitfromsub-seasonal-to-seasonal(S2S)climateservices,asaregionwithsomeofthehighestskillattheS2Stimescale.TheAssociationofSoutheastAsianNations(ASEAN)SpecialisedMeteorologicalCentre(ASMC)andpartners(UNESCAP,aRIMES,btheAHACentrec)areworkingtodevelopS2SproductsinSEAfordisasterriskreductionundertheS2SSEAPilotProject,whichispartoftheS2SPredictionProjectreal-timepilotini-tiativeundertakenbyWMO,theWorldWeatherResearchProgramme(WWRP)andtheWorldClimateResearchProgramme(WCRP).TheprojectaimstoexploretheusefulnessofS2Spredictionsfordisasterriskreduction.Between20and26September2021,morethan50000peopledwereaffectedbyfloodsinthePhilippines,andSulawesiandeasternBorneoinIndonesia.Duringthesameweek,TropicalCycloneDianmucontributedtoseverefloodsinpartsofVietNam,CambodiaandThailand,affectingmorethan180000people.eBasedontheS2SSEAPilotProject’spredictions,asmallincreasedchanceofextremerainfallwasforecastedforsouth-easternIndonesiathreeweeksbeforethecasestudyweek.ThisevolvedbytheweekbeforetoamoderateincreaseinchanceforSulawesi,MalukuIslandsandWestPapuaandexpandedtosmallincreaseinchanceoverpartsofThailand,LaoPeople’sDemocraticRepublic,VietNam,andsouthernPhilippines,southernSumatra,easternBorneoandJava.ThisoutlookwasreportedintheAHACentre’sweeklyreportftonationaldisastermanage-mentorganizationsandothers,supportingthepreparationsforDianmugandotherhazardsalongwithsubsequentweatherforecasts,anexampleintheregionofstepstowardsaseamlesspredictionapproach.Theseresultsaretypicalofthefindingsofthepilotprojectsofar,whereincreasedchanceofextremerainfallfortheMaritimeContinentisagoodindicatorthreeweeksbeforehandthatoneormorehazardouseventsmayoccurinthegeneralarea.TheindicatorworkslesswellformainlandSouth-eastAsiathough,wheretheoutlooksoftenonlypredictanincreasedchanceoneweekbefore.Increasedprobabilitiesofhazardouseventssignalanincreasedprobabilityofdisasteraswell.Whiletheremaynotalwaysbeanindica-tionofimpendinghazardouseventsatthesub-seasonaltimescale,therelativelysmallnumberoffalsealarmsmeansthatactioncanbetakenatthesub-seasonaltimescale,suchastargetedmonitoringofthedevelopmentoftheeventsandactivatinginstitutionalprocessesearliersothatpreparednessandresponsearemoreefficient.aUnitedNationsEconomicandSocialCommissionforAsiaandthePacific:https://www.unescap.org/bRegionalIntegratedMulti-HazardEarlyWarningSystemforAfricaandAsia:https://www.rimes.int/cASEANCoordinatingCentreforHumanitarianAssistanceonDisasterManagement:https://ahacentre.org/dhttps://adinet.ahacentre.orgehttps://adinet.ahacentre.orgfhttps://ahacentre.org/wp-content/uploads/2021/09/DWeek_37_13-19Sep2021.pdfghttps://ahacentre.org/flash-update/flash-update-no-01-tropical-depression-21w-twentyone-viet-nam-23-september-2021/4647GREENHOUSEGASDATAEstimatedconcentrationsfrom1750areusedtorepresentpre-industrialconditions.Calculationsassumeapre-industrialmolefractionof278ppmforCO2,722ppbforCH4and270ppbforN2O.WorldDataCentreforGreenhouseGasesoperatedbyJapanMeteorologicalAgencyhttps://gaw.kishou.go.jp/.WorldMeteorologicalOrganization(WMO).WMOGreenhouseGasBulletin–No.17:TheStateofGreenhouseGasesintheAtmosphereBasedonGlobalObservationsthrough2020.Geneva,2021.WorldOzoneandUltravioletRadiationDataCentreoperatedbyEnvironmentandClimateChangeCanadahttps://woudc.org/home.php.GLOBALTEMPERATUREDATAGLOBALMEANTEMPERATURETIMESERIESThemethodforcalculatingglobalmeantemperatureanomaliesrelativetoan1850–1900baselinehasbeenupdatedsincetheStateoftheGlobalClimate2020report.ThemethodwasupdatedtotakeadvantageoftheassessmentmadebyWorkingGroupI,initscontributiontotheIPCCSixthAssessmentReport,oflong-termchangeanditsuncertainty.Thenewmethodalsomakesuseofawiderrangeofshorterdatasetsthatareroutinelyupdatedtoprovideanauthoritativeassessmentofrecenttemperaturechanges.Inthe2020report(andearlierreports),changesrelativetothe1850–1900baselinewerebasedontheHadCRUT4datasetwhichwastheonlydatasetthatextendedbackto1850.OtherdatasetswereoffsettomatchtheaverageofHadCRUT4overtheperiod1880–1900(NASAGISTEMPandNOAAGlobalTemp)or1981–2010(ERA5,JRA-55).In2021,theIPCCSixthAssessmentReportWorkingGroupIassessedchangefrom1850–1900tootherperiodsbasedonanaverageoffourdatasets–HadCRUT5,BerkeleyEarth,NOAA–InterimandKadowetal.(2020)–whichallextendbackto1850.Theyassesseduncertaintybyconsideringtherangefromthefourestimates,takenfromthelowerboundoftheuncertaintyrangeofthecoolestdatasettotheupperboundoftheuncertaintyrangeofthewarmest.Bymakinguseoffourdatasetsthatextendbackto1850,WorkingGroupIwasabletomakeamorecomprehensiveestimateofuncertainty.AstwoofthefourIPCCdatasetsarenotregularlyupdated,inthepresentreporttheestimatemadebytheIPCCforthetemperaturechangebetween1850–1900and1981–2010iscombinedwithestimatedchangesbetween1981–2010andthecurrentyearfromsixdatasetstocalculateanomaliesfor2021relativeto1850–1900.Thereisgood,thoughnotperfect,agreementbetweenthesixdatasetsonchangesfrom1981–2010tothepresent,asthisisaperiodwithgoodobservationalcoverage.TheadditionalmodestuncertaintyfromthespreadofthesixdatasetsiscombinedwiththatoftheIPCC’sestimateoftheuncertaintyinthechangefrom1850–1900to1981–2010.Datasetsandmethods48Moreprecisely,sixdatasets(citedbelow)wereusedinthecalculationofglobaltemperature.Globalmeantemperatureanomalieswerecalculatedrelativetoan1850–1900baselineusingthefollowingsteps:1.Thestartingpointwasatimeseriesofglobalannualmeantemperaturesforeachdataset,asprovidedbythedataproviders.Theanomalieswerepresentedondifferentbaselines.2.Foreachdataset,anomalieswerecalculatedrelativetothe1981–2010averagebysubtractingtheaveragefortheperiod1981–2010.3.Theamount0.69°Cwasaddedtoeachseries,basedontheestimateddifferencebetween1850–1900and1981–2010,calculatedusingthemethodfromtheIPCCSixthAssessmentReportWorkingGroupI(thenumberisprovidedinthecaptionforFigure1.12inthatreport).4.Themeanandstandarddeviationofthesixestimateswerecalculated.5.TheuncertaintyintheIPCCestimatewascombinedwiththestandarddeviation,assumingthetwoareindependentandassumingtheIPCCuncertaintyrange(0.54°Cto0.79°C)isrepresentativeofa90%confidencerange(1.645standarddeviations).Thenumberquotedinthisreportfor2021(1.11±0.13°C)wascalculatedinthiswaywith1.11°Cbeingthemeanofthesixestimates.AnnualtemperaturemapsThemethodforcalculatingthemapofannualtemperatureanomalieshasalsobeenupdated.Inthe2020report,amapshowinganomaliesrelativeto1981–2010fromasingledataset(ERA5)wasused.Whilethemapwasbasedonasingledataset,theaccompanyingassessmentwasbasedonallavailabledatasets.Forthemapoftemperatureanomaliesfor2021,amedianvalueoffiveofthedatasetswasused–HadCRUT5,ERA5,NOAAGlobalTemp,BerkeleyEarthandGISTEMP–regriddedtothespatialgridofthelowestresolutiondatasets(NOAAGlobalTempandHadCRUT5datasets),whicharepresentedona5°latitudeby5°longitudegrid.Themedianisusedinpreferencetothemeantominimizetheeffectofpotentialoutliers.Thehalf-rangeofthedatasetsprovidesanindicationoftheuncertainty.ThespreadbetweenthedatasetsislargestathighlatitudesandinCentralAfrica,bothregionswithsparsedatacoverage.Thefollowingsixdatasetswereused:BerkeleyEarth–Rohde,R.A.;Hausfather,Z.TheBerkeleyEarthLand/OceanTemperatureRecord.EarthSystemScienceData2020,12,3469–3479.https://doi.org/10.5194/essd-12-3469-2020.ERA5—Hersbach,H.;Bell,B.;Berrisford,P.etal.TheERA5globalreanalysis.QuarterlyJournaloftheRoyalMeteorologicalSociety2020,146(730),1999–2049.https://doi.org/10.1002/qj.3803.GISTEMPv4—GISTEMPTeam,2022:GISSSurfaceTemperatureAnalysis(GISTEMP),version4.NASAGoddardInstituteforSpaceStudies,https://data.giss.nasa.gov/gistemp/.Lenssen,N.;Schmidt,G.;Hansen,J.etal.ImprovementsintheGISTEMPUncertaintyModel.JournalofGeophysicalResearch:Atmospheres2019,124(12):6307–6326.https://doi.org/10.1029/2018JD029522.49HadCRUT.5.0.1.0—Morice,C.P.;Kennedy,J.J.;Rayner,N.A.etal.AnUpdatedAssessmentofNear-SurfaceTemperatureChangeFrom1850:TheHadCRUT5DataSet.JournalofGeophysicalResearch:Atmospheres2021,126(3),e2019JD032361.https://doi.org/10.1029/2019JD032361.HadCRUT.5.0.1.0datawereobtainedfromhttp://www.metoffice.gov.uk/hadobs/hadcrut5on24October2021andare©BritishCrownCopyright,MetOffice2021,providedunderanOpenGovernmentLicense,http://www.nationalarchives.gov.uk/doc/open-government-licence/version/3/.JRA-55—Kobayashi,S.;Ota,Y.;Harada,Y.etal.TheJRA-55Reanalysis:GeneralSpecificationsandBasicCharacteristics.JournaloftheMeteorologicalSocietyofJapan.Ser.II2015,93(1),5–48.https://doi.org/10.2151/jmsj.2015-001,https://www.jstage.jst.go.jp/article/jmsj/93/1/93_2015-001/_article.NOAAGlobalTempv5—Zhang,H.-M.,etal.,NOAAGlobalSurfaceTemperatureDataset(NOAAGlobalTemp),Version5.0.NOAANationalCentersforEnvironmentalInformation.doi:10.7289/V5FN144H.Huang,B.;Menne,M.J.;Boyer,T.etal.UncertaintyEstimatesforSeaSurfaceTemperatureandLandSurfaceAirTemperatureinNOAAGlobalTempVersion5.JournalofClimate2020,33(4),1351–1379.https://journals.ametsoc.org/view/journals/clim/33/4/jcli-d-19-0395.1.xml.Figure28.(a)Near-surfaceairtemperatureanomaliesfor2021relativetothe1981–2010averageforthemedianoffivedatasetsona5°grid.(b)Rangeofthefiveestimates;nearsurfacetemperatureanomaliesonthenativeresolutiongridofthedatasetfor(c)HadCRUT5(5°resolution),(d)ERA5(0.25°),(e)BerkeleyEarth(1°),(f)GISTEMP(2°)and(g)NOAAGlobalTemp(5°).90ºN(a)Median2021(b)Range(c)HadCRUT5(d)ERA5(e)BerkeleyEarth(f)NASAGISTEMP(g)NOAAGlobalTemp45ºN0º45ºS90ºS180º90ºW0º90ºE180ºLongitude–10–3–101310°CLatitude90ºN45ºN0º45ºS90ºS180º90ºW0º90ºE180ºLongitudeLatitude90ºN45ºN0º45ºS90ºS180º90ºW0º90ºE180ºLongitudeLatitude90ºN45ºN0º45ºS180º90ºW0º90ºE180ºLongitudeLatitude90ºN45ºN0º45ºS180º90ºW0º90ºE180ºLongitudeLatitude90ºS90ºS90ºN45ºN0º45ºS180º90ºW0º90ºE180ºLongitudeLatitude90ºS90ºN45ºN0º45ºS90ºS180º90ºW0º90ºE180ºLongitude0.00.20.40.60.82.0°CLatitude–10–3–101310°C50OCEANHEATCONTENTDATADatausedforestimatesupto2021:Cheng,L.;Trenberth,K.E.;Fasullo,J.etal.Improvedestimatesofoceanheatcontentfrom1960to2015,ScienceAdvances2017,3(3),e1601545.https://doi.org/10.1126/sciadv.1601545.Ishii,M.;Fukuda,Y.;Hirahara,S.etal.AccuracyofGlobalUpperOceanHeatContentEstimationExpectedfromPresentObservationalDataSets.SOLA2017,13,163–167.https://doi.org/10.2151/sola.2017-030.Lyman,J.M.;Johnson,G.C.EstimatingGlobalOceanHeatContentChangesintheUpper1800msince1950andtheInfluenceofClimatologyChoice.JournalofClimate2014,27(5),1945–1957.https://doi.org/10.1175/JCLI-D-12-00752.1.vonSchuckmann,K.;LeTraon,P.-Y.HowwellcanwederiveGlobalOceanIndicatorsfromArgodata?OceanScience2011,7(6),783–791.https://doi.org/10.5194/os-7-783-2011.Inaddition,datausedupto2020:Desbruyères,D.G.;Purkey,S.G.;McDonagh,E.L.etal.Deepandabyssaloceanwarmingfrom35yearsofrepeathydrography,GeophysicalResearchLetters2016,43(19),310–356.https://doi.org/10.1002/2016GL070413.Gaillard,F.;Reynaud,T.;Thierry,V.etal.InSitu–BasedReanalysisoftheGlobalOceanTemperatureandSalinitywithISAS:VariabilityoftheHeatContentandStericHeight,JournalofClimate2016,29(4),1305–1323.https://doi.org/10.1175/JCLI-D-15-0028.1.Hosoda,S.;Ohira,T.;Nakamura,T.AmonthlymeandatasetofglobaloceanictemperatureandsalinityderivedfromArgofloatobservations.JAMSTECReportofResearchandDevelopment2008,8,47–59.https://www.jstage.jst.go.jp/article/jamstecr/8/0/8_0_47/_article.KuuselaM.;Stein,M.L.Locallystationaryspatio-temporalinterpolationofArgoprofilingfloatdata.ProceedingsoftheRoyalSocietyA2018,474,20180400.http://dx.doi.org/10.1098/rspa.2018.0400.Levitus,S.;Antonov,J.I.;Boyer,T.P.etal.WorldOceanheatcontentandthermostericsealevelchange(0-2000m)1955–2010.GeophysicalResearchLetters2012,39(10),L10603.https://doi.org/10.1029/2012GL051106.Li,H.;Xu,F.;Zhou,W.etal.DevelopmentofaglobalgriddedArgodatasetwithBarnessuccessivecorrections,JournalofGeophysicalResearch:Oceans2017,122(2),866–889,https://doi.org/10.1002/2016JC012285.Roemmich,D.;Gilson,J.The2004–2008meanandannualcycleoftemperature,salinity,andstericheightintheglobaloceanfromtheArgoProgram,ProgressinOceanography2009,82(2),81–100.https://doi.org/10.1016/j.pocean.2009.03.004.vonSchuckmann,K.;LeTraon,P.-Y.;Smith,N.etal.,Eds.CopernicusMarineServiceOceanStateReport,JournalofOperationalOceanography2018,11,S1–S142.https://doi.org/10.1080/1755876X.2018.1489208.SEALEVELDATAGMSLfromCNES/Aviso+https://www.aviso.altimetry.fr/en/data/products/ocean-indica-tors-products/mean-sea-level/data-acces.html#c12195MARINEHEATWAVEANDMARINECOLDSPELLDATAMarineheatwaves(MHWs)arecategorizedasmoderatewhenthesea-surfacetemperature(SST)isabovethe90thpercentileoftheclimatologicaldistributionforfivedaysorlonger;thesubsequentcategoriesaredefinedwithrespecttothedifferencebetweentheSSTandtheclimatologicaldistributionaverage:strong,severeorextreme,ifthatdifferenceis,51respectively,morethantwo,threeorfourtimesthedifferencebetweenthe90thpercentileandtheclimatologicaldistributionaverage(Hobdayetal.,2018).Marinecoldspell(MCS)categoriesareanalogous,butarecategorizedwithreferencetosea-surfacetemperaturesbelowthe10thpercentile.ThebaselineusedforMHWsandMCSsis1982–2011,whichisshiftedbyoneyearfromthestandardnormalperiodof1981–2010becausethefirstfullyearofthesatelliteSSTseriesonwhichitisbasedis1982.Hobday,A.J.;Oliver,E.C.J.;SenGupta,A.etal.Categorizingandnamingmarineheatwaves.Oceanography2018,31(2),1–13.https://doi.org/10.5670/oceanog.2018.205.NOAAOISSTv2:OptimumInterpolationSeaSurfaceTemperature(OISST):Banzon,V.;Smith,T.M.;Chin,T.M.etal.Along-termrecordofblendedsatelliteandinsitusea-surfacetemperatureforclimatemonitoring,modelingandenvironmentalstudies.EarthSystemScienceData2016,8(1),165–176.https://doi.org/10.5194/essd-8-165-2016.GLACIERMASSBALANCEDATAGlaciermassbalancedatafortheglobalnetworkofreferenceglaciersareavailablefromtheWorldGlacierMonitoringService(WGMS),https://www.wgms.ch.Dataforthe2020–2021massbalanceyeararepreliminary,andarebasedonasubsetof32(outofatotalof~42)WGMSreferenceglaciers.TheglaciermassbalancedataforwesternCanadaarebasedonmulti-year,bi-annual(AprilandSeptember)repeatLiDARsurveysconductedbyBrianMenounosattheUniversityofNorthernBritishColumbia,Canada,asdescribedinPeltoetal.(2019).Pelto,B.M.;Menounos,B.;Marshall,S.J.Multi-yearevaluationofairbornegeodeticsurveystoestimateseasonalmassbalance,ColumbiaandRockyMountains,Canada.TheCryosphere2019,13(6),1709–1727.https://doi.org/10.5194/tc-13-1709-2019.Hugonnet,R.;McNabb,R.;Berthier,E.etal.Acceleratedglobalglaciermasslossintheearlytwenty-firstcentury.Nature2021,592,726–731.https://doi.org/10.1038/s41586-021-03436-z.GREENLANDANDANTARCTICICESHEETDATAGreenlandicesheetmassbalancedataarereportedfromthreesources.Modelledchangesinsurfacemassbalanceandtotalmassbalancefrom1985to2021arebasedontheaverageofthreeregionalclimateandmassbalancemodels,describedinMankoffetal.(2021).Analternativeestimateof2021massbalanceisgivenintheNOAAArcticReportCard(Moonetal.,2021),basedonsatelliteobservationsofmeltareaandsurfacemassbalancemodelsdrivenbythePROMICEsurfaceweatherstationnetwork.SatellitegravitydataoftotalicesheetmassbalancefromtheGRACEandGRACE-FOmissionsareavailablefromWieseetal.(2019,updatedto2021).ThesedataareavailableforboththeGreenlandandAntarcticicesheets.Mankoff,K.D.;Fettweis,X.;Langen,P.L.etal.Greenlandicesheetmassbalancefrom1840throughnextweek.EarthSystemScienceData2021,13(10),5001–5025.https://doi.org/10.5194/essd-13-5001-2021.Moon,T.A.;Tedesco,M.;Box,J.E.etal.GreenlandIceSheet.InArcticReportCard2021;Moon,T.A.;Druckenmiller,M.L.;Thoman,R.L.,Eds.;NationalOceanicandAtmosphericAdministration,2021.https://doi.org/10.25923/546g-ms61.Wiese,D.N.;Yuan,D.-N;Boening,C.etal.2019.JPLGRACEandGRACE-FOMasconOcean,Ice,andHydrologyEquivalentWaterHeightRL06MCRIFilteredVersion2.0,Ver.2.0,PO.DAAC,CA,USA.http://dx.doi.org/10.5067/TEMSC-3MJ62.52SNOWDATASnowdataandmonthlyanomalytimeserieschartsareavailableat:https://climate.rutgers.edu/snowcover/files/wmo/rutgers-nh-sce-anomalies-2020-21-data.xlsxSEA-ICEDATATheseaicesectionusesdatafromtheEUMETSATOSISAFSeaIceIndexv2.1(OSI-SAF,basedonLavergneetal.,2019)andtheNSIDCv3SeaIceIndex(Fettereretal.,2017).Sea-iceconcentrationsareestimatedfrommicrowaveradiancesmeasuredfromsatellites.Sea-iceextentiscalculatedastheareaofoceangridcellswherethesea-iceconcentrationexceeds15%.Althoughtherearerelativelylargedifferencesintheabsoluteextentbetweendatasets,theyagreewellontheyear-to-yearchangesandthetrends.Inthisreport,NSIDCdataarereportedforabsoluteextents(forexample,“18.95millionkm2”)forconsistencywithearlierreports,whilerankingsarereportedforbothdatasets.EUMETSATOceanandSeaIceSatelliteApplicationFacility,Seaiceindex1979-onwards(v2.1,2020),OSI-420,DataextractedfromOSISAFFTPserver:1979–2020,NorthernandSouthernHemisphere.https://osi-saf.eumetsat.int/products/osi-420.Fetterer,F.;Knowles,K.;Meier,W.N.etal.2017,updateddaily.SeaIceIndex,Version3.Boulder,ColoradoUSA.NationalSnowandIceDataCenter(NSIDC).https://doi.org/10.7265/N5K072F8.Lavergne,T.;Sørensen,A.M.;Kern,S.etal.Version2oftheEUMETSATOSISAFandESACCIsea-iceconcentrationclimatedatarecords.TheCryosphere2019,13(1),49–78.https://doi.org/10.5194/tc-13-49-2019.PERMAFROSTDATANoetzli,J.;Christiansen,H.H.;Hrbáček,F.etal.GlobalClimatePermafrostThermalState.InStateoftheClimatein2020;Dunn,R.J.,Aldred,H.,F.,Gobron,N.Eds.;BulletinoftheAmericanMeteorologicalSociety2021,102(8);S42–S44.https://doi.org/10.1175/BAMS-D-21-0098.1.Smith,S.L.;Romanovsky,V.E.;Isaksen,K.etal.Permafrost.InStateoftheClimatein2020;Druckenmiller,M.L.,Moon,T.,Thoman,R.,Eds.;BulletinoftheAmericanMeteorologicalSociety,2021,102(8);S293–S297.https://doi.org/10.1175/BAMS-D-21-0086.1.PRECIPITATIONDATATheseGlobalPrecipitationClimatologyCentre(GPCC)datasetswereusedintheanalysis:•FirstGuessMonthly,doi:10.5676/DWD_GPCC/FG_M_100.•MonitoringProduct(Version2020),doi:10.5676/DWD_GPCC/MP_M_V2020_100.•FullDataMonthly(Version2020),doi:10.5676/DWD_GPCC/FD_M_V2020_100.•FirstGuessDaily,doi:10.5676/DWD_GPCC/FG_D_100.•FullDataDaily(Version2020),doi:10.5676/DWD_GPCC/FD_D_V2020_100.53ListofcontributorsCONTRIBUTINGMEMBERSANDTERRITORIESAlgeria,Andorra,Argentina,Armenia,Australia,Austria,Bahrain,Barbados,Belarus,Belgium,Belize,BosniaandHerzegovina,Botswana,BritishCaribbeanTerritories,Bulgaria,BurkinaFaso,Cameroon,Canada,Chile,China,Colombia,Croatia,Cyprus,CzechRepublic,Denmark,Egypt,Estonia,Finland,France,Gambia,Georgia,Germany,Greece,Grenada,Guinea,Guinea-Bissau,HongKong,China;Hungary,India,IslamicRepublicofIran,Ireland,Israel,Italy,Japan,Jordan,Kazakhstan,Kenya,Latvia,Liberia,Libya,Lithuania,Luxembourg,Macao,China;Madagascar,Mali,Malta,Mauritius,Morocco,NewZealand,Niger,Nigeria,NorthMacedonia,Norway,Pakistan,Peru,Philippines,Poland,Portugal,RepublicofMoldova,Romania,RussianFederation,Rwanda,SaintVincentandtheGrenadines,SaudiArabia,Senegal,Serbia,Slovakia,Slovenia,SouthAfrica,Spain,SaintKittsandNevis,Sudan,Sweden,Switzerland,SyrianArabRepublic,Thailand,Netherlands,Togo,TrinidadandTobago,Tunisia,Turkey,Ukraine,UnitedKingdom,UnitedRepublicofTanzania,UnitedStatesofAmerica,Uruguay,Uzbekistan,ZimbabweINSTITUTIONALCONTRIBUTORSARCCentreofExcellenceforClimateExtremes,UniversityofTasmania,Australia;BirminghamInstituteofForestResearch,BirminghamUniversity,UK;BritishAntarcticSurvey(BAS);BureauofMeteorology(BoM),Australia;CarbonPortal,LundUniversity,Sweden;CentreNationald’ÉtudesSpatiales,CNES,France;MercatorOceaninternational,France;ObservatoireMidi-Pyrénées(OMP),France;IFREMER,France;UniversityofBrest,France;CentreNationaldelaRechercheScientifique,(CNRS),France;InstitutdeRecherchepourleDéveloppement(IRD),France;Laboratoired’OcéanographiePhysiqueetSpatiale(LOPS),France;Laboratoired’EtudesenGéophysiqueetOcéanographieSpatiales(LEGOS),France;InstitutUniversitaireEuropéendelaMer(IUEM),France;CELAD,France;SorbonneUniversité,France;Laboratoired’OcéanographiedeVillefranche,France;CenterforOceanMega-Science,ChineseAcademyofSciences;CopernicusClimateChangeService(C3S);CSIROOceansandAtmosphere,Australia;DanmarksMeteorologiskeInstitut(DMI);GlobalPrecipitationClimatologyCentre,DeutscherWetterdienst(GPCC,DWD);EnvironmentandClimateChangeCanada(ECCC);ETHZürich,Switzerland;EuropeanCentreforMediumRangeWeatherForecasts(ECMWF);GeorgeWashingtonUniversity,USA;HongKongObservatory;InstituteofAtmosphericPhysics,ChineseAcademyofSciences(IAP,CAS);JapanMarine-EarthScienceandTechnology(JAMSTEC);JointInstituteforMarineandAtmosphericResearch,UniversityofHawai’i(JIMAR),USA;MetOfficeHadleyCentre,UK;DepartmentofAtmosphere,OceanandEarthSystemModelingResearch,MeteorologicalResearchInstitute,Japan;NationalEnvironmentAgency,Singapore(NEA);NationalOceanographicandAtmosphereAdministration,NationalCentersforEnvironmentalInformation(NOAANCEI),USA;NOAA,PacificMarineEnvironmentalLaboratory(NOAAPMEL),USA;NationalOceanographyCentre(NOC),UK;NaturalResourcesCanada;NorwegianMeteorologicalInstitute;RutgersUniversity,USA;ScrippsInstitutionofOceanography,USA;TokyoClimateCenter,JapanMeteorologicalAgency(TCC,JMA);UniversidadeFederaldoRiodeJaneiro,Brazil;UniversityofExeter,UK;UniversityofVictoria,Canada;WoodsHoleOceanographicInstitution,USA;WorldClimateResearchProgramme(WCRP);WorldDataCentreforGreenhouseGases(WDCGG)54UNITEDNATIONSAGENCIESUnitedNationsOfficeforDisasterRiskReduction(UNDRR),UnitedNationsEnvironmentProgramme(UNEP),FoodandAgricultureOrganizationoftheUnitedNations(FAO),UnitedNationsHighCommissionerforRefugees(UNHCR),InternationalOrganizationforMigration(IOM),WorldFoodProgramme(WFP),IntergovernmentalOceanographicCommission–UnitedNations(IOC-UNESCO)INDIVIDUALCONTRIBUTORSSigneAaboe(NorwegianMeteorologicalInstitute),JorgeAlvar-Beltrán(FAO),OmarBaddour(WMOpublicationcoordinator),JessicaBlunden(NOAANCEI),TimBoyer(NOAANCEI),AnnyCazenave(LEGOSCNESandOMP),LijingCheng(IAP;CenterforOceanMega-Science,ChineseAcademyofSciences),LouisClement(NationalOceanographyCentre),KyleClem(UniversityofVictoria),EstelleDeConing(WMO),DamienDesbruyères(IFREMER,CNRS,IRD,Laboratoired’OcéanographiePhysiqueetSpatiale),MaxxDilley(WMO),RobertDunn(MetOfficeHadleyCentre),SimonEggleston(WMO/GCOS),ThomasEstilow(RutgersUniversity),FlorenceGeoffroy(UNHCR),DonataGiglio(UniversityofColorado),NathanGillett(ECCC),JohnGilson(ScrippsInstitutionofOceanography,UniversityofCalifornia),LorettaHieberGirardet(UNDRR),AtsushiGoto(TCC,JMA),YvanGouzenes(LEGOSandOMP),StephanGruber(CarletonUniversity),DebbieHemming(MetOfficeHadleyCentre,BirminghamInstituteofForestResearch),AnaHeureux(FAO),ShigekiHosoda(JAMSTEC),MatthiasHuss(ETHZürich),KirstenIsensee(IOCUNESCO),GregoryC.Johnson(NOAA,PMEL),RyanKang(NEA),MaartenKappelle(UNEP),JohnKennedy(leadauthor,MetOfficeHadleyCentre),ValentinaKhan(HydrometeorologicalResearchCenteroftheRussianFederation),RachelKillick(MetOfficeHadleyCentre),BrianA.King(NOC),AnimeshKumar(UNDRR),MikaelKuusela(CarnegieMellonUniversity),GernotLaganda(WFP),ThomasLavergne(NorwegianMeteorologicalInstitute),YuehuaLi(UniversityofNewSouthWales),RenataLibonati(UniversidadeFederaldoRiodeJaneiro),JuergLuterbacher(WMO),JohnLyman(NOAA,PMEL),ShawnMarshall(ECCCandUniversityofCalgary),JesseMason(WFP),BrianMenounos(UniversityofNorthernBritishColumbia),AudreyMinière(MercatorOceaninternational),MaevaMonier(CELAD/MercatorOceaninternational),ColinMorice(MetOfficeHadleyCentre),LevNeretin(FAO),StoykaNetcheva(WMO),RodicaNitu(WMO),JeannetteNoetzli,(InstituteforSnowandAvalancheResearch),BenPelto(UniversityofNorthernBritishColumbia),ClaireRansom(WMO),AndrewRobertson(S2Sco-chair,IRI),DavidRobinson(RutgersUniversity),DeanRoemmich(ScrippsInstitutionofOceanography),KanakoSato(JAMSTEC),KatsunariSato(JMA),YousukeSawa(JMA,WDCGG),RobertW.Schlegel(SorbonneUniversité,CNRS,Laboratoired’OcéanographiedeVillefranche),KatherinaSchoo(IOCUNESCO),KarinavonSchuckmann(MercatorOceaninternational),RahulSengupta(UNDRR),FumiSezaki(TCC,JMA),JoséÁlvaroSilva(WMO),SharonSmith(NaturalResourcesCanada),MichaelSparrow(WCRP),MartinStendel(DMI),PeterStott(MetOfficeHadleyCentre,UniversityofExeter),DmitryStreletskiy(GeorgeWashingtonUniversity),ToshioSuga(JAMSTEC,TohokuUniversity),TanguySzekely(OceanScope),WeeLengTan(NEA),OksanaTarasova(WMO),BlairTrewin(BoM),TheaTurkington(NEA,Singapore),JohnTurner(BAS),FrejaVamborg(ECMWF),AlexVermeulen(CarbonPortal,LundUniversity),FredericVitart(S2Sco-chair,ECMWF),YingWang(UNEP),MichelleYonetani(UNHCR),ZhiweiZhu(NanjingUniversityofInformationScienceandTechnology),MarkusZiese(DWD)Formoreinformation,pleasecontact:WorldMeteorologicalOrganization7bis,avenuedelaPaix–P.O.Box2300–CH1211Geneva2–SwitzerlandStrategicCommunicationsOfficeCabinetOfficeoftheSecretary-GeneralTel:+41(0)227308314Email:communications@wmo.intpublic.wmo.intJN22229

1、当您付费下载文档后,您只拥有了使用权限,并不意味着购买了版权,文档只能用于自身使用,不得用于其他商业用途(如 [转卖]进行直接盈利或[编辑后售卖]进行间接盈利)。
2、本站所有内容均由合作方或网友上传,本站不对文档的完整性、权威性及其观点立场正确性做任何保证或承诺!文档内容仅供研究参考,付费前请自行鉴别。
3、如文档内容存在违规,或者侵犯商业秘密、侵犯著作权等,请点击“违规举报”。

碎片内容

碳中和
已认证
内容提供者

碳中和

确认删除?
回到顶部
微信客服
  • 管理员微信
QQ客服
  • QQ客服点击这里给我发消息
客服邮箱