路孚特2022年全球碳市场年报节选-英文VIP专享VIP免费

COVER TITLE
LIGHT 55/55
Sub title – here
(title level 2 white, 35/35)
CARBON MARKET YEAR IN REVIEW 2022
The cost of emitting greenhouse gases was higher than ever before in 2022 in the
main emission trading systems (ETS). EU emission allowances averaged above €80/t
– 50 percent higher than in 2021. UK allowances fetched an even higher price, and
those in both North American markets (WCI and RGGI) averaged higher than any
previous year as well.
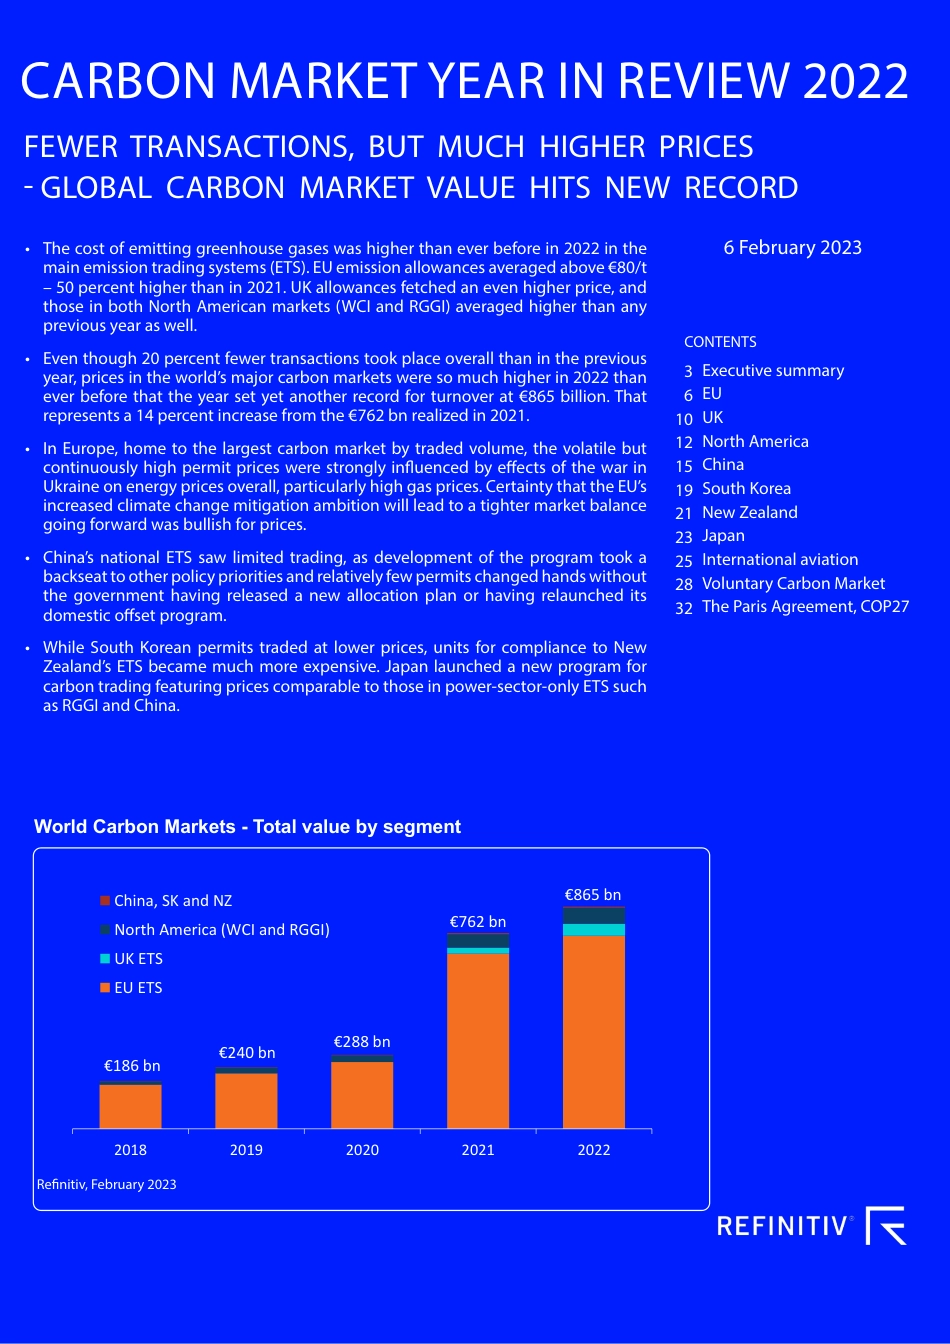
Even though 20 percent fewer transactions took place overall than in the previous
year, prices in the world’s major carbon markets were so much higher in 2022 than
ever before that the year set yet another record for turnover at €865 billion. That
represents a 14 percent increase from the €762 bn realized in 2021.
In Europe, home to the largest carbon market by traded volume, the volatile but
continuously high permit prices were strongly inuenced by eects of the war in
Ukraine on energy prices overall, particularly high gas prices. Certainty that the EU’s
increased climate change mitigation ambition will lead to a tighter market balance
going forward was bullish for prices.
Chinas national ETS saw limited trading, as development of the program took a
backseat to other policy priorities and relatively few permits changed hands without
the government having released a new allocation plan or having relaunched its
domestic oset program.
While South Korean permits traded at lower prices, units for compliance to New
Zealand’s ETS became much more expensive. Japan launched a new program for
carbon trading featuring prices comparable to those in power-sector-only ETS such
as RGGI and China.
6 February 2023
CONTENTS
Executive summary
EU
UK
North America
China
South Korea
New Zealand
Japan
International aviation
Voluntary Carbon Market
The Paris Agreement, COP27
3
6
10
12
15
19
21
23
25
28
32
FEWER TRANSACTIONS, BUT MUCH HIGHER PRICES
GLOBAL CARBON MARKET VALUE HITS NEW RECORD
Renitiv, February 2023
World Carbon Markets - Total value by segment
€186 bn €240 bn €288 bn
€762 bn
€865 bn
2018 2019 2020 2021 2022
China, SK and NZ
North America (WCI and RGGI)
UK ETS
EU ETS
REVIEW OF CARBON MARKETS IN 2022
February 2023
This report presents Renitiv’s assessment of the world’s major carbon markets in 2022. The aim is to show the main market trends and
policy developments in global emission trading systems, and areas where such systems are emerging. We collect data from ocial sources,
primarily carbon trading platforms such as ICE, EEX, KRX, and the Chinese carbon exchanges. When relevant, we estimate and add the size
of bilateral (over-the-counter) transactions. This gives us an estimate of the actual volume traded.
It covers the main regions in which there are existing or emerging emission markets. Chief among these is Europe with its EU ETS, and since
2021 also the UK ETS. We do not include data from the Swiss ETS. In North America we look at the WCI, RGGI, and the emerging market
in Mexico. In China we include the regional pilot ETS, oset trading (CCERs) and trading in the national ETS. We also include South Korea
(KETS), New Zealand (NZ ETS), and an assessment of what is left of global oset transactions from the old CDM market. This year for the
rst time we include a section on the Japanese demonstration carbon credit market, a pilot/preparatory phase for Japan’s voluntary ETS
set to start later in 2023.
The report also comments on developments in international aviation emissions and related oset trading, in voluntary carbon markets,
and on how the Paris Agreement Article 6 might involve transactions of carbon units. These three chapters contain mainly qualitative
information, but future editions of the Year in Review may provide quantitative data as markets in these areas evolve.
This report was written by the following team of analysts: Yan Qin (Norway), Tatiana Suarez Lopez (Norway), Maria Kolos (Ukraine), Luyue
Tan (China), Yoko Nobuoka (Japan), and Lisa Zelljadt (USA).
Review of carbon markets in 2022
6 February 2023 3
Sustained record high carbon prices, particularly in the European
ETS, made for another record total global carbon market turnover
in 2022 despite overall traded volume being down 21 percent
from 2021. Even though only 12.5 billion tonnes changed
hands in the world’s compliance carbon markets (equivalent
to 12.5 gigatonnes of CO2) in 2022, the higher prices per unit
raised overall value of the carbon markets – particularly those in
the large established emission trading systems (ETS) in Europe
and North America. We estimate the value of these transactions
at around of €865 billion, compared to €762 billion in 2021.
PRICES RISING
The most signicant example of the continued trend of rising
carbon prices is the EU ETS, but the North American carbon markets
(Western Climate Initiative or WCI, which includes the state of
California, and the northeasts Regional Greenhouse Gas Initiative
known as RGGI) are also seeing ever higher carbon prices, as is the
New Zealand ETS. The countries/regions these carbon markets are
in have been moving toward more ambitious climate targets, and
emission trading is set to play an important role in reaching them.
As was the case last year, continued price rallies are an eect of
this higher climate policy ambition, reecting market participants’
expectations for a tight future supply-demand balance.
EUROPEAN ETS
The EU ETS witnessed wild swings and sustained high prices in
2022. The sudden drop in Russian gas supply to Europe threw
energy markets into turmoil, impacting trading in all energy
related commodities including carbon. The number of allowances
1. Executive summary
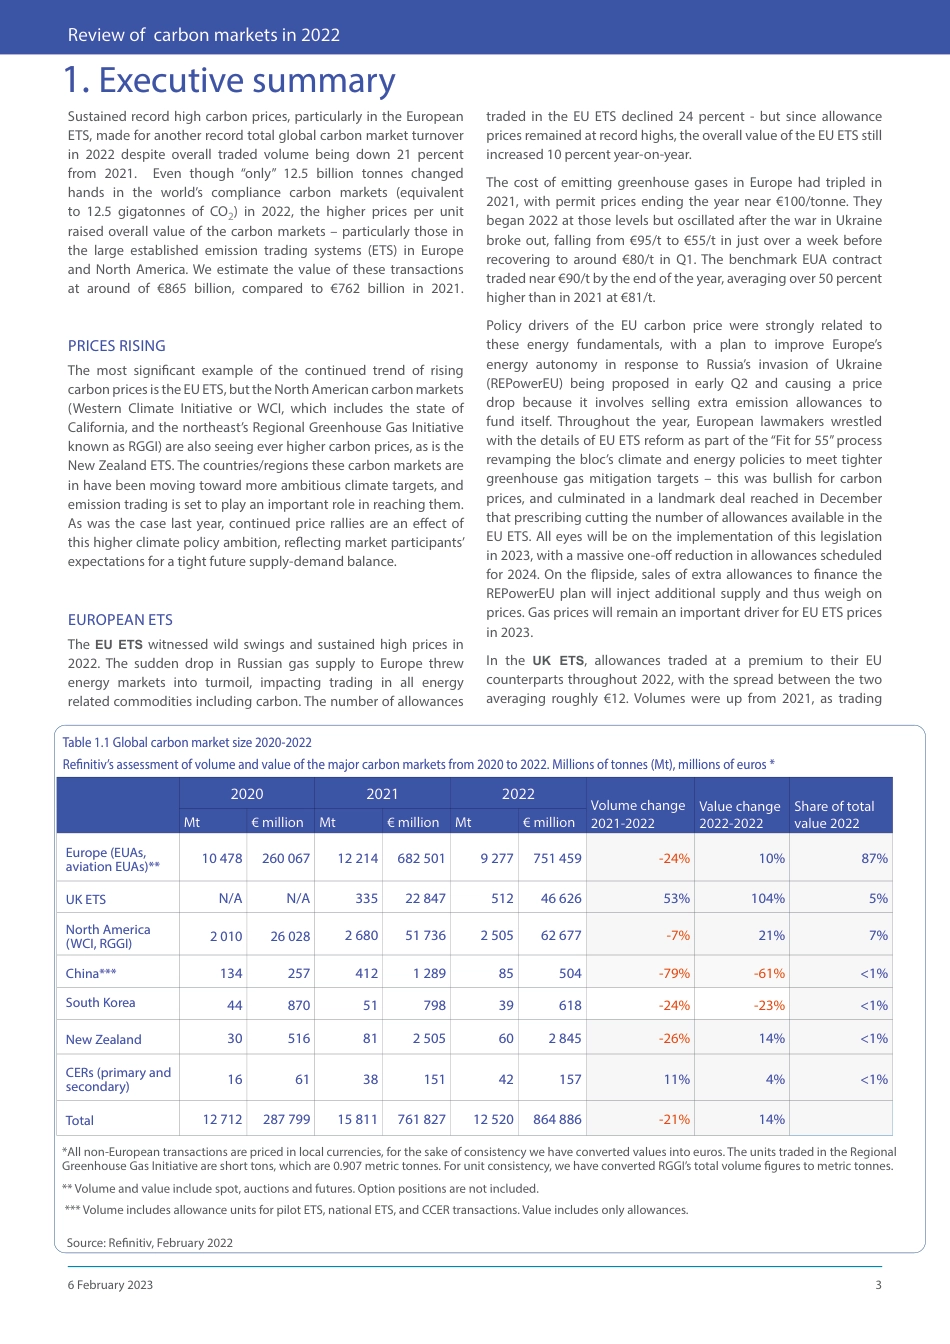
Table 1.1 Global carbon market size 2020-2022
Renitivs assessment of volume and value of the major carbon markets from 2020 to 2022. Millions of tonnes (Mt), millions of euros *
2020 2021 2022
Volume change
2021-2022
Value change
2022-2022
Share of total
value 2022
Mt € million Mt € million Mt € million
Europe (EUAs,
aviation EUAs)**
10 478 260 067 12 214 682 501 9 277 751 459 -24% 10% 87%
UK ETS
N/A N/A 335 22 847 512 46 626 53% 104% 5%
North America
(WCI, RGGI)
2 010 26 028
2 680 51 736 2 505 62 677 -7% 21% 7%
China***
134 257 412 1 289 85 504 -79% -61% <1%
South Korea
44 870 51 798 39 618 -24% -23% <1%
New Zealand
30 516 81 2 505 60 2 845 -26% 14% <1%
CERs (primary and
secondary)
16 61 38 151 42 157 11% 4% <1%
Total
12 712 287 799
15 811 761 827 12 520 864 886 -21% 14%
*All non-European transactions are priced in local currencies, for the sake of consistency we have converted values into euros. The units traded in the Regional
Greenhouse Gas Initiative are short tons, which are 0.907 metric tonnes. For unit consistency, we have converted RGGI’s total volume gures to metric tonnes.
** Volume and value include spot, auctions and futures. Option positions are not included.
*** Volume includes allowance units for pilot ETS, national ETS, and CCER transactions. Value includes only allowances.
Source: Renitiv, February 2022
traded in the EU ETS declined 24 percent - but since allowance
prices remained at record highs, the overall value of the EU ETS still
increased 10 percent year-on-year.
The cost of emitting greenhouse gases in Europe had tripled in
2021, with permit prices ending the year near €100/tonne. They
began 2022 at those levels but oscillated after the war in Ukraine
broke out, falling from €95/t to €55/t in just over a week before
recovering to around €80/t in Q1. The benchmark EUA contract
traded near €90/t by the end of the year, averaging over 50 percent
higher than in 2021 at €81/t.
Policy drivers of the EU carbon price were strongly related to
these energy fundamentals, with a plan to improve Europe’s
energy autonomy in response to Russia’s invasion of Ukraine
(REPowerEU) being proposed in early Q2 and causing a price
drop because it involves selling extra emission allowances to
fund itself. Throughout the year, European lawmakers wrestled
with the details of EU ETS reform as part of the “Fit for 55” process
revamping the bloc’s climate and energy policies to meet tighter
greenhouse gas mitigation targets – this was bullish for carbon
prices, and culminated in a landmark deal reached in December
that prescribing cutting the number of allowances available in the
EU ETS. All eyes will be on the implementation of this legislation
in 2023, with a massive one-o reduction in allowances scheduled
for 2024. On the ipside, sales of extra allowances to nance the
REPowerEU plan will inject additional supply and thus weigh on
prices. Gas prices will remain an important driver for EU ETS prices
in 2023.
In the UK ETS, allowances traded at a premium to their EU
counterparts throughout 2022, with the spread between the two
averaging roughly €12. Volumes were up from 2021, as trading
COVERTITLE(LIGHT55/55)Subtitle–here(titlelevel2white,35/35)CARBONMARKETYEARINREVIEW2022•Thecostofemittinggreenhousegaseswashigherthaneverbeforein2022inthemainemissiontradingsystems(ETS).EUemissionallowancesaveragedabove€80/t–50percenthigherthanin2021.UKallowancesfetchedanevenhigherprice,andthoseinbothNorthAmericanmarkets(WCIandRGGI)averagedhigherthananypreviousyearaswell.•Eventhough20percentfewertransactionstookplaceoverallthaninthepreviousyear,pricesintheworld’smajorcarbonmarketsweresomuchhigherin2022thaneverbeforethattheyearsetyetanotherrecordforturnoverat€865billion.Thatrepresentsa14percentincreasefromthe€762bnrealizedin2021.•InEurope,hometothelargestcarbonmarketbytradedvolume,thevolatilebutcontinuouslyhighpermitpriceswerestronglyinfluencedbyeffectsofthewarinUkraineonenergypricesoverall,particularlyhighgasprices.CertaintythattheEU’sincreasedclimatechangemitigationambitionwillleadtoatightermarketbalancegoingforwardwasbullishforprices.•China’snationalETSsawlimitedtrading,asdevelopmentoftheprogramtookabackseattootherpolicyprioritiesandrelativelyfewpermitschangedhandswithoutthegovernmenthavingreleasedanewallocationplanorhavingrelauncheditsdomesticoffsetprogram.•WhileSouthKoreanpermitstradedatlowerprices,unitsforcompliancetoNewZealand’sETSbecamemuchmoreexpensive.Japanlaunchedanewprogramforcarbontradingfeaturingpricescomparabletothoseinpower-sector-onlyETSsuchasRGGIandChina.6February2023CONTENTSExecutivesummaryEUUKNorthAmericaChinaSouthKoreaNewZealandJapanInternationalaviationVoluntaryCarbonMarketTheParisAgreement,COP2736101215192123252832FEWERTRANSACTIONS,BUTMUCHHIGHERPRICES-GLOBALCARBONMARKETVALUEHITSNEWRECORDRefinitiv,February2023WorldCarbonMarkets-Totalvaluebysegment€186bn€240bn€288bn€762bn€865bn20182019202020212022China,SKandNZNorthAmerica(WCIandRGGI)UKETSEUETSREVIEWOFCARBONMARKETSIN2022February2023ThisreportpresentsRefinitiv’sassessmentoftheworld’smajorcarbonmarketsin2022.Theaimistoshowthemainmarkettrendsandpolicydevelopmentsinglobalemissiontradingsystems,andareaswheresuchsystemsareemerging.Wecollectdatafromofficialsources,primarilycarbontradingplatformssuchasICE,EEX,KRX,andtheChinesecarbonexchanges.Whenrelevant,weestimateandaddthesizeofbilateral(over-the-counter)transactions.Thisgivesusanestimateoftheactualvolumetraded.Itcoversthemainregionsinwhichthereareexistingoremergingemissionmarkets.ChiefamongtheseisEuropewithitsEUETS,andsince2021alsotheUKETS.WedonotincludedatafromtheSwissETS.InNorthAmericawelookattheWCI,RGGI,andtheemergingmarketinMexico.InChinaweincludetheregionalpilotETS,offsettrading(CCERs)andtradinginthenationalETS.WealsoincludeSouthKorea(KETS),NewZealand(NZETS),andanassessmentofwhatisleftofglobaloffsettransactionsfromtheoldCDMmarket.ThisyearforthefirsttimeweincludeasectionontheJapanesedemonstrationcarboncreditmarket,apilot/preparatoryphaseforJapan’svoluntaryETSsettostartlaterin2023.Thereportalsocommentsondevelopmentsininternationalaviationemissionsandrelatedoffsettrading,involuntarycarbonmarkets,andonhowtheParisAgreementArticle6mightinvolvetransactionsofcarbonunits.Thesethreechapterscontainmainlyqualitativeinformation,butfutureeditionsoftheYearinReviewmayprovidequantitativedataasmarketsintheseareasevolve.Thisreportwaswrittenbythefollowingteamofanalysts:YanQin(Norway),TatianaSuarezLopez(Norway),MariaKolos(Ukraine),LuyueTan(China),YokoNobuoka(Japan),andLisaZelljadt(USA).Reviewofcarbonmarketsin20226February20233Sustainedrecordhighcarbonprices,particularlyintheEuropeanETS,madeforanotherrecordtotalglobalcarbonmarketturnoverin2022despiteoveralltradedvolumebeingdown21percentfrom2021.Eventhough“only”12.5billiontonneschangedhandsintheworld’scompliancecarbonmarkets(equivalentto12.5gigatonnesofCO2)in2022,thehigherpricesperunitraisedoverallvalueofthecarbonmarkets–particularlythoseinthelargeestablishedemissiontradingsystems(ETS)inEuropeandNorthAmerica.Weestimatethevalueofthesetransactionsataroundof€865billion,comparedto€762billionin2021.PRICESRISINGThemostsignificantexampleofthecontinuedtrendofrisingcarbonpricesistheEUETS,buttheNorthAmericancarbonmarkets(WesternClimateInitiativeorWCI,whichincludesthestateofCalifornia,andthenortheast’sRegionalGreenhouseGasInitiativeknownasRGGI)arealsoseeingeverhighercarbonprices,asistheNewZealandETS.Thecountries/regionsthesecarbonmarketsareinhavebeenmovingtowardmoreambitiousclimatetargets,andemissiontradingissettoplayanimportantroleinreachingthem.Aswasthecaselastyear,continuedpriceralliesareaneffectofthishigherclimatepolicyambition,reflectingmarketparticipants’expectationsforatightfuturesupply-demandbalance.EUROPEANETSTheEUETSwitnessedwildswingsandsustainedhighpricesin2022.ThesuddendropinRussiangassupplytoEuropethrewenergymarketsintoturmoil,impactingtradinginallenergyrelatedcommoditiesincludingcarbon.Thenumberofallowances1.ExecutivesummaryTable1.1Globalcarbonmarketsize2020-2022Refinitiv’sassessmentofvolumeandvalueofthemajorcarbonmarketsfrom2020to2022.Millionsoftonnes(Mt),millionsofeuros202020212022Volumechange2021-2022Valuechange2022-2022Shareoftotalvalue2022Mt€millionMt€millionMt€millionEurope(EUAs,aviationEUAs)10478260067122146825019277751459-24%10%87%UKETSN/AN/A335228475124662653%104%5%NorthAmerica(WCI,RGGI)201026028268051736250562677-7%21%7%China134257412128985504-79%-61%<1%SouthKorea448705179839618-24%-23%<1%NewZealand30516812505602845-26%14%<1%CERs(primaryandsecondary)1661381514215711%4%<1%Total127122877991581176182712520864886-21%14%Allnon-Europeantransactionsarepricedinlocalcurrencies,forthesakeofconsistencywehaveconvertedvaluesintoeuros.TheunitstradedintheRegionalGreenhouseGasInitiativeareshorttons,whichare0.907metrictonnes.Forunitconsistency,wehaveconvertedRGGI’stotalvolumefigurestometrictonnes.Volumeandvalueincludespot,auctionsandfutures.Optionpositionsarenotincluded.VolumeincludesallowanceunitsforpilotETS,nationalETS,andCCERtransactions.Valueincludesonlyallowances.Source:Refinitiv,February2022tradedintheEUETSdeclined24percent-butsinceallowancepricesremainedatrecordhighs,theoverallvalueoftheEUETSstillincreased10percentyear-on-year.ThecostofemittinggreenhousegasesinEuropehadtripledin2021,withpermitpricesendingtheyearnear€100/tonne.Theybegan2022atthoselevelsbutoscillatedafterthewarinUkrainebrokeout,fallingfrom€95/tto€55/tinjustoveraweekbeforerecoveringtoaround€80/tinQ1.ThebenchmarkEUAcontracttradednear€90/tbytheendoftheyear,averagingover50percenthigherthanin2021at€81/t.PolicydriversoftheEUcarbonpricewerestronglyrelatedtotheseenergyfundamentals,withaplantoimproveEurope’senergyautonomyinresponsetoRussia’sinvasionofUkraine(REPowerEU)beingproposedinearlyQ2andcausingapricedropbecauseitinvolvessellingextraemissionallowancestofunditself.Throughouttheyear,EuropeanlawmakerswrestledwiththedetailsofEUETSreformaspartofthe“Fitfor55”processrevampingthebloc’sclimateandenergypoliciestomeettightergreenhousegasmitigationtargets–thiswasbullishforcarbonprices,andculminatedinalandmarkdealreachedinDecemberthatprescribingcuttingthenumberofallowancesavailableintheEUETS.Alleyeswillbeontheimplementationofthislegislationin2023,withamassiveone-offreductioninallowancesscheduledfor2024.Ontheflipside,salesofextraallowancestofinancetheREPowerEUplanwillinjectadditionalsupplyandthusweighonprices.GaspriceswillremainanimportantdriverforEUETSpricesin2023.IntheUKETS,allowancestradedatapremiumtotheirEUcounterpartsthroughout2022,withthespreadbetweenthetwoaveragingroughly€12.Volumeswereupfrom2021,astradingReviewofcarbonmarketsin20226February20234inthatyearhadnotbegununtilMay.Atabout€47billion,totalmarketvalueisproportionaltothatoftheEUETSgiventhetwomarkets’relativesizeintermsofcoveredemissions.NORTHAMERICANETSTheyear2022setyetanotherrecordformarketvalueinbothNorthAmericanemissiontradingsystems,eventhoughpermitpricesfluctuatedratherthanrisingsteadilyastheydidin2021anddespiteloweroverallvolumesthaninthatyear.Combined,thetwoprogrammessaw2.5billiontonneschangehandsandwereworthover€60billion.Besidesfundamentals,thepolicydriversthatinfluencedpricesovertheyearwererelatedtothestringencyoftheprogramsgoingforward.RegulatorsinCalifornia,themainmemberoftheWesternClimateInitiative,finalizedaplanforachievingthestate’snewmoreambitiousemissionreductiontarget–thisisbullishforWCIallowanceprices,asthecapswillhavetobemadetightertoalignwiththesteeperoverallemissiontrajectory.Apoliticalandlegalback-and-forthregardingparticipationofthestateofPennsylvaniaintheRegionalGreenhouseGasInitiativeinfluencedactivityinthatmarketover2022.Includingthislargestate’spowersectorincreasesthesizeofthesmallercarbontradingprogramamongnortheasternandMid-Atlanticstatesdramaticallyintermsofemissionscovered,suchthatwhetherPennsylvaniais“inorout”affectsthemarketgreatly.WhileitwasofficiallyamemberoftheETSin2022,thecourtchallengebroughtbyPennsylvanialawmakersanditscoalindustryrendereditscomplianceentitiesdefactounabletoparticipateinthemarket.Allowancepricesremainedrelativelyflataccordingly.Although2022markedthefinalyearoftheMexicannationalETS’s“pilotphase”inwhichparticipationisvoluntary,thegovernmenthasnotsetrequirementsnecessaryforafunctionalcompliancemarketin2023.Coveredentitieswillhavetosurrenderallowancestocovertheiremissionsfrom2023,butthecountry’senvironmentministryisnotexpectedtopublishfinalregulationsuntilJune.Sincethoseregulationscontaintheprogram’sannualallowancebudget,whichwoulddeterminetheratioofpermitstoexpectedemissions,themarketbalance(andhenceMexicancarbonprice)remainsuncertain.CHINATheyear2022markedthefirstfullyearthatChina’snationalETSwasoperational,astradingbeganinH22021.Withthepandemicandotherfactorstakingprecedenceovercarbonmarkets,theprogramcontinuedwithouttheChinesegovernmenthavingreleasedanewallocationplanorhavingrelauncheditsdomesticoffsetprogram.RegulatorspublisheddraftallocationplansinNovemberunderwhichemitters’carbonintensitybenchmarksaretighter–thissignalsthattheoverallstringencyoftheprogramwillincrease.Over2022,atotalof51millionChineseEmissionAllowances(CEAs)changedhands–thisrepresentsadecreasefrom2021.Prices,however,wentupcomparedto2021.TheweightedaveragepriceofaCEAovertheyear2022wasCNY55.30/t(~€8),nearly30percenthigherthantheweightedaveragein2021.ThoughtheChinesepilotETS–someofwhichhavebeenactivesince2013–continuetooperate,theysawasignificantdropinFigure1.1Emissionallowance(permit)pricesinkeymarkets2022(bymonth),(Localpricesconvertedtoeuros)Source:Refinitiv020406080100120EUR/tChinaETSEUETSUKETSNZETSSKETSWCIRGGIFigure1.2:Annualaveragepricepertonne(Localpricesconvertedtoeuros)Source:RefinitivReviewofcarbonmarketsin20226February20235volumesduring2022aspowersectoremittersturnincreasinglytothenationalETS.Justover25milliontonnestradedinallthepilotETScombinedin2022.ASIAPACIFICDespiteavolumedecreaseof26percentcomparedwith2021,pricesintheNewZealandETSreachedrecordhighsin2022.Itwasthefirstyearemittersdidnothaveafixedpriceoptionforcompliance.Policyuncertaintyaccountedforrelativelyhighpricevolatilityovertheyear:anationalclimatechangecommissionissueddetailedrecommendationsfortighteningelementsoftheETSmid-year,butthegovernmentended2022byannouncingitwouldnotadoptthoserecommendations.SpotNZUpricesroseandfellaccordingly,butremainedmuchhigheroverallthanin2021whichmadeforrecordmarketvaluein2022.TheKoreanETS,ontheotherhand,experiencedaseverepricedropin2022duetoapandemic-inducedeconomicdownturnthatdecreasedoverallKoreanemissionsinthepastthreeyears,leavingthemarketseverelyoverallocated.Thissurplusinthemarketalignedwithsoaringenergypricesandrisinginflationintheprogram’scurrent3rdphase(2021-2025),andtradedvolumewasalsodown.Only40millionKoreanallowances(KAUs)andoffsets(KOCs)changedhandsintheKETS–28percentlessthanin2021.ThetotalKoreanmarketvaluewas22percentlowerthanin2021,atKRW840billion(~€619million).Onlyoneoutofthetwelveallowanceauctionsheldin2022wasfullysubscribed.Overtheyearatotalof14millionKAUswerepurchasedatauctions,vs.11millionin2021.InSeptember2022,theTokyoStockExchange(TSE)startedademonstrationcarboncreditmarketsettorunthroughtheendofJanuary2023asapilot/preparatoryphaseforJapan’svoluntaryETSstartinginApril2023.TheinitiativeistheproductofthesocalledGXLeague(GXstandsfor“greentransformation”)spearheadedbytheJapanesegovernmentbutledbyprivatesectorentities.GiventhatthetradingofemissionunitsundertheGX-ETSconstitutesacarbonmarket,weincludeitforthefirsttimeinouryearinreviewbyprovidingvolumeandpricedataforthetransactionsin2022.Intheperiodfromthestartofthedemonstrationon22Septembertothelasttradingdayon28December2022,theTSEcarboncreditmarketsawtransactionsofcreditsrangingpricefrom€6/tonneto€106/tonne.Intotal,around45000tonneschangedhandsduringthisthree-monthperiod–marketparticipantspreferredtobuyunitsatauctionsthattookplaceinJanuaryandApril.NON-ETSCARBONTRADINGThemarketswhosevolumeandvalueweassessannuallyare“compliance”marketsinthattheyarecreatedbynationalorregionalgovernmentstohelpreachtherespectivejurisdiction’semissiontarget.Participationismandatoryforcoveredentities,andtherespective(government)regulatordefineswhoiscovered.Beyondthesegeographicallylimitedsystemsfortradingemissionallowances(permits)issuedbygovernments,globaltradinginemissionoffsetsisontherise.Offsetunitsrepresentemissionsavoidedorremovedbyspecificprojects-theideaisthatthe‘saved’amountofgreenhousegaswilloffsettheemissionsofcompaniesorindividualswhopayforthatsavingstohappenwhenitotherwisewouldnothave.This“offsetmarket”allowssuchentitiestocompensatefortheirownemissionsbyhelpingtofinancereductionselsewhere(inothersectorsand/orinothercountries).GenerallyreferredtoasthevoluntarycarbonmarketorVCM,thecollectiveamountoftransactionsofthistypehasbeenontheriseinrecentyears:moreandmorecompaniesaredeclaring“netzero”or“carbonneutral”goalsandpurchasingoffsetstomeetthose.However,theglobalgeopoliticalandeconomicinstabilityof2022thataffectedallenergy-relatedmarketsdidnotsparevoluntarycarbontrading:offsetpricesplummetedafterRussia’sinvasionofUkraineinQ1,asdidthenumberoftransactions.TheensuinghighfuelspricesandoverallmacroeconomicinstabilitysentVCMpricesdownwardthroughouttherestoftheyear,withvolumesremaininglowevenlongafteramassivesell-offofcreditsinFebruaryandMarch.However,thiswastruemainlyforexchange-tradedoffsetcontracts–pricesandtransactionsofoffsetstradedover-the-counterremainedmorestable,andOTCtransactionsmakeupthebulkoftheVCMBeyondtheVCM,theParisAgreementalsoforeseesnewformsofcarbontradingunderitsArticle6,whichsetsrulesfortransactingso-calledinternationallytradedmitigationoutcomes(ITMOs).PartiescancooperateonreachingtheirUNclimatetargetsatloweroverallnetcost:richcountriessendmoneyandresourcestopoorernations,wherethatamountofinvestmentachievesmoreemissionreductionthanitwouldathome.Theinvestornationmaytake“credit”forsomeofthosereductionsbycountingthemtowarditstargetachievementundertheParisAgreement,whiletheinvesteecountrybenefitsfromthefinancingofe.g.greentechnologies.TheannualUNclimatenegotiations(COP27inNovember2023)wereexpectedtosetfurtherdetailsonhowthiswillwork,inparticularonanewmechanismunderwhichcountriescouldundertakesuchtransactions.Negotiatorsdiscussedwhatunitscanbetransferred(fromwhichtypesofactivities)andhow(proceduresofauthorization,issuance,etc.),buttheCOPpunteddecisionsonmostofthesepointstofuturenegotiations.AbsentmoreprogressonthespecificsofArticle6,individualcountriesstruckbilateraldealsthatcanbeconsidered“transactions”ofITMOsover2022,takingelaborationoftheexistinggroundrulesintotheirownhands.SwitzerlandandGhanamadeatransferofauthorizedcreditsforwhichSwitzerland“bought”thereductionsfromGhana,andothersimilararrangementsmemorandaofunderstandingbetweenSingaporeandPeru,SingaporeandPapuaNewGuinea,SouthKoreaandMongolia–withSingaporeandKoreabeingthe“buyer”parties.NewZealandannounceditmayusebilateralagreementstosource100millioncreditsthrough2030tomeetitsnationaltargets,andtheChinesegovernmentannounceditisinterestedinbuyingmitigationunitsfromothercountriesforuseinitsnationalETS.Meanwhile,airlineswillberequiredtooffsetemissionsfrominternationalflightsundertheemissionreductionprogramoftheInternationalCivilAviationOrganisationknownasCORSIA-seeChapter8.Withthethresholdabovewhichoffsetsarerequiredhavingbeenchanged(dueto2020’spandemic-inducedcrashininternationalflying),demandforoffsetsunderthisprogramremainslowerthanexpectedwhenCORSIAwascreatedbackin2016.Wedonotforeseemuchoffsetdemandfromaircarriersinthenextyears.

1、当您付费下载文档后,您只拥有了使用权限,并不意味着购买了版权,文档只能用于自身使用,不得用于其他商业用途(如 [转卖]进行直接盈利或[编辑后售卖]进行间接盈利)。
2、本站所有内容均由合作方或网友上传,本站不对文档的完整性、权威性及其观点立场正确性做任何保证或承诺!文档内容仅供研究参考,付费前请自行鉴别。
3、如文档内容存在违规,或者侵犯商业秘密、侵犯著作权等,请点击“违规举报”。

碎片内容

碳中和
已认证
内容提供者

碳中和

确认删除?
回到顶部
微信客服
  • 管理员微信
QQ客服
  • QQ客服点击这里给我发消息
客服邮箱