美国能源转型净零路径(英文版)VIP专享VIP免费

Pathways to Net-Zero
for the US Energy Transition
Jackson Ewing, Martin Ross, Amy Pickle, Robert Stout, and Brian Murray
Nicholas Institute for Energy, Environment & Sustainability nicholasinstitute.duke.edu
Acknowledgments
We are grateful for participation and input from ADM; AVANGRID; Bank of America; bp; the Duke
Center for Energy, Development, and the Global Environment; Duke Energy; the Energy Transitions
Commission; FedEx; General Motors; Modern Energy; National Grid; Ørsted; RMI; Shell; Volvo Group;
and World Resources Institute.
Energy Pathways USA is convened by the Nicholas Institute for Energy, Environment & Sustainability
based at Duke University, in collaboration with the Energy Transitions Commission. This report
constitutes a collective view of Energy Pathways USA. Members of Energy Pathways USA endorse the
general thrust of the arguments made in this report but should not be taken as agreeing with every
nding or recommendation. The companies involved have not been asked to formally endorse the report.
Pathways to Net-Zero
for the US Energy Transition
A Report of Energy Pathways USA
Jackson Ewing, Martin Ross, Amy Pickle, Robert Stout, and Brian Murray
Nicholas Institute for Energy, Environment & Sustainability, Duke University | iii
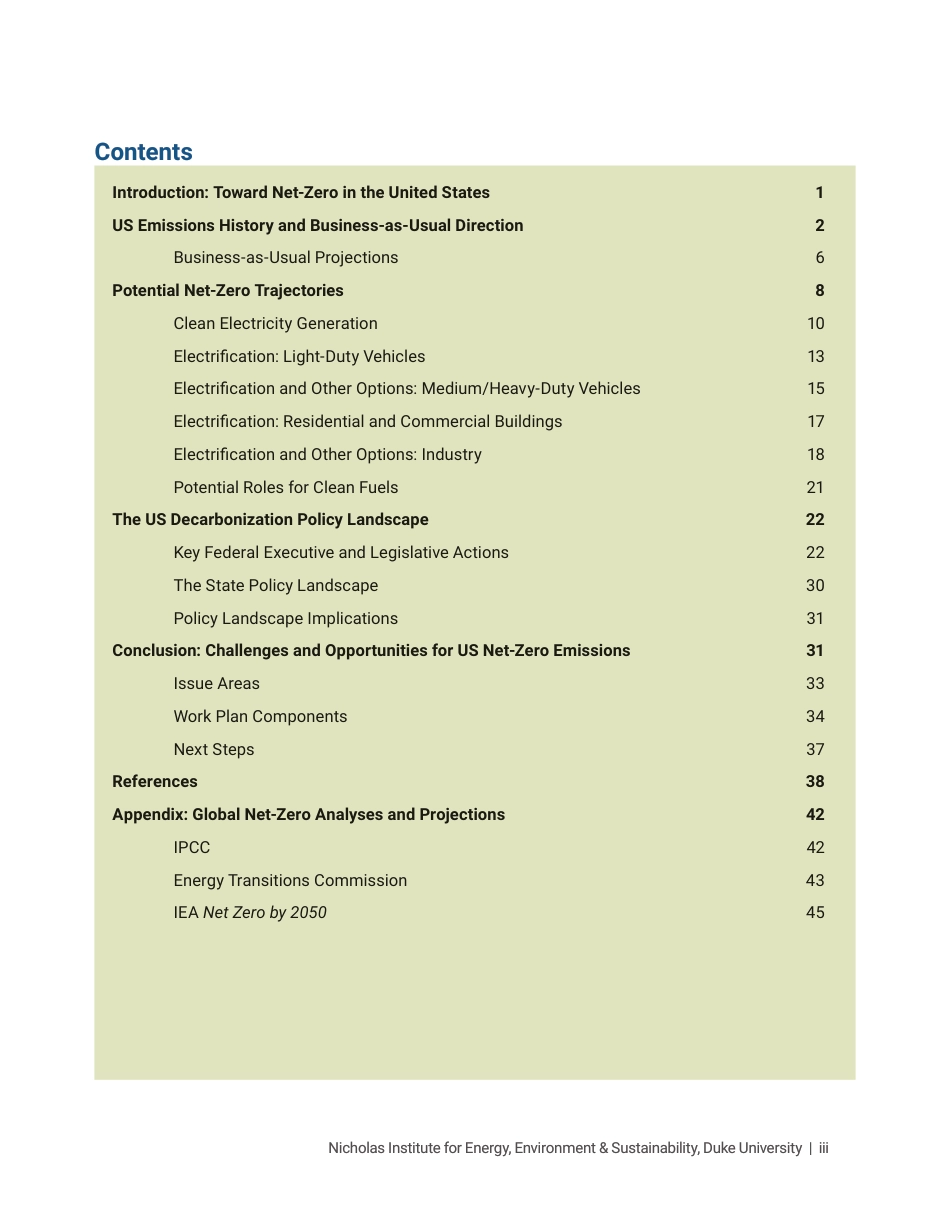
Introduction: Toward Net-Zero in the United States 1
US Emissions History and Business-as-Usual Direction 2
Business-as-Usual Projections 6
Potential Net-Zero Trajectories 8
Clean Electricity Generation 10
 Electrication:Light-DutyVehicles 13
 ElectricationandOtherOptions:Medium/Heavy-DutyVehicles 15
 Electrication:ResidentialandCommercialBuildings 17
 ElectricationandOtherOptions:Industry 18
Potential Roles for Clean Fuels 21
The US Decarbonization Policy Landscape 22
 KeyFederalExecutiveandLegislativeActions 22
 TheStatePolicyLandscape 30
 PolicyLandscapeImplications 31
Conclusion: Challenges and Opportunities for US Net-Zero Emissions 31
 IssueAreas 33
 WorkPlanComponents 34
 NextSteps 37
References 38
Appendix: Global Net-Zero Analyses and Projections 42
 IPCC 42
 EnergyTransitionsCommission 43
IEA Net Zero by 2050 45
Contents
PathwaystoNet-ZerofortheUSEnergyTransitionJacksonEwing,MartinRoss,AmyPickle,RobertStout,andBrianMurrayNicholasInstituteforEnergy,Environment&Sustainabilitynicholasinstitute.duke.eduAcknowledgmentsWearegratefulforparticipationandinputfromADM;AVANGRID;BankofAmerica;bp;theDukeCenterforEnergy,Development,andtheGlobalEnvironment;DukeEnergy;theEnergyTransitionsCommission;FedEx;GeneralMotors;ModernEnergy;NationalGrid;Ørsted;RMI;Shell;VolvoGroup;andWorldResourcesInstitute.EnergyPathwaysUSAisconvenedbytheNicholasInstituteforEnergy,Environment&SustainabilitybasedatDukeUniversity,incollaborationwiththeEnergyTransitionsCommission.ThisreportconstitutesacollectiveviewofEnergyPathwaysUSA.MembersofEnergyPathwaysUSAendorsethegeneralthrustoftheargumentsmadeinthisreportbutshouldnotbetakenasagreeingwitheveryfindingorrecommendation.Thecompaniesinvolvedhavenotbeenaskedtoformallyendorsethereport.PathwaystoNet-ZerofortheUSEnergyTransitionAReportofEnergyPathwaysUSAJacksonEwing,MartinRoss,AmyPickle,RobertStout,andBrianMurrayNicholasInstituteforEnergy,Environment&Sustainability,DukeUniversityiiiIntroduction:TowardNet-ZerointheUnitedStates1USEmissionsHistoryandBusiness-as-UsualDirection2Business-as-UsualProjections6PotentialNet-ZeroTrajectories8CleanElectricityGeneration10Electrification:Light-DutyVehicles13ElectrificationandOtherOptions:Medium/Heavy-DutyVehicles15Electrification:ResidentialandCommercialBuildings17ElectrificationandOtherOptions:Industry18PotentialRolesforCleanFuels21TheUSDecarbonizationPolicyLandscape22KeyFederalExecutiveandLegislativeActions22TheStatePolicyLandscape30PolicyLandscapeImplications31Conclusion:ChallengesandOpportunitiesforUSNet-ZeroEmissions31IssueAreas33WorkPlanComponents34NextSteps37References38Appendix:GlobalNet-ZeroAnalysesandProjections42IPCC42EnergyTransitionsCommission43IEANetZeroby205045ContentsNicholasInstituteforEnergy,Environment&Sustainability,DukeUniversity1INTRODUCTION:TOWARDNET-ZEROINTHEUNITEDSTATESVariouspublicandprivatesectorinitiativesaimfortheUnitedStates(US)totransitiontoaneconomy-widenet-zerogreenhousegas(GHG)emissionfootprintby2050.Thenear-andlong-termpathwaystowardthisgoalareuncertainanddefystrictpredictability.Theoutcomeisfarfromguaranteed,andthestakesarehigh.Withsomethree-quartersofGHGemissionsstemmingfromfossilfuelcombustion,theUSmustrapidlyscalecleanelectricityproductionwhileconcurrentlyelectrifyinghighenergy–usesectorsanddevelopingnewtechnologiesforemissionsourcesthataredifficulttoelectrify.Atthisjuncture,thenecessarytimelineforclimateactionsuggestsasteady,incrementalisticapproachwillbeinsufficienttomeettheneed.Circumstancesrequiretheurgentcombinationofpublicpolicyimplementation,technologicalprogress,andchangestooperationalnormsandbehaviorsbybothpublicandprivatesectoractors.Therearereasonsforoptimism.Whilebusiness-as-usualtrendlinesfortheUSfallfarshortofnet-zerogoals,recentlegislationwithclimateimplicationsappearspoisedtoaccelerateAmerica’senergytransitionpace.TheBipartisanInfrastructureLaw(BIL)(2021)andtheInflationReductionAct(IRA)(2022)bothuseincentivesandthepublicpurse,combinedwithselectiveregulation,tocreateopportunitiesfordecarbonizingtheUSeconomyinwaysandatspeedsthatwouldhaveseemedunlikelyintherecentpast.However,whiletheseeffortstakeonlandmarksizeinthehistoryofUSclimateefforts,theirscaleshouldbekeptincontext.Together,thetwolawsenableroughly$1trillioninpublicinvestmentoverthenext10years,notallofwhichgoestowardtheenergytransition.Comparethistoprojectionsthatthecumulativegrossdomesticproduct(GDP)oftheUSwillbemorethan$300trillionoverthesameperiod,establishingthisasaninvestmentofsomeone-thirdofonepercentofGDP(CBO2022,7).Putanotherway,whiletheIRAsteersthelargestvolumeofpublicresources—includingroughly$369billioninfinancialprovisions—towardaddressingclimatechangeinthehistoryoffederalpolicy,thisfigurepalesincomparisontothe$1.9trillionspentontheAmericanRescuePlaninasingleyear.Morewillberequiredfrombothpublicandprivatesectorsformidcenturynet-zerogoalstobecomereality.NewUSlegislationmustthereforegalvanizemomentumforscalingupthedeploymentofestablishedtechnologiesandsystemsandacceleratethedevelopmentandmarketabilityofthosethataremorenascent.Subsidies,mandates,andregulatoryconstraintshaveahistoryofcatalyzingdemandshifts,innovation,pricereductions,andneweconomiesofscale—attimesthroughvirtuouscyclesthatdrivethedevelopmentofnewsectors(Ip2022).Rapiddeclinesinthecostofphotovoltaicmodulemanufacturing,whichfellsome96%between1980and2012,offerahistoricalmarker.Roughly30%ofthisdeclinehasbeenattributedtopublicandprivateresearchanddevelopment,withanother60%comingfrom“learning-by-doing”improvementsinmanufacturingprocesses(Kavlak,McNerney,andTrancik2018).Thesepricedeclines,alongwiththoseforwind,areslowingdown,buttheprocessesthatdrovethemofferawindowintothepotentialoftheBILandespeciallytheIRA.Ifimplementedeffectively,thesepoliciescanlowerthecosts,hastentheuptake,andstrengthentheperformanceofalreadycompetitivesolar,wind,andbatterysectors,whilesettingthestageforrapidpricecompetitivenessandwiderreadinessimprovementsinnext-generationtechnologiesandinfrastructureneededtodecarbonizethewiderUSeconomy.ThisreportbyEnergyPathwaysUSAisabriefexaminationofthecurrenttrendlines,challenges,andopportunitiesformeetingtheUSnet-zeroobjective.EnergyPathwaysUSAisanautonomousregionalinitiativeoftheglobalEnergyTransitionsCommission,andworkswithleadingprivate2PathwaystoNet-ZerofortheUSEnergyTransitionsectorcompanies,publicbodies,nongovernmentalorganizations,andthoughtleaderstoadvancetheUSnet-zeroagenda.Thereportencompassesthreemainsectionsthat(1)highlightcriticalobservationsaboutpastandpresentUSemissionstrends,(2)discussleadinganalysesofpotentialUSemissionstrajectoriesoutto2050,and(3)framethedomesticandfederalpolicylandscapefornet-zeroefforts.ThereportconcludesbypresentingaselectionofkeychallengesandopportunitiestotheUSnet-zeroprojectthatrequirefurtherattention.Theseincludetheneedtoadvancetargetedmodelingforcleanelectricityandwide-rangingelectrification,whichtogetherrepresentthefoundationforUSnet-zerooutcomes;necessaryprogressonprojectsiting,licensing,andmaterialsextractiontodevelopnewenergyassets;theneedtoeffectivelydeployIRAloanfinanceandguaranteestobolsterequitableinvestments;thenecessityofadvancingstateandregionalcoordination,particularlyforgridsystems;andthecurrentandpotentialimpactsofcleanenergystandardsandcarbonpricingforUSnet-zeroprospects.ThereportseekstostrengthentheevidencebaseonwhatwillberequiredforarobustUSenergytransition,andtoelucidatekeybarriersandpathwaystowardnet-zerogoals.ItalsoservesasthefoundationforfutureworkbyEnergyPathwaysUSA,whichwillprovidein-depthandongoinganalysisacrossthesetopics.USEMISSIONSHISTORYANDBUSINESS-AS-USUALDIRECTIONTheUnitedStatesistheworld’slargesteconomyandhasbeentheworld’stopenergyconsumerformuchofthepost-industrialera,beingsurpassedbyChinaonlyinthelast15years.TheUSislikewisethesinglelargestnationalcontributortocumulativeglobalGHGemissions,evenbeforeaccountingforemissionsembodiedinimportedgoodsandservices.Asof2020,thisrelativecontributionrepresented25%ofallglobalCO2emissionsemittedsincethebeginningoftheindustrialrevolution(Ritchie2019).Inpercapitaterms,USenergyuseiscomparativelyhigh,buthasdeclinedby1.8%peryearsince2000.TheUSpopulationhasgrownwhiletotalenergyconsumptionhasbeenremainedrelativelystable.TheBidenadministrationisproactivelypursuingaUSenergytransition.UsinginternationalParisAgreementpledgesasastartingpoint,theBidenadministrationhasupdatedtheUSnationallydeterminedcontributions(NDCs)totheagreementwithaGHGemissionstargetof50%to52%below2005levelsby2030andeconomy-widenet-zeroemissions“nolaterthan2050”(TheWhiteHouse2021a).ThisisasubstantialincreaseinUSambition,movingfrom2015NDCtargetsof26%to28%reductionsbelow2005’slevelsby2025and80%below2005levelsby2050.Business-as-usual(BAU)scenarios,unsurprisingly,donotplacetheUSontracktomeettheseParisAgreementclimatecommitments,orformeetingtheBidenadministration’smidcenturynet-zeroambitions(Figure1).Figure2showshistoricaltrendsinoverallGHGemissionsintheUnitedStatessince1990.ThesixlargestcategoriesofCO2emissionsarethosefromfossilfuelcombustion,whichcomprised74.4%ofallUSGHGemissionsasof2019.Thelargest—andgrowing—shareisfromtransportation,at27.3%ofallemissions.Priorto2010,theelectricpowersectorwasthelargestsourcewithone-thirdofallemissions;however,coalplantretirementsandacontinuingshifttonaturalgasandrenewablegenerationreduceditsshareto24.1%by2019.Thesesourcesarefollowedbyindustrial(12.4%)andresidentialsectors(5.1%),respectively.NicholasInstituteforEnergy,Environment&Sustainability,DukeUniversity3Figure1.USnetGHGemissions(1990–2019)andfutureemissionstargetsSource:AdaptedfromEPA(2022).Figure2.HistoricalUSGHGemissionsbygasandsourceSource:EPA(2022).Abbreviation:LULUCF=landuse,land-usechange,andforestryERR能研微讯微信公众号:Energy-report欢迎申请加入ERR能研微讯开发的能源研究微信群,请提供单位姓名(或学校姓名),申请添加智库掌门人(下面二维码)微信,智库掌门人会进行进群审核,已在能源研究群的人员请勿申请;群组禁止不通过智库掌门人拉人进群。ERR能研微讯聚焦世界能源行业热点资讯,发布最新能源研究报告,提供能源行业咨询。本订阅号原创内容包含能源行业最新动态、趋势、深度调查、科技发现等内容,同时为读者带来国内外高端能源报告主要内容的提炼、摘要、翻译、编辑和综述,内容版权遵循CreativeCommons协议。知识星球提供能源行业最新资讯、政策、前沿分析、报告(日均更新15条+,十年plus能源行业分析师主理)提供能源投资研究报告(日均更新8~12篇,覆盖数十家券商研究所)二维码矩阵资报告号:ERR能研微讯订阅号二维码(左)丨行业咨询、情报、专家合作:ERR能研君(右)视频、图表号、研究成果:能研智库订阅号二维码(左)丨ERR能研微讯头条号、西瓜视频(右)能研智库视频号(左)丨能研智库抖音号(右)4PathwaystoNet-ZerofortheUSEnergyTransitionCarbondioxideemissionsfromindustrialsources—unrelatedtotheburningoffossilfuels—accountedfor6.0%ofallUSGHGin2019,withmostoftheseemissionscomingfromcementmanufacturing,energyproduction,andtheironandsteelindustries.Methaneemissionsin2019werearound10%ofallemissions,roughly4%ofwhichcamefromagriculture(mainlyentericfermentationandmanure),4%fromenergyproduction(naturalgassystemsandcoalmining),and2%fromwastes(wastewatertreatmentandburning).Nitrousoxidewas6.9%ofthetotalin2019,largelyfromagriculture,andfluorinatedgaseswere2.8%,largelyfromthesubstitutionofchemicalsawayfromozone-depletingsubstances.Figure3complementsthesedatabyassigningfossilfuelCO2emissionstosectorsbyfueltypefortheyear2021.Inthisassignment,emissionsassociatedwithelectricitygenerationaresharedoutacrossconsumersoftheelectricity;hencetheright-handcolumnfortheelectricitysectorreplicatestheemissionsthathavealreadybeenincludedinyellowacrosstheothersectors.Byfuel,45%ofCO2emissionsareassociatedwithconsumptionofpetroleum,mainlyinthetransportationsector.Naturalgasusecauses34%ofCO2emissionsandissplitacrosstheindustrial,residential,andcommercialsectors,whereindustrialuseisthelargestcomponentofthetotal.Mostcoalisusedforelectricitygeneration,asidefromasmallamountintheindustrialsector.Emissionsassociatedwithelectricityconsumptionarethelargestshareoftotalresidentialandcommercialemissionsandrepresentanimportantcomponentofindustrialemissions.Figure3.USenergy-relatedCO2emissionsbysectorandfossilfuelin2021Source:EIA(2022).NicholasInstituteforEnergy,Environment&Sustainability,DukeUniversity5Thesetrendsinenergyconsumption,energyproduction,andbroadercharacteristicsincommerce,housing,andtransportationvarywidelyacrosstheUS.Figure4ranksUSstatesbyenergyconsumptionpercapitaacrossthecombinationofresidential,commercial,andtransportsectors.Ingeneralterms,stateswiththesmallestpopulationshavethehighestpercapitaenergyuse.Thiscouldbeattributabletohighertransportneedsbecauseofmoredispersedpopulations,ahypothesisworthexamininginassessingtheimpactsofnationalversusregionalorlocalpolicyinterventions.Thesestatesareclusteredbroadlyinthemiddleofthecountry,withpercapitaenergyconsumptiondecliningastherankingmovestowardtheEastandWestCoasts.Residentialandcommercialusealsoroughlyfollowsweatherpatternsmeasuredbyheatingdegreedays,withcolderstatesusingmoreenergyforheatingpurposes.Incomedistributions(notshown)alsofollowasimilar—thoughinverse—rankingacrossstates,wherepoorerstatesaremoreconcentratedinthecenterofthenation,usemoreenergypercapita,andthuscouldfacehigherburdensifemissionsreductionscauseenergypricestorise.Figure4alsosuperimposesindustrialenergyusepercapita(blackdiamonds)ontherankingofstates’energyconsumptionintheresidential,commercial,andtransportationsectors.Oneofthelargestfactorsinfluencingthesedataistheinclusionofenergyusedintheenergyproductionprocess,whichiscategorizedasindustrial.Thisexplains,forexample,whyLouisiana,withitspetroleumrefineries,hasindustrialenergyusethatis6.5timesthenationalaverage(italsohasarelativelysmallpopulationwhenmeasuringinpercapitaterms).Texasalsohasmuchofthenation’srefiningindustryand,partlyinconsequence,hasenergyusethatismorethan2.5timesFigure4.RankingUSstatesbyenergyconsumptionpercapitaSource:EIA(2022).6PathwaystoNet-ZerofortheUSEnergyTransitiontheUSaverage,butthatislowerthanLouisiana’sbecauseitspopulationishigher.Moregenerally,industrialusestillfollowstheroughdistributionofenergyuseinothersectors,wherecentralstateshavemuchhigherenergyuseperpersonthanthoseonthecoasts.FortheEastandWestCoasts,thegreateremphasisonserviceindustries(reflectedinthecommercialsector)andamanufacturingbaseless-focusedonheavyorenergy-intensiveindustriesseesthemtowardthebottomoftheranking.Business-as-UsualProjectionsSettingasideUSemissions’geographicdistributionwithinthecountry,understandingnet-zeropathwaysforthenationasawholebeginswithexaminingwhichsectorsoftheeconomywillproducemostofthefutureemissionsintheabsenceofnewclimatepolicies.WhilerecentlegislationdetailedinthePolicyLandscapesectionofthisreportwillimpactthesepathways,theyprovideavitalbaselineforlevel-settingfutureanalysisandaction.Figure5breakstheUSEnergyInformationAdministration’s(EIA)AnnualEnergyOutlook2022(AEO)Referencecaseemissionforecast(EIA2022)—whichrepresentstheabsenceofnewpoliciesorBAU—intoseveralbroadcategories.Currently,electricitygenerationcausesaround30%ofUSCO2emissionsrelatedtoenergyconsumption.By2050,underBAUpathways,electricitygeneration’sshareofemissionsisexpectedtofallsomewhatto23%,butthisforecastdoesnotsuggestacontinuationofrecenthistoricalFigure5.CO2emissionsbysector(AEOReferencecase)Source:CalculationsbasedonEIA(2022).NicholasInstituteforEnergy,Environment&Sustainability,DukeUniversity7trendsthatledtosubstantialreductionsincoal-firedemissions.Light-dutyvehicles(LDVs)areresponsibleforaround21%oftotalforecastedemissions,asharethatremainsconsistentthrough2050.Overall,theAEOisconservativeinitsforecastsofelectric-vehicleadoption(givenitsreliancesolelyoncurrentpolicies),andconsequentlyroughly44%ofallexpectedCO2emissionsin2050comefromjusttwosources—electricitygenerationandLDVs.Thesesectorshaveincommonthefactthattherearetechnologyoptionsinusetodaythatcouldsubstantiallyreduceoreliminatetheseemissions,andthatfuturepoliciescouldbeenactedtoamplifytheadoptionofthosetechnologiesinwaysnotcapturedbyBAU.Theremainingemissionsfromthetransportationsector—freighttrucksat8.5%oftotalemissionsin2050,aviationat6.3%,andallothersourcesat5.2%—areamongthelargestremainingsourcecategoriesacrosstheeconomyinthe2050referencecasebaseline.However,thesemodesoftransporthavefewerand/orpotentiallymorecostlyemissions-reductionopportunitiesthandoLDVs.Intheresidentialandcommercialsectors,one-halfoftheenergyneedsarealreadyexpectedtobesuppliedbyelectricity;whichpresumablycouldbedecarbonizedusingtechnologiesavailabletoday.Theremainingenergyconsumptioninthesetwosectors—mainlynaturalgas—eachcontributes5%to6%oftotalemissions.Spaceheatingrepresentsthelargestshareofresidentialenergydemandandisalsoanimportantpartofoverallcommercialenergyconsumption.Thebroadlydefinedindustrialsectoremitsaround20%ofUSenergy-relatedCO2emissionscurrently,asharethatisexpectedtoincreasetoward25%by2050intheBAUscenario.Reductionopportunitiesinthecementandironandsteelindustrieseitherhavebeenorarebeingdeveloped.However,anysubstantialloweringofindustrialemissionswilldependonadditionaltechnologydevelopmentinareassuchasthebulkchemicalsindustry,whichisexpectedtorepresent6.6%ofallUSenergy-relatedCO2emissionsin2050.Emissions-reductiontechnologiesinthisarea—andintheinclusive“other”category—mayvarysubstantiallyacrossspecificproductsandindustries,potentiallymakingemissionsreductionsforthesesourcesdifficult,andposemoretechnologicalchallengesthanfordecarbonizingmostothersectors.Replacingfeedstockwithnonfossilalternativesischallenginginmanyinstances,particularlysteelandcementproduction,givenhighheatrequirements,establishedproductionsystems,andtheuntestednatureofmanyalternativefeedstocksforcommercialapplication(Cleary2022).Electrifiedindustrialprocessesarelikewiseoftenmoreexpensivethantraditionalfossilenergysystems.IntheAEOReferencecase(again,withoutclimatepoliciesfrom2022onwardandwithouttheimpactsofrecentlegislation),forecastsofelectricitygenerationbytypeofunitinFigure6showsomedeclineincoalgenerationinthenearterm,butsubstantialcoalcapacitystillremainsin2050.Naturalgasexpandssomewhat,withthelargestchangeingas-combustionturbinecapacitythatcanbeusedtoprovidereliabilityservicesasrenewablesincreaseproductionovertime.Onshorewinddoesnotseesustainedexpansionthroughouttheforecasthorizon,althoughsomeoffshorewindentersthesystem(partiallyinresponsetomandatessuchasthoseinVirginia’sCleanEconomyAct[2020]andrecentfederalleasingofupto30GWofpotentialoffshorewindontheEastCoast).Thebiggestpersistentchangeinthecentralreferenceforecastisinsolarphotovoltaics,whichbuildontheirrecentgrowthasinstallationcostscontinuetodecline.Somebatterystoragebecomescost-competitiveintheforecast—andsomeismandated—butmostreliabilityneedsinthereferencecasearemetbypeakinggasturbines.Figure7ranksindustries’energyconsumptionbasedonenergyuseasof2020,focusingonthe“industrial-other”categorypluscementandironandsteel.8PathwaystoNet-ZerofortheUSEnergyTransitionTheconstructionindustryfacesthelargestexpansioninabsoluteenergyterms,concentratedinpetroleumuse—largelybyheavyvehicles—suggestingsomepotentialdifficultieswithachievingfutureemissionsreductions.Foodandagricultureenergyusealsoincreasessignificantly,evenignoringGHGemissionsfromthesectorbeyondthosefromenergyconsumption.Othermanufacturingsectorslikewiseexpand,largelyonthebackofnaturalgas.HistoricalenergyandemissionscharacteristicsandBAUtrendsprovideanecessarywindowintotheUSdecarbonizationchallenge.BAUisclearlyinadequateformeetingUSnet-zerogoals.Rather,multiplepathwaysexistbywhichtheUSeconomymightevolveawayfrompastenergysystems,eachofwhichstronglyleveragecleanelectricityproduction,transmission,andflexibleavailabilityasthefuturebackboneofpoweruseandthelow-carbonelectrificationofhigh-emittingsectors.Thefollowingsectionsummarizessomeoftheleadinganalysesofsuchpathwaysandhelpsclarifytheneedforfurtherstrategiestoreachnet-zerointheUS.POTENTIALNET-ZEROTRAJECTORIES—EVIDENCEFROMRECENTSTUDIESSeveralhigh-profile,quantitativelyfocusedanalyseshaveexploredthestepsthatneedtobetakentoreachnet-zeroGHGemissionsintheUnitedStatesby2050.Comparingtheseanalyseshighlightsbroadareasofconsensusandalternativeviewsandelevateskeyconsiderationsfordevelopinginterimstepstoward2050goals,technologyneeds,policyobjectives,andpossiblesequencingandprioritization.Thissection—alongwithAppendixA—drawsfromthefollowingreports:theIntergovernmentalPanelonClimateChange’s(IPCC’s)SixthAssessmentReportClimateChange2022:MitigationofClimateChange(IPCC2022),theEnergyTransitionsCommission’sMakingMissionPossible:DeliveringaNet-ZeroEconomy(ETC2020),theInternationalEnergyAgency’sFigure6.Electricitygenerationandcapacitybytype(AEOReferencecase)Source:EIA(2022).NicholasInstituteforEnergy,Environment&Sustainability,DukeUniversity9(IEA’s)NetZeroby2050:ARoadmapfortheGlobalEnergySector(IEA2021),thePrincetonRapidEnergyPolicyEvaluationandAnalysisToolkit(REPEAT)project’sNet-ZeroAmerica:PotentialPathways,Infrastructure,andImpacts(Larsonetal.2021),andtheNationalAcademyofSciences’(NAS’)AcceleratingDecarbonizationoftheU.S.EnergySystem(NAS2021).Onbalance,thesestudiesreachconsistentconclusionsaboutpossiblepathwaystonet-zeroemissions.Foundationally,reachingnet-zeroemissionsby2050istechnicallyfeasiblesincethetypesoftechnologiesneededtodecarbonizeemissions-intensivesectorsareeitherknownorindevelopment.Whilethedeploymenttrajectoriesofthesetechnologiescontainmanyuncertainties,costestimatesaregenerallyrelativelysmallasapercentageoffutureGDPandincomparisontospendingthatwouldhaveoccurredonenergyintheabsenceofnet-zero–orientedclimatepolicies(currentpoliciesarediscussedinthefollowingmainsection).Technologyandinfrastructure,however,mustbedeployedatunprecedentedratesinmostsectorsby2030tomeet2050goals.BecausetheUSmustrapidlyscaleupemission-reducingtechnologyimplementationintheverynearterm,thestudiesgenerallyidentifywindandsolarelectricitygenerationandtheelectrificationofvehiclesascoreearlydriversofemissionreductions.Electrificationbyhouseholdsandbusinesses(spaceheatingandcooling,waterheating,etc.)mustalsoaccelerate,whiledeployingorpreparingtodeployadvanced—lessestablished—technologyopportunitieswillbeessentialtoreduceemissionsfromsourcesthataremoredifficulttoabate,suchascertainindustrialprocessesandsomeformsoftransportation(e.g.,aviation).Assuch,Figure7.Industrialenergyconsumptionbysectorandfuel(AEOReferencecase)Source:EIA(2022).10PathwaystoNet-ZerofortheUSEnergyTransitionresearchanddevelopment(R&D)isneededtoquicklyscalesolutionssuchasadvancedbatteries,hydrogenelectrolyzers,anddirectaircapture(DAC),amongothers.Collectively,thesestudiessuggestcriticalstepsforeachofthefollowingmaincomponentsoftheenergytransition:cleanelectricitygeneration,electrificationofenduses,andindustrialprocessdecarbonization.Forcleanelectricitygeneration,windandsolarproductionrepresenttheearliestandlargestsourcesofreductionsinmostrecentstudies.ThePrincetonstudy—infouroutoftheirfivemainscenarios—quadrupleswindandsolarto600GWby2030,capableofsupplyingone-halfofUSelectricity.ExistingcoalplantsintheUS(alongwithotheradvancedeconomiesinglobalscenarios)wouldneedtoceaseoperationby2030or2035(IPCC2022;IEA2021;Larsonetal.2021).Asnewgenerationcomesonline,high-voltagetransmissionwillexpandby60%by2030(Larsonetal.2021).Thegridwillalsoneedtoaccommodatemoreinformation,bemoreresilient,andmaintainreliability,allofwhichwillrequiresignificantgridmodernization.Overall,net-zeroemissionsfromelectricitycomesshortlyafter2030fortheUSandby2035inadvancedeconomies(IEA2021).Alongsidecleaningthegrid,transportationandbuildingsmustelectrifytoreplacefossilfuelsnowbeingusedforthesepurposes.Thenet-zeroanalysesidentifyelectricvehicles(EVs)asanearlysourceofemissionsreduction.InthePrincetonreport,morethan50millionlight-dutyEVsareontheroadintheUS,withmorethan3millionpublicchargersby2030.Buildingsareelectrified,primarilythroughshiftingresidentialheatingandairconditioningfromnaturalgasandoiltoheatpumpspoweredbyelectricity.Forexample,thePrincetonreportdoublestheshareofheatpumpsinresidentialhomesby2030.Hydrogenasafuelsourceplaysanimportantrolebetween2030and2050,bothinprovidingflexibilitytotheelectricgridandinreducingindustrialemissions.Thestudiesdifferonwhethertheaviationsectorcanreduceaviationfuelandswitchtolow-emissionalternatives.Finally,allstudiesanticipatethatadditionalcarbonmanagementwillberequiredtomeetthenet-zerogoal.Carboncapture,utilization,andstorage(CCUS)—bothaspartofthepowergenerationmixandindustrialprocesses—isanessentialcomponentoftheenergytransitionandwouldthusinfluencethefutureroleoffossilfuelsintheenergymix.However,thestudiesdisagreeontheroleofbiomassasacomponentoffutureenergysupplies.Eachofthesetopicsisexploredinmoredetailthroughouttheremainderofthissection.CleanElectricityGenerationThetypesofmodelsusedinthesequantitativeanalysesestimatehowtheelectricitysectorwillrespondtofuturemarketconditions(e.g.,naturalgasprices)andclimatepolicies.Theseresponseestimatesarelargelycontrolledbytheirforecastsoftechnologyoptionsandtheircapitalandoperatingcosts,whichmustbetemperedbythechangestothesecoststhatwillaccompanyshiftsinthenet-zeropolicylandscapediscussedsubsequentlyinthisreport.Figure8illustratestheassumptionsonovernight(upfrontcapital)coststhatunderlietheAEOReferencecaseresults,intheabsenceofacomprehensivenet-zeropolicy.Forclimateanalysis,emphasisisusuallyplacedonsolarphotovoltaiccostsand,toalesserextent,onshoreandoffshorewindtrends.However,potentialissuessuchastransmissionavailabilityandsystemreliabilitymayalsoplaceimportanceontechnologiessuchasadvancednuclearreactorsorcarboncaptureonfossilunits.Thereareimportantdifferencesamongtheseprojectionsonelectricitygenerationandcapacity(Figures9and10)thatshedlightonpathwayalternatives.TheAEO2022referencecaseassumesmoresolaruse,andthePrincetonreportprojectsmoreongascombinedcycleandonshorewind.NicholasInstituteforEnergy,Environment&Sustainability,DukeUniversity11InthePrincetonhighelectrificationpathwaytonet-zero,unabatedfossilgenerationismostlygoneby2050(coalisgoneby2030),assolarandwindgenerationdominatethemix.ThePrincetonstudyassumesthatgasplantscancofirewithupto60%hydrogen,buttheanalysisisunclearabouthowmuchoftheremaininggasgenerationiscofiredinthisfashioninthisscenario.Analysestypicallyforecastthatsignificantincreasesintransmissioncapacitywillbenecessarytosupportthedramaticexpansionsofrenewablegenerationseekingtointerconnecttothetransmissionsystemoverthenextseveraldecades.Thelocationofthesewindandsolarresources,alongwiththeoverallincreaseinelectricitydemandfromelectrification,leadthePrincetonanalysistoestimatethathigh-voltagelinecapacitywillneedtoexpandbymorethan200%frompresent-daylevels(Figure11).ReformsattheFederalEnergyRegulatoryCommissionandinbothRegionalTransmissionOrganizations(RTOs)andIndependentSystemOperators(ISOs)areneededtofacilitatethesitingandcostallocationofnewregionalorinterregionaltransmission.Currentregulatoryframeworkswillmakeitchallengingtoconstructsufficienttransmissionintimetomeetnationalandsubnationaldecarbonizationgoals.Ifsuchconstructionprovesinfeasiblefortechnical,siting,orpoliticalreasons,thesystemwillhavetoadjustindifferentwaystoprovidecleanelectricitywhilesimultaneouslymeetinggrowingdemand.Theimplicationsofassumptionsaboutthereliabilityofpowersystemsareamongthemostcrucialareasthatneedtobeaddressedinanynet-zeromodelingthatmovesthesystemtowardsubstantialsharesofvariablerenewablegeneration.ThePrincetonmodelingusesnonoperatingfossilunitstoFigure8.AEO2022ReferencecasetrendsincapacitycostsSource:EIA(2022).12PathwaystoNet-ZerofortheUSEnergyTransitionensurethatthesystemhasenoughavailablequick-startcapacitytomeetsuddenspikesindemandorunexpectedoutagesofunits.IEAglobalestimateslikewisealsoseealargeroleindevelopedcountriesforhydroelectricityandnuclearunitstosupplyrelativelylargecapacities.Hydrogenbackuphasanimportantrole,withmorelimitedrelianceonnaturalgastoremainavailableinthelongtermtoensurethegridfunctionsproperly.CleanelectricityisanecessaryfoundationofbroaderdecarbonizationoftheUSeconomy.Cleanelectricityinnovationandinfrastructuredevelopmentandintegrationareparamounttoprospectsforcleaningindustry,buildingandhouseholdenergyusage,and—mostpressingly—transportation.Figure10.USelectricitycapacity—ComparativeprojectionsSource:AdaptedfromLarsonetal.(2021)andEIA(2022).Figure9.USelectricitygeneration—ComparativeprojectionsSource:AdaptedfromLarsonetal.(2021)andEIA(2022).NicholasInstituteforEnergy,Environment&Sustainability,DukeUniversity13Theneedsofthesesectorswillincreasetheliftrequiredofcleanelectricityfarbeyondthereplacementoffossilfuelsforenergygeneration,andcreatechallengesandopportunitiesforcreatingmoremodern,intertwinedenergysystemsfromproductiontofinaluse.Thefollowingsectionsintroduceelectrificationtrendsandprojectionsacrossmultiplesectors,representinganextstepthatmustoccurintandemwithcleanelectricitydevelopmentsfornet-zerotargetstobereached.Electrification:Light-DutyVehiclesAsseenacrosstherangeofnet-zeropolicyanalyses,convertingthefleetofLDVstoEVsisacriticalstepforloweringeconomy-wideemissions.Figure12comparesEVsalesmarketsharescenariosacrossmultiplestudies:theAEOReferencecaseforecastforEVsales(withoutnewclimatepolicies)asapercentageofthetotalLDVmarket,totheforecastsfromtheNationalRenewableEnergyLaboratory’s(NREL’s)ElectrificationFuturesStudy(“medium”and“high”electrificationtrends)(ZhouandMai2021),andanalysisfromthePrincetonnet-zerostudy.AEOestimatesofEVadoptionarehistoricallyontheconservativesideofforecasts,andwouldappearparticularlysowhencomparedtotheexpectationsofvehiclemanufacturers.ThepreviousNRELforecastsintheirelectrificationstudy(ZhouandMai2021)appearedoptimisticwhenoriginallyproposed,buthavesincebeenexceededbymorerecentstudiesandindustrygoals.Inanet-zeropolicyscenario,thePrincetonmodelingreachesa100%EVsalesshareby2050,butisonlyaround50%in2030and85%by2035(seeFigure15),whichislowerthansomeexpectationswithintheindustry(orthoseusedintheIEAmodelingthatassumed60%ofglobalvehiclesaleswereelectricby2030).Figure11.PrincetontransmissionexpansioninthehighelectrificationcaseSource:Larsonetal.(2021).14PathwaystoNet-ZerofortheUSEnergyTransitionAnalyzingvehiclesalestrendsisdifficult—assumptionsaboutvehiclecosts,stockturnover,andpeople’swillingnesstoadoptnewtechnologyarehardtoincorporatefullyintobroadeconomy-widemodels.Unlikeelectricitygeneration,whereassumedadoptionofleast-costtechnologiesappearstobeareasonablecharacterizationofthesector’sbehavior,costpremiumsforvehicletypesareonlyonecomponentoftheEVadoptiondecision.Morethanacenturyofobservingvehiclepurchasesclearlyshowsthatbuyersdonotsimplybuytheleastcostlyoptiontotravel;rather,therearemanyfeaturesfromstyletosafetytoconveniencethatdeterminepurchases.ThiswillalsobetrueofEVpurchasedecisions,particularlyastheyraise—andmustresolve—uniqueissuesofdrivingrangeandaccesstocharging.Figure13illustratesassumptionsinthePrincetonanalysisregardingthecostpremiumsforelectricandfuel-cellvehiclesin2030,comparedtoconventionalinternal-combustionvehicles.LDVshaveessentiallyreachedcostparityby2030,butacombinationofstockturnoverassumptionsandconstraintsonEVadoptiontoproxyconcernsaboutthenewtechnology,rangelimitations,andtheavailabilityofchargingstationscanstilllimitEVgrowth.AsthestockofEVsexpandsandtheiroverallelectricityneedsgrow,whenthevehiclesarecharged—andhowthosepatternsmatchupwithrenewablegeneration—willhavesignificanteffectsonhowvehicleelectrificationwillimpactelectricitygenerators.ThispointishighlightedinFigure14,whichcomparestheAEOReferencecaseforecastforelectricitygenerationintheUnitedStatesbytypeoffuel.ThePrincetonhighelectrificationscenarioimpliesthatgenerationwillneedtoreach7,000TWhby2050tosupplyEVs,insteadofthe5,000TWhthatwererequiredpriortotheconversionofthelight-dutyfleettoEVs.Notethatthis40%increaseinelectricitydemandatthisstageincludesonlydemandsfromLDVs,notthedemandsassociatedwithelectrifyinganyothervehiclesorsectorsoftheeconomy.Figure12.Electricvehiclesalesforecastsasapercentoftotallight-dutyvehiclesalesSource:IEA(2021),Larsonetal.(2021),andZhouandMai(2021).Abbreviation:EFS=ElectrificationFuturesStudyNicholasInstituteforEnergy,Environment&Sustainability,DukeUniversity15ElectrificationandOtherOptions:Medium/Heavy-DutyVehiclesMedium-toheavy-dutyvehiclesareforecasttocontributearound8.5%oftotalUSenergy-relatedCO2emissionsthrough2050intheAEOReferencecase,whichisslightlyhigherthantheglobalaverageof7.3%(ETC2019).UnlikemostLDVsthatareusedforshortdailytrips,heaviertransport(cargotrucks,buses,andsoon)canoperateaseithershort-orlong-haulvehicles.ThesedifferentmodesoftransportlendthemselvestoawiderarrayoftechnologychoicesthanareexpectedinLDVs(Figure15).Theforecastedmixofenergysourcesforheavyvehiclesacrosstheavailablenet-zeroanalysessuggeststhatelectrificationwillbeonlyoneofseveralapproachestoemissionsreductions.Globally,theETCanalysisseparatestheresponsesintothreecategoriesofroughlyequalimportance:demandmanagement(logisticalefficiency),energyefficiency(enginesandaerodynamics),anddecarbonizationoptions(electrification,hydrogenfuelcells,andotherliquidfuelssuchasbiofuels)(ETC2019).AsshowninFigure15,thePrincetonstudysplitstruckingbetweenbatteryandfuelcellvehiclesfortheUS,withheaviertrucksrelyingmoreonfuelcells.BiofuelsarenotacontributortoemissionsreductionsinthePrincetonstudy,whichisalsotrueintheglobalETCexaminationofheavytransport(ETC2019).ETCpointsoutuncertaintiesinthetruecarbonintensityofbiofuels,whichmightaffecttheirtreatmentandpricingunderanet-zeropolicy,andsuggeststhatbiofuelswillnotbeabletocompeteonacostbasiswithelectricdrivetrainsinthelongterm.TheIEAdividesglobaltransporttechnologiesbydailydrivingdistancebetweenbatteriesandfuelcellsandseesbiofuelssupplying10%ofenergyneedsinheavytransportin2050,butdirectmostoftheavailablebiofuelsandzero-carbonsyntheticfuelstowardhard-to-abatetransportationareas(i.e.,aviationandshipping).Figure13.Princetonassumptionsaboutelectricvehiclecostpremiumsin2030Source:Larsonetal.(2021).16PathwaystoNet-ZerofortheUSEnergyTransitionGivenitsoutsizedpresenceintheUSemissionsfootprint,truckelectrificationmustbeamajordecarbonizationpriority.Thenoncommercial,subjectiveconsumerpreferenceconsiderationsthatsignificantlyaffecttheuptakeofLDVs(asnotedpreviously)appeartobelessimpactfulwithmedium-to-heavy–dutyvehicles.Theconclusionsacrossthesurveyedstudiessuggestthatzero-andlow-carbontrucksarealreadytechnicallyfeasible,andthatthebesttechnologyoptionsforeachtypeofvehiclewilldependonhowtheyareused.Chargingforshort-haulelectrictrucksthatcanbedoneovernightwillmakeelectrificationpreferableinthisareaandcanbescaledupintherelativeneartermwiththerightpoliciesandincentives.Electrificationoflonger-haultruckingismoretechnicallychallenging,withlongrangesleadingtolongerchargingtimes,withdebatearoundcharging-timelengthtrajectoriescurrentlyunresolved.Costcomparisonsandresultingtimehorizonsforcleaningmedium-toheavy-dutyvehicleoperationslikewisevary,asdoprojectionsofwidertransportationshiftsthataffecttruckingneeds.Evenwheredirectvehicleelectrificationisnotpursued,cleanelectricitysourcingretainsprimacyasthecostcompetitivenessoffuelcellvehiclesiscontrolledbythecostofhydrogen,whichisinturndependentonthepriceofelectricityifitisderivedfromelectrolysis.Thiscalculusisunlikelytobealteredbybiofuels,whicharenotanticipatedtoplayamajorroleindecarbonizingheavyroadtransport.Figure14.AEOReferencecasegenerationplusincrementaldemandfromelectricvehiclesSource:AdaptedfromLarsonetal.(2021),EIA(2022),andZhouandMai(2021).NicholasInstituteforEnergy,Environment&Sustainability,DukeUniversity17Electrification:ResidentialandCommercialBuildingsEmissionsassociatedwithfossilfueluseinbuildings(andnotaccountingforupstreamemissionsfromelectricityusedinbuildings)areasmallershareofexpectedCO2emissionsinUSforecaststhanelectricpower,transportation,andindustrialsources,yetareimportanttoconsiderfortechnologicalandbehavioralreasons.Overthenextthreedecades,forecast(AEOReferencecase),fossilenergyconsumptionintheresidentialsectorisresponsibleforaround6.5%ofUSenergy-relatedCO2emissions(excludingindirectemissionsfromelectricityuse),andthecommercialsectorisresponsibleforanadditional5.5%(seeFigure5).Morethanone-halfoftheseemissionsarerelatedtospaceheating,withwaterheatinginresidentialhomesasthenextlargestshare.Bothsourceshavetechnologyoptionsavailabletodaythatcanshiftheatingneedsfromfossilfuels(naturalgasand,toamuchlesserextent,petroleum)towardelectricity.Themostenergy-efficientmethodforheatingmostbuildingsisair-sourceheatpumpsthattakeadvantageoftemperaturedifferentialsbetweentheindoorsandoutdoorsofbuildings.Theseheatpumpsrunonelectricityandarebackedupbyelectricresistanceheatingforparticularlycoldperiodsortimesofthedaywhenoccupantswishtoraisetheheatquickly.Theheatpumpsalsosupplycoolingneedsinthesummerthroughthesametemperaturedifferentialprocess.Figure15.PrincetonreportsalestrendsforlightversusmediumversusheavyvehiclesSource:AdaptedfromLarsonetal.(2021),p.46.18PathwaystoNet-ZerofortheUSEnergyTransitionIntheUS,thePrincetonhighelectrificationscenarioestimatesthatthemarketshareforheatpumpsislikelytogrowfromaround20%currentlyto90%by2050intheresidentialsector.Heatpumppenetrationinthecommercialsectoriscloserto10%todayandexpectedtoreach80%by2050.Assumptionsmadeindifferenttechnologypathwaysintheirstudyaboutoverallelectrificationtrendsinfluencehowquicklythesetypesofunitsdisplacefossilheating.ThePrincetonhighelectrificationcasedisplacesmostnaturalgasheatingby2035,whiletheless-highcaseonlyeliminatesmostgasheatby2045(Figure16).Similartrendsareseenincommercialbuildings,althoughtheswitchawayfromnaturalgasismoreprolongedinthissector.Totalenergyusedeclinesinthenet-zeroscenariosasmoreefficientelectricequipmentdisplacesnaturalgasheatingandcooking,withouttheneedforsubstantialincreasesintotalelectricityuse.Broadlyput,leadingprojectionsassumethatdemandforresidentialenergy-relatedservicesdoesnotchangeinthenet-zeroscenarios.Inotherwords,thatbehaviordoesnotmeaningfullychangeorrespondtoprices.Mostfossilenergyinheating,cooling,andcookingisreplacedwithelectricityby2035,thoughadoptionvariessignificantlyacrossUSclimatezones.By2050between80%to100%ofallspaceandwaterheatingandcookingareelectric,withtotalenergyusedecliningthroughefficiencyimprovements.Bothresidentialandcommercialbuildingstransitionawayfromnaturalgas,withthecommercialsectormovingslower.Theseandotherprojectionsrestontechnologycostmodelsandanumberofassumptionsonissuessuchasbehavioralchange,the(in)elasticityofdifferentenergyoptions,energypricesanddemands,andinteractionswithpoliciessuchascarbonpricesorefficiencystandards.Furtherassessmentsarepossiblethatcanmoredirectlycapturetheseandotherfactors.ElectrificationandOtherOptions:IndustryWithexpectedenergy-relatedCO2emissionscomprisingalmostone-quarterofallUSemissionsin2050,decarbonizingtheindustrialsectorwillbeacriticalcomponentofmeetingnet-zerogoals.Reducingtheseemissionsisexpectedtorequireawidearrayofstrategiesbeyondjustelectrification,dependingonthespecifictypeofmanufacturing.ThissectionlooksacrossindustriesandtechnologyoptionstoseewhereopportunitiesareexpectedtoexisttoswitchFigure16.PrincetonreportenergyuseinresidentialandcommercialbuildingsSource:Larsonetal.(2021).NicholasInstituteforEnergy,Environment&Sustainability,DukeUniversity19industrialenergyconsumptionintoelectricityandwhereotherareasshouldbeevaluatedbecauseelectrificationiseithernotfeasibleornotcost-effective.Paststudiesofheavyindustrydecarbonizationatgloballevelshavebeenmorelikelytodivergeintheirconclusionsthanexpectedelectrificationpathwaysinothersectorsoftheeconomy.TheIEAfindsthat—inadvancedeconomies—thereislittlechangeinindustrialproductionvolumesfrom2020acrossmajorindustrialemissionssources,butchemicals,steelandcementarealmostfullydecarbonized.Meanwhile,globally,theIEAseesacombinationofCCUS,electrification,biomass,efficiency,andhydrogenallplayingrolesinsubstantiallylowering(by95%)industrialemissionsby2050;however,significantamountsoffossilfuelswithCCUSremaininthesector.Incontrast,theETC(2020)reportexpectsindustrialelectrificationtoplayalargerrolethandoesIEA(Figure17).Electricityuseinazero-carboneconomycoversenergyneedsforthemajorityofindustries;chemicalfeedstocksarelargelymadeupofacombinationofhydrogenandfossilfuelswherecarboncapturehasbeenused,alongwithlimitedamountsofbioenergy.ThesharesoffossilfuelswithCCUSaresimilartothoseofelectricity,withsubstantialamountsofhydrogenintheenergymix.Forcomparison,othersectorsoftheeconomy—asidefromshippingandaviation—aremuchmoreheavilyelectrified.IncontrasttothegloballyfocusedconclusionsfromIEAandETC,thePrincetonreportforecastsmuchmorelimitedelectrificationintheUSindustrialsectorasawhole(Figure18).Fossilenergyconsumption(withorwithoutCCUS)remainslargelyunchangedbetween2020and2050inthehighelectrificationcase,asidefromthesmallincreaseinelectricityuseandareductioninnaturalgas.Energyconsumptionbyindustry(acrossallfueltypes)showsubstantialdeclinesinenergyforpetroleumrefining,butlimitedchangesinotherpartsoftheindustrialsector.Bulkchemicalscontinuetogrowasanenergyconsumer,butwithoutswitchingintootherenergysources.HadFigure17.ETCenergymixprojectionsinaglobalnet-zeroeconomySource:ETC(2020).20PathwaystoNet-ZerofortheUSEnergyTransitiontheymadethisswitch,theamountofhydrogenintheindustrialsectorasawholewouldhaveincreasedcommensurately.ThePrincetoninvestigationofUScementandsteelindustries(Figure19)expectscementtooperatewith100%ofitscapacityemployingcarboncaptureby2050,incontrasttotheglobalfindingsbyETC.Similarly,theUSsteelindustryisfullyelectrifiedby2050inthenet-zeropolicypathways.Aswithtransportation,anddespitesomeprojectionsseeingsignificantfossilusewithCCUS,industrialdecarbonizationdependssubstantiallyoncleanelectricityproduction,transmission,andreadyavailability.Thisistrueacrossscenariosbecauseoftheneedforcleanelectricityuseddirectlyinindustrialprocesses,indirectlyinthecreationofnewfeedstockslikegreenhydrogen,andevenincaseswithcontinuingfossilusewithCCUSasthiswillnotcomprehensivelycoverindustrialneedsinnet-zeroscenarios.Suchcleanelectricityexpansion—withresultingeconomy-widedecarbonizationpotential—dependstosignificantdegreesonconducivepolicyenvironments.DACtechnologiescouldalterthesedecarbonizationscenariosinindustrialsectorsandbeyond.Whilenotyetcommerciallyoperationalatscale,someanalysesfindDACtobeincreasinglycommerciallyviableandabletodeliversubstantialemissionsreductionsalongsidesecuregeologicalstorage(BPC2021).Withcostestimatesdecliningfromupto$1,000pertonofCO2Figure18.PrincetonreportindustrialenergyconsumptionbyfueltypeandindustrySource:Larsonetal.(2021).NicholasInstituteforEnergy,Environment&Sustainability,DukeUniversity21capturedadecadeagotoroughly$100–$250pertonestimatedforfuturelarge-scalefacilities,potentialfuturepricedeclinescouldbolsterthecaseforwidespreadDACdeployment(AEIC2021).A1milliontonperyearDACfacilityiscurrentlybeingplannedinthePermianBasin,asignthatindustrial-leveleffortsmaybeintheoffing.Likemanyofthetechnologiesandpathwaysexploredinthisandtheprevioussection,DACeffortsareenteringanewpolicylandscapewithemergingincentivesandfinanceoptionsthatcouldleadtoaccelerateddeployment.PotentialRolesforCleanFuelsAlternativeelectrificationscenariostothosepresentedintheprevioussectionsenvisageagrowingroleforrenewablenaturalgas(RNG)andhybridconfigurationsthatcombinecleanhydrogenandfossil-freenaturalgas—particularlyforheating.Analysesunderpinningthesescenariosquestiontheviabilityandcost-effectivenessofheatingdemandsbeingmetwhollyorlargelybyelectricity,particularlyincoldclimates,andhighlightthepotentialimportanceoffuelback-upstomeetemergencyneeds(Ameresco2022,EPRI2022,Brown2021,NationalGrid2022,E32022).Resultingscenariosseethepartialelectrificationofdomesticandcommercialheatingnetworkscombinedwiththeuseoffossil-freegasandnetworkedgeothermalsources.RNG,capturedfromsourcessuchaswastemanagementandagriculturalsystemsthatwouldotherwiseemitmethane,enjoysacomparativelylowlifecyclecarbonintensitywhendisplacingfossilnaturalgas(GargandWeitz2019;CDP2022).RNGcanalsobestoredandtransportedthroughexistinggasnetworksandisusablewithexistingappliancesanddomesticandcommercialsystemscurrentlyoperatingonfossilgas.Itscurrentusageandavailabilityaresmallbutcouldexpandwithnewinvestmentsandinfrastructure.Forinstance,NationalGrid—servicingacustomerbaseintheNortheast—estimatesthatitwillultimatelyprocure10%to20%oftheannualEasternUSRNGsupply,meetingthegasdemandforbothitsresidentialandcommercialcustomers(NationalGrid2022).Theseinputswillonlysucceedaspartofanet-zerosolutioniftheyeffectivelycombinewithincreasedelectrification,increasedbuildingandheatingsystemefficiency,andeffectivesynergieswithothernon-electricsources—particularlyhydrogen.Figure19.PrincetonreportcementandsteelproductioninvestigationSource:Larsonetal.(2021).22PathwaystoNet-ZerofortheUSEnergyTransitionThesealternativeelectrificationscenariosalsoenvisiontheblendingofhydrogenwithnaturalgasorRNGatsignificantvolumesrunningthroughexistinggasnetworks,andthenbeingusedincustomerapplianceswithoutsignificantupgradestoinfrastructureorequipment.Whencoupledwithwindorsolarresourcesthatareabletoproducemoreelectricitythanthegridneeds,whichcanthenbestoredforlateruse,thesescenariossuggestthattheresultinggreenhydrogencouldplaysignificantrolesinlong-durationrenewableenergystorageandasasourceoffuelforpowergeneration,transportation,andparticularlyheating—especiallyininstanceswhereelectrificationwithoutcleanfuelsmightprovesuboptimalintermsofcost,reliability,customerpreference,orotherwise.InpartsoftheUSpursuingoffshorewind,includingareasalongtheeasternseaboardwithhighcurrentgasdemand,multipleprojectsproposeelectrolysis-drivenhydrogenproductionand,asthefollowingsectiondetails,“hydrogenhubs”aregainingfederalandstate-levelsupport.TheresultingdecarbonizationscenarioseeslocalandpipedsourcesofRNGincreaseatthesametimethatexpandingrenewableenergycapacityprovideshighervolumesofcleanhydrogen.Whencombinedwithgreatergridelectrification,efficiencygainsthatreducedemand,andadditionsfromnetworkedgeothermal,thesecleanfuelscontributetoanintegratedsystemthatprovideslow-carbonheating.Majorbuildoutswouldbeneededineachofthesecategoriesforthisscenariotocometofruition.ThenextphaseofthisresearchwillthusexamineandassessthisalternativeapproachinfurtherdetailaspartofanoverallassessmentofpotentialUSelectrificationpathways.Asthefollowingsectiondemonstrates,thetrajectoryoftheelectrification–cleanfuelintersectionandbroaderpossibilitiesfortheshapeofnet-zeropathwaysaremarkedlyaffectedbyashiftingpolicylandscape.THEUSDECARBONIZATIONPOLICYLANDSCAPEWhiletheUShasenjoyedemissionsdeclinesfornearlytwodecades,thepriortwosectionsofthisreporthaverevealedthatsuchBAUtrends(excludingrecentlegislation)areinsufficienttomeettheUS’snet-zerogoalsand,byextension,theclimatechangechallenge.Thisinsufficiencyresultsbothfromthedifficultyofevolvingbeyondtheentrenchedenergy,economic,andsocialsystemsthatfueltheUSemissionsprofile,andfromapolicyenvironmentthat,particularlyatthefederallevel,wasoftenmisalignedwithambitiousdecarbonizationefforts.Nascentchangestothispolicyenvironmentarecreatingopportunitiesforenergytransitionsatgreaterpaceandscalethanthosecapturedinthehistoricaltrendsandfutureprojectionspresentedherethusfarandareexploredfurtherinthissection.Likeanycountry,theUSrequireswidespreadfederalandsubnationalpoliciestobringaboutreductionsfromthemillionsofdiscretesourcesofGHGemissions.Theprevioussectionsofthisreportanalyzecentralhigh-emittingsectorsthat,inturn,havehighmitigationpotential.Reachingthispotentialwillrequireeffectivefederalandsubnationalpoliciesintheformofamixofincentive-basedandregulatoryapproachesthatdirectlyandindirectlyaffectnationalenergytransitionanddecarbonizationtrajectories.Thissectionoffersanoverviewofkeyexistingpolicies,theirdrivers,andtheirpotentialimplications.KeyFederalExecutiveandLegislativeActionsTheBidenadministration’sNDCtoaddressglobalclimatechangepledgestoeliminatecarbonemissionsfromtheelectricitysectorby2035throughacombinationofefficiencygains;carbon-freeelectricity;electrifyingtransport,buildings,andselectindustry;andscalingupnewenergyNicholasInstituteforEnergy,Environment&Sustainability,DukeUniversity23sourcesandcarriers(TheWhiteHouse2021b).Priortotherecentpassageofmajorfederallegislation,NDCandotherclimategoalswerepursuedlargelythroughexecutiveactionatthefederallevel.Forinstance,ExecutiveOrder14008,“TacklingtheClimateCrisisatHomeandAbroad,”stipulatesthatthefederalbudgetprocessisaconduitthroughwhichagenciesshallprioritizeactiononclimatechange(ExecutiveOfficeofthePresident2021).ThisformedthebasisforFY22BidenadministrationbudgetaryrequestsofbillionsinincreasedfederalspendingandlendingtosupportGHGreductions,includingforcleanenergyprojectsandworkforcedevelopment($2billion);cleanenergy,storage,andtransmissionprojectsforruralareas($6.5billion);efficiencygrants($1.7billion);federalEVprocurement($600million);theremediationofabandonedoilandgaswellstoreducemethaneleakage($580million);investmentintheEVmarketincludingrebates,batterymanufacturing,charginginfrastructure,andmore($174billion);andresearch,design,anddemonstration(RD&D)incleanenergyinnovationacrossnondefenseagencies($10billion)(OMB2021,20).Theserequestswerescaledbackbutnoteliminatedduringbudgetreconciliationprocesses,andPresidentBiden’sFY23budgetredoublesclimateandenergytransitionspendingrequests.Suchbudgetaryoutlaysandreconciliationprocessesforfinalizingthemhavewanedinrelevance,however,with2021–2022legislativeoutcomes.Moredurableenergytransitionandclimatemitigationpolicyispossiblethroughcongressionallegislation.Yet,exceptforirregularflurriesoflegislativeefforttopriceandtradecarbon1andmorerecentinterestinimplementinganationalbordercarbonadjustment,2therehadbeenrelativelyscantlegislativeeffortstonationallyregulateGHGemissionsorcreatewholesaleenergytransitionpolicies.USlegislationwastypicallymoreindirectand/ormoregranular,suchasthroughadjustmentstofederalfuelefficiencystandards,taxincentivesforrenewableenergy,andCCUSefforts.3TwovitalexceptionstothisnormnowtakeprimacyintheUSnet-zeropolicylandscape:theBipartisanInfrastructureLaw(BIL)(2021),andtheInflationReductionAct(IRA)(2022).BoththeBILandespeciallytheIRApromisesignificantpotentialimpactand,giventheirfoundationinlaw,willprovemorerobustthanthepreviouslydiscussedexecutiveactions.TheBILincludessignificantfundingfortransmissionandgridimprovements($75billion),increasingresilienceofthenation’snaturalandphysicalinfrastructure($50billion),investinginanationalEVcharginginfrastructure($7.5billion),andreducingmethaneemissionsfromorphanedoilandgaswells($4.7billion).Perhapsmostnotablyintermsofgalvanizingemerging,nascentandfuturecleanenergypathways,theBILfundedthecreationoftheUSDepartmentofEnergy(DOE)OfficeofCleanEnergyDemonstrations(OCED)tosupportdemonstrationprojectsincleanhydrogen,carboncapture,grid-scaleenergystorage,smallmodularreactors,andbeyond.Withover$20billionininitialfunding,theOCEDwillfundmajorR&Dandproof-of-conceptprojectsthatseektogalvanizefollow-onprivatesectorinvestmenttodeploycleantechnologies.4Wheresuccessful,1MostnotablythroughtheAmericanCleanEnergyandSecurityAct(colloquiallytheWaxman-MarkeyAct)in2009and,toalesserextent,theAmericanPowerAct(colloquiallytheKerry-LiebermanAct)in2010.2MostnotablytheFAIRTransitionandCompetitionAct(colloquiallytheCoons-PetersAct)in2021.3Seeforexample:Sherlock,M.F.,EnergyTaxProvisions:OverviewandBudgetaryCost,CRSReportR46865(Washington,DC:CongressionalResearchService,2021),https://crsreports.congress.gov/product/pdf/R/R46865;andFolger,P.,CarbonCaptureandSequestration(CCS)intheUnitedStates,CRSReportR44902(Washington,DC:CongressionalResearchService,2022),https://sgp.fas.org/crs/misc/R44902.pdf.4ForabriefintroductionofthisOCEDmandatesee:https://www.energy.gov/articles/doe-establishes-new-office-clean-energy-demonstrations-under-bipartisan-infrastructure-law.24PathwaystoNet-ZerofortheUSEnergyTransitiontheseinvestmentsmayyieldoutsizedenergytransitiondividendsbeyondthosecurrentlyforeseenandmodeled.However,thesesuccessesnotwithstanding,theBIL’sintendedinvestmentsinenergytransitionsectorswerepareddownsubstantiallyfromtheBidenadministration’soriginalgoals.MajorfundingforRD&Dincleantechnologyareassuchasutility-scaleenergystorage,CCUS,hydrogen,floatingoffshorewind,andmoredidnotclearthelegislativeprocess.Majorcullstoinvestmentsincleanenergymanufacturingandtraining,alongwithtaxcreditschemesforcleanenergymanufacturingfacilities,reducetheBIL’senergytransitionheft,asdoesitsfailuretoretainstipulationsthatwouldreformtaxpreferencesforfossilfuels.SuchmixedoutcomesdemonstratetheheadwindsfacedbyclimateandenergytransitionpoliciesintheUS,which—whilestillondisplay—didnotprecludethepassageoftheIRAinAugust2022.Despiteitsname,theIRAisthemosttargetedandpotentiallyimpactfulpieceofdomesticUSclimatelegislationofthetwenty-firstcenturytodate.AreconstitutionoftheBuildBackBetterActof2021,whichpassedtheUSHouseofRepresentativesbutstalledintheSenate,theIRAdeliversaseriesofincentivestodrivethenationalenergytransition(amongotheraims).Theseincentivesprimarilytaketheformofcleanenergytaxcreditsalongwithprogramsandpoolsoffinanceforcommercialandemergingcleantechnologies,infrastructure,andproducts.Feesandpunitiveregulations(e.g.,formethaneleaksfromoilandgasoperations)arepartoftheIRA,buttolesserdegreesthanpositiveincentives.Table1providesthecoreenergytransitioncomponentsoftheIRA,whicharetooexpansivetocomprehensivelysummarizehere.5Intotal,theIRAcommitsroughly$369billion6infundingforclimateandcleanenergyprovisionsandspecificallyincentivizesthedevelopmentofadomesticUSsupplychaintoproducecleanenergy.Italsoconditionstheissuanceofrenewableenergyleasesonfederallandsontheofferingoflandforoilandgasdevelopment,aswellasthecompletionofmultiple2022leaseauctionsthatwerepreviouslycanceled.However,thereisnorequirementthatoilandgasleasesactuallybesold,andrecentyearshaveseendeclinesinindustryinterestindevelopingoilandgasresourcesonfederalland(Webb2022).Thisfossil-fuelsupportresultedfrompoliticalcompromisesthatultimatelyledtotheIRA’ssuccessfulpassageandhasthepotentialtotempertosomeextentthenature,timing,and/orscopeofitseffectsontheenergytransition.However,initialanalysissuggeststheIRAwillhavemajorimpactsonUSemissionsreductionefforts.ThreeinitialearlyIRAassessmentswarrantattention.TheRhodiumGroupestimatesthattheIRAwillreduceUSnetemissionsby32%to42%below2005levelsby2030,comparedto24%to35%withoutit(Figure20),andscalecleangenerationtosupplyupto81%ofallelectricity(Larsenetal.2022).ThePrincetonREPEATprojectcomestorelativelysimilarconclusions(Figure21),estimatingthattheIRAwillcutannualemissionsin2030byroughly1billionmetrictonsbeyondthatwhichwouldhaveoccurredwithoutit,closingapproximatelytwo-thirdsofthepreviousemissionsgapbetweenBAUtrendsandthenationaltargetofa50%reductionfrom2005by2030(Jenkinsetal.2022).5Foraneffectivesummarysee:https://bipartisanpolicy.org/blog/inflation-reduction-act-summary-energy-climate-provisions/.6Importantly,thisoft-citedfigureisaprojectionbasedontheamountofinvestmentexpected,andtaxcreditsforhydrogenandrenewableenergyarenotnecessarilycappedatthisoranyotherfigure.NicholasInstituteforEnergy,Environment&Sustainability,DukeUniversity25Table1.InflationReductionAct—KeyenergytransitioncomponentsProvisionKeyComponentsNewcleanhydrogenproductiontaxcredityCreatesanew10-yearincentiveforcleanhydrogenproductionwithfourtiersyProjectsmustbeginconstructionby2033yEligibilityincludesretrofitfacilitiesNewadvancedmanufacturingproductiontaxcredityTaxcreditforproducingcleanenergycomponentsintheUSyIncludessolarcomponents,windturbineandoffshorewindcomponents,inverters,manybatterycomponents,andcriticalmineralsyBeginstophaseoutin2029andphasesoutcompletelyin2032NuclearpowerproductiontaxcredityNuclearpowerproductioncreditayAvailabletofacilitiesalreadyinservicein2024,endsafter2032ExtensionofrenewableelectricityproductiontaxcreditbyExtendsexistingproductiontaxcredit(PTC)forgeothermal,wind,closed-andopen-loopbiomass,landfillgas,municipalsolidwaste,hydropower,andmarineandhydrokineticfacilitiesto2024yIncreaseshydropower,municipalsolidwaste,andmarineandhydrokineticcredittofullvalue(previouslyhalved)yStrikestheoffshorewindcreditphaseoutforfacilitiesplacedintoservicebefore2022NewcleanelectricityproductiontaxcredityCreatesaPTCcreditof1.5centsperkWhofelectricityproducedandsoldorstoredatfacilitiesplacedintoserviceafter2024withzeroornegativeGHGemissionsyCreditsphaseoutin2032orwhenemissiontargetsareachievedExtensionofenergyinvestmenttaxcredityExtendsexistingenergyinvestmenttaxcreditforapplicableenergyprojectsinmostcasesto2024andmaintainsa10%or30%creditNewcleanelectricityinvestmenttaxcredit(ITC)yCreatesITCcreditof30%oftheinvestmentintheyearthefacilityisplacedinserviceyCleanelectricityprojectssmallerthan5MWcanincludethecostsofinterconnectionundertheITCyCreditsaresettophaseoutin2032orwhenemissiontargetsareachieved,whicheverislaterAdvancedenergyprojectcredityExtends30%investmenttaxcredittolow-carbonindustrialheat,carboncapture,transport,utilizationandstoragesystems,andequipmentforrecycling,wastereduction,andenergyefficiencyyExpandscredittoincludeprojectsatmanufacturingfacilitiesthatwanttoreducetheirGHGemissionsbyatleast20%yTaxcreditisfundedat$10billionforeligibleprojectsFueltaxcreditsyCreatesanewtechnology-neutraltwo-yeartaxcreditforlow-carbontransportationfuelcNewsustainableaviationfuelcredityCreatesanincentivetoloweraviationtransportationemissionsd26PathwaystoNet-ZerofortheUSEnergyTransitionCleanvehicletaxcreditsyMaintains$7,500consumercreditforpurchasingqualifiednewcleanvehicles,includingEVs,plug-inhybrids,andhydrogenfuelcellvehicleseyCreatesa$4,000consumertaxcreditforpurchasingpreviouslyownedcleannoncommercialvehicles,includingEVsandplug-inhybridsfyCreatesa$7,500commercialtaxcreditforpurchasingqualifiedcleanclass1–3vehicles,includingEVsyCreditincreasesto$40,000forclass4andabovecommercialvehiclesResidentialenergyefficiencyyExtendscreditthrough2034forresidentialsolar,wind,geothermal,andbiomassfuelgyExpandseligibilitytobatterystoragetechnologyyExtendscreditforenergyefficiencyhomeimprovementsthrough2032hyFunds$4.3billionthrough2031toDOEforstateenergyofficestoproviderebatesforwhole-houseenergysavingretrofitsyFunds$4.3billionthrough2031forgrantsfromDOEtostatesandtribestoimplementahigh-efficiencyelectrichomerebateprogramyProvidesupto$14,000intaxcreditsperhousehold,including$8,000forheatpumps,$1,750forheatpumpwaterheaters,and$840forelectricstovesiEnergyinnovationyCreatesnew$5.8billionprogramundertheOCEDforemissions-reducingprojectsiniron,steel,concrete,glass,pulp,paper,ceramics,andchemicalproductionyFundsDOENationalLaboratoryimprovementsjyFunds$150millionfortheOfficeofFossilEnergyandCarbonManagement,$150millionfortheOfficeofNuclearEnergy,and$150millionfortheOfficeofEnergyEfficiencyandRenewableEnergyforinfrastructureandgeneralplantprojectsthrough2027yProvides$700millioninadditionalfundingtotheDOEAdvancedNuclearFuelAvailabilityprogramthrough2026OffshorewindyMakes$100millionavailablefortheplanning,modeling,analysis,anddevelopmentofinterregionaltransmissionandoptimizedintegrationofenergygeneratedfromoffshorewindyRequiresanoilandgasleasesaleof60millionacresintheprioryearforoffshorewindleaseissuancethrough2032yLiftstheoffshorewindmoratoriuminthesoutheasternUSandEasternGulfandallowsleasingintheUSterritoriesOilandgasyIncreasesoffshoreoilandgasroyaltyratestoaminimumof16.66%from12.5%through2032yIncreasesonshoreoilandgasleasingminimumbidfrom$2to$10peracrethrough2032yIncreasesannualrentalratesfornewonshoreoilandgasleasesMethaneemissionsreductionprogramyFunds$1.55billionforEPAtoprovideincentives,grants,contracts,loans,andrebatesforfacilities,welloperators,andcommunitiestoenablemethaneemissionreductionactivitieskyEstablishesamaximumannualmethanewasteemissionrateof25,000metrictonsofCO2eperfacilityandimposespenaltiesat$900pertonin2024,increasingto$1,500pertonby2026,withexceptionsforoperatorsincompliancewithEPAregulations(thusprovidingaregulatorybackstop)NicholasInstituteforEnergy,Environment&Sustainability,DukeUniversity27InvestmentsinthepermittingprocessyFunds$760millionthrough2026forDOEgrantstofacilitateandacceleratethesitingandpermittingofinterstatetransmissionprojectsyFunds$350millionthrough2026fortheEnvironmentalReviewImprovementFundlCleanenergyfinancingyDOELoanProgramsOffice(LPO)providesover$40billioninavailableloanandloanguaranteesmyCreatesEnergyInfrastructureReinvestmentFinancingprogramwith$5billiontocarryoutprogramauthoritiesand$250billioninloanauthoritythrough2026nyCreatesGreenhouseGasReductionFundtoenableEPAtomakegrantstostate,local,regional,andtribalprogramsthatprovidefinancialsupporttolow-andzero-carbontechnologiesandprojectsoyProvides$2billioningrantsthrough2031toretoolexistingautomanufacturingfacilitiesfordomesticproductionofcleanvehiclesyFunds$500milliontocarryouttheDefenseProductionAct(1950)forcriticalmineralprocessingandheatpumpsyFunds$10milliontoEPAfornewgrantstosupportadvancedbiofuelindustriesthatprovide50%GHGemissionreductioncomparedtoconventionalfuelsyProvides$500millionuntil2031forcompetitivegrantstosupportblending,storing,supplying,ordistributingbiofuelswithhigherlevelsofethanolandbiodiesela1.5centsmultipliedbykilowatt-hoursofelectricityproducedminus16%ofthefacility’sgrossrecipientsinexcessof2.5centsperkilowatt-hour.bManyPTCsandITCsintheIRAapplya10%bonusformeetingdomesticmanufacturingrequirementsforsteel,iron,ormanufacturedcomponentsanda10%bonusforfacilitieslocatedinbrownfieldsitesorfossilfuelcommunities.cMaximumcreditis$1pergallon(or$1.75pergallonforsustainableaviationfuel)multipliedbyanemissionsfactor.Theemissionsfactoriscalculatedproportionaltoamaximumemissionratestandardof50kilogramsofCO2eper1MMBtu.dCreditstartsat$1.25pergallonforaviationfuelthatreducesGHGemissionsby50%andincreasesby1centforeachadditionalpercentreduction,maxingat$1.75pergallon.eAcertainpercentageofthecriticalmineralsusedinbatterycomponentsarenotextractedorprocessedintheUSorafreetradeagreementcountryorrecycledinNorthAmerica.Thepercentagerequiredincreasesfrom40%in2024to80%in2026.Itdeterminesamaximumcostof$80,000pervehicleforvans,SUVs,andpickups;$55,000forothervehicles;andanincomeeligibilitylimitof$150,000or$300,000forjointfilers.fSetsamaximumsalepriceof$25,000.Modelmustbeatleasttwoyearsolderthantheyearofsale.Implementsanincomeeligibilitylimitof$75,000or$150,000forjointfilers.gMaintainsthepreviouscreditratebutadjuststheprojectdates.Appliesa30%creditforprojectsstartedbetween2022and2032.Creditdecreasesto26%forprojectsstartedin2033and22%forprojectsstartedin2034.hIncreasescreditfrom10%to30%.Replaceslifetimecaponcreditswitha$1,200annualcreditlimit,including$600forwindowsand$500fordoors.Increaseslimitto$2,000forheatpumpsandbiomassstoves,removeseligibilityonroofs,expandscredittocoverthecostofhomeenergyauditsupto$150andelectricalpanelupgradesupto$600.iIncludesfurtherrebatesforimprovementstoelectricalpanelsorwiringandhomeinsulationorsealant.Eligiblerecipientsmustfallbelow150%oftheareamedianincome.jSpecifically,$133.2millionforlaboratoryinfrastructureprojects,$321.6millionforlaboratoryfacilities,$800.7millionforlaboratoryconstructionandequipment,$294.5millionforenergysciencesprojects.kIncludingmonitoring,reporting,sourceplugging,obtainingtechnicalandfinancialassistance,installinginnovativesolutions,mitigatingnegativehealthimpacts,andperformingenvironmentalrestoration.28PathwaystoNet-ZerofortheUSEnergyTransitionlPartoftheFixingAmerica’sSurfaceTransportation(FAST)Actthatseekstoaccelerateandstreamlinetheenvironmentalreviewprocess.Provides$40millionthrough2026forEPAtoinvestinstaffingandequipmentthatenablesmoreaccurateandtimelyenvironmentalreviews.TheIRAalsoprovides$100millionthrough2026forEPAtodevelopreviewdocumentsandspeedtheenvironmentalreviewprocess,and$20millionthrough2026forNOAAtoinvestinstaffingandequipmentthatleadtomoreaccurateandtimelyreviews.mFundingfallsunderthreeprograms:$21.9billionforTitle17(innovation),$15.1billionforAdvanceVehiclesTechnologyManufacturing(AVTM),and$2billionfortheTribalEnergyLoanGuaranteeProgram(TELGP).nProjectsmustretool,repower,repurpose,orreplaceenergyinfrastructurethathasceasedoperationorenableoperatingenergyinfrastructuretoavoid,reduce,utilize,orsequesterGHGemissions.oProvides$11.97billionthrough2024tomakegrantsforeligiblefinancialentities,$15billionthrough2024tomakegrantsforeligibleentitiestoprovidefinancialandtechnicalsupportandsupportthedeploymentofcleanenergytechnologiesinlow-incomeanddisadvantagedcommunities,and$30millionforadministrativecostsoftheprogramthrough2031.Verymuchinthesamevein,EnergyInnovationestimatesthattheIRAcouldcutGHGemissions37%to41%below2005levels(Figure22),andthatforeverytonofemissionsincreasesgeneratedbyIRAoilandgasprovisions,morethan24tonsofemissionsareavoidedbytheotherprovisions(Mahajanetal.2022).Figure20.RhodiumGroupprojectionofIRAemissionsimpactSource:Therangereflectsuncertaintyaroundfuturefossilfuelprices,economicgrowth,andcleantechnologycosts.Itcorrespondswithhigh,central,andlowemissionsscenariosdetailedinTakingStock2022(Larsenetal.2022).NicholasInstituteforEnergy,Environment&Sustainability,DukeUniversity29Figure21.PrincetonprojectionofIRAemissionsimpactSource:AdaptedfromLarsonetal.(2021).aCO2equivalentemissionscalculationsuseIPCCAR100-yearglobalwarmingpotentialasperEPAInventoryofGreenhouseGasEmissionsandSinks.Allvaluesshouldberegardedasapproximategivenuncertaintyinfutureoutcomes.bModeledemissionsreduceanychangesinpassengerandfreightmilestraveledduetosurfacetrans-portation,rail,andtransitinvestmentsinIIJA.AccordingtotheGeorgetownClimateCenter,emissionsimpactofthesechangesdependsheavilyonstateimplementationoffunding.cResultsreflectpreliminarymodelingbasedontheJuly27,2022,draftlegislation.dResultsreflectaverageofestimatedhighandlowoilandgasproductionscenarios,whichspan±20MtCO2ein2030.ImpactonlandcarbonsinksbasedonanalysisbyEnergyInnovation(Jenkinsetal.2022).Figure22.EnergyInnovationprojectionofIRAemissionsimpactSource:Mahajanetal.(2022).30PathwaystoNet-ZerofortheUSEnergyTransitionTheseprojectionsprovideastrongfoundationforinterpretingthepotentialimpactsoftheIRA.Theyarefarfromdeterministic,however,andtheresultsofthelawwillbefluidanddependontheeffectivenessofitsprovisions.AcorepremiseoftheIRA—beyondthebroadpoliticalpalatabilityofincentivesversusconstraints—isthattheroughlydecadaltimehorizonofmanyofitsprovisionswillenablecleanenergytoscaleacrosstheUSenergysystemandreduceemissionsintheneartermwhilealsosettingthefoundationforlong-termreductionstowardnet-zero.Assuch,thestrategiesandstructuresunderpinningtheIRA’sconstituentpartsandprogramswillevolveandrequiretimelyanalysis,includingthatwhichfeedsprivatesectoractorsseekingtotakeadvantageofIRAopportunities.WhiletheseprojectionsrevealthepromiseoftheIRA,theyassumeadegreeoflinearitybetweenincentivesprovided,capitalinvested,ensuingcostcurves,andemissionsimpactsthatobscuressignificantuncertainty.Constraintsinsupplychaindevelopments,humancapitalprogress,degreesofpublicacceptanceforlargesolarandwindexpansions,broaderpermittingchallengesandlongleadtimes,andbeyondwillallaffecttheimpactsofIRAprovisions.Theseeffectsmustbecontinuouslyanalyzed—includingatthesubnationallevel.TheStatePolicyLandscapeTheabsenceofdurableandcomprehensivefederaldriversofenergytransitionandemissionscontrolpoliciespriortotheIRAledtostatestakingarangeofactions.Thusfar,33stateshavereleasedclimateactionplansorareintheprocessofrevisingordevelopingthem,whichbroadlyincludeGHGreductiontargetsandactionsplannedorimplementedforreachingthem.7Twenty-fourstatesplustheDistrictofColumbiahavespecificGHGemissionstargets,albeitfromdifferentbaselineyearsandofvaryingdegreesofambition.CarbonpricingandelectricityportfoliostandardscoverasubstantialportionoftheUSpowerproductionandemissionsprofilesviasubnationalcap-and-tradeprograms.8California’ssystemhasoperatedsince2013;coverspower,fossilfueldistributors,andmajorindustrialemitters;andislinkedtoits2030emissionsreductiongoal.9Ontheeasternseaboard,12statesontheeasternseaboardparticipateintheRegionalGreenhouseGasInitiative(RGGI),acap-and-tradeprogramtargetingelectricpowerthatwentintoeffectin2009andislikewisetiedtoa2030emissionstarget.10Thirtystates,threeUSterritories,andtheDistrictofColumbiahavemandatedcleanenergystandards(CESs)orrenewableportfoliostandards(RPSs)requiringaminimumamountofelectricitybegeneratedbyrenewables,with11jurisdictionsrequiringthat100percentofelectricityultimatelycomefromeligiblelow-carbonsources.11Therearesignsthatrenewableheatingfuelstandards(RHFS)—whichrequiresellersofnaturalgastoprocureagrowingproportionoftheirsupplyfromqualifyingfuelssuchasRNGand/orlow-carbonhydrogen—maybeintheoffingto7Ofthese,23stateshavereleasedplans,8statesareupdatingplans,and1stateisdevelopingaplan(CenterforClimateandEnergySolutions,n.d.).8ForasummaryofallcarbonpricinginstrumentsoperatingintheUnitedStatessee:WorldBank,StateandTrendsofCarbonPricing2021,(Washington,DC:WorldBank,2021),p.71https://openknowledge.worldbank.org/handle/10986/35620.9Thisgoalisa40%reductioninGHGsbelow1990by2030.10RGGIstatesareConnecticut,Delaware,Maine,Maryland,Massachusetts,NewHampshire,NewJersey,NewYork,RhodeIsland,Virginia,Vermont,and,asofApril2022,Pennsylvania.11Thejurisdictionswith100%cleanenergystandardsareCalifornia,Colorado,theDistrictofColumbia,Hawaii,Massachusetts,NewMexico,NewYork,Oregon,PuertoRico,Virginia,andWashington.NicholasInstituteforEnergy,Environment&Sustainability,DukeUniversity31drivetheexpansionofRNGandhydrogensupplychainsalongwiththeirintegrationasheatingsources.12Transportationhaslikewiseproventobeaspaceforstate-levelmitigationaction,aswellasanadditionalbattlegroundforinterpretingtheCleanAirAct.Forty-fivestatesandtheDistrictofColumbiaofferincentivesforEVsand/orhybrids,includingrebates,taxcredits,andfavorableelectricityratetreatment(Igleheart2022).Theincentivesrangefromtaxcreditsorrebatesforfleetacquisitiongoals,exemptionsfromemissionstesting,orfavorableelectricityratetreatment.Sevenstateshavesomeversionofalow-carbonoralternativefuelstandard,and13statesareapplyingaRGGI-typemodeltothetransportationsectorviatheTransportationandClimateInitiative.Beginningin2009,Californiasetstandards—incollaborationwiththefederalgovernment—onfuelefficiencyandemissionsacrossmultiplevehiclecategories,aswellasrequirementsthatautomanufacturersincreasethenumberofzero-emissionsvehiclessoldinthestate(CaliforniaAirResourcesBoard,n.d).Thesepoliciesbecamemiredinfederaldisputes,withtheTrumpadministration–eraEPAcurtailingCalifornia’srighttosetvehicleemissionsstandardsstrongerthanthoseatnationallevels,whichwaslaterrestoredbytheBidenadministrationinMarch2022(OfficeofGovernorGavinNewsom2022).Suchdiscontinuitycouldreadilyresurface.PolicyLandscapeImplicationsTheIRAandBILprovideanimportantfoundationforinvestmentsinsoftandhardenergytransitioninfrastructure.FortheUStoreachitsclimategoals,thesefederalgovernmentinvestmentswillneedtogalvanizeamultiplicativeeffectofprivateandsubnationalinvestments—alongwithconstructionofinfrastructureanddeploymentofnewtechnology—atanunprecedentedscope,scale,andpace.Atpresenttheseinvestmentsappearpromisingforfosteringsucheffectsinthecoresectorsofcleanelectricity,vehicleelectrification,industrialdecarbonization,andadvancedtechnologies,butuncertaintiesabound.Scaled-upprivatesectoreffortsareneededtobothtodrivetheirownenergytransitionoperationsandthoseoftheirsectorpeers,alongwitheffectivelyadvocatingformoreregulatorycertaintyandenergytransitionprioritizationfromgovernmentsatmultiplelevels.CONCLUSION:CHALLENGESANDOPPORTUNITIESFORUSNET-ZEROEMISSIONSANDNEXTSTEPSFORENERGYPATHWAYSUSATheBILandIRAcreatedadynamicshiftintheUSpolicylandscape.Theimpactofthisshiftisstillbeingassessedandwillultimatelydependonunknownimplementationefficacyandengagementonchallengesthatareoutsidestatutoryframesatfederalandstatelevels.Critically,theIRAandBILprovideanimportantfoundationforinvestmentsinsoftandhardenergytransitioninfrastructure,butdonotaddressallcomponentsofanequitabletransition.FortheUStoreachitsclimategoals,thesefederalinvestmentswillneedtogalvanizeamultiplicativeeffectofprivateandsubnationalinvestments—alongwithconstructionofinfrastructureanddeploymentofnewtechnology—atanunprecedentedscope,scale,andpace.Atpresenttheseinvestmentsappear12ThisincludesaRHFSthatwasintroducedinMassachusettsthroughlegislationin2021.See:https://malegislature.gov/Bills/192/H4081.32PathwaystoNet-ZerofortheUSEnergyTransitionpromisingforfosteringsucheffectsinthecoresectorsofcleanelectricity,vehicleelectrification,industrialdecarbonization,andadvancedtechnologies,butuncertaintiesabound.Scaled-upprivatesectoreffortsareneededtobothtodrivetheirownenergytransitionoperationsandthoseoftheirsectorpeers,alongwitheffectivelyadvocatingformoreregulatorycertaintyandenergytransitionprioritizationfromgovernmentsatmultiplelevels.Theprovisionsofthecurrentfederalpolicymixareindicatorsofthisadministration’sassessmentofkeychallengesandprioritizationofpolicyleverstoacceleratetheenergytransition.OfnoteistheBILandIRAfocusonfinancialpolicyincentivesforcleantechnologydeployment.Asnotedpreviously,somebarrierstosuchdeploymentarenotaddressedandwillneedadditionalpolicytoolstoacceleratedeployment.Forexample,infrastructuresitingandbuild-outisalong-recognizedbarriertoanacceleratedelectricitytransition.TheCouncilonEnvironmentalQualityfoundthat,acrossallfederalagencies,theaverageEnvironmentalImpactStatementcompletiontime(fromnoticeofintenttorecordofdecision)was4.5years;themedianwas3.6years(CEQ2020).Multipleintersectingchallenges,includinglandavailabilityandcompetition,speciesandecosystemprioritization,andsocialresistancetositingdecisionscanalldecelerateUSnet-zeroprogress.Theseconsiderationshavemyriaddirectandindirectconsequences,includingthepotentialfuturepreferencingoflessland-intensiveenergyresourcessuchasgeothermal,nuclear,andfossilfuelwithCCUSascomparedtowindandsolar;siteselectionforwind,whichhashighlyvariablespacerequirementspergigawatt-hour;anddecisionsontransmissioninfrastructureandgridintegration.Theyalsoimpactnationaleffortstomineforneededcleanenergymaterialsdomestically—whichinfluencestheircosts,availability,supplychainreliability—andtheabilityofprojectstoreceivetaxcreditsbasedondomesticcontentrequirements.TheIRAandBILprovisionsbringnationalattentiontoasuiteofprioritiesthatareessentialfortheenergytransition,eachofwhichhasassociatedchallenges.KeyareasforacceleratingtheUSenergytransitionincludethefollowing:•Accelerateddeploymentofcleanelectricityandtheelectrificationofvehicles•Acceleratedenergyefficiencyandtheelectrificationofbuildings•Developmentanddeploymentofadvancedenergytechnologies,includinghydrogen,CCUS,DAC,zero-carbonliquidfuels,andadvancednuclearandgeothermalenergysources•Reducedindustrial-sectoremissionsthroughelectrification,efficiencyupgrades,thedeploymentofadvancedenergytechnologies,andlow-orzero-carbonfuels•Reductionsinmethaneemissionsinoilandgasexplorationanddevelopment•Enhancedconservationandsequestrationinforestandagriculturallands•Acceleratedstateandregionalcoordinationandefforts•Ensuredequitabilityfortheenergytransition•IncreaseddomesticsupplychainsourcingtosupportallaspectsofthetransitionForwardprogressinanyofthesekeyareaswillimpacteffortsinothers,creatingsynergiesorunanticipatedhurdlesanddeceleration.Whilethisreportisnotdesignedtodeeplyassesseachoftheseareas,wehighlightthefollowingasareasoffuturefocusforEnergyPathwaysUSA.Futureworkwillbuildonthesecoreareasandwillincludeoverarchingattentiononensuringtheenergytransitionisbothequitableandalignedwithambitiousnet-zerotargets.NicholasInstituteforEnergy,Environment&Sustainability,DukeUniversity33IssueAreasCleanElectricityDeploymentandElectrificationAcceleratingthedeploymentofcleanelectricityandtheelectrificationofvehicles,includingsiting,transmissionincentives,utility-scaleenergystorage,andthetransportationandstorageofCO2,isthefoundationforeconomy-widedecarbonization.TheIRAprovides$760millionthrough2026forDOEgrantstofacilitateandacceleratethesitingandpermittingofinterstatetransmissionprojects,$350millionthrough2026fortheEnvironmentalReviewImprovementFund,andfundingforcapacityenhancementsthroughoutreviewagencies.Theseandotherprovisionsareintendedtoshrinkadministrativeburdensandreducepermittingtimesandarenecessary,butnotsufficientinandofthemselves,tocatalyzetheaccelerationofsitingandpermittingrequiredtomeetdecarbonizationgoals.Bothnationalandsite-specificworkisneededtofurtherelucidatesitingandlicensingbarriersanddevelopsolutionsthatcansupplementandhelpinformthesegovernment-drivenefforts.Near-termanalysiswillthereforefocusonissues,challenges,andopportunitiesrelatingtositingandpermitting,supplychaindevelopmentandmanagement,andinterjurisdictionalandinterfirmcoordination—focusingonhowthesevariablesaffectcleanelectricitydeploymentandelectrificationandindustrialdecarbonization,andpolicyoptionsforaddressingthem.SubnationalCoordinationAlongstandingdifficultywithachievingconsensusonclimatepolicyistheunevendistributionofenergyconsumption,energyproduction,andmanufacturingwithinUSstates.Stateswiththesmallestpopulations—andpotentiallyhighertransportneedsresultingfromdispersedpopulationcenters—havethehighestpercapitaenergyuse.Residentialandcommercialuseroughlyfollowsweatherpatternsmeasuredbyheatingdegreedays,withcolderstatesusingmoreenergyforheatingpurposes.Industrialusefollowsroughlythesamedistributionofenergyuseinothersectorswherethecentralstateshavemuchhigherenergyuseperpersonthanthoseonthecoasts.Thesephysicalrealitiescombinewithawiderangeofenergyandemissionsregulationpoliciesandinstrumentsandthepresenceofmultipleregionalandstategrids,RTOs,andISOs.Net-zeroeffortsnecessitatefurtherintegrationofenergytransmission,storagesystems,markets,preferentialdispatchconnections,demandmanagementmeasures,andmoreacrosscurrentlysiloedsystems.Inlieuofmoreuniformfederalpoliciesthatareunlikelytoemerge,thereisaneedforcreativeanalysisthatoffersbothbroadprinciplesforsubnationalcooperationacrosssystemsandbespokesolutionsthattargetspecificstateandregionalactors.Moreover,itwillbeimportanttoassesshowrelevantfederalpolicies,evenifnotuniform,canincentivizeorotherwiseaffectthedevelopmentofcooperativesubnationalefforts.StrengtheningSupplyChainsTheIRAtakeskeyinitialstepstoaddresssupplychainchallengesandbolstertechnologycomponentproductioninNorthAmericaandbuildsonotherfederaleffortstocreatearesilientsupplychain.Forexample,itcreatesa$7,500taxcreditforbatterycomponentsthatrequires100%tobeproducedinNorthAmericaby2029.TheultimateimpactoftheseandotherincentivescreatedbytheIRAwilldependnotonlyuponthesupplychaininvestmentstheyspuroverthecourseofthisdecade,butalsotheextenttowhichthedemandtheycreateissustainedoverthelongerterm,whichinturnmaydependonfuturepolicies.DOE’s2022reportassessingsupplychainchallenges,proposingastrategyforensuringthatkeyelementsofthesupplychainare34PathwaystoNet-ZerofortheUSEnergyTransitionavailableandinsistingthatthesupplychainwillnotdeceleratethepolicyeffortsmadeinotherareas,showsprioritizationaroundthisissue(DOE2022a).However,permitting,siting,andjurisdictionalissuesthatchallengetheothercleanenergyinfrastructuresystemsdiscussedpreviouslyalsopertaintorawmaterials.Cost-competitivenessismorecomplexinthesespacesbecauseofoftensprawlinginternationalsupplychainsforcleanenergyinputs—particularlyforsolarandbatteries.Furtheranalysisandengagementareneededtomovedomesticsupplychainenhancementgoalstopracticalrealities.IndustrialDecarbonizationandAdvancedTechnologiesTheUSindustrialsectorisconsidereddifficulttodecarbonizelargelybecauseofthediverseenergyinputsthatfeedintoavariedarrayofindustrialprocessesandoperations(DOE2022b;NAS2021).DecarbonizingtheUSindustrialsectorrequirescombiningestablishedandadvancedtechnologiesandpractices,namelyimprovingenergyefficiency;industrialelectrification;low-carbonfuels,feedstocks,andenergysources;andCCUS.Vitally,thesecomponentsofindustrialdecarbonizationmustworkinconcert,andcross-cuttingissuesthatconnectthemrequirefurtheranalysis.Theseintersectionalissuesincludetheneedforimprovedthermaloperationsandmaterialefficiency,materialsubstitution,andend-of-lifematerialfeed-instolow-carbonfeedstocks(DOE2022b).Suchintersectionsexpandintotheneedforbroadersystems-levelanalysisofcircular-economyapproachesthatintegratedemergingbiobasedoptions,CCUS,materialefficiencygainsthroughproductlifecycles,andinteractionsbetweenmultipletechnologicalpathways.WorkPlanComponentsEnergyPathwaysUSAisuniquelyconfiguredtoidentify,analyze,anddevelopstrategiesthataddresscross-sectoralinterdependenciesandoperationalsynergiesandbarriersamongtheseissueareas.EnergyPathwaysUSAwillworktoaccelerateanequitableenergytransitionthroughexploringandanalyzingcurrentandproposedfederal,state,andregionalpolicyincentivesandthebroadrangeoftheirpotentialimpacts,includingonemissions,costs,technology,andconsumerbehavior.Theseeffortswillincludeadvancingtechnicalandeconomicmodelingofdecarbonizationpathways,beginningwithadvancesincleanelectricityandelectrificationandbuildingtoindustrialsectors,andleveragingprivatesectorandknowledgepartnerexpertisetoidentifyanddevelopsolutionstothechallengesinallofthekeyareas.EnergyPathwaysUSA’smodelofworkinghasthefollowingthreecomponents.ExploringFederalandStatePolicyDevelopmentandImplementationWhiletheIRAandBILrepresentapolicylandscapepivot,policychallengesandbarriersremainthathavethepotentialtoslowUSprogresstowardnet-zerogoals.Byandlarge,thequantitativelyfocusedstudiesexploredinthisreportdonotdevelopin-depthpolicyrecommendations.NASdidrecommendfirstsettinganet-zeroemissionsgoalfor2050,alongwithputtingapriceoncarbon.NASalsorecommendedadoptingCESsforelectricity(75%by2030)andtransitioningtoEVs(50%ofsalesby2030).Eachofthestudiesalsoidentifiedtheneedtoinvestinkeytechnologiestoreducecostsandincreaseadoptionafter2030,andseveralhighlightedtheneedtoimprovetheefficiencyofplanningandpermittedoftransmissionandfutureCO2pipelines,alongwithotherkeyareasalreadyidentified.Additionalworkisneededtounderstandimplementationbottlenecksandexplorealternatepolicypathwaysinaniterativefashionthatmobilizesanalysisasstateandfederaldecisionmakerstakethenextstepsforanequitableenergytransition.Forexample,sector-relevantanalysisontheIRAdeploymentoptionscouldhighlightsynergiesandbarrierspresentedNicholasInstituteforEnergy,Environment&Sustainability,DukeUniversity35bythefinancialincentivestructureofthelaw.TheIRAlawauthorizessubstantialfederalloancapitalandloanguarantees(~$369billionintotal)forenergyandtransportationprojectsandbusinesses.ThiscapitalismanagedbytheDOEandisadditionaltaxandotherincentivespresentelsewhereinthelaw.Thisloancapitalandriskdefraymentcouldenablefuturetechnologiesandscaleemergingonesthatotherwisewouldstruggletodevelop.TheDOEwasreviewing77applicationsfor$80billioninloanssoughtbeforetheIRAwassigned,andthepoolofcapitalwillnowgrowsubstantially.Itisvitalthattheseprojectsgalvanizemeaningfulaccelerationtowardnet-zeroandavoidstrandedassetsandwastewhereverpossiblewhilestillkeepingariskappetitethatenablesoccasionalhighandunforeseenrewards.Thisisadifficultbalancetofind,andworkthatenhancesprinciplesforloandeploymentacrossspecifichigh-impactcleanelectricityandelectrificationsectorscouldhelpprioritizeandinformtheuseofbothcapitalandguaranteemeasures.Parallelstatepolicyeffortstoacceleratetheenergytransitioncanalsocreatesynergiesorbarriers.Asdiscussedpreviously,statesaredifferentlysituatedbasedonenergyresources,consumption,andtechnologydeployment.Anacceleratedenergytransitionsrequiresananalysisofstateandregionalcoordinationandimplementationofdiverseenergypolicies,includingtheroleofRTO/ISOcoordination,interstatetransmissioninfrastructureandtransportationcorridors,andinnovativedeploymentforadvancedenergytechnology.Forexample,31statesandtheDistrictofColumbiahaveeitheranRPSorCES.ThirteenpowercompaniessignedalettertotheBidenadministrationinApril2021callingforanationalCES.Over38%ofemissionsfromenergyarepricedintheUSthroughsubnationalinstruments(OECD2021).However,definitionsofcleanenergy,usesforrenewableenergycreditsandsolarrenewableenergycredits,levelsandcoverageofcarbonpricing,andthebroadintentionsofdifferentpolicyinstrumentsrelativetoemissionsreductionsvarywidelyacrossdifferentregulatorysystems.TheserealitiesanddevelopmentscreatethechancetoevaluatethecurrenteffectsofCES,RPS,andcarbonpricinginstrumentsonUSnet-zeroefforts.Analysiscouldextendtoevaluatepotentialeffectsunderscenariosofplausiblechangesandexpansionstotheseinstrumentsinfederalandselectsubnationalforms.Finally,theIRAfundsseveralenvironmentalandclimatejusticeinitiativesthatenhancetheequitydimensionofmitigatingGHGemissions,legacyairpollution,andaccesstoaffordablecleanenergy.Keyprovisionsinclude$27billiontotheGreenhouseGasReductionFund,whichisintendedtoincreaseaccesstolow-costfinanceforcleanenergyprojects,thatprioritizes$7billioninthefirstfundingstreamtolow-incomeandmarginalizedcommunitiestobenefitfromzero-emissiontechnologiesand$3billioninclimatejusticeblockgrantsforcommunity-ledprojectstoaddresslegacyairpollution.Whiletheseinitiativesaresignificant,deeperanalysisisnecessarytoexplorehowdifferenttransitionpathwayscouldaffectvulnerablepopulations.AdvancingModelingforCleanElectricityandElectrificationAllexistingnet-zeroanalysessuggestthatthetransitiontocleanelectricitygenerationisacriticalbuildingblockforbothloweringemissionsfromgenerationitselfandforprovidingtheenergyneededtoelectrifytherestoftheeconomy.Suchelectrificationisneededgiventhatotherapproachestosubstitutingawayfromfossilfuelsandreducingemissionsarelessavailableand/orlesscosteffective.Thereisthereforetheneedtocontinuallyimprovemodelingapproachesforcleanelectricityandelectrificationthatrecognizerelationshipsmorefullyacrossactors,sectors,andpolicies,andrevealopportunitiestoaccelerateUSdecarbonizationtrends.36PathwaystoNet-ZerofortheUSEnergyTransitionThreeessentialareasformthefoundationoffurtherdevelopingthenet-zerooptionsforUSelectricitygenerationandcorrespondingelectrification.First,morerobustdefinitionsofcleanenergygenerationareneededtofacilitateeffectivecomparisonsacrosspolicyinstrumentsandemission-reductionpathways.Windandsolarareuncontroversialinclusions,thoughsitingissuesformaketheirwidersocial,environmentalandequityimplicationsmorevariedandcomplex.Conventionalandadvancedmodularnuclearcreatesquestionsonhowlongexistingunitswilloperateandwhattheprospectsareforfutureinfrastructure.Futurehydroelectricdamscouldbeincludedbasedontheiremissionsfootprintorprohibitedbecauseofwiderecologicalandsocialconcerns.Biomasscreatesquestionsbothaboutitscarboncontentandthehowdemandforbiomassfeedstockscompeteswiththatforliquidbiofuels.Batterystorageandnew,closedlooppumpedhydrostoragebothmayultimatelywarrantfurthermodelingattentionvis-à-viscleanelectricitytrendsandpossibilities.Sotoomightnaturalgasand/orcoalusewithCCUS,whichcreatesquestionsaboutcapturerates,costs,transport,andstorage.Thefutureofhydrogenasacleanfueldependsinpartonhowmuchcanbeusedtocofireeitherturbinesorcombined-cycleunits,newhydrogen-burningturbines,retrofitsofexistingplants,constraintsonusingexcessrenewablegenerationtoelectrolyzewater,andbroaderassumptionsonmethaneleakagefromnaturalgas(whicharealsorelevantbeyondhydrogen).Second,thepaceandscaleoftheelectricitysector’stransitiontonet-zeroemissionswilldependoneconomic,policy,andtechnologyfactors.Adeepassessmentofpathwaysfortheelectricitytransitionshouldincorporateapolicyframeworkthatincludespossiblesubsidiesandtaxcredits(suchasthoseintheIRAlegislation),emissionstargetsbyyear,potentialCO2prices,CESs,RPSs,andanynewregionalpoliciesacrossstates.Expandedmodelingisalsoneededtoadvanceunderstandingofpotentialdemandincreasesassociatedwithelectrification;capitalcostsforrenewables,nuclearandCCUS;naturalgasprices;contributionsofrenewablesandfossilfuelstosystemreliability;amountsofrenewablesbystate;costsofconnectingrenewablestoexistinggridsandofdevelopingadditionaltransmission(includinglong-distance);land-userestrictions;strandedassetcosts;materialcostsfornewconstruction;storagecapacities;andconsumerresponsestoenergypricechanges.End-useconsiderationslikewiseabound,including,forexample,howgrowingheatpumpandelectricresistanceheatingdeploymentwillaffectelectricitysupplyanddemandconsiderations.Broadly,thereisneedtoassessthelevelsofincentiveneededoverlongtimehorizonstoreachazero-carbonelectricitysectorbyagivenyear(e.g.,2040,2045,2050).Conversely,thereisalsothepotentialtoexplorehigh-costand/orconstrainedfossilfuelsupplyscenariosthatcouldbetterilluminatetheriskswithcontinuedrelianceoncoalandgas.Third,giventhatthereisunlikelytobeasinglecorrectforecastofEVadoption(andotherelectrifiedsectors),thebestoptionforanyanalysismaybetoevaluatearangeofpossibleoutcomesasacomponentofnet-zeropolicies.Thisapproachallowsadditionalinformationsuchaspolicydecisionsand/orfinancialsupportforchargingstationstoinfluenceEVsalestrends—nottypicallypartofacost-optimizationmodelingframeworksuchasthoseusedtoforecastelectricitysectorbehavior.Othertrendscanalsobeconsideredthroughmodeling,suchasdifferentestimatesofvehiclecostsorsalesforecastsfromvehiclemanufacturers.NicholasInstituteforEnergy,Environment&Sustainability,DukeUniversity37LeveragingCross-SectoralExpertisefromLeadingPrivateSectorandKnowledgePartnerVoicestoAcceleratetheEnergyTransitionEnergyPathwaysUSAisdesignedtobringtogetherarangeoforganizationsandsectors,includingenergyproducers,carbon-constrainedindustries,technologyproviders,finance,transportation,andelectricutilities,allofwhomplaysignificantrolesintheenergytransitionandhavecriticalinsightsintoenergysystemconstraintsandsynergies.Thisdiversityofperspectiveandpartners’deepexpertiseinformsourworkthroughin-depthexchangesonthefullenergysystemandenablestheanalysestoreflectthemultiplicityofenergysystemaccelerationpaths.Knowledgepartnersandcontributorsarecommittedtohelpacceleratetheenergytransitiontonet-zerocarbonemissionsby2050.Byengagingindialoguefoundedonrobustpolicy,technology,andmodelinganalyses,partnersarestress-testingenergytransitionpathwaystobuildasystems-levelfluencyandoperationalrealityintodevelopedenergytransitionpathways.NextStepsTheEnergyPathwaysUSApartnershipwillbuildonthefindingsandplansoutlinedinthisreporttoprovideaseriesoffutureknowledgeproductsgearedtowardacceleratingnet-zeroprogressintheUnitedStates.Workingwithmembersthroughouttocreatetheseproducts,theEnergyPathwaysUSAteamwillseektractionfortheirfindingsinpublicandprivatespheres.Thiscontinuousprocessofcocreationwillbuildonthemomentumofcurrentnet-zeroeffortsintheUS,andleadtooutcomesbothintendedandunforeseen.Onlythroughsuchcollaborationscannet-zerogoalsthataredecadesinthefuturedrivetheurgentchangethatisneedednow.38PathwaystoNet-ZerofortheUSEnergyTransitionREFERENCESAEIC.2021.“AEICScalingInnovationProject:TechnologyDemonstrationCaseStudySeries.”AmericanEnergyInnovationCouncil,July1,2021.https://americanenergyinnovation.org/project/aeic-scaling-innovation-project/.Ameresco.2022.BeyondHydrogen:RenewableNaturalGasandDeepDecarbonization.Framingham,MA:Ameresco.https://19545844.fs1.hubspotusercontent-na1.net/hubfs/19545844/White%20papers/Ameresco-RNG-report.pdf.Boudette,N.,andC.Davenport.2021.“G.M.WillSellOnlyZero-EmissionVehiclesby2035.”TheNewYorkTimes,January28,2021.https://www.nytimes.com/2021/01/28/business/gm-zero-emission-vehicles.html.BPC.2021.TheCaseforFederalSupporttoAdvanceDirectAirCapture.Washington,DC:BipartisanPolicyCenter.https://bipartisanpolicy.org/download/?file=/wp-content/uploads/2021/06/BPC_FederalCaseForDAC-final.pdf.Brown,J.2021.TheRoleofNaturalGasinDecarbonizingtheU.S.EnergyandIndustrialEconomy.Arlington,VA:CenterforClimateandEnergySolutions.https://www.c2es.org/wp-content/uploads/2021/07/C2ES-Natural-Gas-Report_FINAL.pdf.CaliforniaAirResourcesBoard.n.d.“Low-EmissionVehicleProgram.”AccessedOctober3,2022.https://ww2.arb.ca.gov/our-work/programs/low-emission-vehicle-program.CBO.2022.TheBudgetandEconomicOutlook:2022to2032.Washington,DC:CongressionalBudgetOffice.https://www.cbo.gov/system/files/2022-05/57950-Outlook.pdf.CDP.2022.CDPTechnicalNote:Biofuels.London:CDPGlobal.https://cdn.cdp.net/cdp-production/cms/guidance_docs/pdfs/000/003/647/original/CDP-technical-note-on-biofuels.pdf?1651855056.CenterforClimateandEnergySolutions.n.d.“StateClimatePolicyMaps.”AccessedOctober3,2022.https://www.c2es.org/content/state-climate-policy/.CEQ.2020.EnvironmentalImpactStatementTimelines(2010-2018).Washington,DC:ExecutiveOfficeofthePresident,CouncilonEnvironmentalQuality.https://ceq.doe.gov/docs/nepa-practice/CEQ_EIS_Timeline_Report_2020-6-12.pdf.Cleary,K.2022.Electrification101.Washington,DC:ResourcesfortheFuture.https://www.rff.org/publications/explainers/electrification-101/.CommonwealthofVirginia.2020.HB1526,ElectricUtilityRegulation;EnvironmentalGoals(“VirginiaCleanEconomyAct”).2020SessionoftheVirginiaGeneralAssembly.https://lis.virginia.gov/cgi-bin/legp604.exe?201+sum+HB1526.DOE.2022a.America’sStrategytoSecuretheSupplyChainforaRobustCleanEnergyTransition:U.S.DepartmentofEnergyResponsetoExecutiveOrder14017,“America’sSupplyChains.”Washington,DC:DepartmentofEnergy.https://www.energy.gov/sites/default/files/2022-02/America%E2%80%99s%20Strategy%20to%20Secure%20the%20Supply%20Chain%20for%20a%20Robust%20Clean%20Energy%20Transition%20FINAL.docx_0.pdf.DOE.2022b.IndustrialDecarbonizationRoadmap.Washington,DC:DepartmentofEnergy.https://www.energy.gov/sites/default/files/2022-09/Industrial%20Decarbonization%20Roadmap.pdf.E3.2022.TheRoleofGasDistributionCompaniesinAchievingtheCommonwealth’sClimateNicholasInstituteforEnergy,Environment&Sustainability,DukeUniversity39Goals.SanFrancisco:Energy+EnvironmentalEconomics.https://fileservice.eea.comacloud.net/FileService.Api/file/FileRoom/14633269.EIA.2022.“ReferenceCaseProjectionsTables”AnnualEnergyOutlook2022,March3,2022.Washington,DC:USEnergyInformationAdministration.https://www.eia.gov/outlooks/aeo/tables_ref.php.EPA.2022.InventoryofU.S.GreenhouseGasEmissionsandSinks,1990–2020.Washington,DC:USEnvironmentalProtectionAgency.https://www.epa.gov/system/files/documents/2022-04/us-ghg-inventory-2022-main-text.pdf.EPRI.2022.LCRINet-Zero2050:U.S.Economy-WideDeepDecarbonizationScenarioAnalysis.PaloAlto,CA:ElectricPowerResearchInstitute,Inc.https://lcri-netzero.epri.com/en/description-intro.html.ETC.2019.MissionPossibleSectoralFocus:HeavyRoadTransport.London:EnergyTransitionCommission.https://www.energy-transitions.org/publications/mission-possible-sectoral-focus-heavy-road-transport/.ETC.2020.MakingMissionPossible:DeliveringaNet-ZeroEconomy.London:EnergyTransitionCommission.https://www.energy-transitions.org/publications/making-mission-possible/.ExecutiveOfficeofthePresident.2021.“ExecutiveOrder14008ofJanuary27,2021,TacklingtheClimateCrisisatHomeandAbroad.”FederalRegister86(19):7619–33.https://www.whitehouse.gov/briefing-room/presidential-actions/2021/01/27/executive-order-on-tackling-the-climate-crisis-at-home-and-abroad/.Garg,A.,andM.M.Weitz.2019.“StationaryCombustion.”In2019Refinementtothe2006IPCCGuidelinesforNationalGreenhouseGasInventories,2.1-2.5.Geneva:IntergovernmentalPanelonClimateChange.https://www.ipcc-nggip.iges.or.jp/public/2019rf/pdf/2_Volume2/19R_V2_2_Ch02_Stationary_Combustion.pdf.IEA.2021.NetZeroby2050:ARoadmapfortheGlobalEnergySector.Paris:InternationalEnergyAgency.https://www.iea.org/reports/net-zero-by-2050.Igleheart,A.2022.“StatePoliciesPromotingHybridandElectricVehicles.”NationalConferenceofStateLegislatures,April26,2022.AccessedOctober3,2022.https://www.ncsl.org/research/energy/state-electric-vehicle-incentives-state-chart.aspx.IPCC.2022.ClimateChange2022:MitigationofClimateChange.Geneva:IntergovernmentalPanelonClimateChange.https://www.ipcc.ch/report/ar6/wg3/.Ip,G.2022.“InflationReductionAct’sRealClimateImpactIsaDecadeAway.”TheWallStreetJournal,August24,2022.https://www.wsj.com/articles/inflation-reduction-acts-real-climate-impact-is-a-decade-away-11661342401.Jenkins,J.D.,E.N.Mayfield,J.Farbes,R.Jones,N.Patankar,Q.Xu,andG.Schivley.2022.PreliminaryReport:TheClimateandEnergyImpactsoftheInflationReductionActof2022.Princeton,NJ:REPEATProject.https://repeatproject.org/docs/REPEAT_IRA_Prelminary_Report_2022-08-04.pdf.Kavlak,G.,J.McNerney,andJ.Trancik.2018.“EvaluatingtheCausesofCostReductioninPhotovoltaicModules.”EnergyPolicy123:700–10.doi:10.1016/j.enpol.2018.08.015.Larsen,J.,B.King,H.Kolus,N.Dasari,G.Hiltbrand,andW.Herndon.2022.ATurningPointforUSClimateProgress:AssessingtheClimateandCleanEnergyProvisionsintheInflationReductionAct.NewYork:RhodiumGroup.https://rhg.com/research/climate-clean-energy-inflation-reduction-act/.40PathwaystoNet-ZerofortheUSEnergyTransitionLarson,E.,C.Greig,J.Jenkins,E.Mayfield,A.Pascale,C.Zhang,J.Drossman,R.Williams,S.Pacala,R,Socolow,E.Baik,R.Birdsey,R.Duke,R.Jones,B.Haley,E.Leslie,K.Paustian,andA.Swan.2021.Net-ZeroAmerica:PotentialPathways,Infrastructure,andImpacts.Princeton,NJ:PrincetonUniversity.https://netzeroamerica.princeton.edu/the-report.Mahajan,M.,O.Ashmoore,J.Rissman,R.Orvis,andA.Gopal.2022.ModelingtheInflationReductionActUsingtheEnergyPolicySimulator.SanFrancisco:EnergyInnovationPolicy&TechnologyLLC.https://energyinnovation.org/wp-content/uploads/2022/08/Modeling-the-Inflation-Reduction-Act-with-the-US-Energy-Policy-Simulator_August.pdf.NAS.2021.AcceleratingDecarbonizationoftheU.S.EnergySystem.Washington,DC:TheNationalAcademiesPress.https://nap.nationalacademies.org/catalog/25932/accelerating-decarbonization-of-the-us-energy-system.NationalGrid.2022.OurCleanEnergyVision:AFossil-FreeFutureforCleanlyHeatingHomesandBusinesses.Waltham,MA:NationalGridUSAServiceCompany,Inc.https://www.nationalgrid.com/document/146251/download.OECD.2021.“CarbonPricinginTimesofCOVID-19.”OrganisationforEconomicCo-operationandDevelopment.AccessedOctober3,2022.https://www.oecd.org/tax/tax-policy/carbon-pricing-united-states.pdf.OfficeofGovernorGavinNewsom.2022.“GovernorNewsomStatementonBidenAdministration’sRestorationofCalifornia’sCleanCarWaiver.”StateofCalifornia,March09,2022.https://www.gov.ca.gov/2022/03/09/governor-newsom-statement-on-biden-administrations-restoration-of-californias-clean-car-waiver/.OMB.2021.BudgetoftheU.S.Government,FiscalYear2022.Washington,DC:USGovernmentPublishingOffice.https://www.whitehouse.gov/wp-content/uploads/2021/05/budget_fy22.pdf.TheWhiteHouse.2021a.“FactSheet:PresidentBidenSets2030GreenhouseGasPollutionReductionTargetAimedatCreatingGood-PayingUnionJobsandSecuringU.S.LeadershiponCleanEnergyTechnologies.”TheWhiteHouse,April22,2021.https://www.whitehouse.gov/briefing-room/statements-releases/2021/04/22/fact-sheet-president-biden-sets-2030-greenhouse-gas-pollution-reduction-target-aimed-at-creating-good-paying-union-jobs-and-securing-u-s-leadership-on-clean-energy-technologies/.TheWhiteHouse.2021b.TheUnitedStatesofAmericaNationallyDeterminedContribution:ReducingGreenhouseGasesintheUnitedStates:A2030EmissionsTarget.Washington,DC:TheWhiteHouse.https://unfccc.int/sites/default/files/NDC/2022-06/United%20States%20NDC%20April%2021%202021%20Final.pdf.TheWhiteHouse.2022.“PresidentBiden’sFY2023BudgetReducesEnergyCosts,CombatstheClimateCrisis,andAdvancesEnvironmentalJustice.”TheWhiteHouse,March28,2022.https://www.whitehouse.gov/omb/briefing-room/2022/03/28/president-bidens-fy-2023-budget-reduces-energy-costs-combats-the-climate-crisis-and-advances-environmental-justice/.Ritchie,H.2019.“WhohasContributedMosttoGlobalCO2Emissions?”OurWorldinData,October01,2019.https://ourworldindata.org/contributed-most-global-co2.NicholasInstituteforEnergy,Environment&Sustainability,DukeUniversity41Webb,R.M.2022.“Surprise:InflationReductionActMakesOilandGasDevelopmentonFederalLandLessAttractive.”ColumbiaLawSchoolClimateLawBlog,August17,2022.https://blogs.law.columbia.edu/climatechange/2022/08/17/surprise-inflation-reduction-act-makes-oil-and-gas-development-on-federal-land-less-attractive/.Zhou,E.,andT.Mai.2021.ElectrificationFuturesStudy:OperationalAnalysisofU.S.PowerSystemswithIncreasedElectrificationandDemand-SideFlexibility.Golden,CO:NationalRenewableEnergyLaboratory.NREL/TP-6A20-79094.https://www.nrel.gov/docs/fy21osti/79094.pdf.42PathwaystoNet-ZerofortheUSEnergyTransitionAPPENDIX:GLOBALNET-ZEROANALYSESANDPROJECTIONSIPCCTheIPCCrecentlyreleasedtheirSixthAssessmentReport:ClimateChange2022:MitigationofClimateChange,whichexaminestheliteraturefromawiderangeofdisciplinesondifferentaspectsofclimatechangemitigation(IPCC2022).Thereport’sintegrated-assessmentmodelinglookedateightgroupsofemissionsscenariostoevaluatepotentiallikelihoodofexceedingstatedgoalsforglobalwarminglevels(bothpeakandby2100)—onlythreeofwhichresultinwarmingof2°Corlessintheyear.AllthreeofthesecategoriesareexpectedtoinvolverapidandsignificantreductionsinGHGemissionsacrosstheglobaleconomies,inmostcasesimplyingthatglobalGHGemissionshavetopeakby2025.Neithercurrentlyproposedpoliciesnorpotentialmodestactionscomeclosetocontainingglobaltemperatures.Anysuccessfulstrategiesarelikelytorequirenet-negativeemissionsgloballyby2100,ifnotbefore.WithinIPCC’sbroadcategoriesofpotentialemissionstrends,severalIllustrativeMitigationPathways(IMP)wereexaminedtoseehowdifferentcombinationsofsectoralmitigationstrategiesmightaffecthowandwheretheemissionsreductionswouldoccur.InFigureA1,“CurPol”iscurrentpolicies,“ModAct”ismoderateaction,“IMP-GS”isgradualstrengthening,“IMP-Neg”isnet-negativeemissionsinenergyandindustrythroughCCUS,“IMP-LD”islowenergydemand,“IMP-Ren”isheavyuseofrenewables,and“IMP-SP”isinclusionofsustainabledevelopmentgoals.ThefigurecontrastsglobalGHGemissionsin2019totheremainingsectoralcontributionswhennet-zeroCO2emissionsisreached.Itdistinguishesbetweendirectenergyemissionsandindirectemissions.InmostoftheIMGscenarios,non-CO2emissionsarestillrelativelyhighacrosstheapproaches.Asidefromthescenariowithheavyuseofrenewables,carbonsinksareessentialinreachingnet-zero,asisalsolikelythecaseforsomenetnegativeemissionsacrossenergyindustries.Harder-to-abatecomponentsoftheindustrialandtransportsectorscontinuetobeamongthelargestlikelyemissionssources.TheliteratureusedintheIPCCSixthAssessmentReport,however,ismoreoptimisticonthecostsofemissionsreductionsthanthelikelihoodofachievingthem.FigureA2presentsestimatesofGHGreductionopportunitiesforadetailedlistofsourcesandcategorizesthembycosts.Manyreductionshavenetlifetimecoststhatarelowerthanthoseofthealternativetechnologiesbeingusedinthereferencecasetrends.Windandsolarenergyareestimatedtobeparticularlycost-effectivecomparedtofossilgenerationcurrentlyinuse.Otherareasinlighting,energyefficiency,andLDVsalsohavethepotentialforsignificantlow/negativecostemissionsreductions.Industrialsourcesandagriculture/landuseareontheoppositeendofthespectrum,withpotentiallymuchhigherabatementcostsperton.Takingthesecostsintoconsideration,IPCCfindsthatmitigationpathwayslikelytolimitwarmingto2°ChaveglobalGDPlossesof1.3%to2.7%in2050(CO2pricesofaround$90/tonin2030and$210/tonin2050,withsubstantialvariabilityaroundthesecentralestimates).Limitingwarmingto1.5°Cwithlimited/noovershootoftemperaturesisassociatedwithGDPlossesof2.6%to4.2%in2050(centralCO2pricesofaround$220/tonin2030and$630/tonin2050).However,IPCCestimatesthat—iftheeconomicimpactsof2°Cofwarmingareonthemoderatetohighendofthepotentialrange—theglobalbenefitsoftheemissionsreductionspathwayswillexceedtheglobalmitigationcostsoverthetwenty-firstcentury(evenwithoutaccountingforthebenefitsfromsustainabledevelopment,nonmarketdamagesofclimatechange,oranyimprovementsinhumanNicholasInstituteforEnergy,Environment&Sustainability,DukeUniversity43health).Thesecostsandbenefitsvarywidelybyregion,dependingonpolicyimplementationandinternationalcooperation.EnergyTransitionsCommissionAspartofaseriesofreports,theEnergyTransitionsCommissionreleasedMakingMissionPossible:DeliveringaNet-ZeroEconomy(ETC2020),whichexaminedchallengestoloweringemissionsinhard-to-abatesectorsoftheeconomyincludingcement,steel,plastics,heavyroadtransport,shipping,andaviation.Thisglobalanalysisconcludedthatthetechnologiesneededtodecarbonizehard-to-abatesectorsareeitherknownorindevelopment,anditestimatedthatfulldecarbonizationoftheworld’seconomieswouldcostlessthan0.5%ofglobalGDP.Threekeystotransformingtheenergysystemby2050areidentified:(1)massivecleanelectrificationthatresultsin70%offinalenergyusebeingfulfilledbyzero-carbonelectricity;(2)transitiontoahydrogeneconomywhereelectrificationislesssuitable,leadingtohydrogensupplyingmorethan10%ofenergyneeds;and(3)carboncaptureandstorageoruse(CCS/U)forbioenergyandanyremainingfossilfuels.Asinotherreports,acriticalcomponentoftheirrecommendedapproachisimprovingefficiencyinenergy(e.g.,improvedheating,vehicles,andindustry),materials(recyclingandimprovedmaterials),andservices(betterutilizationofservices,demandreductions,andbehavioralchanges).Thereportestimatesthatitispossibletolowerenergydemandsby30%in2050throughthesemeasures.InthisglobalanalysisbytheEnergyTransitionsCommission,seaandairtransportconsumemuchoftheliquidfuels,whilesurfacetransportationismostlyelectrifiedasidefromsomeheavytransportthatuseshydrogen.Mostindustrialusesareelectrified,butheavyenergy-intensiveFigureA1.GHGemissionsbysectoratnet-zeroCO2(andrelativecontributions)Source:IPCC(2022),FigureSPM.5(ef).44PathwaystoNet-ZerofortheUSEnergyTransitionFigureA2.Emissionsabatementcostsandquantitiesavailablebysectorin2030Source:IPCC(2022)FigureSPM.7.NicholasInstituteforEnergy,Environment&Sustainability,DukeUniversity45industriesusemuchoftheavailablehydrogenwhilesomemanufacturingsectorswouldmakeuseofcarboncaptureintheirprocesses.Buildingspaceheatandotheroperationssuchasspacecooling,waterheating,andcookingarelargelyelectrifiedby2050.IEANetZeroby2050IEAanalyzedonepotentialglobalpathwayformeetingnet-zeroCO2emissionsgoalsby2050,consistentwithlimitingwarmingto1.5°CintheirreportNetZeroby2050:ARoadmapfortheGlobalEnergySector(IEA2021).Broadly,itsconclusionwasthatthepathwayisnarrowandthatsuccesswoulddependonunprecedentedadoptionofcleantechnologiesby2030.ThefocusofthereportwasonCO2emissionsfromtheenergysector—nooffsetsoutsideofenergyindustrieswereallowedbecauseofconcernsaboutpermanenceandoffsetavailabilityunderaglobalapproach.Thereport’spathwayalsohascomparativelylimitedrelianceonnegativeemissionstechnologiestolowerGHG,relativetootherreports(IEAhas1.9gigatonsofCO2capturefrombioenergywithcarboncaptureandstorageanddirectaircarboncaptureandstoragein2050,comparedwithIPCCscenariosthatrangebetween3.5–15gigatonsby2050).Thebiggesttechnologyopportunitiesidentifiedwereinadvancedbatteries,hydrogenelectrolyzers,andDAC.Emissionssavingsfrombehavioralchangesaveragedaround5%oftotalreductions;however,thesesavingscameinsomepotentiallyhard-to-abatesectorssuchasaviation.Keyuncertaintiesidentifiedinthenet-zeropathwayweretheavailabilityanduseofbioenergy,CCUS,andthepotentialextentofbehavioralchanges.AsummaryofthemainIEAconclusionsisasfollows:•Behavioralchangesoffsetone-thirdofthegrowthinenergydemandbetween2020–2050.•Thelargestandearliestopportunitiesareinwindandsolargeneration.By2050,thesesourcessupplymorethanone-thirdofallenergyconsumed.•EVsarealsoimportantandearlycontributorstoemissionsreductions.•Hydrogenplaysanimportantrolebetween2030and2050.•Efficiencycontributionsaresignificant,butdon’tincreasemuchafter2035.•Modernbioenergyrepresents20%ofallenergysuppliesby2050.Bioenergy(coupledwithCCUSwherepossible)expandslandusefrom330millionhectaresin2020to410millionhectaresby2050.•Thereisnoassumedexpansionofcroplandforbioenergy.•Therearenobioenergycropsallowedoncurrentlyforestedland.•Biofueluseintransportationis50%ofthesizeofEVs’contributiontotransportation.•CCUSgrowsrapidlyafter2030,particularlyfromnaturalgas.By2050,almostone-halfofthe7.6gigatonsofCO2capturedisfromfossilfuels,comparedwith20%fromindustrialsourcesand30%frombioenergyuse.LimitingtheuseofCCUSwouldrequiresignificantadditionalexpansioninwindandsolargeneration,combinedwithelectrolyzercapacity.•Theremainingunabatedfossilemissions(1.7gigatonsCO2in2050)aremorethanfullyoffsetbyBECCSandDACCS.46PathwaystoNet-ZerofortheUSEnergyTransitionIEAlaysoutasetofkeymilestonestobeachievedonthepathtowardnet-zeroemissionsby2050.Thereportdoesnotprovidecountry-specificactions,butgenerallyassumesthat“advancedeconomies”(includingtheUnitedStates)havethetechnologyandresourcestomovemoreaggressivelythanothernations.AmongthehighlightsrelevantfortheUnitedStatesbetween2030and2050are:•2030•Emissionsreductionscomefrom:behavioralchanges(5%),currenttechnologies(80%),andtechnologiesunderdevelopment(15%)•Coalplantswithoutcarboncapturehavebeenphasedout(advancedeconomies)•Largeexpansionofannualwindandsolarinstallations(1,020GWglobally)•60%ofcarsalesareEVs(globally;presumablytheUSishigher)•Allnewbuildingsarezero-carbon-ready•Expansionoflow-carbonhydrogen(150megatonsgloballyfrom850GWofelectrolyzers)•2035•Net-zeroemissionsfromelectricitygeneration(advancedeconomies)•Nonewsalesofinternalcombustionenginecars(globally)•50%ofheavytrucksalesareelectric(globally)•2040•50%ofaviationfuelsarelowemissions(globally)•Globalnet-zeroemissionsfromelectricitygeneration(includingdevelopingcountries)•2,400GWofelectrolyzercapacity(globally)•50%ofexistingbuildingsareretrofittobezero-carbon-ready(globally)•2050•Emissionsreductionscomefrom:behavioralchanges(5%),currenttechnologies(50%),andtechnologiesunderdevelopment(45%)•Morethan90%ofheavyindustryproductionislow-emissions(globally)•520megatonsoflow-carbonhydrogenannually,comparedtototalsupplyof87megatonsin2020•7.6gigatonsofCO2arecapturedannually(globally)•Thefinalenergymixforlow-emissionssourcesin2050isaround20%fossilfuelswithcarboncapture,someincreaseinnuclearandhydroelectric,andthebalance(>60%)inrenewablesIEAchieflyconcentratesononepossiblepathwaytonet-zeroemissions,thoughthereissomelimiteddiscussionofkeyalternativesanduncertainties.Thereport’snet-zeroemissionstrendswereestimatedwiththeIEAWorldEnergyModel,alarge-scalesimulationmodelwithintheIEA’sannualWorldEnergyOutlookforecasts.Themodelingfocusedonnet-zeroCO2energy-relatedandindustrialprocessemissionsby2050andhadsomeconsiderationofmethaneemissionsfromtheenergysector,butnodetailonotheremissionssourcesortypesofGHG.Themodelingassumesallcountriescooperatetoreachnet-zeroglobally,basedoneconomicdevelopmentandNicholasInstituteforEnergy,Environment&Sustainability,DukeUniversity47equityconcerns.Thescenarioapproachisdesignedtoaimforanorderlytransitionthatminimizesstrandedassetsandvolatilityinenergymarkets.Evaluationofthemodelingresultsandassumptionsthatdrivethemiscomplicatedforseveralreasons.First,detailedgrowthassumptionsandresultsforenergysupply,demand,andelectricitygenerationareonlyavailableatagloballevel.Morechallengingisthefactthatmuchoftheanalysisisdrivenbyexternallyimposedconditions,whichmakesithardtounderstandkeyissuesfromamodelingperspective.Amongtheseimposed(andnotalwayswell-specified)assumptionsareasfollows:•Nonewcoal,oil,orgasdevelopment(thus,fuelpricesdeclinewithoperatingcostsofexistingfields)•Anypotentialdemandincreaseforfossilfuelsfromlowpricesispreventedbyotherpolicies•CO2pricesareassumedglobally•Developedcountriesstartat$75/tonin2025andriseto$250/tonby2050•Somemidtiercountriesstartat$45/tonin2025andriseto$200/tonby2050•Otheremergingmarketsstartat$3/tonin2025andriseto$55/tonby2050•A“broadrange”ofotherpoliciesarealsomandatedtoreduceemissions(levelsarenotspecified)•Renewablefuelmandates•Efficiencystandards•R&Dsupports,marketreforms,eliminationoffossil-fuelsubsidies•Manyotherconditionsarealsoimposed(e.g.,restrictionsonsalesofinternalcombustionenginevehiclesandmandatesforliquidbiofuels/synfuelsinaviation)48PathwaystoNet-ZerofortheUSEnergyTransitionAuthorAffiliationsJacksonEwing,SeniorFellow,NicholasInstituteforEnergy,Environment&Sustainability,DukeUniversityMartinRoss,SeniorResearchEconomist,NicholasInstituteforEnergy,Environment&Sustainability,DukeUniversityAmyPickle,DirectorofStatePolicyProgram,NicholasInstituteforEnergy,Environment&Sustainability,DukeUniversityRobertStout,SeniorFellow(Non-Resident),NicholasInstituteforEnergy,Environment&Sustainability,DukeUniversityBrianMurray,Director,NicholasInstituteforEnergy,Environment&Sustainability,DukeUniversityCitationEwing,Jackson,MartinRoss,AmyPickle,RobertStout,andBrianMurray.2022.PathwaystoNet-ZerofortheUSEnergyTransition.NIR22-06.Durham,NC:DukeUniversity.PublishedbytheNicholasInstituteEnergy,Environment&Sustainabilityin2022.AllRightsReserved.PublicationNumber:NIR22-06NicholasInstituteforEnergy,Environment&SustainabilityTheNicholasInstituteforEnergy,Environment&SustainabilityadvancesDukeUniversity’seffortstobuildamoresustainableworld,workingcloselywithDukeschoolsandotherunits.TheNicholasInstitutedevelopstransformativeeducationalexperiences;galvanizesandconductsimpactfulresearch;andengageswithkeydecisionmakersattheglobal,national,state,andlocallevels.TheNicholasInstitute’steamofeconomists,scientists,lawyers,andpolicyexpertshasdevelopedastrongreputationfordeliveringtimely,credibleanalysisandforconveningdecisionmakerstoadvanceactionablesolutionstopressingenergyandenvironmentalchallenges.EnergyPathwaysUSAEnergyPathwaysUSA,anautonomousregionalinitiativeoftheglobalEnergyTransitionsCommission,workswithleadingprivatesectorcompanies,publicbodies,nongovernmentalorganizations,andthoughtleaderstoadvancetheUSnet-zeroagenda.ConvenedbytheNicholasInstituteforEnergy,Environment&SustainabilityatDukeUniversity,EnergyPathwaysUSAbringstogetherexpertsfromdiversesectorsandorganizationstoexploreandanalyzecurrentandproposedfederal,state,andregionalpolicyincentivesandthebroadrangeoftheirpotentialimpacts,includingonemissions,costs,technology,andconsumerbehavior.Byadvancingcross-sectoraldialoguebasedonrobustpolicy,technology,andmodelinganalyses,thispartnershipaimstodevelopactionablepathwaystoaccelerateanequitableenergytransition.Copyright©2022NicholasInstituteforEnergy,Environment&Sustainability,DukeUniversitynicholasinstitute.duke.eduContactNicholasInstituteDukeUniversityP.O.Box90467Durham,NC277081201PennsylvaniaAvenueNWSuite500Washington,DC20004919.613.1305nicholasinstitute@duke.edu

1、当您付费下载文档后,您只拥有了使用权限,并不意味着购买了版权,文档只能用于自身使用,不得用于其他商业用途(如 [转卖]进行直接盈利或[编辑后售卖]进行间接盈利)。
2、本站所有内容均由合作方或网友上传,本站不对文档的完整性、权威性及其观点立场正确性做任何保证或承诺!文档内容仅供研究参考,付费前请自行鉴别。
3、如文档内容存在违规,或者侵犯商业秘密、侵犯著作权等,请点击“违规举报”。

碎片内容

碳中和
已认证
内容提供者

碳中和

确认删除?
回到顶部
微信客服
  • 管理员微信
QQ客服
  • QQ客服点击这里给我发消息
客服邮箱