绿色资本支出:绿色通货膨胀、回报与机遇(英)-高盛VIP专享VIP免费

Greenflation, Returns and Opportunity
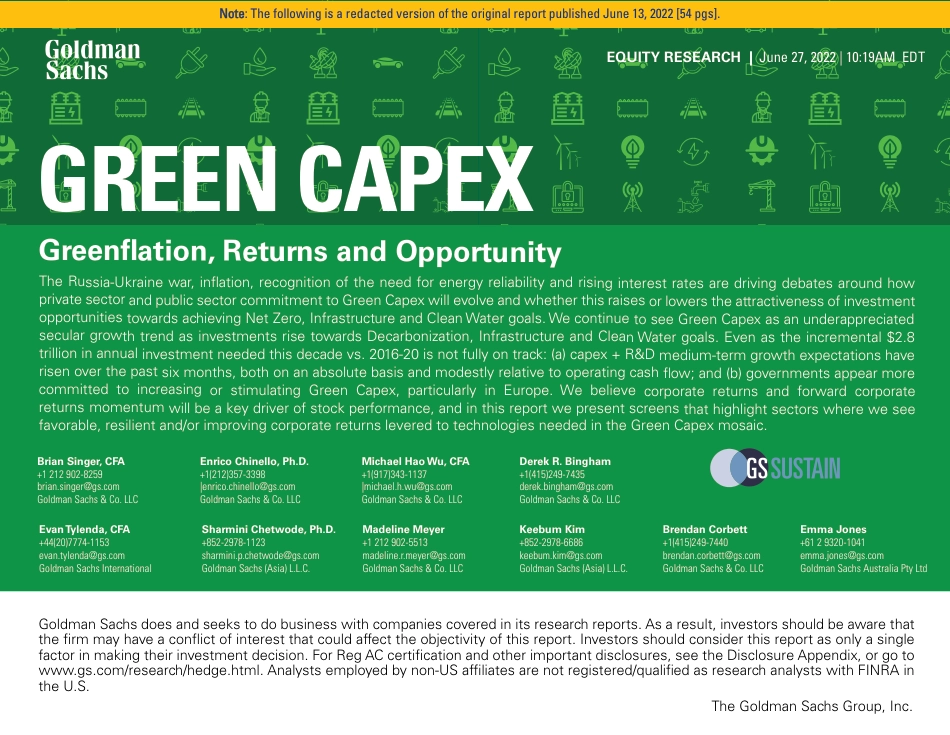
The Russia-Ukraine war, ination, recognition of the need for energy reliability and rising interest rates are driving debates around how
private sector and public sector commitment to Green Capex will evolve and whether this raises or lowers the attractiveness of investment
opportunities towards achieving Net Zero, Infrastructure and Clean Water goals. We continue to see Green Capex as an underappreciated
secular growth trend as investments rise towards Decarbonization, Infrastructure and Clean Water goals. Even as the incremental $2.8
trillion in annual investment needed this decade vs. 2016-20 is not fully on track: (a) capex + R&D medium-term growth expectations have
risen over the past six months, both on an absolute basis and modestly relative to operating cash ow; and (b) governments appear more
committed to increasing or stimulating Green Capex, particularly in Europe. We believe corporate returns and forward corporate
returns momentum will be a key driver of stock performance, and in this report we present screens that highlight sectors where we see
favorable, resilient and/or improving corporate returns levered to technologies needed in the Green Capex mosaic.
Goldman Sachs does and seeks to do business with companies covered in its research reports. As a result, investors should be aware that
the firm may have a conflict of interest that could affect the objectivity of this report. Investors should consider this report as only a single
factor in making their investment decision. For Reg AC certification and other important disclosures, see the Disclosure Appendix, or go to
www.gs.com/research/hedge.html. Analysts employed by non-US affiliates are not registered/qualified as research analysts with FINRA in
the U.S.
EQUITY RESEARCH | June 27, 2022 | 10:19AM EDT
The Goldman Sachs Group, Inc.
GREEN CAPEX
Enrico Chinello, Ph.D.
+1(212)357-3398
|enrico.chinello@gs.com
Goldman Sachs & Co. LLC
Brian Singer, CFA
+1 212 902-8259
brian.singer@gs.com
Goldman Sachs & Co. LLC
Derek R. Bingham
+1(415)249-7435
derek.bingham@gs.com
Goldman Sachs & Co. LLC
Michael Hao Wu, CFA
+1(917)343-1137
|michael.h.wu@gs.com
Goldman Sachs & Co. LLC
Sharmini Chetwode, Ph.D.
+852-2978-1123
sharmini.p.chetwode@gs.com
Goldman Sachs (Asia) L.L.C.
Evan Tylenda, CFA
+44(20)7774-1153
evan.tylenda@gs.com
Goldman Sachs International
Madeline Meyer
+1 212 902-5513
madeline.r.meyer@gs.com
Goldman Sachs & Co. LLC
Keebum Kim
+852-2978-6686
keebum.kim@gs.com
Goldman Sachs (Asia) L.L.C.
Brendan Corbett
+1(415)249-7440
brendan.corbett@gs.com
Goldman Sachs & Co. LLC
Emma Jones
+61 2 9320-1041
emma.jones@gs.com
Goldman Sachs Australia Pty Ltd
Note: The following is a redacted version of the original report published June 13, 2022 [54 pgs].
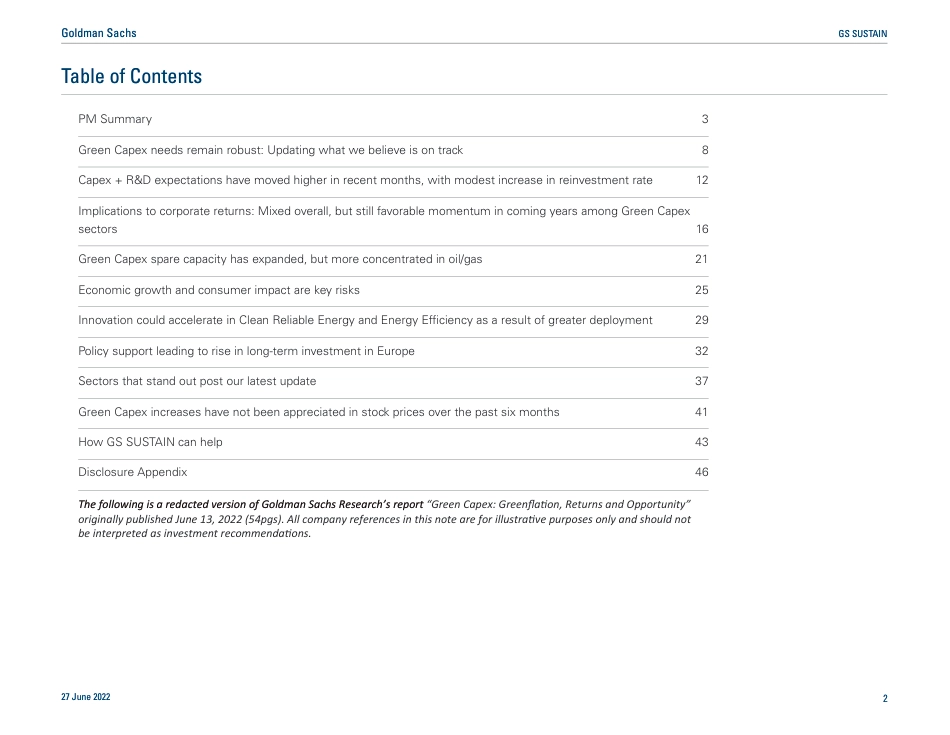
PM Summary 3
Green Capex needs remain robust: Updating what we believe is on track 8
Capex + R&D expectations have moved higher in recent months, with modest increase in reinvestment rate 12
Implications to corporate returns: Mixed overall, but still favorable momentum in coming years among Green Capex
sectors 16
Green Capex spare capacity has expanded, but more concentrated in oil/gas 21
Economic growth and consumer impact are key risks 25
Innovation could accelerate in Clean Reliable Energy and Energy Efficiency as a result of greater deployment 29
Policy support leading to rise in long-term investment in Europe 32
Sectors that stand out post our latest update 37
Green Capex increases have not been appreciated in stock prices over the past six months 41
How GS SUSTAIN can help 43
Disclosure Appendix
46
The following is a redacted version of Goldman Sachs Research’s report Green Capex: Greenaon, Returns and Opportunity”
originally published June 13, 2022 (54pgs). All company references in this note are for illustrave purposes only and should not
be interpreted as investment recommendaons.
27 June 2022 2
Goldman Sachs GS SUSTAIN
Table of Contents
PM Summary
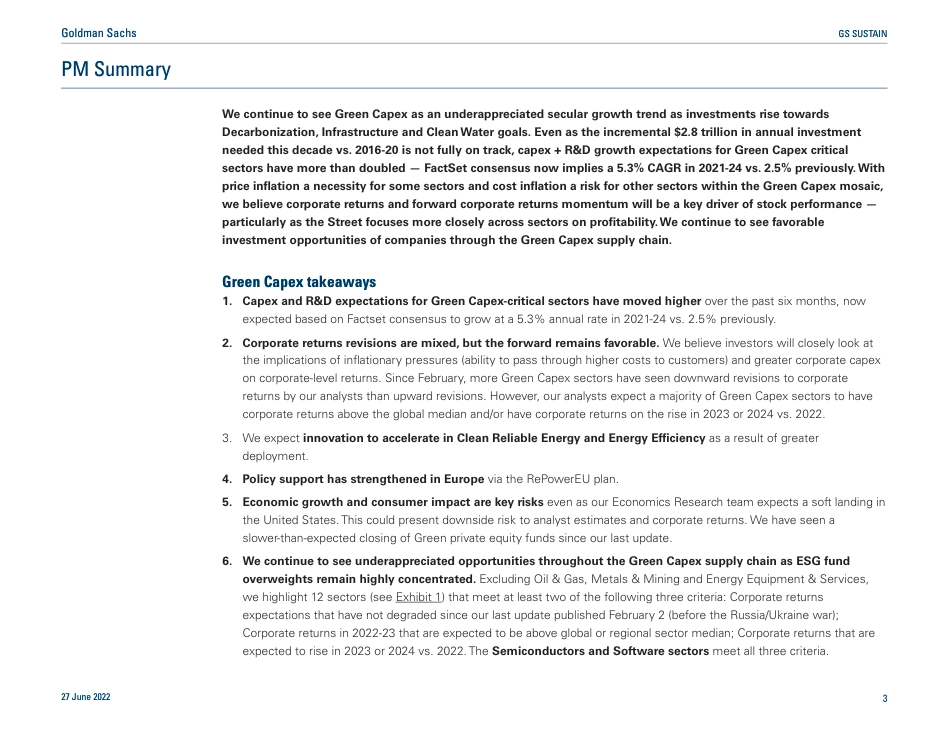
We continue to see Green Capex as an underappreciated secular growth trend as investments rise towards
Decarbonization, Infrastructure and Clean Water goals. Even as the incremental $2.8 trillion in annual investment
needed this decade vs. 2016-20 is not fully on track, capex + R&D growth expectations for Green Capex critical
sectors have more than doubled — FactSet consensus now implies a 5.3% CAGR in 2021-24 vs. 2.5% previously. With
price inflation a necessity for some sectors and cost inflation a risk for other sectors within the Green Capex mosaic,
we believe corporate returns and forward corporate returns momentum will be a key driver of stock performance —
particularly as the Street focuses more closely across sectors on profitability. We continue to see favorable
investment opportunities of companies through the Green Capex supply chain.
Green Capex takeaways
Capex and R&D expectations for Green Capex-critical sectors have moved higher over the past six months, now1.
expected based on Factset consensus to grow at a 5.3% annual rate in 2021-24 vs. 2.5% previously.
Corporate returns revisions are mixed, but the forward remains favorable. We believe investors will closely look at2.
the implications of inflationary pressures (ability to pass through higher costs to customers) and greater corporate capex
on corporate-level returns. Since February, more Green Capex sectors have seen downward revisions to corporate
returns by our analysts than upward revisions. However, our analysts expect a majority of Green Capex sectors to have
corporate returns above the global median and/or have corporate returns on the rise in 2023 or 2024 vs. 2022.
We expect innovation to accelerate in Clean Reliable Energy and Energy Efficiency as a result of greater3.
deployment.
Policy support has strengthened in Europe via the RePowerEU plan.4.
Economic growth and consumer impact are key risks even as our Economics Research team expects a soft landing in5.
the United States. This could present downside risk to analyst estimates and corporate returns. We have seen a
slower-than-expected closing of Green private equity funds since our last update.
We continue to see underappreciated opportunities throughout the Green Capex supply chain as ESG fund6.
overweights remain highly concentrated. Excluding Oil & Gas, Metals & Mining and Energy Equipment & Services,
we highlight 12 sectors (see Exhibit 1) that meet at least two of the following three criteria: Corporate returns
expectations that have not degraded since our last update published February 2 (before the Russia/Ukraine war);
Corporate returns in 2022-23 that are expected to be above global or regional sector median; Corporate returns that are
expected to rise in 2023 or 2024 vs. 2022. The Semiconductors and Software sectors meet all three criteria.
27 June 2022 3
Goldman Sachs GS SUSTAIN
Greenflation,ReturnsandOpportunityTheRussia-Ukrainewar,inflation,recognitionoftheneedforenergyreliabilityandrisinginterestratesaredrivingdebatesaroundhowprivatesectorandpublicsectorcommitmenttoGreenCapexwillevolveandwhetherthisraisesorlowerstheattractivenessofinvestmentopportunitiestowardsachievingNetZero,InfrastructureandCleanWatergoals.WecontinuetoseeGreenCapexasanunderappreciatedseculargrowthtrendasinvestmentsrisetowardsDecarbonization,InfrastructureandCleanWatergoals.Evenastheincremental$2.8trillioninannualinvestmentneededthisdecadevs.2016-20isnotfullyontrack:(a)capex+R&Dmedium-termgrowthexpectationshaverisenoverthepastsixmonths,bothonanabsolutebasisandmodestlyrelativetooperatingcashflow;and(b)governmentsappearmorecommittedtoincreasingorstimulatingGreenCapex,particularlyinEurope.Webelievecorporatereturnsandforwardcorporatereturnsmomentumwillbeakeydriverofstockperformance,andinthisreportwepresentscreensthathighlightsectorswhereweseefavorable,resilientand/orimprovingcorporatereturnsleveredtotechnologiesneededintheGreenCapexmosaic.GoldmanSachsdoesandseekstodobusinesswithcompaniescoveredinitsresearchreports.Asaresult,investorsshouldbeawarethatthefirmmayhaveaconflictofinterestthatcouldaffecttheobjectivityofthisreport.Investorsshouldconsiderthisreportasonlyasinglefactorinmakingtheirinvestmentdecision.ForRegACcertificationandotherimportantdisclosures,seetheDisclosureAppendix,orgotowww.gs.com/research/hedge.html.Analystsemployedbynon-USaffiliatesarenotregistered/qualifiedasresearchanalystswithFINRAintheU.S.EQUITYRESEARCHJune27,202210:19AMEDTTheGoldmanSachsGroup,Inc.GREENCAPEXEnricoChinello,Ph.D.+1(212)357-3398enrico.chinello@gs.comGoldmanSachs&Co.LLCBrianSinger,CFA+1212902-8259brian.singer@gs.comGoldmanSachs&Co.LLCDerekR.Bingham+1(415)249-7435derek.bingham@gs.comGoldmanSachs&Co.LLCMichaelHaoWu,CFA+1(917)343-1137michael.h.wu@gs.comGoldmanSachs&Co.LLCSharminiChetwode,Ph.D.+852-2978-1123sharmini.p.chetwode@gs.comGoldmanSachs(Asia)L.L.C.EvanTylenda,CFA+44(20)7774-1153evan.tylenda@gs.comGoldmanSachsInternationalMadelineMeyer+1212902-5513madeline.r.meyer@gs.comGoldmanSachs&Co.LLCKeebumKim+852-2978-6686keebum.kim@gs.comGoldmanSachs(Asia)L.L.C.BrendanCorbett+1(415)249-7440brendan.corbett@gs.comGoldmanSachs&Co.LLCEmmaJones+6129320-1041emma.jones@gs.comGoldmanSachsAustraliaPtyLtdNote:ThefollowingisaredactedversionoftheoriginalreportpublishedJune13,2022[54pgs].PMSummary3GreenCapexneedsremainrobust:Updatingwhatwebelieveisontrack8Capex+R&Dexpectationshavemovedhigherinrecentmonths,withmodestincreaseinreinvestmentrate12Implicationstocorporatereturns:Mixedoverall,butstillfavorablemomentumincomingyearsamongGreenCapexsectors16GreenCapexsparecapacityhasexpanded,butmoreconcentratedinoil/gas21Economicgrowthandconsumerimpactarekeyrisks25InnovationcouldaccelerateinCleanReliableEnergyandEnergyEfficiencyasaresultofgreaterdeployment29Policysupportleadingtoriseinlong-terminvestmentinEurope32Sectorsthatstandoutpostourlatestupdate37GreenCapexincreaseshavenotbeenappreciatedinstockpricesoverthepastsixmonths41HowGSSUSTAINcanhelp43DisclosureAppendix46ThefollowingisaredactedversionofGoldmanSachsResearch’sreport“GreenCapex:Greenflation,ReturnsandOpportunity”originallypublishedJune13,2022(54pgs).Allcompanyreferencesinthisnoteareforillustrativepurposesonlyandshouldnotbeinterpretedasinvestmentrecommendations.27June20222GoldmanSachsGSSUSTAINTableofContentsPMSummaryWecontinuetoseeGreenCapexasanunderappreciatedseculargrowthtrendasinvestmentsrisetowardsDecarbonization,InfrastructureandCleanWatergoals.Evenastheincremental$2.8trillioninannualinvestmentneededthisdecadevs.2016-20isnotfullyontrack,capex+R&DgrowthexpectationsforGreenCapexcriticalsectorshavemorethandoubled—FactSetconsensusnowimpliesa5.3%CAGRin2021-24vs.2.5%previously.WithpriceinflationanecessityforsomesectorsandcostinflationariskforothersectorswithintheGreenCapexmosaic,webelievecorporatereturnsandforwardcorporatereturnsmomentumwillbeakeydriverofstockperformance—particularlyastheStreetfocusesmorecloselyacrosssectorsonprofitability.WecontinuetoseefavorableinvestmentopportunitiesofcompaniesthroughtheGreenCapexsupplychain.GreenCapextakeawaysCapexandR&DexpectationsforGreenCapex-criticalsectorshavemovedhigheroverthepastsixmonths,now1.expectedbasedonFactsetconsensustogrowata5.3%annualratein2021-24vs.2.5%previously.Corporatereturnsrevisionsaremixed,buttheforwardremainsfavorable.Webelieveinvestorswillcloselylookat2.theimplicationsofinflationarypressures(abilitytopassthroughhighercoststocustomers)andgreatercorporatecapexoncorporate-levelreturns.SinceFebruary,moreGreenCapexsectorshaveseendownwardrevisionstocorporatereturnsbyouranalyststhanupwardrevisions.However,ouranalystsexpectamajorityofGreenCapexsectorstohavecorporatereturnsabovetheglobalmedianand/orhavecorporatereturnsontherisein2023or2024vs.2022.WeexpectinnovationtoaccelerateinCleanReliableEnergyandEnergyEfficiencyasaresultofgreater3.deployment.PolicysupporthasstrengthenedinEuropeviatheRePowerEUplan.4.EconomicgrowthandconsumerimpactarekeyrisksevenasourEconomicsResearchteamexpectsasoftlandingin5.theUnitedStates.Thiscouldpresentdownsiderisktoanalystestimatesandcorporatereturns.Wehaveseenaslower-than-expectedclosingofGreenprivateequityfundssinceourlastupdate.WecontinuetoseeunderappreciatedopportunitiesthroughouttheGreenCapexsupplychainasESGfund6.overweightsremainhighlyconcentrated.ExcludingOil&Gas,Metals&MiningandEnergyEquipment&Services,wehighlight12sectors(seeExhibit1)thatmeetatleasttwoofthefollowingthreecriteria:CorporatereturnsexpectationsthathavenotdegradedsinceourlastupdatepublishedFebruary2(beforetheRussia/Ukrainewar);Corporatereturnsin2022-23thatareexpectedtobeaboveglobalorregionalsectormedian;Corporatereturnsthatareexpectedtorisein2023or2024vs.2022.TheSemiconductorsandSoftwaresectorsmeetallthreecriteria.27June20223GoldmanSachsGSSUSTAINWemaintainourexpectationsforGreenCapexsparecapacityat$1.0trillionannually.Sparecapacityisnoweven7.moreheavilyconcentratedinOil/Gas,whichwebelievewillincreaseconsiderationsbySustainabilityinvestorstodeployengagementstrategiesfocusedonESGImproversorthosewithlowcostandlowenvironmentalfootprint.27June20224GoldmanSachsGSSUSTAINExhibit1:WithconsensusexpectationsforcapexandR&Dthrough2024forGreenCapex-criticalsectorsrevisedupmeaningfullyvs.2H21,wefocusonimplicationstocorporatereturns.Semiconductorsistheonlysectorreinvestingabovetheglobalsectormedianinwhichreturnshavenotdegraded,arestillaboveaverageandareforecasttorise.OutsideofOil&GasMetals&MiningandEnergyEquipment/Services,thereare12otherGreenCapexsectorswhichhavefavorablecorporatereturnsand/orreturnsmomentum.Overviewofsectorsforwhich(1)corporatereturnsanalystestimateshavenotdegradedvs.ourFeb.2report,(2)estimatedcorporatereturnsin2022E-23Eareaboveaverage(ex.FinancialsandRealEstate)and(3)corporatereturnsareforecasttorisein2023Eor2024Evs.2022E.Boldedsectorshaveabove-average—ex.Financials&RealEstate—reinvestmentrate(refersto2022E-23Eaverage)Corporatereturnsareconsiderednotdegradedifcurrentestimatesarehigherthanorwithin0.2%ofpriorestimates.Calculationsrefertothesector22E/23EaverageCROCI.Source:GoldmanSachsGlobalInvestmentResearch27June20225GoldmanSachsGSSUSTAINRe-investorsvs.RevenueBeneficiariesdebateWhilewebelievetheneedforincreasedGreenCapexissecular,weseenormalinvestordebatesoverwhetherequityoutperformancecanoccurduringthecapexphasevs.harvestphase.GreenCapexcompaniesforwhichconsensusCapex+R&Destimateshaveincreasedinrecentmonthshavenotbeenrewardedbyinvestorsvs.theirsectorpeers.Thissuggeststhatpresentlyinvestorsarerewardingrevenuebeneficiariesoverre-investors.Webelieveforcompaniesincreasingcapex(particularlyonlongerleadtimeprojects),investorsarelikelytofocuson:Whethertheincreasedcapexwillleadtosimilarvs.greatervs.lowercorporatereturns;andnThetimehorizonoftheinvestmentcycleandwhenacompanywouldshiftfrominvestmentmodetoharvestmoden(whenprojectscomeonline).Giventhemarket’sincreasedfocusonprofitability,weexpectanincreasedfocusoncorporatereturnsandnotethatthestocksscreenedasGreenRe-investorsandGreenRevenueBeneficiariesbothincludeonlycompanieswherecashreturnoncashinvestedexceedssectorregionalorglobalaveragein2022Eor23E.Exhibit2:StocksthatscreenforeachofourthreeGreenCapexinvestmentthemeshaveoutperformedrespectivebenchmarkssincethebeginningof2020andthebeginningof2021butnot2022YTDPriceperformancevs.GICS3peersforGreenCapexstocksamongtop-100companiesforwhichconsensusCapex+R&Destimateshavemovedupwardsthemostvs.6monthsago(blueline),3monthsago(lightblueline)or1monthago(grayline)-10%0%10%20%30%40%50%60%70%80%Jan-20Feb-20Mar-20Apr-20May-20Jun-20Jul-20Aug-20Sep-20Oct-20Nov-20Dec-20Jan-21Feb-21Mar-21Apr-21May-21Jun-21Jul-21Aug-21Sep-21Oct-21Nov-21Dec-21Jan-22Feb-22Mar-22Apr-22May-22Jun-22Re-investors(vs.GICS3peers)Greenablers(vs.MSCIACWI)Greenrevenue-exposed(vs.MSCIACWI)Note:Equalweightedindices.Includesstockswithcorporatereturnsaboveaverage--referredtoglobalorregionalsectoraverage,ex.Greenablers.StockselectionbasedonconstraintsdiscussedinGreenCapex:MakingInfrastructureHappenreport,butincludesNeutralandSell-ratedstocksasopposedtojustBuy-ratedstocks.54%62%45%Source:Refinitiv,FactSet,GoldmanSachsGlobalInvestmentResearch27June20226GoldmanSachsGSSUSTAINSource:GoldmanSachsGlobalInvestmentResearch27June20227GoldmanSachsGSSUSTAINGreenCapexneedsremainrobust:UpdatingwhatwebelieveisontrackWecontinuetobelieveGreenCapexwillbethemulti-yearsecularthemedrivingthenextwaveofinfrastructureasfocusrisestodecarbonizetheworldandmeetCleanWaterandinfrastructuregoals.Weseetheneedfor$2.8trillionincrementalannualinvestmentonaveragethisdecadevsthe2016-20average.AswedetailedinourGreenCapex:MakingInfrastructureHappenreport,GreenCapextowardNetZero,InfrastructureandCleanWaterneedstoincreaseto$6tnannuallyinthe2020stoachieveNetZeroandotherSustainableDevelopmentGoals(SDGs)—seeExhibit3.GreenCapexforthesethreefocusareashasbeenabout$3.2trillionannuallywithin2016-2020,whichrepresentsabout15%ofaverageglobalgrosscapitalformationduring2016-19.IncrementalGreenCapexwillbeneededfromacombinationofgovernments,privatecompaniesandpubliccompanies,andwillinvolve,inourview,anall-inapproachacrossmultiplesectorsthatwillbecriticalorneededonpathtoNetZero,InfrastructureandCleanWatergoals(seeExhibit4).Withcontinuedinflationarypressures,weseepotentialupsiderisktothe$6.0trillionannuallythatisrequiredthisdecade.Atthesametime,thepotentialforgreaterdeploymentofsolutionscouldincreasethepaceofinnovationinareaslikehydrogen,batterystorageandenergyefficiency.Webelievetheprivatesectorisstillontrackfor$0.9tn(in-linewithourpriorestimate)oftheincremental$2.8trillionGreenCapexneededannuallyinthe2020s,withthehighercontributionbypubliclytradedcompaniesoffsetbylowerexpectedprivateequityfundraising.Comparedtoourlatestupdate,webelievetheprivatesectorremainsontracktoinvest$0.9tnmoreannuallyonaveragevs.2016-20.WeraiseourestimatesforincrementalGreenCapexontrackthisdecadefrompubliclytradedcompaniesto$0.6ntrillionfrom$0.5trillionpreviously.Wederiveour$0.6trillionapplying:(1)consensusexpectationsforcapexgrowthin2022and2023;(2)a3.5%(vs.3.0%prior)overallCapex+R&DCAGRpost-2023;and(3)a1.5%GreenCapexmixshift—consistentwiththefindingsdetailedinourNovember2021ESGoftheFuturereportintroducinganalystforecastsforGreenCapexandGreenRevenuemix.WereviseourestimatesforincrementalGreenCapexontrackthisdecadefromprivatelyheldcompaniesto$0.3ntrillionfrom$0.4trillionpreviously.WerevisedownwardourexpectationsinGreenCapex-relatedprivatecapitalraised(RenewableEnergy,CleanTech,EnvironmentalServices,Utilities,Waterfunds)duetototalfundsraisedin2021comingbelowourpriorestimates.Datafor2021indicatesprivateequitycapitalraisedforinfrastructure,ClimateandCleanWaterobjectivestotaled$65bn.Addingleveragetotheequitycomponentata50%/50%equity/debtsplit,theincrementalcapitalavailablefromprivatelyheldcompaniesin2021wouldtotal$124bn(vs.$135bnbasedonpriorestimates).Ascenariowhereprivateequitycapitalraisedgrowsata20%CAGR—abovethe12%historicalCAGRofcapitalavailabletoinvest,andin-linewithourAssetManagementandCapitalMarketsteams’viewofincreasingshareofESG/Infrastructurecapital—wouldimplyincrementalavailablecapitalfromprivatelyheldcompaniesof$0.3tnon27June20228GoldmanSachsGSSUSTAINaveragewithin2021-2030(vs.about$0.4tnasindicatedinourpriorreports).Wemaintainourexpectationsforsparecapacityfrompubliclytradedcompaniesof$1.0trillionannually.Aswedetaillaterinthereport,whilesparecapacitywasconcentratedinoil/gas,metals/mining,semiconductorsandsoftwaresectors,ithasbecomeevenmoreconcentratedinoil/gasasaresultoftherecentspikeinpricesandmanagementfocusonreturnofcapital.UpwardrevisionstoOil&Gasoperatingcashflowhavewellexceededtheupwardrevisionstosectorcapex.Mostothersectorsarespendingincrementallymoreincapex+R&Dwithoutarequisiteincreaseinoperatingcashflow.Weseeanadditionalgapof$0.9tnneeded(assumingcorporatesparecapacityisdeployed)whichcouldcomefromgovernmentsand/orindividuals.Aswenotelaterinthereport,weseerisinggovernmentincentives/investmentinEuropepostRussia’sinvasionofUkraine.Exhibit3:Anincremental$2.8trillionofGreenCapexisneededperyearinthe2020stosupportNetZero,InfrastructureandCleanWaterpathwaysGreenCapexintheNetZeroscenario$6tn$0.8,etuructrasrInfentalemrInc.7$1,exCapreturastrucfInycageL.20$,aterWnentalCleaemrInc.2.200$,CapexaterWeanClyLegac$1.8,oerZNetentalemrInc.2$1,exCapoerZNetyLegac0$Source:WorldBank,IEA,McKinsey,OECD,GoldmanSachsGlobalInvestmentResearch27June20229GoldmanSachsGSSUSTAINExhibit4:TheNetZero,InfrastructureandCleanWatermosaicCriticaltechnologies/focusareasandannualinvestmentinthe2020stoachieveNetZero,InfrastructureandCleanWaterneedsSource:IEA,McKinsey,OECD,Companydata,GoldmanSachsGlobalInvestmentResearch27June2022<0GoldmanSachsGSSUSTAINExhibit5:Webelievetheprivatesectorisstillontrackfor$0.9tn—despiteadifferentpublic/privatecompaniesmixvs.priorreports—oftheincremental$2.8tnGreenCapexneededannuallyinthe2020s—withagreatermixfrompubliccompanies,morethanoffsetbyadeclineinourexpectationsfromprivateequityfunds.Weseepotentialfor$1.0tnofadditionalGreenCapexfrompubliclytradedcompaniesbasedonestimatedsparecapacityComponentsofincrementalannualinvestmentneededthisdecadetomeetNetZero,infrastructureandcleanwatergoals,$trillion$0.6tn$2.8tn$0.3tn$1.0tn$0.9tn$0.0$0.5$1.0$1.5$2.0$2.5$3.0ProjectedfrompubliccompaniesProjectedfromprivatecompaniesSparecapacityfrompubliccompaniesAdditionalinvestmentneededWebelievewearestillcurrentlyontrackfor$0.9ofthetotal$2.8tnneededSource:IEA,OECD,McKinsey&Company,FactSet,Preqin,GoldmanSachsGlobalInvestmentResearch27June2022<<GoldmanSachsGSSUSTAINCapex+R&Dexpectationshavemovedhigherinrecentmonths,withmodestincreaseinreinvestmentrateConsensusexpectationsforoverallcapex+R&Dontherise—Capex+R&DconsensusCAGRin2021-24now5.3%vs.2.5%previouslyforkeysectorsrelevantforGreenCapex.SinceourlatestupdateinDecember2021,wehaveseenconsensusestimatesforyoycapex+R&Dgrowthrisefor2022andremainrelativelyflatfor2023.Expectationsnowcallfor11%yoygrowthin2022and3%in2023(vs.about5%/3%previously)—seeExhibit6.AmongsectorsmostalignedwiththeGreenCapexmosaic,wenoteaconsiderableincreaseinconsensus2022ECapex+R&DYoYgrowthexpectations;inparticularFactSetconsensuscallsforUtilitiesandCleanEnergytogrow7.7%in2022E(vs.0.8%prior),whileotherGreenCapexsectorsareprojectedtosee2022ECapex+R&Dincreasingby10.7%(vs.3.9%prior).Takingintoaccountrevisionsto2021basedonreporteddata,Capex+R&Dannualgrowthin2021-24forGreenCapex-criticalsectorsisnowexpectedtobe5.3%vs.2.5%6monthsago),basedonFactSetconsensus.WecontinuetoassumeGreenmixshiftconsistentwithourforward-lookinganalystestimates.Solelyapplyingoverallcapex+R&DgrowthdoesnotfactorinmixshifttowardsGreenCapex,animportantdriverofGreenCapex,inourview.AswedetailedinourNovember2021ESGoftheFuturereport,ourforward-lookingforecastsforGreenRevenueandGreenCapexmixbyanalystsacross19sectorsimpliesanannual1.3%increaseinweightinginCapextowardssustainableusecasesthrough2025E.Givenpotentialforfurtherupside,inourscenarioanalysisweroundthisto1.5%andapplythemixshifttocapexandR&Dacrossallsectors.WeraiseourexpectationforincrementalannualGreenCapexontrackthisdecadefrompubliclytradedcompaniesto$0.6tnfrom$0.5tn.Weincorporateoverallcapex+R&DCAGRsYoYgrowthexpectationsin2022-23asdetailedinExhibit6anda3.5%longerterm,combinedwitha1.5%peryearGreenmixshift.The3.5%long-termCAGRislargerthanwhatconsensusestimatesexpectforyoygrowthin2023and2024butreflectsourexpectationthatconsensusexpectationscouldmovehigherwithgreaterclarityonavenuesforcorporatestoreinvestcashflowandgiventrendsweseeinopportunities/needsforinvestment.Togetherthisimplies$0.6trillioninhigherannualGreenCapexonaveragethisdecade(Exhibit7)whenappliedacrossthe>7,000companiesinourGSSUSTAINdatabase.Weseeaslightlyhigherreinvestmentratein2022and2023vs.ourOct.2021GreenCapex:MakingInfrastructureHappenreport,thoughthereinvestmentratecontinuestofallvs.thehistoricalaveragebetween2000andmid-2010s.Currentestimatesindicatereinvestmentratesofcashflowsintocapex+R&Dstillonthedeclinevs.thehistoricalhighsinthe2000s,nowforecastat52%in2022E,50%in2023Eand49%in2024E—seeExhibit8.Thisrepresentsa1-2percentagepointupwardrevisionvs.ourOct.2021GreenCapexreport—pleaseseeExhibit9.WhilethisisincrementallypositivetowardsGreenCapexinitiatives,reinvestmentratesintocapex+R&Dwouldstillneedtomove27June2022<2GoldmanSachsGSSUSTAINconsiderablyhigherinordertobridgeatleastpartiallythegapneededtoachievethefullincremental$2.8tnannualGreenCapexneededinthe2020sonpathtoSustainableDevelopmentGoals.27June2022<3GoldmanSachsGSSUSTAINExhibit6:Capex+R&DFactSetconsensusexpectationshavemovedhighersinceourlastupdatepublishedinearlyFebruary,withannualgrowthin2021-24fromGreenCapexsectorsnowexpectedtobe5.3%vs.2.5%previouslyOverviewofCapex+R&DYoYgrowthforGreenCapexsectors(excludingOil&GasandEnergyEquipmentandServices),basedonFactSetconsensus;Totallineincludesallsectors(notjustGreenCapexsectors)Capex+R&DYoYGrowth--WeightedAverage20212022E2023E2024E2020-2024ECAGRCurrentvs.-6-moCurrentvs.-6-movs.-3-movs.-1-moCurrentvs.-6-movs.-3-movs.-1-moCurrentvs.-6-movs.-3-movs.-1-moCurrent-6-moAirportServices-11.9%4.4%5.5%5.0%0.5%0.1%Aluminum-18.4%27.2%2.4%7.8%3.5%-1.5%AutoParts&Equipment-9.5%16.4%5.1%2.6%3.2%-2.0%AutomobileManufacturers3.3%13.3%5.3%3.4%6.3%-2.2%AutomotiveRetail32.9%11.0%-5.2%-2.6%8.0%10.6%BuildingProducts7.6%20.4%0.2%-0.6%6.6%3.5%Construction&Engineering-0.6%3.1%4.1%4.1%2.7%6.3%ConstructionMachinery&HeavyTrucks13.3%6.7%3.9%2.7%6.6%-1.6%ConstructionMaterials41.2%-1.1%-6.1%-2.6%6.3%3.2%Copper11.5%41.0%-1.8%-6.6%9.6%-0.8%DiversifiedMetals&Mining17.4%25.1%0.0%-5.4%8.5%1.1%DiversifiedRealEstateActivities-8.8%7.6%-11.7%8.0%-1.6%6.0%ElectricUtilities1.4%8.2%-0.8%3.4%3.0%3.3%ElectronicComponents7.6%8.0%-3.0%-1.8%2.6%-4.9%ElectronicEquipment&Instruments19.7%10.3%7.4%-4.4%7.9%1.5%ElectronicManufacturingServices20.3%-0.5%5.8%6.4%7.8%1.3%HeavyElectricalEquipment3.0%6.3%1.7%4.8%4.0%0.1%Highways&Railtracks-16.3%-29.5%35.2%12.1%-2.7%-6.1%Homebuilding-7.7%13.1%3.0%2.0%2.4%-2.2%HouseholdAppliances24.3%-7.3%4.5%4.7%6.0%-4.1%IndependentPowerProducers&EnergyTraders9.1%9.6%1.9%0.4%5.2%5.0%IndustrialConglomerates10.4%5.2%1.2%1.5%4.5%4.8%IndustrialMachinery5.6%18.7%-1.8%1.9%5.8%4.0%IntegratedTelecommunicationServices6.2%2.9%-5.5%-2.2%0.3%-0.6%MarinePorts&Services48.1%12.0%-18.1%0.0%8.0%-2.0%Multi-Utilities10.6%0.6%7.3%-2.1%4.0%5.3%Railroads-13.0%17.3%9.5%0.1%2.8%7.2%RealEstateOperatingCompanies83.8%-41.5%-14.9%-4.4%-3.3%-0.4%RenewableElectricity2.9%22.4%8.3%12.1%11.2%9.9%SemiconductorEquipment15.6%22.4%5.9%3.3%11.5%9.2%Semiconductors28.5%22.6%3.1%4.7%14.2%7.2%Steel19.0%18.4%-5.9%-8.6%4.9%0.8%SystemsSoftware21.4%12.9%11.5%11.5%14.2%13.3%Trucking21.3%47.4%3.0%4.6%17.8%17.8%WaterUtilities6.6%5.9%2.3%0.3%3.8%2.0%WirelessTelecommunicationServices1.1%5.9%-2.8%1.0%1.3%0.6%GreenCapexsectors8.6%10.1%1.1%1.7%5.3%2.5%UtilitiesandCleanEnergy4.2%7.7%1.7%2.3%4.0%3.9%OtherGreenCapexsectors9.7%10.7%1.0%1.6%5.7%2.0%Total10.1%11.2%2.9%2.0%6.5%4.2%ArrowsrefertorevisionsinconsensusCapex+R&Dyoygrowthestimates,currentestimatesvs.6/3/1-montholdestimates.Greenarrow:revision>1%.Yellowarrows:revisionsbetween-1%and+1%.Redarrow:revisionbelow-1%.Source:FactSet,GoldmanSachsGlobalInvestmentResearch27June2022<4GoldmanSachsGSSUSTAINExhibit7:WenowseeincrementalGreenCapexfrompubliclytradedcompanieswouldbe$1.2tnby2030,withanannualaverageof$0.6tninthe2020s—inascenariowherethepercentweightingforpubliclytradedcompaniesofGreeninvestmentsacrossallsectorsweretoriseata1.5%annualpaceandoverallcapex+R&Dgrowsata3.5%CAGR(vs.3.0%inourpriorreports)IncrementalGreenCapexatdifferentratesofmixshiftandpost-2023Capex+R&Dgrowthrates.Valuesin$tnExhibit8:ReinvestmentRatesofcashflowsintoCapex+R&Dhavedeclinedtonear52%vs.thehistoricalaverageof60%-70%between2000andmid-2010sWeightedaveragereinvestmentrate,(capex+R&D)/(operatingcashflow+R&D),splitbyD&Aandimpliedreinvestmentintogrowth;excludesFinancialsandRealEstateExhibit9:ConsensusexpectationsforreinvestmentrateofoperatingcashflowbacktoCapex+R&DhasrisenslightlysinceourOct.2021reportbyabout1-2percentagepointsConsensusestimatesforreinvestmentratesofcashflowsintoCapex+R&D,2003-2024E—excludesFinancialsandRealEstate$0.0$0.2$0.4$0.6$0.8$1.0$1.2$1.4$1.6$1.82021202220232024202520262027202820292030$0.6tn$0.3tn$0.9tn0%10%20%30%40%50%60%70%80%ImpliedreinvestmentintogrowthReinvestmentintomaintenance(D&A)45%50%55%60%65%70%75%Reinvestmentrate-lastrefreshReinvestmentrate-NEWBandsareindicativeof2.5%/3.5%/4.5%rangeinpost-2023Capex+R&DgrowthratesSource:GoldmanSachsGlobalInvestmentResearchSource:FactSet,RefinitivEikon,GoldmanSachsGlobalInvestmentResearchSource:FactSet,RefinitivEikon,GoldmanSachsGlobalInvestmentResearch27June2022<5GoldmanSachsGSSUSTAINImplicationstocorporatereturns:Mixedoverall,butstillfavorablemomentumincomingyearsamongGreenCapexsectorsInaggregate,averagecorporatereturnsacrosssectors(notjustthoserelevantforGreenCapex)remainstrongandhavebeenrevisedhigher,withconsensusexpectationscallingforincreasein2023-24.Ouranalysts’estimatesimplyanupwardrevisiontoindustry’scorporatereturnsin2022E-2024E—to12.9%onaveragein2022-24Evs.12.5%previouslyasdiscussedinourFeb.2note,referredtoallsectorsex.FinancialsandRealEstate(Exhibit10).Thiscompareswithpre-pandemiccorporatereturnsof10.5%in2019and10.9%onaveragein2010-2019averageforallsectors.However,sincetheendofJanuary,moreGreenCapex-criticalsectorshaveseendownwardCROCIrevisionsbyouranalyststhanupwardones.Onaweightedaverage-basis,sectorsmostcriticaltoGreenCapexarecurrentlyforecasttohavecorporatereturnsof10.6%/11.0%in2022E/2023E—ex.Oil/Gas.Thisimpliesa20bpsdownwardrevisionfor2022Evs.priorestimatesfromourFeb.2report,with2023Eforecastflat.SeeExhibit10.ManyimportantsectorsforGreenCapexhaveaverageorbelow-averagecorporatereturns.WecontinuetoexpectthedebateonwhetherfocusonImpactshouldlowertheacceptablethresholdislikelytocontinue(Exhibit12).Webelievethatconfidenceinprojectreturns—bothabsoluteandtheirmomentum—andinmeasuresthatwouldincreasecashflowtoaccommodateGreeninvestments—willbecriticaltoovercomethepossibleinitialskepticismfrommanagementsandinvestorstowardsdeployinglargerGreenCapex.Aswehavehighlighted,webelievesectorswithlowercorporatereturnsmayneedthreefactorstoimprovereturnsandreceivegreaterinvestorcreditforincrementalGreenCapex:Inflation,i.e.,higherproductpricesnInnovation,i.e.,lowercostsnPolicysupportnWhileUtilities(Electric/Multi/Water)havebelow-averagecorporatereturns,theyareinauniquepositionduetotheirregulatedstatusandmaynotbeheldtothesamecorporatereturnsstandardsasothersectors.However,givenUtilities’leverageprofileandalready-highreinvestmentrates,fullyfinancingincrementalGreenCapexmaywarrantequityissuance.WecontinuetoseepositivemomentumincorporatereturnsamongGreenCapex-criticalsectors.Wenotethat,ona2023Evs.2019basis,ouranalystforecastsimplycorporatereturnsareexpectedtoimproveforthemajority(14)ofGreenCapex-criticalsectors:AirFreight&Logistics,Airlines,Automobiles,AutoComponents,BuildingProducts,ElectricalEquipment,ElectronicEquipment,EnergyEquipment&Services,Machinery,Metals&Mining,Oil&Gas,Road&Rail,SemiconductorsandSoftware.Corporatereturnsareexpectedtoremainflatona2023Evs.2019basisforDiversified27June2022<6GoldmanSachsGSSUSTAINTelecom,ElectricUtilitiesandTransportationInfrastructure,andtodeclinefortheremainingsectors:Construction&Engineering,ConstructionMaterials,IPP&RenewableElectricityProducers,Multi-Utilities,WaterUtilitiesandWirelessTelecom.Aswediscussedabove,webelievethatanimprovingoutlookforcorporatereturnswouldbesupportiveforGreenCapex,demonstratingthatsuchinitiativesareeithernotdeterioratingcorporatereturnsorareleadingtoanimprovementinmedium-termorlonger-term.Exhibit10:CROCIestimatesforcoveredcompanieshavebeenrevisedupwardssinceourFeb.2note,projectingabout13%corporatereturnsin2022E-2024EWeightedAverageCROCI,allsectors.Comparisonofcurrentvalues(asofJune2)vs.aspublishedinourFeb.2GreenCapexnote;GreenCapexsectorsexcludeOil&Gas7%8%9%10%11%12%13%14%15%Allsectors(ex.Fin.&RE)CurrentCROCIGreenCapexSectors(ex.O/G)CurrentCROCIGreenCapexSectors(ex.O/G)CROCIestimatesAllsectors(ex.Fin.&RE)CROCIestimatesfromFeb.Source:GoldmanSachsGlobalInvestmentResearch27June2022<7GoldmanSachsGSSUSTAINExhibit11:WhilecorporatereturnsexpectationshavenotdegradedoverallsincelateJanuary,thereissignificantdifferentiationbysectorOverviewofcurrentCROCIestimatesbysector(basedon2022E/2023Eaverage—horizontalaxis)andpercentagepointsdifferencein2022E/2023EaverageCROCIbetweencurrentandprior(Feb.2,2022)estimates.Verticallinedenotescurrentestimatesforaverage22E/23ECROCIforallsectors(ex.FinancialsandRealEstate)]eSG[setimatseorpridantenrrcueenwetCIbOCReragevAv/2023E2022Einerencefffd..PPifA5%3%1%1%-%3-tmenpoovel&DetmengeanMatateslEaeRtscudroPtsreoo&FreapFPaideMsratemelognCoaltrisudInlsetiliUtiGastcudProdooFtapl&SdooFsITREmennrtaitenEseecrvirviieSSSlalaliicaniniiiFFFdddfifiefieiirsiveDirviceseSrumensCodeifisverDi&rsenitanaCosalcmieCh&DAcarrmaaaPhstcudProlanorsPeRetaneiltiulMMsetilitiUrteWaretuctrusfranInotirtaopsDnraTsila&RadRoaesitiilUt-ultiMRESdnPPaI&tnempiuREqyrgyeEnElaictrcElesetiilUtitricceElseicvrSetionaunicmomcleTedifiesrerivDrlsriateaMtiontrucConsringnginee&EnstructionCosilebomtouAtsenonComputoAesinirlADDiyhlmhaechccTennaaleCllobaGsceviireS&lsooTscencieSeifL&LtsgniitataileRsetgnikagPac&srotubirtsDi&seinapmCognidarTocacobTsdooGryuxuL&lreapApseltixeTslraehpriPe&eragStoareHardwyogolhnecTliRetatyalicSpesecirvSelanoissefeProTefslacituilellineariMstcudProreusieLsecirvSeITsecirv&SeaideMevticrateIntscProdudolehHouseslDurabdolehHousesciServ&rsdeiProvCarethHeal&tenpmiEquareCthleaHrstoubitrDistnempiuEqsnoitacinummCoseilpp&SusecirvSelaircemmCosgeeraBevsecirv&SentemEquiperaSftSoftwtenmipEqurtocudnocim&SerstocudnocimSeelsFublemasuon&CasilGOgnini&MsltaeMryhinecaMtsnenopmCo&tsenstrumIntnempiuEqcintroceEltscProdungdiBuilcsstigi&LotghFreiirAllstegiatesstimEentrrCu--e]SG[CICROageervAE23/20E2220%35%30%25%20%15%105%0%5%-reusie&LtsrantauseRslteoHliRetangietarkMtc&DiretrneteInygolonhcetoBiBluedotsandlabels:GreenCapexsectorswithabove-averagecorporatereturns.Blackdotsandlabels:GreenCapexsectorswithbelow-averagecorporatereturns.Graydotsandlabels:Othersectorswithabove-averagecorporatereturns.Orangedotsandlabels:Othersectorswithbelow-averagecorporatereturns.Greendot:globalcleantechcompaniesSource:GoldmanSachsGlobalInvestmentResearch27June2022<8GoldmanSachsGSSUSTAINExhibit12:Whilereinvestmentratehasrisen,therearestillrelativelyfewsectorswithabove-averagecorporatereturnsinvestingmorethan60%ofadjustedcashflowinR&Dandcapexin2022E—suggestingcapacityforfurtherinvestmentReinvestmentratevs.cashreturnoncashinvestedweightedaveragebysectorforcompaniescoveredbyGSResearch,2022EE2220CI,CROgvAvdtegheiWA%30%25%20%15%105%tesorF&aperPeslobiutomSeAInfonitatrposanrTondciSemEcitroneclEefSIeTdeifisrevDisctisgiLo&tgheiFrriAtateEsRealtyEquitenpmiquEsonaticiunmComtsoducrPeursLeisecivreSlaicremmCongiagkacP&srneaiContyogolhncoteiBsecivreS&tnempiuqEygrenEtriceclEsalctieuacmrhaPHoteslFueelbamusnCo&saGliOciervS&adiMeevtiacrteInselbarDudlohesuHoarewtwftSoftennmtairnteEesiplupS&tenpmiquECarethlHeaesenDef&ecpaeroseAngiliRetaesltapS&FoodynerhiMacescerviS&slooTesceniceSfLitsucodrPFoodtlCtilIdtribsDi&esnipaComngiadrTaMedilaiRetneiltilMungniiM&sltaMetsucodrPalonserPtsucodrPngdiluiBeragesevBsbutoritrDisesciervSITtsucodrPdHouseholliatReytlaicepSescServionalisesProfdsooGuryxLu&arelppAesltiexToccaboTsecivreS&sredivorPerCathlaHeTwwssMM0%130%120%11%001%90%80estiilUti-tiluMestiiUtilcitrecElestiiUtilaterWngerineingE&ontitrucsConersucodrPtyitriceclEelbawenRednarewoPtnednepedInseitiliGasUtntsnepoComutoAtsoducrPtcesturetrucasrentpmquiEtoronducciem&SstorducsntnepoCom&tsentrumsIntenpmiquEesciveronSaticunimliRetangetiarkMtecrDi&ernetIntestctirvnotiacinummocelygolonhceTerCahtlaHe)STtsusrentTtmesInvseilppuS&slRai&RoadslairetaMnoitcurtsnCotenpmiquEalceurs&LeiantstaurReselsesctorsbusecivreSremusnCodeifisrevDil2022ERate,enttmesReinv%07%06%05%40%30%20%100%0%momecelTseselriWREIT(salciChemeratesomlCongtrialusIndtenmopelDev&tenmgenaMatatesElReaWeviewRealEstatecashreturnoncashinvestedaslesscomparablethanothersectorsSource:FactSet,GoldmanSachsGlobalInvestmentResearch27June2022<9GoldmanSachsGSSUSTAINExhibit13:Amongthe23GreenCapex-criticalsectors,12areestimatedtohaverisingcorporatereturnsin2022Evs.2019(withestimatesflatfor1sectoranddecliningfortheremaining10).In2023Eand2024E,estimatesindicatethat14and15sectorswillhaverisingcorporatereturnsvs.theprioryear,respectively.Overviewofsector-levelweightedaverageCROCIin2019and2022E-2024E.Highlightedsectorsareforecasttohaverisingcorporatereturnsthroughouttheconsideredperiod.GreenCapex-criticalsectorsCROCI(2019)AirFreight&Logistics12.9%17.2%16.5%18.0%Airlines12.2%8.1%13.3%13.9%AutoComponents9.4%8.8%9.8%10.2%Automobiles9.0%9.1%9.5%9.7%BuildingProducts11.5%13.2%14.1%14.4%Construction&Engineering10.2%8.8%8.7%8.8%ConstructionMaterials10.4%8.7%8.7%9.0%DiversifiedTelecommunicationServices8.3%7.8%7.5%7.4%ElectricUtilities5.9%5.5%6.0%6.2%ElectricalEquipment10.0%11.1%14.4%15.4%ElectronicEquipmentInstruments&Components10.3%13.6%14.2%14.2%EnergyEquipment&Services7.9%9.1%11.4%12.1%IndependentPowerandRenewableElectricityProducers4.7%4.6%4.4%4.5%Machinery12.7%13.3%14.1%14.5%Metals&Mining8.6%16.0%13.8%12.9%Multi-Utilities6.6%6.2%6.4%6.2%OilGas&ConsumableFuels10.2%16.2%15.4%13.3%Road&Rail8.7%9.6%10.9%11.8%Semiconductors&SemiconductorEquipment14.5%20.6%20.9%20.0%Software27.5%28.1%32.6%33.9%TransportationInfrastructure7.5%6.7%7.2%7.4%WaterUtilities6.3%5.7%5.8%5.8%WirelessTelecommunicationServices11.2%10.5%10.5%11.2%AllSectors,WeightedAverage(ex.FinancialsandRealEstate)10.8%12.8%13.1%12.8%CROCI(2022E)CROCI(2023E)CROCI(2024E)Greenarrowsindicateanincreasegreaterthan0.1%,redarrowsindicateadecreasegreaterthan0.1%,yellowarrowsrepresentchangesbetween+/-0.1%.Arrowsbesidesectornamesrefertothepercentagepointdifferencein2023ECROCIvs.2019CROCI.Arrowsin2022Eand2023E/2024Ecolumnsrefertothepercentagepointdifferencevs.2019CROCIandvs.2022E/2023ECROCI,respectively.Source:GoldmanSachsGlobalInvestmentResearch27June202220GoldmanSachsGSSUSTAINGreenCapexsparecapacityhasexpanded,butmoreconcentratedinoil/gasWeraiseourforecastforannualGreenCapex“sparecapacity”frompubliclytradedcompaniesby7%,thoughourrevisedforecaststillroundsto$1.0trillionannually.Aswedetailabove,forpubliclylistedcompanies,thereinvestmentrateofoperatingcashflowbackintocapexandR&Ddecreasedduringthepastdecadefromahistoricalrangeof60%-70%andisnowexpectedonabottom-upbasistobeabout50%in2022.Atthesametime,balancesheetsareexpectedtode-leverfromhistoricallevels—netdebt/EBITDAratiosareexpectedtofallto1.3xin2022EforcompaniesinGScoverage—ex.Utilities,RealEstateandFinancials.ForthosesectorsthataremostcriticalforGreenCapex,weseesparecapacityamongpubliclytradedcompaniesofanadditional$1.0tnperyearofGreenCapex,shouldreinvestmentratesofcashflowsandR&Dintocapexreturnto70%andbalancesheetsnormalizeat1.5xNetDebt/EBITDA(Exhibit14).Thisrepresentsa7%increasevs.ourpriorestimates,thoughstillroundsto$1.0tnannually.However,GreenCapexsparecapacityisevenmoreconcentrated(vs.priorestimates)inahandfulofsectors.OuranalysissuggeststhatthesectorswherethelargestGreenCapexsparecapacityliesincludeOil&Gas,Metals&Mining,SoftwareandSemiconductors,whichaccountformorethan90%ofthetotal.Webelievethosefoursectorsareparticularlyrelevantduetothefollowingcatalysts:Oil&Gas,relevantduetopotentialforcontributiontowardcarboncaptureutilizationandstorage,biofuels,hydrogenandnrenewables—forthosepursuing.Metals&Mining,relevantforkeyproductssuchascopper,aluminum,lithium,nickel,cobalt,whichenabledownstreamnelectrification,automation,efficiency(wehighlightedcopperandaluminumasGreenablersinourGreenCapexreport).Semiconductors,relevantforenergyefficiency,automation,electricvehicles,solar—seeourdeep-diveonnSemiconductorsasGreenablersformoredetails.Software,relevanttocybersecurity(highlightedasaGreenablerthemeinourGreenCapexreport)andnautomation/efficiencysolutions.Giventheincreasedconcentrationamongthose4sectors,thewillingness,corecompetencies,andabilitytoexecuteonGreenCapexprojects—particularlyamongoil/gasandmetals/miningcompanies—willbecriticalgiventhehighpercentageofoverallsparecapacitythesesectorsrepresent.TheincreaseinGreenCapexsparecapacityisdrivenbytheOil&Gassector,whichmorethanoffsetsthedecreaseinsparecapacityacrossthemajorityofothersectors.ThemostmaterialshiftinGreenCapexsparecapacitycamefromanincreaseintheOil&Gassector,wherewereviseourexpectationshigherbyalmost60%.Thisisafunctionofgreaterfreecashflowduetohigheroil/gasprices.Wenowseemorethan$0.6trillionofGreenCapexsparecapacityfortheOil&27June20222<GoldmanSachsGSSUSTAINGassectorvs.$0.4trillionasreportedinourGreenCapex:MakingInfrastructureHappenreport.PleaseseeExhibit15.Whilemoremodest,wealsonotea3%increaseinGreenCapexsparecapacityamongMetals&Miningcompanies.Inourview,theincreaseinthepotentialabilitytodeploymorecapitalacrosscommodityproducersisprimarilyattributabletoelevatedcommodityprices(seeourdeep-diveonasupply-drivenoilpricespikeformoredetails)and,giventhecriticalityofOil/GasandMetals&MiningcompaniesinGreenCapexsparecapacity,underlinestoagreaterextentthepotentialforengagementvs.exclusionandtheshiftfromaspirationtoactiononpathtodecarbonization,cleanwaterandinfrastructuregoals.WecontinuetobelievethecapabilitytogeneratefavorablereturnsonGreenCapexinitiatives—particularlyforthosesectorssuchasOil/GasandMetals&Miningthathavebelow-averagecorporatereturns—willbekeyregardingmanagements’decisionsonhowtoallocateresourcesvs.returningcapitaltoshareholders.Inourview,investorwould“CARE”aboutGreenCapexinitiativesbasedonwhetherthecompanycandemonstrate:CorecompetenciesinthatareanAvailablecapitaltodeploynReturnsatthecorporatelevelthatare/remainfavorablenExecutiontomeetgoalsandraiserevenuecontributionfromGreeninitiativesthatarematerial.nEvenifthissparecapacityweredeployed,wewouldstillneed$0.9trillionperyearofadditionalannualinvestmenttomeetNetZero,CleanWaterandInfrastructuregoals.Wenote,however,thatgovernmentdirectinvestmentandindividuals’investmentwillbeimportantandapotentialdriverforsomeofthegap.Governmentsandindividualsareimpliedhistoricallytorepresentahighpercentageofoverallcapitalformationvs.corporatecapex+R&D.27June202222GoldmanSachsGSSUSTAINExhibit14:Weseeac.7%increasevs.ourOct.11,2021reportinannualsparecapacityforGreenCapexfromGreenCapex-criticalsectorsbasedon70%reinvestmentrateand1.5xleverage—thoughstillroundsto$1.0tnGreenCapexsparecapacityfromkeyrelevantsectorsneededforNetZero,InfrastructureandCleanWatergoalsOilGas&ConsumableFuelsMetals&MiningSoftwareSemiconductors&EquipmentAutomobilesMachineryElectronicEquipment&Comp.AirFreight&LogisticsBuildingProductsWirelessTelecomm.ServicesElectricalEquipmentEnergyEquipment&ServicesAutoComponentsConstructionMaterialsTransportationInfrastructureDiversifiedTelecomm.ServicesIndependentPowerandRESRoad&RailConstruction&EngineeringAirlines02004006008001,0001,200GreenCapexSpareCapacity(US$bn)ViagreaterreinvestmentofcashflowViahigherbalancesheetleverageGreenCapexCapacityex-Oil&Gas:$0.38tnGreenCapexCapacitywithOil&Gas:$1.0tnSpareGreenCapexcapacityconsiderspotentialforshiftinreinvestmentandtoleranceforleverage.Reinvestmentcapacityisbasedonincrementalcapex/R&Dcapacitytoachievea70%2022Ereinvestmentrateofcashflow.Leveragecapacityisbasedonincrementalspendingperyearoverremainderofdecadebasedondifferencebetween2022Enetdebt/EBITDAand1.5x.DiversifiedTelecomServiceshaspositiveexcesscapacityfromreinvestmentthatgetscancelledoutbyleverageimpact.Source:GoldmanSachsGlobalInvestmentResearch27June202223GoldmanSachsGSSUSTAINExhibit15:The7%increaseinGreenCapexsparecapacityvs.ourpriorreportisdrivenbytheOil&Gassector,oneof4GreenCapex-criticalsectorsforwhichsparecapacityisforecastontherise(whileitisexpectedonthedeclinefor14sectorsandflattishfor2)ChangeinGreenCapexsparecapacityvs.ourOct.11,2021report—viaGreterReinvestmentofCashFlowsintoCapex+R&D,HigherLeverageandTotalChangeinGreenCapexsparecapacityvs.ourpriorreportDrivenbyReinvestmentRateDrivenbyLeverageTotalViaCF+R&DViaCapex+R&D$bn$bnAirFreight&Logistics$5$2$7($0)$7Airlines($17)($8)($25)($7)($32)AutoComponents$0($6)($6)($3)($9)Automobiles$0($1)($0)($3)($3)BuildingProducts($0)($0)($1)($1)($2)Construction&Engineering($1)($7)($8)($4)($12)ConstructionMaterials($2)($5)($7)($2)($10)DiversifiedTelecommunicationServices($14)$1($12)$0($12)ElectricalEquipment($4)($8)($12)($1)($13)ElectronicEquipmentInstruments&Components($3)($3)($6)($4)($10)EnergyEquipment&Services$2($1)$1$1$3IndependentPowerandRenewableElectricityProducers$4($5)($1)$0($1)Machinery($14)($2)($16)($7)($23)Metals&Mining$31($28)$2$4$6OilGas&ConsumableFuels$172($36)$136$95$231Road&Rail($4)($4)($8)($2)($10)Semiconductors&SemiconductorEquipment$4($21)($18)$2($16)Software($5)$2($4)($15)($19)TransportationInfrastructure$1($1)($1)$1$0WirelessTelecommunicationServices$2($0)$2($9)($7)Total$157($132)$25$45$70ExcludingOilGasandEnergyServices($17)($95)($112)($51)($164)Total$bn$bn$bnGreenarrows:increasegreaterthan5%.Yellowarrows:percentchangebetween+5%and-5%.Redarrows:decreasegreaterthan5%.Source:GoldmanSachsGlobalInvestmentResearch27June202224GoldmanSachsGSSUSTAINEconomicgrowthandconsumerimpactarekeyrisksLoweringoildemandinthefaceofasupplyshortagehastypicallytakenapricespikeandarecession.Globaloildemandhasonlyfalleninconsecutiveyearsthreetimesinthepast50.Thepasttwoperiodsinhistorywherewesawapricespikeinoilpriceslargeenoughtodriveadecreaseindemandwere2004-08and1979-81.Inboththeseperiods,wealsosawconcurrentorsubsequentglobalrecessions(1982and2009).Wehaveseenotherperiodsofeconomicweaknesssuchas2020(drivenbytheCOVID-19pandemic)and1992(flatteningofoildemandafteramoremodestincreaseinoilpricesin1989-91).Overall,loweryoyoildemandhasbeenrelativelyrare—evenduringtheCOVID-19pandemic,demandfellonly9%yoyin2020andcamebacksharplyin2021.Thefocustowardselectrificationandcostreductionincleaneralternativeslikesolar/windprovidegreaterconfidencethatoildemandviainnovationandpolicywilldecreaseonamoresecularbasis.OurEnergyteam’sbasecaseundernormaleconomicconditionsisthatglobaloildemandwillnotsecularlydeclinebefore2030.However,underinvestmentinsupplyandthepotential/actualdisruptionofproductionresultingfromtheRussia-Ukrainewariswarrantingpriceshighenoughtolowerdemand.Alonger-than-expectedinflationaryenvironment,inparticularwithregardtofoodandenergyprices,couldleadtoagreaterimpactonconsumerbehaviorandposearisktocorporatecashflowsovertimeinsectorsimportantforGreenCapex.AsdetailedinourSustainabilityimplicationsofanoilpricespikereport,highercommoditypriceshaveExhibit16:Pastperiodsofmulti-yeardemanddecreasesoftenoccurredconcurrentwithspikesinoilpricesandslowdownsinglobalGDPOildemandgrowth(leftaxis),globalGDPgrowth(leftaxis)andBrentoilprice(rightaxis),1970-2019Exhibit17:AsourCommoditiesResearchteamhashighlighted,thegapinbothwealthandincomeintheUShasbeenontheriseformuchofthepast40yearsRatioofthetop1%tobottom50%oftotalwealth(leftaxis)andtop1%tomediantotalincome(rightaxis)intheUS$0$20$40$60$80$100$120(8%)(4%)0%4%8%12%1970197219741976197819801982198419861988199019921994199619982000200220042006200820102012201420162018Brentoilprice,$/bblAnnualpercentagechangeOildemand(leftaxis)RealglobalGDPgrowthrate(leftaxis)Crudeoilprice($,Brentdated)0510152025300.00.30.60.91.21.51.8191319171921192519291933193719411945194919531957196119651969197319771981198519891993199720012005200920132017Ratiooftop1%avgincometomedianincomeRatiooftop1%tobottom50%intotalwealthRatiooftop1%tobottom50%totalwealthRatiooftop1%averageincometomedianincomeInequalitybottomedafteradecadeofinflationaryredistributionalpoliciesSource:BPStatisticalReviewofWorldEnergy2021,WorldBank,GoldmanSachsGlobalInvestmentResearchSource:GoldmanSachsGlobalInvestmentResearch,HaverAnalytics,IEA,EIA27June202225GoldmanSachsGSSUSTAINrefocusedattentionontheSocialaspectsofESG.ThespikeincommoditypricescomesatatimewhenwealthandincomeinequalityintheUSareatthehighestlevelsinnearlyacentury—puttingadditionalfinancialburdenonlow-incomeconsumers(Exhibit17).In2019,energyspending—includinggasolineandutilities—represented23%ofafter-taxincomeforUSconsumersinthelowestincomequintileversusjust4%forthoseinthetopquintile.Thegapforfoodconsumptionisevenmorestark—36%forconsumersinthebottomquintilecomparedto8%forthoseinthetopquintile(Exhibit19).Webelievetherearepotentialimplicationsforbothconsumer,corporateandgovernmentinvestmentinGreenCapexiftheseinflationarypressuresareprolonged.Economicuncertaintycouldleadtofewerexpectedglobalvehiclesales,thoughEVpenetrationisexpectedbyouranalyststoremainontrack.AsrecentlynotedbyourGlobalAutoteams,2022Eglobalautosalesvolumeshavebeenreviseddownwardstoa2.1%YoYdeclineversusa1.7%YoYincreasepreviously.KeydriversofthischangeincludethechallengingmacroenvironmentinChina,theUS,andIndiaandprotractedproductionconstraints.Productionvolumeshavealsobeenloweredto+2.2%YoY(vs.+5.7%YoYprior)inresponsetoslowprogressinresolvingsemiconductorshortagesanddelayswithpartsprocurementduetolockdownsinmajorcitiesinChina.Ourcolleaguesexpectamoderaterecoverytrendinbothautoproductionandsalesin2023.LookingattheEVsegment,theGlobalAutoteamshavekepttheEVshareoftotalautosaleslargelythesame,reflectinganimprovementinthetotalcostofownership(TCO)onaccountofhighergasolineprices,thelaunchofnewEVsbyautomakersinresponsetoenvironmentalregulationsbygovernmentsExhibit18:Consumerspendingonenergyconsumptionrepresents23%ofannualafter-taxincomeforthelowestincomequintileintheUS,versus4%forthehighestquintileUSenergyspendingaspercentofafter-taxincomequintiles,2019Exhibit19:Consumerspendingonfoodconsumptionrepresented36%ofannualafter-taxincomeforthelowestincomequintileintheUS,versus8%forthehighestquintileUSfoodspendingforconsumerunitsindifferentincomequintiles,20190%5%10%15%20%25%LowestSecondThirdFourthHighestUnitedStatesEnergyconsumptionas%ofafter-taxincomeGasolineUtilities,fuels,andpublicservices0%5%10%15%20%25%30%35%40%LowestSecondThirdFourthHighestUnitedStatesFoodspendingas%ofafter-taxincomeCerealsandbakeryproductsMeats,poultry,fish,andeggsDairyproductsFruitsandvegetablesOtherfoodathomeFoodawayfromhomeExcludestelephoneservicesSource:USBureauofLaborStatistics,HaverAnalytics,GoldmanSachsGlobalInvestmentResearchSource:USBureauofLaborStatistics,GoldmanSachsGroupInc.27June202226GoldmanSachsGSSUSTAINaroundtheworld,andfront-loadeddemandinanticipationoffurtherpricehikesforEVs(Exhibit20).Inrecentweeks,ourEconomicsteamhasreviseditsUSGDPgrowthforecastfor2022and2023to2.5%and1.6%respectively.IntheUS,slowereconomicgrowthwouldlikelyleadtoslowergrowthinbusinessinvestmentandconsumerspending,andhigherunemployment.Nevertheless,oureconomistsbelievethattheUSeconomywillmakeasoftlanding,witha35%riskofarecessionwithinthenexttwoyears.OurEconomicsteamexpectscurrenthighlevelsofinflationtoeaseintheneartermasmanycentralbanksfromaroundtheworldareonpathtotightenmonetarypolicy.Oureconomistsprojectthatheadlineinflationfor2022willbe7.1%intheUS,8.7%intheUK,and7.6%intheEuroArea.OurEconomicsteamexpectstheFOMCtoraisetheFederalfundsrateby50bpinfourconsecutivemeetingsinJune,July,SeptemberandNovember,andby25bpinitsDecemberandJanuarymeetings.Theterminalrateforecastfromoureconomistsis3.25-3.5%.FortheEurozone,oureconomistsbelievethathigherthanexpectedinflationpressurewillleadtheECBtoenditsassetpurchasesandstartraisinginterestratesinJuly.Exhibit20:OurGlobalAutoteamhaverecentlyreviseddownwardstheirexpectationsforautosalesin2022E-25E,whilekeepingEVweightingunchangedGlobalEVsalesforecast,June22estimates(darkblue)vsJanuary22estimates(lightblue),andEVweighting0%4%8%12%16%20%02468101214EVRatioUnitsales(Mn)Source:IHSGlobalInsight,IEA,GoldmanSachsGlobalInvestmentResearch27June202227GoldmanSachsGSSUSTAINExhibit21:OurEconomistsinAprilhighlightedthatfurthersupply-sideproblemsarearisktotheirexpectionsofaslowdowningoodsinflation,whichaccountsfortheentiretyoftheforecasteddeclineininflationin2022Exhibit22:EuroAreainflationcovergingtowardsUSlevelsForecastSGeCPInileadHrtheOterlShelevaTrdenitras-ConylppSudFoorgyEne)(%eary-on-raeye,tionlaPIinfCy3-2tOc3-2luJ3r-2Ap3-2naJ2-2tOc2-2luJ2r-2Ap2-2naJ1-2tOc1-2luJ1r-2Ap1-2naJ0-2tOc0-2luJ0r-2Ap0-2naJ9-1tOc9-1luJ9r-1Ap9-1naJ8-1tOc8-1luJ8r-1Ap8-1naJ1086420-21086420-2-10123456-10123456Jan-19Jul-19Jan-20Jul-20Jan-21Jul-21Jan-22Jul-22Inflationrate(%)EuroAreaHICPexEnergy,Food,Alcohol,andTobaccoUSPCEexFoodandEnergySource:DepartmentofCommerce,DepartmentofLabor,GoldmanSachsGlobalInvestmentResearchSource:HaverAnalytics,GoldmanSachsGlobalInvestmentResearch27June202228GoldmanSachsGSSUSTAINInnovationcouldaccelerateinCleanReliableEnergyandEnergyEfficiencyasaresultofgreaterdeploymentWebelievehighercommoditypricesshouldaccelerateinnovationwithgreaterfocusamongpolicymakers,corporatesandinvestorsonCleanReliableEnergyandEnergyEfficiency.Onthebackofrenewablesdeploymentsandpolicyinitiatives,weexpecthydrogentolikelyseeaccelerationinEurope(particularlydrivenbythepushtoreducerelianceonnaturalgasimportsfromRussia),withourEUEnergyteamnotinga3.5xupwardrevisioninEU’sGreenHydrogentargetsduetoREPowerEU.WecouldseebatterystoragedeployedatanacceleratedpaceintheUS,particularlyattheutility-scale.Inaddition,webelieveenergyefficiencycouldbecomeamoreimpactfulthemeparticularlyinregions—suchastheUS—wherethereisagreaterpotentialforinitialimpactfocusingonconsumeremissionsratherthancorporateemissions(pleaseseeourESGoftheFuturereportoncorporateGreenhouseGasemissionsformoredetails).Wearewatchingsevenkeytechnologies,withparticularfocusonhydrogenandbatterystorage.StayingonpathwithSustainableDevelopmentGoalswillrequirebreakthroughsacrossmultiplegreentechnologiestoabatecostsandbridgegapsineconomiccompetitiveness.FocusingonNetZerotargets,theurgencytofosterinnovationacrossvariousdecarbonizationtechnologiesiswhywebelievecompaniesexposedtothethemes(seeourGreenCapexreport)willplayanincreasingroleinthetransitiontowardsalowcarboneconomyandinthelong-term.Exhibit23highlights8criticaltechnologies—andrelatedinnovationareas—thatcouldprovidetransformationalanddisruptivesolutionstodrivedecarbonizationinthelong-term(seeourcolleagues’Chinade-carbonization:Aneweco-systemofgreentechformoredetails).Batterystorage:AswasdiscussedduringourGlobalSustainabilityForumanddescribedbyourcolleaguesinTheGreatnBatteryRacereport,batterystorageisincreasinglyinfocusamongmanagementsandinvestors,whichhighlightedtheirkeyroleforcompanies’operationsandonpathtobroaderdecarbonizationtargets.Hydrogen:AsdetailedinitsCarbonomics:TheCleanHydrogenRevolutionreport,ourEUEnergyteamexpectsglobalnhydrogendemandtogrowbetween2x-7xby2050Evs.2020,dependingonthetemperaturerisescenarioconsidered.ParticularlyonGreenHydrogenInEurope,onthebackofpolicysupportfromREPowerEU,ourcolleaguesexpect20MtonofrenewableH2by2030(anotableupgradevs.the5.6Mtonunderthe“Fitfor55”initiative),ora>3.5xupwardrevisioninthesametimeframe,stemmingfromacombinationoflocallyproducedandimportedvolumes.27June202229GoldmanSachsGSSUSTAINEnergyEfficiency:Ouranalysisofconsumervs.corporatesgreenhousegasemissionssuggestssolutionstoreduceconsumeremissionsmightreceivegreaterfocusinregionswheretheopportunityforinitialimpactfocusingonconsumeremissionsisgreater.Webelieveenergyefficiencycouldbecomeamoreimpactfulthemeincountries—liketheUS—whereconsumeremissionsrepresentagreateropportunityforinitialimpact(pleaseseeExhibit24andourESGoftheFuturereportoncorporateGHGemissionsformoredetails),withdeploymentofsolutionslikelytobeacceleratedbytherecentspikeincommodityprices.AswedetailinourGreenCapex:MakingInfrastructureHappenreport,achievingNetZerotargetswillrequireanall-inapproachacrossmultipletechnologyverticals,withinvestmentsinEnergyEfficiencythatwouldneedtoexceed$600bnannuallyinthe2020sinordertomeetthosetargets.Inourview,investorfocuscouldtendtogravitatetowardsthosecompaniesthatareinstrumentalorleveredtoEnergyEfficiencythemes.Asaresult,weseetheopportunityforgreaterrecognitionamongESGinvestorsofcompanieswhoseproducts/servicescanenablegreaterenergysavingsorlowerenergyconsumption,ontheresidentialside(e.g.,energy-efficienthomesandHVACproducts)andcommercial/industrialside(e.g.,electrificationandfactoryautomation).Exhibit23:InnovationsacrossmultipletechnologiescouldhelplowerthecostofdecarbonizationandintroducenewclimatesolutionsSelectfocusareasfordecarbonizationtechnologicalinnovationTechnologiesInnovationareasTechnologiesInnovationareasNextgenhighcellefficiencytechnologiesNewcapturetechnologiesOptimizationofwafersizeandthicknessOptimizationofinputcostsChangesinmoduledesignLocalizationofcleanhydrogenecosystemsUltra-HighVoltage(UHV)linesFuelcellvehiclesEquipmentandsoftwareupgradesGas-fireddistributedgenerationElectrificationofconstructionequipmentSustainableAviationFuel(SAF)solutionsEAFandhydrogensteelproductionDigitalizationCostdeflationsinSiliconCarbideImprovementsinbatteryenergydensityImprovementsinelectrolyzers(performanceandcost)Graphenebasedsuper-fastchargingAdvancementsinfuelcells(performanceandcosts)ElectrificationBatteryStorageGridTransmissionCarbonCaptureLowCarbonProduction&EnergyConservationLowCarbonFuelHydrogenSource:GoldmanSachsGlobalInvestmentResearch,GaoHuaSecuritiesResearch27June202230GoldmanSachsGSSUSTAINExhibit24:Ourindicativeindexthatdividescountryemissionsintensityper$ofGDPbycorporateemissionsintensityperdollarofrevenuesuggestspotentialgreaterinitialimpactfromfocusingdecarbonizationeffortsonconsumersintheUSandJapanandoncorporatesinIndiaandotheremergingmarketsCountryemissionsintensityindex/corporateemissionsintensityindex,2019sssioniemumeronsCex)ndioratetysintenisonssi52.02.51.ytensisonssieporatntensiissiemiporatorCrpco/exndintryou(CsemieratorpoC/ntryouCbiaolomCandiIelhiCabiAraiaudSianesndoIreapongiSaywrwNordenewSnaentigrAndolaPeeecrGEAUndalhaiTlugatorPlziarBnpaiScarifAouthSandzerltiwScoiexMurkeyTylatIncearFmuigelBdsanlheretNeaorKhoutSndaelrIaiussRnahiCUKnyaermGaiustrAairalustAdaanaCndalaZeewNnpaJaUS01.50.00.Indexvaluescalculatedbydividingacountry’soverall/corporateemissionsintensityvaluesbythemedianvaluesofthecomparisonset.Darkbluebarsrepresentdevelopedcountries,lightbluebarsrepresentdevelopingcountries,andstrippedbarsrepresentcountrieswithmorethan3500degreedaysin2019.Source:GoldmanSachsGlobalInvestmentResearch27June20223<GoldmanSachsGSSUSTAINPolicysupportleadingtoriseinlong-terminvestmentinEuropePoliciesandgovernmentsupportcouldplayakeyroleinbridgingthegaptowardsachieving$2.8tnincrementalGreenCapexannually.Wenotethatgovernmentsarelikelytoplayacriticalrolein:(1)supportingGreenCapexwithmultiplemechanisms—e.g.,fiscalpolicy;and(2)providingthenecessaryregulatoryclaritytostimulateadditionalengagementinGreenCapexfrompublicandprivatecompanies.Webelievethistobeofparticularimportancetobridgethe$0.9tngapinincrementalannualGreenCapexneeded(assumingdeploymentofpubliccompanysparecapacitytoGreenCapexbycorporatesorinvestors),aswedetailabove.Amongpolicymeasures,wenotetherecentInfrastructureBillinUS,China’s14th5-yearplanandEU’sGreenDealassupportiveofGreenCapexinitiatives.InEurope,wenotetherecentREPowerEUinitiativeshouldgenerateadditionalsupporttoGreenCapex,withparticularregardtorenewables,electrificationandhydrogenverticals,amongothers.IntheUS,wearewatchingforgreaterdetailsandclarityregardingpotentialconsiderationbyCongressoftheclimateinitiativesfromtheBuildBackBetterbill,whichcouldprovideadditionalstimulustowardscleanelectricity,electricvehiclesandenergyefficiency.PleaseseeAlecPhillipsandJosephBriggsnote,BuildBackLaterorBuildBackNever,forthelatestupdateonourEconomicsteam’sviews.EuropeREPowerEUlikelytoaccelerateGreenCapexinvestments,acceleratingtheenergytransitionwhileprotectingmost-exposedconsumers.TheEuropeanCommissionsdetailedinMarch2022acomprehensiveplan—REPowerEU—toreducerelianceonnaturalgasimportsfromRussia,asaresponsetotheconflictinUkraine.WebelievealltheseinitiativeswillbesupportiveofGreenCapexinvestments,whicharelikelytoaccelerate,inourview.InitsMay18update,theEUCommissionsoutlinedfasterpermitting,highercapacitytargetsandEUgrants/loanstosupporta5xaccelerationinannualrenewablecapacityadditionsby2026E-2030E—basedonourcolleagues’view.AsourEuropeanUtilitiesteamwrote:Renewabletargetsaretobeincreased.TheCommissionproposestoincreasetheheadline2030targetforrenewablesnfrom40%to45%undertheFitfor55package.ThisincludesadedicatedEUSolarStrategytodoublesolarphotovoltaiccapacityby2025andinstall600GWby2030.Energyefficiencytargetstobesteppedup.TheCommissionproposestoenhancelong-termenergyefficiencynmeasures,includinganincreasefrom9%to13%ofthebindingEnergyEfficiencyTargetunderthe‘Fitfor55’packageofEuropeanGreenDeallegislation.AsourEUUtilitiesteamhasnoted,meetingallthegoalsoutlinedinthe‘Fitfor55’packagewouldrequirethemobilizationof€3.7tnofcapitalby2030,intheirview.OurUtilitiesteamestimatesthatmorethanhalf(c.€2.2tn)couldbeprivatelyfundedinvestment,carriedoutforthemostpartbygreenenergycompanies(Exhibit26).27June202232GoldmanSachsGSSUSTAINInnovationfundtobeusedforhydrogendevelopment.TheCommissionwillrolloutcarboncontractsfordifferencetonsupporttheuptakeofgreenhydrogenbyindustryandspecificfinancingforREPowerEUundertheInnovationFund,usingemissiontradingrevenuestofurthersupporttheswitchawayfromRussianfossilfueldependency.OurEUUtilitiesteamestimatesthattheplanwouldimplymorethan€1trnininvestmentsinrenewablesby2030,andc.€0.7trninpowernetworks.SeeExhibit25formoredetails.Thiswouldbepairedwithfurtherinvestmentsinstoragetechnologiesandgreenhydrogen,besideastrongincreaseinpowerdemand—thankstotheelectrificationpushoftheoveralleconomy.REPowerEUisdeeplycenteredonenergysecurity:developingwindandsolarisoneofthethreekeypillars(alongsideenergysavingsandthediversificationofenergyimportsources)toreducefossilfuelimportsandboostenergysecurity.Asourcolleaguesnote,theEUaimstoreacharenewableinstalledbaseof1,200+GWby2030.Thiswouldimply:(1)ac.15%upgradevstherecent“Fitfor55”plan,(2)anearly3.5xincreaseintheRESinstalledbasevs2021,and(3)c.100GWannualadditionsfromnowuntiltheendofthe2020s,onaverage.Ourcolleaguesexpecttheannualrun-ratetoapproachc.150GWannuallyinthe2ndhalfofthedecade,or5xlargerthanthecurrentrun-rate.Asareference,thispacewouldbebroadlysimilartothecurrentamountofwind/solarannualadditions,globally.ChinaChina’s14th5-yearplanencouragesmoreoptimizedrenewablesdevelopments,efficientstorage(includinghydrogenproduction),innovationinrenewablesandmarket-drivenregulationofrenewabledeployments.OnJune1,Exhibit25:Annualinvestmentsinwind/solarcouldrisefromc.€25bnpain2016-20,toc.€170bnby2030EAnnualcapexforrenewablesevolutioninEurope,GSe(€bn)Exhibit26:Fitfor55planimpliesc.€3.7tnofcapitalmobilisationby2030E,morethanhalfincleanenergyinvestmentsEUFitfor55mobilizedcumulativeinvestmentsbreakdown(percentage)255368657391113148165168172Renewables27%Transmissiongrids4%Distributiongrids14%Batteries2%Hydrogen5%EnergyEfficiency18%Mobility-cars18%Mobility-heavydutyChargingpoints2%Heating6%CCS1%PrivatelyfundedcleanenergyinvestmentsFitfor55Source:GoldmanSachsGlobalInvestmentResearchSource:GoldmanSachsGlobalInvestmentResearch27June202233GoldmanSachsGSSUSTAINtheChinesegovernmentannouncedtheRenewableenergydevelopmentplanforthe14th5-yearplanperiod.Whilemostnumericaltargetsareuntouchedinregardtothecarbonpeakactionplan(Chinaistargetinganincreaseinnon-fossilenergyconsumptiontoaccountfor20%ofthetotal,risingto25%by2030),theplanproposes(pleaseseeourAsiaCleanEnergyteamnoteformoredetails):Optimizeddevelopmentofrenewables,particularlyonalarge-scale,combinedwithanexpansionofpowerntransitions—fornewpowerlines,renewableenergyshouldbenolessthan50%—amongotherinitiatives.Promotionofenergystorageandconsumption,throughacceleratedconstructionofpumpedstorage—inparalleltoanpushtoadvanceotherearlier-stagetechnologies,localconsumptionofrenewableenergyandimprovementsindeliveryandconsumptionofrenewableenergyacrossregions.Theplanalsoencourageshydrogenproductionutilizingrenewableenergyandhydrogenconsumption.Innovation-driven,high-qualitydevelopmentofrenewableenergy,viagreatereffortstoinnovateinrenewablenenergytechnologyandimprovementsinthemodernizationofrenewablesindustryandsupplychains.Achievemarket-orienteddevelopmentofrenewableenergybyoptimizingmechanisms,viastreamliningprocessesnintherenewableenergyindustryandimprovingthemechanismstoguaranteerenewableenergyconsumption.UnitedStatesBuildBackBetterclimateinitiatives—whichmayberevisitedbyCongressinsomeform—includedc.$325billioningreenenergytaxincentivesover10years,55%ofwhichdirectedtowardsrenewables.MostofthegreenenergyprovisionsintheBuildBackBetterAct(BBB)wouldcomeintheformoftaxcreditsthatincentivizebusinessestoinvestinandproducerenewableenergyandlowemissionfuels,andindividualstomakepurchasesthatimprovetheenergyefficiencyoftheirhomesandtransportationchoices.TheBBBwouldextend,andinmanycasesexpand,existingcleanenergytaxincentives,makingthedollaramountslargerandpaymenttermsmorefavorable.AccordingtotheCongressionalBudgetOffice(CBO),thesechangeswouldresultin$111billioninincrementaldirectFederalspendingand$224billioninpotentiallossofgovernmentrevenues.Inaddition,theBBBwouldintroducelaborrequirementthatcompaniesmustmeetinordertoclaimthemaximumallowedcreditrate.BasedonourGreenCapexMosaiccategories,weestimatethatabout$176billionofthegreenenergyspendingfromBBBwouldbedirectedtowardsrenewables,approximately55%ofthetotal(Exhibit27).ThelargestprogramswithinthiscategoryaretheextensionoftheexistingrenewableelectricityProductionTaxCredit($55billion)andcleanenergyInvestmentTaxCredit($53billion),andapotentialnewcleanelectricityITC($37billion).Inadditiontotaxincentives,BBBwouldalsoprovideapproximately$39billionovertenyearsindirectfundingforrenewableenergy,energyefficiencyandsustainabletransportationthroughtheDepartmentofEnergy.Theseinclude27June202234GoldmanSachsGSSUSTAIN$12.5billionforresidentialefficiencyandelectrificationrebates,$7billionforlow-carbonreinvestmentinenergycommunities,and$6.5billionfortheproductionofelectricandotheradvanced-technologyvehicles.AnnualFederalspendingonthesethreeareashavelargelystayedflatataround$2billiononaninflation-adjustedbasis,overthepastdecade—initsbudgetproposalforFY2022,theBidenAdministrationsignificantlyincreasedthebudgetrequestedfortheseareasto$4.3billion(Exhibit28).PleaseseeourreportontheoutlookforUSemissionsformoredetailsonBBB.WereiterateitisnotourWashingtonEconomicsResearchteam’sbasecaseviewthatabillpassesthisyear,andasthereisgreaterclarityonpotentialproposalswecancomparevs.currentpoliciesandwhatwasconsideredinBuildBackBetter.Exhibit27:RenewablesmakeupmorethanhalfofthetotalgreenenergytaxincentivesintheclimateportionoftheBuildBackBetterActCBOestimatesof10-yeargreenenergyspendingintheBBB,categorizedbasedontheGSSUSTAINGreenCapexMosiac)US$snoill(Bitc018051021dnepstcerDieevrfossLognideuencffeerytaegdubltaoT90603000Source:CongressionalBudgetOffice,CongressionalResearchService,GoldmanSachsGlobalInvestmentResearch27June202235GoldmanSachsGSSUSTAINExhibit28:Federalspendingonenergyefficiency,renewableenergy,andsustainabletransportationhavestayedlargelyflatoverthepastdecadeAnnualbudgetforthesethreeareaswithintheDepartmentofEnergy,FY2002-FY2022$)US2220insn.01008.06.onillbi1.8$2asw0920FYnietdgbuotalTyencicffiegynerEgyereenblnewaReotitarpotranselbnataiusSnoonliBilet(dgbuDoE04.02.0000.TotalbudgetforFY2009included$16.7billioninadditionalfundingprovidedbytheAmericanReinvestmentandRecoveryAct.BudgetforFY2022doesnotincludefundingfromtheInfrastructureInvestmentandJobsAct.Source:USDepartmentofEnergy,GoldmanSachsGlobalInvestmentResearch27June202236GoldmanSachsGSSUSTAINSectorsthatstandoutpostourlatestupdateAheadofvaluationconsiderations,webelieveESGandgeneralistinvestorswilllookincrementallyatinvestmentattractivenessforstocksofcompaniesexposedtoGreenCapexbasedon:(a)corporatereturnsattractiveness,resilienceandmomentum;and(b)sparecapacityforreinvestmentviafreecashflowandbalancesheetstrength.ThesecanbothcapturethefinancialhealthaswellastheopportunityforengagementtowardsdirectingcapitaltomaximizeGreenCapexorESGimprovement.Weconsidersectorsthatstandoutinthissection.CorporatereturnsAmongthe23GreenCapex-criticalsectors,SemisandSoftwarearethetwowherereturnsexpectationshavenotdegradedsinceFebruary,areforecastaboveaverageandontheriseincomingyears.Sector-levelestimatesforSemiconductorsandSoftwareindicatereturnsexpectationsroughlyunchangedvs.ourFeb.2report,abovetheweightedaverageforallsectorsex.FinancialsandRealEstateof12.8%(referredtothe2022E/2023Eaverage)andrisingin2023Eor2024Evs.2022E(Semisreturnsareforecasttoincreasein2023Evs.2022E,Softwarereturnsareexpectedontherisein2023Eand2024Evs.2022E).SeeExhibit29forthefulloverview.Onthebackonthefavorablecorporatereturnsoutlook,webelieveSemiconductorsandSoftwarecouldpotentiallyattractgreaterappreciationoftheirroleintheGreenCapexsupplychain.OnSemisparticularly,wehighlightedinourGreenablers:Semiconductorsreportthesector’scontributiontoemissionsavoidanceviaenablingmoreenergy-efficientproducts—inourview,thisisakeyexampleofthesector’simpact,stillunderappreciatedamongESGinvestors.Importantlyhowever,ouranalystsonthebackofthefirsttwodaysofourGlobalSemiconductorconferencehighlightedcompanycommentaryregardingweaknessindemandfromconsumer-facingendmarketsaswellasashortageoffoundrysupply,evenassignalsfordemandfromautosanddatacentersremainrobust.OnSoftware,webelieveCybersecurityisapotentiallyoverlookedareaamongESGinvestorsthatcouldreceivegreaterattention,givenitscriticalroleininsulatingagainstcyber-threatsaselectrificationanddigitalizationaccelerateonpathtoDecarbonization,CleanWaterandInfrastructuregoals.Morebroadly,ex.SemisandSoftware,returnsexpectationsarefavorablefor12otherGreenCapex-criticalsectors.Inparticular,ouranalysisindicates:Returnsexpectationshavebothnotdegradedvs.ourFeb.reportandarerisingin2023Eor2024Evs.2022Efor6nsectors:Automobiles,EnergyEquipment&Services,Multi-Utilities,Road&Rail,TransportationInfrastructureandWirelessTelecommServices.Returnsareexpectedtobebothaboveaverage(referredtothe2022E/2023Eaverage,ex.FinancialandRealEstate)andn27June202237GoldmanSachsGSSUSTAINarerisingin2023Eor2024Evs.2022Efor4sectors:AirFreight&Logistics,BuildingProducts,ElectronicEquipmentandMachinery.ForcoveredGlobalCleanTechcompanies—mostlyinclusiveofsolar/wind/water/batterystorage/hydrogen—corporatereturnshavedegradedvs.priorreports(mostlyduetosupplychainpressureandinflationaryenvironment)butarestillbothaboveaverageandprojectedontherise.Returnsexpectationshavebothnotdegradedvs.ourFeb.report,andareaboveaverage(vs.2022E/2023Eaverage,ex.nFinancialsandRealEstate)for2sectors:Oil/GasandMetals/Mining.Asdescribedinearliersections,giventheelevatedconcentrationofGreenCapexsparecapacityinthesectors,webelieveinvestors’focusonESGImproverscouldrise—seesectionbelow.Amongthe23GreenCapex-criticalsectors,reinvestmentratesofoperatingcashflowintocapex+R&Dareexpectedaboveglobalaveragein2022E/23Efor16.Theremaining7—AirFreight&Logistics,BuildingProducts,EnergyEquipment,Machinery,Metals&Mining,Oil/GasandSoftware—areforecasttohavereinvestmentratesbelowaverage.WenotethatGlobalCleanTechcompaniesareexpectedtoseereinvestmentratesaboveaverage.27June202238GoldmanSachsGSSUSTAINExhibit29:SemiconductorsandSoftwarearethetwosectorsforwhichreturnshavenotdegraded,arestillaboveaverageandareforecasttorise.Wehighlight11othersectorsinadditiontoOil&GasandMetals&MiningthatmeettwoofourthreecorporatereturnscriteriaOverviewofsectorsforwhich(1)corporatereturnsanalystestimateshavenotdegradedvs.ourFeb.2report,(2)estimatedcorporatereturnsin2022E-23Eareaboveaverage(ex.FinancialsandRealEstate)and(3)corporatereturnsareforecasttorisein2023Eor2024Evs.2022E.Boldedsectorshaveabove-average—ex.Financials&RealEstate—reinvestmentrate(refersto2022E-23Eaverage)Corporatereturnsareconsiderednotdegradedifcurrentestimatesarehigherthanorwithin0.2%ofpriorestimates.Calculationsrefertothesector22E/23EaverageCROCI.Source:GoldmanSachsGlobalInvestmentResearch27June202239GoldmanSachsGSSUSTAINGreenCapexsparecapacityWebelievethemorefavorableoutlookoncorporatereturnsinOil&GasandMetals&MiningsectorscouldovertimedrivegreaterconsiderationforESGImproversstrategies.AsseeninExhibit29,Oil&GasandMetals&Miningarethetwosectorsforwhichcorporatereturnsareforecasttonotdegrade/improve(vs.priorexpectationsfromFebruary)andtobeabove-averagein2022E/2023E.WebelievetheabilitytomaintainafavorableprofileincorporatereturnswhilepotentiallydeployingmoreGreenCapexwillbeakeyareaoffocusforinvestorsinselectingwhichcompaniestoreward—asdetailedearlierandinourGreenCapexseries,Returnsisoneofthefourpillarsofour“CARE”framework,i.e.,thelenswebelieveinvestorscouldusewhenevaluatingcompanies’newGreeninitiatives.Asaresult,weseeopportunityforgreaterrecognitionofESGImprovers,whereinvestorscouldpotentiallyrewardthosecompaniesforwhichthemixofGreenRevenue/Capexisforecasttoincreaseand/orGreenhouseGasemissionsintensitiesareprojectedtomeaningfullydecline.DivestmentDilemma:ThehigherconcentrationofGreenCapexsparecapacitycouldalsoincreaseconsiderationofengagement(vs.exclusion)strategiesforESGImproverswithfavorablefreecashflow.Oil&GasandMetals&MiningsectorsrepresentahigherportionoftheGreenCapexsparecapacityweseeamongpubliccompaniesvs.ourpriorreports—nowaccountingformorethan80%ofthetotalvs.63%prior—onthebackoftheinflationarycommodities’environment.AswenotedinourDivestmentDilemma:ExcludeorEngagereport,weseearisingdebateamonginvestorsastowhethertoengagewithsectorshistoricallyexcludedfromESGfocusbasedonquantifyingESGImprovement.AsGreenCapexsparecapacitygrowsandbecomesmoreconcentratedintheOil&GasandMetals&Miningsectors,weseearisingcaseforengagementvs.exclusiontohavevoiceinhowfreecashflowshouldberedirected(GreenCapex,returntoshareholdersorbasebusiness).27June202240GoldmanSachsGSSUSTAINGreenCapexincreaseshavenotbeenappreciatedinstockpricesoverthepastsixmonthsGreenCapexcompaniesforwhichconsensusCapex+R&Destimateshaveincreasedinrecentmonthshavenotbeenrewardedbyinvestors.Thestrongfocusonreturningcashtoshareholdersprovideslimitedvisibilityonwhetherinvestors—atleastinitially—willsupportcapexincreasesnotfundedbyassetsalesthatresultinrisingreinvestmentrates.Inrecentmonths,stocksinGreenCapexsectorsforwhichconsensusCapex+R&Dexpectationshavebeenrevisedupwardsthemostvs.priorestimateshavegenerallyunderperformedtheirsectorpeers,onanaverage-basis(Exhibit30)—forasimilaranalysisrelatedtotheSemiconductorsindustry,pleaseseeourSemiconductorsGreenablersreport.PartofthereasonforthisislikelyadebatewithineachGreenCapexsectorastowhethertheneedforexpansioniscyclicalorsecular.WhilewebelievetheneedforincreasedGreenCapexissecular,weseenormalinvestordebatesoverwhenintheCapexvs.FCFcyclewilldriveequityoutperformance.Webelieveforcompaniesincreasingcapex(particularlyonlongerleadtimeprojects),investorsarelikelytofocuson:Whethertheincreasedcapexwillleadtosimilarvs.greatervs.lowercorporatereturns;andnThetimehorizonoftheinvestmentcycleandwhenacompanywouldshiftfrominvestmentmodetoharvestmoden(whenprojectscomeonline).ParticularlyamongGreenablers—i.e.,thosesectorswherecapitalinvestmentsareneededmoreurgentlyduetolongerprojectlead-times(seeourGreenCapexreportformoredetails)—webelievetherewilllikelybeamoreurgentfocusonthelevelofGreenCapexamongSustainabilityinvestorsinthecomingmonthsandyearstohavegreaterconfidenceinexecutiononsufficientlyexpandingelectricvehiclepenetration,renewablescapacity,automationandbroaderinfrastructure,amongotherkeygoals.27June20224<GoldmanSachsGSSUSTAINExhibit30:Outofthe100companieswiththelargestupwardrevisionsin2022EconsensusCapex+R&Destimates,stocksinGreenCapexsectorshavegenerallyunderperformedtheirsectorpeersPriceperformancevs.GICS3peersforGreenCapexstocksamongtop-100companiesforwhichconsensusCapex+R&Destimateshavemovedupwardsthemostvs.6monthsago(blueline),3monthsago(lightblueline)or1monthago(grayline)Exhibit31:StocksthatscreenforeachofourthreeGreenCapexinvestmentthemeshaveoutperformedrespectivebenchmarkssincethebeginningof2020andthebeginningof2021butnot2022YTDAveragerelativestockperformanceofGreenRevenueBeneficiaries,GreenRe-investorsandGreenablerssinceJan.1,2020-10%-8%-6%-4%-2%0%2%4%GreatestupwardrevisionsinCapex+R&Dvs.GreatestupwardrevisionsinCapex+R&Dvs.GreatestupwardrevisionsinCapex+R&Dvs.-10%0%10%20%30%40%50%60%70%80%Jan-20Feb-20Mar-20Apr-20May-20Jun-20Jul-20Aug-20Sep-20Oct-20Nov-20Dec-20Jan-21Feb-21Mar-21Apr-21May-21Jun-21Jul-21Aug-21Sep-21Oct-21Nov-21Dec-21Jan-22Feb-22Mar-22Apr-22May-22Jun-22Re-investors(vs.GICS3peers)Greenablers(vs.MSCIACWI)Greenrevenue-exposed(vs.MSCIACWI)Note:Equalweightedindices.Includesstockswithcorporatereturnsaboveaverage--referredtoglobalorregionalsectoraverage,ex.Greenablers.StockselectionbasedonconstraintsdiscussedinGreenCapex:MakingInfrastructureHappenreport,butincludesNeutralandSell-ratedstocksasopposedtojustBuy-ratedstocks.54%62%45%Rolling7-dayaverageSource:FactSet,ThomsonReuters,GoldmanSachsGlobalInvestmentResearchSource:Refinitiv,FactSet,GoldmanSachsGlobalInvestmentResearch27June202242GoldmanSachsGSSUSTAINHowGSSUSTAINcanhelpGSSUSTAINcanprovideaccesstoproprietarytoolsandresourcestoquantifyimpactandidentifyESGImprovers,enablinggreaterrecognitionofunderappreciatedopportunitiesacrosssectors.OurofferingofSUSTAINtoolscanhelpinvestorstoanswerESGquestionsattheportfolioandsecuritylevels,enablingmoresystematizedandquantitativereportingwhileprovidingdetailedandtransparentdatasetsforideageneration,securityselectionandcorporateengagement.Ourmulti-prongedSUSTAINscoringframeworkcanhelpprovidegreatergranularityandobjectivityforassetnmanagersinbothsecurityselectionandreporting.Theframeworkacross>7,000companiesincludesourrecentlyintroducedProductAlignmentframework,basedontheSDGs,EUTaxonomyandGSanalystviews,andcanhelpinvestorscastawidernetinthesearchforimpactideasalignedtolessobvioussustainabilitythemes.Existingpillarsdetailperformancearoundsector-specificenvironmentalandsocialoperationalmetrics,governance,andcontroversies.Forward-lookingestimates.Lookingahead,webelieveinvestmentperformancewillbemoredrivenbyfuturechangenandhavetakenourfirststepstowardincorporatingforward-lookingestimatesinourproprietaryindustryanalystinputs,whichnowincludesustainableproductrevenueandcapexinselectindustries.Ofthemorethan3,000companiesunderGScoverageglobally,53%sawachangeinnetE&Sscoresasaresultofouranalystsurveyinputs.Furthermore,wehavetakenfirststepstoofferingquantitativeforecastsofsustainableproductrevenue/capexfor~650companiesin19industries.WenowaddScope1and2greenhousegasemissionsforasmallersegmentofcompaniesin7sectors.EUTaxonomyrevenuealignment.WeseetheEUTaxonomyasoneofthemostseminalregulatorydevelopmentsndrivingstandardizationinreportingforcorporates/assetmanagers.OurEUTaxonomyalignmenttoolmapscompanyrevenuestoTaxonomy-definedactivitiestoestimatepotentialTaxonomy-eligibleandalignedrevenuebasedontechnicalscreeningcheckswheredataexist,and“DoNoSignificantHarm”and“MinimumSocialSafeguards”criteria.SDGrevenuealignment.TheUNSustainableDevelopmentGoals(SDGs)haveemergedasoneofthemostcommonlynusedframeworksfortaxonomizingimpactacrossabroadsetofsustainabilitychallenges.OurSDGalignmenttoolemploysgranularrevenuedata,GSanalystinputsandothercompanymetadatatomapalignment,exposureandmisalignmenttotenoftheSDGswedeemtobemostinvestable.ESGfundownership.Aggregatingfundholdingsacrossauniverseof~3,000ESGfunds,weanalyzethispoolofESGnassetstobetterunderstandtrendsinESGownershipatboththesectorandcompanylevel.ThefulldatasetprovidesabsoluteandmomentumESGownershipdetailforwellover10,000securities.ESGfundflows,valuationsandperformance.OurESGTrackerseriesanalyzestheaforementionedESGfunduniversentogaugeESGfundflowmomentumandsizingrelativetothebroadermarket,breakingoutdifferencesbystrategy,fundtypeandfundstyle.Thetrackeralsoexaminesvaluationandperformanceacrosscategories.27June202243GoldmanSachsGSSUSTAINSource:GoldmanSachsGlobalInvestmentResearch27June202244GoldmanSachsGSSUSTAINSource:GoldmanSachsGlobalInvestmentResearch27June202245GoldmanSachsGSSUSTAINDisclosureAppendixRegACWe,BrianSinger,CFA,EnricoChinello,Ph.D.,MichaelHaoWu,CFA,DerekR.Bingham,EvanTylenda,CFA,SharminiChetwode,Ph.D.,MadelineMeyer,KeebumKim,BrendanCorbett,EmmaJones,GraceChenandRachitAggarwal,herebycertifythatalloftheviewsexpressedinthisreportaccuratelyreflectourpersonalviewsaboutthesubjectcompanyorcompaniesanditsortheirsecurities.Wealsocertifythatnopartofourcompensationwas,isorwillbe,directlyorindirectly,relatedtothespecificrecommendationsorviewsexpressedinthisreport.Unlessotherwisestated,theindividualslistedonthecoverpageofthisreportareanalystsinGoldmanSachs’GlobalInvestmentResearchdivision.GSFactorProfileTheGoldmanSachsFactorProfileprovidesinvestmentcontextforastockbycomparingkeyattributestothemarket(i.e.ourcoverageuniverse)anditssectorpeers.Thefourkeyattributesdepictedare:Growth,FinancialReturns,Multiple(e.g.valuation)andIntegrated(acompositeofGrowth,FinancialReturnsandMultiple).Growth,FinancialReturnsandMultiplearecalculatedbyusingnormalizedranksforspecificmetricsforeachstock.Thenormalizedranksforthemetricsarethenaveragedandconvertedintopercentilesfortherelevantattribute.Theprecisecalculationofeachmetricmayvarydependingonthefiscalyear,industryandregion,butthestandardapproachisasfollows:Growthisbasedonastock’sforward-lookingsalesgrowth,EBITDAgrowthandEPSgrowth(forfinancialstocks,onlyEPSandsalesgrowth),withahigherpercentileindicatingahighergrowthcompany.FinancialReturnsisbasedonastock’sforward-lookingROE,ROCEandCROCI(forfinancialstocks,onlyROE),withahigherpercentileindicatingacompanywithhigherfinancialreturns.Multipleisbasedonastock’sforward-lookingP/E,P/B,price/dividend(P/D),EV/EBITDA,EV/FCFandEV/DebtAdjustedCashFlow(DACF)(forfinancialstocks,onlyP/E,P/BandP/D),withahigherpercentileindicatingastocktradingatahighermultiple.TheIntegratedpercentileiscalculatedastheaverageoftheGrowthpercentile,FinancialReturnspercentileand(100%-Multiplepercentile).FinancialReturnsandMultipleusetheGoldmanSachsanalystforecastsatthefiscalyear-endatleastthreequartersinthefuture.Growthusesinputsforthefiscalyearatleastsevenquartersinthefuturecomparedwiththeyearatleastthreequartersinthefuture(onaper-sharebasisforallmetrics).ForamoredetaileddescriptionofhowwecalculatetheGSFactorProfile,pleasecontactyourGSrepresentative.M&ARankAcrossourglobalcoverage,weexaminestocksusinganM&Aframework,consideringbothqualitativefactorsandquantitativefactors(whichmayvaryacrosssectorsandregions)toincorporatethepotentialthatcertaincompaniescouldbeacquired.WethenassignaM&Arankasameansofscoringcompaniesunderourratedcoveragefrom1to3,with1representinghigh(30%-50%)probabilityofthecompanybecominganacquisitiontarget,2representingmedium(15%-30%)probabilityand3representinglow(0%-15%)probability.Forcompaniesranked1or2,inlinewithourstandarddepartmentalguidelinesweincorporateanM&Acomponentintoourtargetprice.M&Arankof3isconsideredimmaterialandthereforedoesnotfactorintoourpricetarget,andmayormaynotbediscussedinresearch.QuantumQuantumisGoldmanSachs’proprietarydatabaseprovidingaccesstodetailedfinancialstatementhistories,forecastsandratios.Itcanbeusedforin-depthanalysisofasinglecompany,ortomakecomparisonsbetweencompaniesindifferentsectorsandmarkets.DisclosuresDistributionofratings/investmentbankingrelationshipsGoldmanSachsInvestmentResearchglobalEquitycoverageuniverseAsofApril1,2022,GoldmanSachsGlobalInvestmentResearchhadinvestmentratingson3,143equitysecurities.GoldmanSachsassignsstocksasBuysandSellsonvariousregionalInvestmentLists;stocksnotsoassignedaredeemedNeutral.SuchassignmentsequatetoBuy,HoldandSellforthepurposesoftheabovedisclosurerequiredbytheFINRARules.See‘Ratings,Coverageuniverseandrelateddefinitions’below.TheInvestmentBankingRelationshipschartreflectsthepercentageofsubjectcompanieswithineachratingcategoryforwhomGoldmanSachshasprovidedinvestmentbankingserviceswithintheprevioustwelvemonths.RegulatorydisclosuresDisclosuresrequiredbyUnitedStateslawsandregulationsSeecompany-specificregulatorydisclosuresaboveforanyofthefollowingdisclosuresrequiredastocompaniesreferredtointhisreport:managerorco-managerinapendingtransaction;1%orotherRatingDistributionInvestmentBankingRelationshipsBuyHoldSellBuyHoldSellGlobal50%35%15%65%57%45%27June202246GoldmanSachsownership;compensationforcertainservices;typesofclientrelationships;managed/co-managedpublicofferingsinpriorperiods;directorships;forequitysecurities,marketmakingand/orspecialistrole.GoldmanSachstradesormaytradeasaprincipalindebtsecurities(orinrelatedderivatives)ofissuersdiscussedinthisreport.Thefollowingareadditionalrequireddisclosures:Ownershipandmaterialconflictsofinterest:GoldmanSachspolicyprohibitsitsanalysts,professionalsreportingtoanalystsandmembersoftheirhouseholdsfromowningsecuritiesofanycompanyintheanalyst’sareaofcoverage.Analystcompensation:AnalystsarepaidinpartbasedontheprofitabilityofGoldmanSachs,whichincludesinvestmentbankingrevenues.Analystasofficerordirector:GoldmanSachspolicygenerallyprohibitsitsanalysts,personsreportingtoanalystsormembersoftheirhouseholdsfromservingasanofficer,directororadvisorofanycompanyintheanalyst’sareaofcoverage.Non-U.S.Analysts:Non-U.S.analystsmaynotbeassociatedpersonsofGoldmanSachs&Co.LLCandthereforemaynotbesubjecttoFINRARule2241orFINRARule2242restrictionsoncommunicationswithsubjectcompany,publicappearancesandtradingsecuritiesheldbytheanalysts.Distributionofratings:Seethedistributionofratingsdisclosureabove.Pricechart:Seethepricechart,withchangesofratingsandpricetargetsinpriorperiods,above,or,ifelectronicformatorifwithrespecttomultiplecompanieswhicharethesubjectofthisreport,ontheGoldmanSachswebsiteathttps://www.gs.com/research/hedge.html.AdditionaldisclosuresrequiredunderthelawsandregulationsofjurisdictionsotherthantheUnitedStatesThefollowingdisclosuresarethoserequiredbythejurisdictionindicated,excepttotheextentalreadymadeabovepursuanttoUnitedStateslawsandregulations.Australia:GoldmanSachsAustraliaPtyLtdanditsaffiliatesarenotauthoriseddeposit-takinginstitutions(asthattermisdefinedintheBankingAct1959(Cth))inAustraliaanddonotprovidebankingservices,norcarryonabankingbusiness,inAustralia.Thisresearch,andanyaccesstoit,isintendedonlyfor“wholesaleclients”withinthemeaningoftheAustralianCorporationsAct,unlessotherwiseagreedbyGoldmanSachs.Inproducingresearchreports,membersoftheGlobalInvestmentResearchDivisionofGoldmanSachsAustraliamayattendsitevisitsandothermeetingshostedbythecompaniesandotherentitieswhicharethesubjectofitsresearchreports.InsomeinstancesthecostsofsuchsitevisitsormeetingsmaybemetinpartorinwholebytheissuersconcernedifGoldmanSachsAustraliaconsidersitisappropriateandreasonableinthespecificcircumstancesrelatingtothesitevisitormeeting.Totheextentthatthecontentsofthisdocumentcontainsanyfinancialproductadvice,itisgeneraladviceonlyandhasbeenpreparedbyGoldmanSachswithouttakingintoaccountaclient’sobjectives,financialsituationorneeds.Aclientshould,beforeactingonanysuchadvice,considertheappropriatenessoftheadvicehavingregardtotheclient’sownobjectives,financialsituationandneeds.AcopyofcertainGoldmanSachsAustraliaandNewZealanddisclosureofinterestsandacopyofGoldmanSachs’AustralianSell-SideResearchIndependencePolicyStatementareavailableat:https://www.goldmansachs.com/disclosures/australia-new-zealand/index.html.Brazil:DisclosureinformationinrelationtoCVMResolutionn.20isavailableathttps://www.gs.com/worldwide/brazil/area/gir/index.html.Whereapplicable,theBrazil-registeredanalystprimarilyresponsibleforthecontentofthisresearchreport,asdefinedinArticle20ofCVMResolutionn.20,isthefirstauthornamedatthebeginningofthisreport,unlessindicatedotherwiseattheendofthetext.Canada:Thisinformationisbeingprovidedtoyouforinformationpurposesonlyandisnot,andundernocircumstancesshouldbeconstruedas,anadvertisement,offeringorsolicitationbyGoldmanSachs&Co.LLCforpurchasersofsecuritiesinCanadatotradeinanyCanadiansecurity.GoldmanSachs&Co.LLCisnotregisteredasadealerinanyjurisdictioninCanadaunderapplicableCanadiansecuritieslawsandgenerallyisnotpermittedtotradeinCanadiansecuritiesandmaybeprohibitedfromsellingcertainsecuritiesandproductsincertainjurisdictionsinCanada.IfyouwishtotradeinanyCanadiansecuritiesorotherproductsinCanadapleasecontactGoldmanSachsCanadaInc.,anaffiliateofTheGoldmanSachsGroupInc.,oranotherregisteredCanadiandealer.HongKong:FurtherinformationonthesecuritiesofcoveredcompaniesreferredtointhisresearchmaybeobtainedonrequestfromGoldmanSachs(Asia)L.L.C.India:FurtherinformationonthesubjectcompanyorcompaniesreferredtointhisresearchmaybeobtainedfromGoldmanSachs(India)SecuritiesPrivateLimited,ResearchAnalyst-SEBIRegistrationNumberINH000001493,951-A,RationalHouse,AppasahebMaratheMarg,Prabhadevi,Mumbai400025,India,CorporateIdentityNumberU74140MH2006FTC160634,Phone+912266169000,Fax+912266169001.GoldmanSachsmaybeneficiallyown1%ormoreofthesecurities(assuchtermisdefinedinclause2(h)theIndianSecuritiesContracts(Regulation)Act,1956)ofthesubjectcompanyorcompaniesreferredtointhisresearchreport.Japan:Seebelow.Korea:Thisresearch,andanyaccesstoit,isintendedonlyfor“professionalinvestors”withinthemeaningoftheFinancialServicesandCapitalMarketsAct,unlessotherwiseagreedbyGoldmanSachs.FurtherinformationonthesubjectcompanyorcompaniesreferredtointhisresearchmaybeobtainedfromGoldmanSachs(Asia)L.L.C.,SeoulBranch.NewZealand:GoldmanSachsNewZealandLimitedanditsaffiliatesareneither“registeredbanks”nor“deposittakers”(asdefinedintheReserveBankofNewZealandAct1989)inNewZealand.Thisresearch,andanyaccesstoit,isintendedfor“wholesaleclients”(asdefinedintheFinancialAdvisersAct2008)unlessotherwiseagreedbyGoldmanSachs.AcopyofcertainGoldmanSachsAustraliaandNewZealanddisclosureofinterestsisavailableat:https://www.goldmansachs.com/disclosures/australia-new-zealand/index.html.Russia:ResearchreportsdistributedintheRussianFederationarenotadvertisingasdefinedintheRussianlegislation,butareinformationandanalysisnothavingproductpromotionastheirmainpurposeanddonotprovideappraisalwithinthemeaningoftheRussianlegislationonappraisalactivity.ResearchreportsdonotconstituteapersonalizedinvestmentrecommendationasdefinedinRussianlawsandregulations,arenotaddressedtoaspecificclient,andarepreparedwithoutanalyzingthefinancialcircumstances,investmentprofilesorriskprofilesofclients.GoldmanSachsassumesnoresponsibilityforanyinvestmentdecisionsthatmaybetakenbyaclientoranyotherpersonbasedonthisresearchreport.Singapore:GoldmanSachs(Singapore)Pte.(CompanyNumber:198602165W),whichisregulatedbytheMonetaryAuthorityofSingapore,acceptslegalresponsibilityforthisresearch,andshouldbecontactedwithrespecttoanymattersarisingfrom,orinconnectionwith,thisresearch.Taiwan:Thismaterialisforreferenceonlyandmustnotbereprintedwithoutpermission.Investorsshouldcarefullyconsidertheirowninvestmentrisk.Investmentresultsaretheresponsibilityoftheindividualinvestor.UnitedKingdom:PersonswhowouldbecategorizedasretailclientsintheUnitedKingdom,assuchtermisdefinedintherulesoftheFinancialConductAuthority,shouldreadthisresearchinconjunctionwithpriorGoldmanSachsresearchonthecoveredcompaniesreferredtohereinandshouldrefertotheriskwarningsthathavebeensenttothembyGoldmanSachsInternational.Acopyoftheseriskswarnings,andaglossaryofcertainfinancialtermsusedinthisreport,areavailablefromGoldmanSachsInternationalonrequest.EuropeanUnionandUnitedKingdom:DisclosureinformationinrelationtoArticle6(2)oftheEuropeanCommissionDelegatedRegulation(EU)(2016/958)supplementingRegulation(EU)No596/2014oftheEuropeanParliamentandoftheCouncil(includingasthatDelegatedRegulationisimplementedintoUnitedKingdomdomesticlawandregulationfollowingtheUnitedKingdom’sdeparturefromtheEuropeanUnionandtheEuropeanEconomicArea)withregardtoregulatorytechnicalstandardsforthetechnicalarrangementsforobjectivepresentationofinvestmentrecommendationsorotherinformationrecommendingorsuggestinganinvestmentstrategyandfordisclosureofparticularinterestsorindicationsofconflictsofinterestisavailableathttps://www.gs.com/disclosures/europeanpolicy.htmlwhichstatestheEuropeanPolicyforManagingConflictsofInterestinConnectionwithInvestmentResearch.Japan:GoldmanSachsJapanCo.,Ltd.isaFinancialInstrumentDealerregisteredwiththeKantoFinancialBureauunderregistrationnumberKinsho69,andamemberofJapanSecuritiesDealersAssociation,FinancialFuturesAssociationofJapanandTypeIIFinancialInstrumentsFirmsAssociation.Salesandpurchaseofequitiesaresubjecttocommissionpre-determinedwithclientsplusconsumptiontax.Seecompany-specificdisclosuresastoanyapplicabledisclosuresrequiredbyJapanesestockexchanges,theJapaneseSecuritiesDealersAssociationortheJapaneseSecuritiesFinanceCompany.27June202247GoldmanSachsRatings,coverageuniverseandrelateddefinitionsBuy(B),Neutral(N),Sell(S)AnalystsrecommendstocksasBuysorSellsforinclusiononvariousregionalInvestmentLists.BeingassignedaBuyorSellonanInvestmentListisdeterminedbyastock’stotalreturnpotentialrelativetoitscoverageuniverse.AnystocknotassignedasaBuyoraSellonanInvestmentListwithanactiverating(i.e.,astockthatisnotRatingSuspended,NotRated,CoverageSuspendedorNotCovered),isdeemedNeutral.Eachregion’sInvestmentReviewCommitteemanagesRegionalConvictionlists,whichrepresentinvestmentrecommendationsfocusedonthesizeofthetotalreturnpotentialand/orthelikelihoodoftherealizationofthereturnacrosstheirrespectiveareasofcoverage.TheadditionorremovalofstocksfromsuchConvictionlistsdonotrepresentachangeintheanalysts’investmentratingforsuchstocks.Totalreturnpotentialrepresentstheupsideordownsidedifferentialbetweenthecurrentsharepriceandthepricetarget,includingallpaidoranticipateddividends,expectedduringthetimehorizonassociatedwiththepricetarget.Pricetargetsarerequiredforallcoveredstocks.Thetotalreturnpotential,pricetargetandassociatedtimehorizonarestatedineachreportaddingorreiteratinganInvestmentListmembership.CoverageUniverse:Alistofallstocksineachcoverageuniverseisavailablebyprimaryanalyst,stockandcoverageuniverseathttps://www.gs.com/research/hedge.html.NotRated(NR).Theinvestmentrating,targetpriceandearningsestimates(whererelevant)havebeensuspendedpursuanttoGoldmanSachspolicywhenGoldmanSachsisactinginanadvisorycapacityinamergerorinastrategictransactioninvolvingthiscompany,whentherearelegal,regulatoryorpolicyconstraintsduetoGoldmanSachs’involvementinatransaction,andincertainothercircumstances.RatingSuspended(RS).GoldmanSachsResearchhassuspendedtheinvestmentratingandpricetargetforthisstock,becausethereisnotasufficientfundamentalbasisfordetermininganinvestmentratingortargetprice.Thepreviousinvestmentratingandtargetprice,ifany,arenolongerineffectforthisstockandshouldnotbereliedupon.CoverageSuspended(CS).GoldmanSachshassuspendedcoverageofthiscompany.NotCovered(NC).GoldmanSachsdoesnotcoverthiscompany.NotAvailableorNotApplicable(NA).Theinformationisnotavailablefordisplayorisnotapplicable.NotMeaningful(NM).Theinformationisnotmeaningfulandisthereforeexcluded.Globalproduct;distributingentitiesTheGlobalInvestmentResearchDivisionofGoldmanSachsproducesanddistributesresearchproductsforclientsofGoldmanSachsonaglobalbasis.AnalystsbasedinGoldmanSachsofficesaroundtheworldproduceresearchonindustriesandcompanies,andresearchonmacroeconomics,currencies,commoditiesandportfoliostrategy.ThisresearchisdisseminatedinAustraliabyGoldmanSachsAustraliaPtyLtd(ABN21006797897);inBrazilbyGoldmanSachsdoBrasilCorretoradeTítuloseValoresMobiliáriosS.A.;PublicCommunicationChannelGoldmanSachsBrazil:08007275764and/orcontatogoldmanbrasil@gs.com.AvailableWeekdays(exceptholidays),from9amto6pm.CanaldeComunicaçãocomoPúblicoGoldmanSachsBrasil:08007275764e/oucontatogoldmanbrasil@gs.com.Horáriodefuncionamento:segunda-feiraàsexta-feira(excetoferiados),das9hàs18h;inCanadabyGoldmanSachs&Co.LLC;inHongKongbyGoldmanSachs(Asia)L.L.C.;inIndiabyGoldmanSachs(India)SecuritiesPrivateLtd.;inJapanbyGoldmanSachsJapanCo.,Ltd.;intheRepublicofKoreabyGoldmanSachs(Asia)L.L.C.,SeoulBranch;inNewZealandbyGoldmanSachsNewZealandLimited;inRussiabyOOOGoldmanSachs;inSingaporebyGoldmanSachs(Singapore)Pte.(CompanyNumber:198602165W);andintheUnitedStatesofAmericabyGoldmanSachs&Co.LLC.GoldmanSachsInternationalhasapprovedthisresearchinconnectionwithitsdistributionintheUnitedKingdom.EffectivefromthedateoftheUnitedKingdom’sdeparturefromtheEuropeanUnionandtheEuropeanEconomicArea(“BrexitDay”)thefollowinginformationwithrespecttodistributingentitieswillapply:GoldmanSachsInternational(“GSI”),authorisedbythePrudentialRegulationAuthority(“PRA”)andregulatedbytheFinancialConductAuthority(“FCA”)andthePRA,hasapprovedthisresearchinconnectionwithitsdistributionintheUnitedKingdom.EuropeanEconomicArea:GSI,authorisedbythePRAandregulatedbytheFCAandthePRA,disseminatesresearchinthefollowingjurisdictionswithintheEuropeanEconomicArea:theGrandDuchyofLuxembourg,Italy,theKingdomofBelgium,theKingdomofDenmark,theKingdomofNorway,theRepublicofFinland,theRepublicofCyprusandtheRepublicofIreland;GS-SuccursaledeParis(Parisbranch)which,fromBrexitDay,willbeauthorisedbytheFrenchAutoritédecontrôleprudentieletderesolution(“ACPR”)andregulatedbytheAutoritédecontrôleprudentieletderesolutionandtheAutoritédesmarchesfinanciers(“AMF”)disseminatesresearchinFrance;GSI-SucursalenEspaña(Madridbranch)authorizedinSpainbytheComisiónNacionaldelMercadodeValoresdisseminatesresearchintheKingdomofSpain;GSI-SwedenBankfilial(Stockholmbranch)isauthorizedbytheSFSAasa“thirdcountrybranch”inaccordancewithChapter4,Section4oftheSwedishSecuritiesandMarketAct(Sw.lag(2007:528)omvärdepappersmarknaden)disseminatesresearchintheKingdomofSweden;GoldmanSachsBankEuropeSE(“GSBE”)isacreditinstitutionincorporatedinGermanyand,withintheSingleSupervisoryMechanism,subjecttodirectprudentialsupervisionbytheEuropeanCentralBankandinotherrespectssupervisedbyGermanFederalFinancialSupervisoryAuthority(BundesanstaltfürFinanzdienstleistungsaufsicht,BaFin)andDeutscheBundesbankanddisseminatesresearchintheFederalRepublicofGermanyandthosejurisdictionswithintheEuropeanEconomicAreawhereGSIisnotauthorisedtodisseminateresearchandadditionally,GSBE,CopenhagenBranchfilialafGSBE,Tyskland,supervisedbytheDanishFinancialAuthoritydisseminatesresearchintheKingdomofDenmark;GSBE-SucursalenEspaña(Madridbranch)subject(toalimitedextent)tolocalsupervisionbytheBankofSpaindisseminatesresearchintheKingdomofSpain;GSBE-SuccursaleItalia(Milanbranch)totherelevantapplicableextent,subjecttolocalsupervisionbytheBankofItaly(Bancad’Italia)andtheItalianCompaniesandExchangeCommission(CommissioneNazionaleperleSocietàelaBorsa“Consob”)disseminatesresearchinItaly;GSBE-SuccursaledeParis(Parisbranch),supervisedbytheAMFandbytheACPRdisseminatesresearchinFrance;andGSBE-SwedenBankfilial(Stockholmbranch),toalimitedextent,subjecttolocalsupervisionbytheSwedishFinancialSupervisoryAuthority(Finansinpektionen)disseminatesresearchintheKingdomofSweden.GeneraldisclosuresThisresearchisforourclientsonly.OtherthandisclosuresrelatingtoGoldmanSachs,thisresearchisbasedoncurrentpublicinformationthatweconsiderreliable,butwedonotrepresentitisaccurateorcomplete,anditshouldnotbereliedonassuch.Theinformation,opinions,estimatesandforecastscontainedhereinareasofthedatehereofandaresubjecttochangewithoutpriornotification.Weseektoupdateourresearchasappropriate,butvariousregulationsmaypreventusfromdoingso.Otherthancertainindustryreportspublishedonaperiodicbasis,thelargemajorityofreportsarepublishedatirregularintervalsasappropriateintheanalyst’sjudgment.GoldmanSachsconductsaglobalfull-service,integratedinvestmentbanking,investmentmanagement,andbrokeragebusiness.WehaveinvestmentbankingandotherbusinessrelationshipswithasubstantialpercentageofthecompaniescoveredbyourGlobalInvestmentResearchDivision.GoldmanSachs&Co.LLC,theUnitedStatesbrokerdealer,isamemberofSIPC(https://www.sipc.org).Oursalespeople,traders,andotherprofessionalsmayprovideoralorwrittenmarketcommentaryortradingstrategiestoourclientsandprincipaltradingdesksthatreflectopinionsthatarecontrarytotheopinionsexpressedinthisresearch.Ourassetmanagementarea,principaltradingdesksandinvestingbusinessesmaymakeinvestmentdecisionsthatareinconsistentwiththerecommendationsor27June202248GoldmanSachsviewsexpressedinthisresearch.Theanalystsnamedinthisreportmayhavefromtimetotimediscussedwithourclients,includingGoldmanSachssalespersonsandtraders,ormaydiscussinthisreport,tradingstrategiesthatreferencecatalystsoreventsthatmayhaveanear-termimpactonthemarketpriceoftheequitysecuritiesdiscussedinthisreport,whichimpactmaybedirectionallycountertotheanalyst’spublishedpricetargetexpectationsforsuchstocks.Anysuchtradingstrategiesaredistinctfromanddonotaffecttheanalyst’sfundamentalequityratingforsuchstocks,whichratingreflectsastock’sreturnpotentialrelativetoitscoverageuniverseasdescribedherein.Weandouraffiliates,officers,directors,andemployees,excludingequityandcreditanalysts,willfromtimetotimehavelongorshortpositionsin,actasprincipalin,andbuyorsell,thesecuritiesorderivatives,ifany,referredtointhisresearch.TheviewsattributedtothirdpartypresentersatGoldmanSachsarrangedconferences,includingindividualsfromotherpartsofGoldmanSachs,donotnecessarilyreflectthoseofGlobalInvestmentResearchandarenotanofficialviewofGoldmanSachs.Anythirdpartyreferencedherein,includinganysalespeople,tradersandotherprofessionalsormembersoftheirhousehold,mayhavepositionsintheproductsmentionedthatareinconsistentwiththeviewsexpressedbyanalystsnamedinthisreport.Thisresearchisnotanoffertosellorthesolicitationofanoffertobuyanysecurityinanyjurisdictionwheresuchanofferorsolicitationwouldbeillegal.Itdoesnotconstituteapersonalrecommendationortakeintoaccounttheparticularinvestmentobjectives,financialsituations,orneedsofindividualclients.Clientsshouldconsiderwhetheranyadviceorrecommendationinthisresearchissuitablefortheirparticularcircumstancesand,ifappropriate,seekprofessionaladvice,includingtaxadvice.Thepriceandvalueofinvestmentsreferredtointhisresearchandtheincomefromthemmayfluctuate.Pastperformanceisnotaguidetofutureperformance,futurereturnsarenotguaranteed,andalossoforiginalcapitalmayoccur.Fluctuationsinexchangeratescouldhaveadverseeffectsonthevalueorpriceof,orincomederivedfrom,certaininvestments.Certaintransactions,includingthoseinvolvingfutures,options,andotherderivatives,giverisetosubstantialriskandarenotsuitableforallinvestors.InvestorsshouldreviewcurrentoptionsandfuturesdisclosuredocumentswhichareavailablefromGoldmanSachssalesrepresentativesorathttps://www.theocc.com/about/publications/character-risks.jspandhttps://www.fiadocumentation.org/fia/regulatory-disclosures_1/fia-uniform-futures-and-options-on-futures-risk-disclosures-booklet-pdf-version-2018.Transactioncostsmaybesignificantinoptionstrategiescallingformultiplepurchaseandsalesofoptionssuchasspreads.Supportingdocumentationwillbesupplieduponrequest.DifferingLevelsofServiceprovidedbyGlobalInvestmentResearch:ThelevelandtypesofservicesprovidedtoyoubytheGlobalInvestmentResearchdivisionofGSmayvaryascomparedtothatprovidedtointernalandotherexternalclientsofGS,dependingonvariousfactorsincludingyourindividualpreferencesastothefrequencyandmannerofreceivingcommunication,yourriskprofileandinvestmentfocusandperspective(e.g.,marketwide,sectorspecific,longterm,shortterm),thesizeandscopeofyouroverallclientrelationshipwithGS,andlegalandregulatoryconstraints.Asanexample,certainclientsmayrequesttoreceivenotificationswhenresearchonspecificsecuritiesispublished,andcertainclientsmayrequestthatspecificdataunderlyinganalysts’fundamentalanalysisavailableonourinternalclientwebsitesbedeliveredtothemelectronicallythroughdatafeedsorotherwise.Nochangetoananalyst’sfundamentalresearchviews(e.g.,ratings,pricetargets,ormaterialchangestoearningsestimatesforequitysecurities),willbecommunicatedtoanyclientpriortoinclusionofsuchinformationinaresearchreportbroadlydisseminatedthroughelectronicpublicationtoourinternalclientwebsitesorthroughothermeans,asnecessary,toallclientswhoareentitledtoreceivesuchreports.Allresearchreportsaredisseminatedandavailabletoallclientssimultaneouslythroughelectronicpublicationtoourinternalclientwebsites.Notallresearchcontentisredistributedtoourclientsoravailabletothird-partyaggregators,norisGoldmanSachsresponsiblefortheredistributionofourresearchbythirdpartyaggregators.Forresearch,modelsorotherdatarelatedtooneormoresecurities,marketsorassetclasses(includingrelatedservices)thatmaybeavailabletoyou,pleasecontactyourGSrepresentativeorgotohttps://research.gs.com.Disclosureinformationisalsoavailableathttps://www.gs.com/research/hedge.htmlorfromResearchCompliance,200WestStreet,NewYork,NY10282.©2022GoldmanSachs.Nopartofthismaterialmaybe(i)copied,photocopiedorduplicatedinanyformbyanymeansor(ii)redistributedwithoutthepriorwrittenconsentofTheGoldmanSachsGroup,Inc.27June202249GoldmanSachs

1、当您付费下载文档后,您只拥有了使用权限,并不意味着购买了版权,文档只能用于自身使用,不得用于其他商业用途(如 [转卖]进行直接盈利或[编辑后售卖]进行间接盈利)。
2、本站所有内容均由合作方或网友上传,本站不对文档的完整性、权威性及其观点立场正确性做任何保证或承诺!文档内容仅供研究参考,付费前请自行鉴别。
3、如文档内容存在违规,或者侵犯商业秘密、侵犯著作权等,请点击“违规举报”。

碎片内容

碳中和
已认证
内容提供者

碳中和

确认删除?
回到顶部
微信客服
  • 管理员微信
QQ客服
  • QQ客服点击这里给我发消息
客服邮箱