电动汽车充电市场展望报告(英文版)--普华永道VIP专享VIP免费

EV Charging
Market Outlook
A quest for profitable growth in the fast growing,
yet highly competitive, EV charging market
Strategy&
EV Charging Market Outlook
2
Global viewpoint focused on key regions
(Europe, US and China) developed by Strategy&
and PwC covering:
Underlying market drivers, value chain definition
and key revenue pools
Ways to play to realize the revenue pools, their
2035 potential and current financial performance
per way to play
Considerations for profitable growth going
forward per way to play
Deep dives:
Public fast charging operator and owner
way to play
Deal making activity by deal type,
way to play and acquirer
Our insights are based on:
Interviews with industry executives and
analysts and
Insights from work by PwC Autofacts® and
Data Insights teams
Customer survey with a focus on the US,
EU+ Norway and China (n = 3,000+)
EV Charging
Market Outlook
Focus areas and our approach
Strategy&
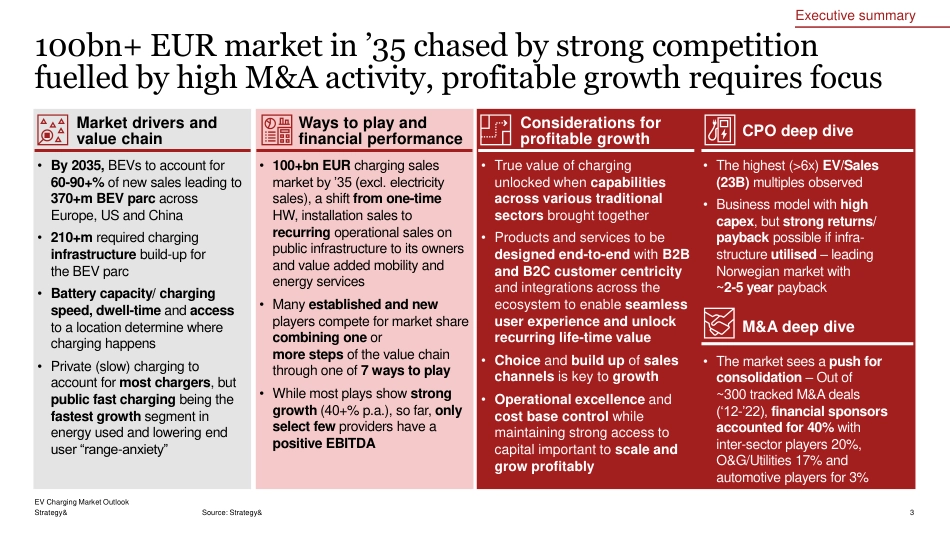
100bn+ EUR market in ’35 chased by strong competition
fuelled by high M&A activity, profitable growth requires focus
Source: Strategy&
EV Charging Market Outlook
3
By 2035, BEVs to account for
60-90+% of new sales leading to
370+m BEV parc across
Europe, US and China
210+m required charging
infrastructure build-up for
the BEV parc
Battery capacity/ charging
speed, dwell-time and access
to a location determine where
charging happens
Private (slow) charging to
account for most chargers, but
public fast charging being the
fastest growth segment in
energy used and lowering end
user range-anxiety
100+bn EUR charging sales
market by 35 (excl. electricity
sales), a shift from one-time
HW, installation sales to
recurring operational sales on
public infrastructure to its owners
and value added mobility and
energy services
Many established and new
players compete for market share
combining one or
more steps of the value chain
through one of 7 ways to play
While most plays show strong
growth (40+% p.a.), so far, only
select few providers have a
positive EBITDA
True value of charging
unlocked when capabilities
across various traditional
sectors brought together
Products and services to be
designed end-to-end with B2B
and B2C customer centricity
and integrations across the
ecosystem to enable seamless
user experience and unlock
recurring life-time value
Choice and build up of sales
channels is key to growth
Operational excellence and
cost base control while
maintaining strong access to
capital important to scale and
grow profitably
The market sees a push for
consolidation Out of
~300 tracked M&A deals
(‘12-22), financial sponsors
accounted for 40% with
inter-sector players 20%,
O&G/Utilities 17% and
automotive players for 3%
Market drivers and
value chain CPO deep dive
Ways to play and
financial performance Considerations for
profitable growth
M&A deep dive
The highest (>6x) EV/Sales
(23B) multiples observed
Business model with high
capex, but strong returns/
payback possible if infra-
structure utilised leading
Norwegian market with
~2-5 year payback
Executive summary
EVChargingMarketOutlookAquestforprofitablegrowthinthefastgrowing,yethighlycompetitive,EVchargingmarketStrategy&EVChargingMarketOutlook2Globalviewpointfocusedonkeyregions(Europe,USandChina)developedbyStrategy&andPwCcovering:✓Underlyingmarketdrivers,valuechaindefinitionandkeyrevenuepools✓Waystoplaytorealizetherevenuepools,their2035potentialandcurrentfinancialperformanceperwaytoplay✓ConsiderationsforprofitablegrowthgoingforwardperwaytoplayDeepdives:PublicfastchargingoperatorandownerwaytoplayDealmakingactivitybydealtype,waytoplayandacquirerOurinsightsarebasedon:✓Interviewswithindustryexecutivesandanalystsand✓InsightsfromworkbyPwCAutofacts®andDataInsightsteams✓CustomersurveywithafocusontheUS,EU+NorwayandChina(n=3,000+)EVChargingMarketOutlookFocusareasandourapproachStrategy&100bn+EURmarketin’35chasedbystrongcompetitionfuelledbyhighM&Aactivity,profitablegrowthrequiresfocusSource:Strategy&EVChargingMarketOutlook3•By2035,BEVstoaccountfor60-90+%ofnewsalesleadingto370+mBEVparcacrossEurope,USandChina•210+mrequiredcharginginfrastructurebuild-upfortheBEVparc•Batterycapacity/chargingspeed,dwell-timeandaccesstoalocationdeterminewherecharginghappens•Private(slow)chargingtoaccountformostchargers,butpublicfastchargingbeingthefastestgrowthsegmentinenergyusedandloweringenduser“range-anxiety”•100+bnEURchargingsalesmarketby’35(excl.electricitysales),ashiftfromone-timeHW,installationsalestorecurringoperationalsalesonpublicinfrastructuretoitsownersandvalueaddedmobilityandenergyservices•Manyestablishedandnewplayerscompeteformarketsharecombiningoneormorestepsofthevaluechainthroughoneof7waystoplay•Whilemostplaysshowstronggrowth(40+%p.a.),sofar,onlyselectfewprovidershaveapositiveEBITDA•Truevalueofchargingunlockedwhencapabilitiesacrossvarioustraditionalsectorsbroughttogether•Productsandservicestobedesignedend-to-endwithB2BandB2Ccustomercentricityandintegrationsacrosstheecosystemtoenableseamlessuserexperienceandunlockrecurringlife-timevalue•Choiceandbuildupofsaleschannelsiskeytogrowth•Operationalexcellenceandcostbasecontrolwhilemaintainingstrongaccesstocapitalimportanttoscaleandgrowprofitably•Themarketseesapushforconsolidation–Outof~300trackedM&Adeals(‘12-’22),financialsponsorsaccountedfor40%withinter-sectorplayers20%,O&G/Utilities17%andautomotiveplayersfor3%MarketdriversandvaluechainCPOdeepdiveWaystoplayandfinancialperformanceConsiderationsforprofitablegrowthM&Adeepdive•Thehighest(>6x)EV/Sales(23B)multiplesobserved•Businessmodelwithhighcapex,butstrongreturns/paybackpossibleifinfra-structureutilised–leadingNorwegianmarketwith~2-5yearpaybackExecutivesummaryStrategy&22July2020Underlyingmarketdrivers,valuechaindefinitionandkeyrevenuepools4EVChargingMarketOutlookStrategy&Roadtrans.typePassengercarsLightvansCitybusesHeavyvansOtherbusesTrucksOff-roadTypicaldriving3tripsperdayá12km20-250kmperday(multiplestops)ContinuousdrivingduringdayDistributionrouting(long/short)DailylongdistancetripsLongdistancesandday/nightdrivingVarioususageinindustrialandconstructionsectorsCharginglocationMostlyprivate–publiconlong-distancetripsorifprivateunavailableChargeatworkplace,ontheroadandathomeChargeatdestination/endstopordepothubAtworkplace,destination/huboron-the-roadAtdestinationorprivatehubChargeatclientsite+hubMostlyprivatechargingBatterysize~50kWh(e.g.VWID.4Pure)to~120kWh(e.g.LucidAirDream)~35kWh(e.g.MBE-Sprinter)to~90kWh(e.g.MaxuseDeliver9)80-300kWh+120kWh+200-600kWh500-1000kWh+300-600kWhChargingspeedDependingonlocation,gridanddwelltime<22kW-150+kW<22kW-600kW+<22kW-350kW+MaturityWhilethereareanincreasingnumberofuse-casesforchargingofallroadtransporttypes,lightvehiclesarethemostmatureVariesbyregionwithespeciallyUSdriversdrivinglongerdistances;Variesbytypeoftruck–seehttps://www.strategyand.pwc.com/de/en/industries/automotive/commercial-vehicle-ereadiness.html,https://www.strategyand.pwc.com/de/en/industries/transport/the-dawn-of-electrified-trucking.html;Maturitybasedontechnicalavailabilityofmodels,TCOaffordability,charginginfravschargingneedSource:Strategy&analysisElectrificationbytransporttypeLightvehiclesEVChargingMarketOutlook5Strategy&EU1,2)USCNEU1)USCNThetransformationoftheautoindustryisinfullswing–BEVswith60-90+%ofnewsales&370+moftotalBEVparcby‘35Source:PwCAutofactsanalysis;1)EU:EU27+UK+EFTA;2)Assumedbelow100%BEVshareofnewsalesin2035asitisexpectedsomeexemptionsforOEMstoclearinventory,biofuels,andexemptionsforspecificvehiclesetc.BEV=BatteryElectricVehicleRegionalBEVdiffusion(passengercarsandlightvehicles)•TheEVchargingiscomingofagewithmoreregulatoryandcommercialcertaintyaroundBEVadoptionwith60+%shareby2035inUS80+%inCNand90+%inEurope•DevelopmentinBEVshareofnewsalesinChinaandUShighlydependentonpoliciestobeimplemented•Themajorityoftheparcwillremainnon-BEVin’35duetothereplacementrateunlessfurtherregulationisintroduced692%68%35%32%65%93%8%7%14171819+2%BEVNon-BEV98%84%63%38%37%62%2%16%15171718+1%88%60%42%40%58%81%12%20212025203019%203524293133+2%31855110+29%293165+28%2021202520302035542107199+30%Lightvehiclesales(millionvehicles)BEVlightvehicleparc(millionvehicles)KeytakeawaysEVChargingMarketOutlookStrategy&Leadingtoa~210mcharginginfrastructureneeded,chargingavailabilitydeterminesthemixofchargersregionallySource:Strategy&analysisCharginginfrastructure,locationsandbehaviour2.268.120350.1~16~40~700.33.120210.20.714.620250.31.438.920300.5~41.262.820350.0~10~30~650.12.020210.10.48.820250.20.729.720300.3~21.572.420350.5~22~50~750.72.920211.20.920.320251.61.048.220302.3~4PrivatechargingPublicslowchargers(<50kW)Publicfastchargers(>=50kW)Installedbaseofchargepointsbygeography(millions)•GrowingadoptionofBEVsdrivestheneedforcharginginfrastructureleadingtoa~210minstalledbaseofchargepointsin2035•Overall,privateAC/slowchargerswillformthemajorityoftheinstalledbaseasconsumerspreferchargingathomeoratwork,wheredwelltimeishigher•WhiletheUSBEVparcwillstillbesmallerthantheEUBEVparcin2035,theUSdrivingpatternsdrivealargerneedofchargepointsrelativetotheparcsize•ForChina,thestartingpointisaproportionatelylargershareofpublicfast,yetnotwellutilised/locatedchargers.GoingforwardsomeofthepublicfastchargingwillbeservedbybatteryswappingCommentsEVChargingMarketOutlook7Strategy&Publicfastchargerstocaptureagrowingshareofelectricitydemand,drivenbyon-the-goanddestinationchargingSource:Strategy&analysisChargingsegmentsandbehaviour10-1510-1575-80’2115-2015-2060-65’2525-3020-2550-55’3030-3520-2540-45’3510-1510-1570-75’2115-2010-1570-75’2520-2510-1565-70’3020-2510-1560-65’35PrivatechargingPublicslowchargers(<50kW)Publicfastchargers(>=50kW)20-2520-2555-60’2130-3515-2050-55’2545-5010-1540-45’3050-5510-1535-40’35ResidentialcustomersinglehouseMultidwellingWork(office)Fleets/depotDestination(hotels,priv.parkingetc.)PublicparkingOn-the-goSegmentsTypicaldwelltimeTypicalchargingspeed10-60min1-8hrs0.5-3hrs4-8hrs8hrs8+hrs8+hrs50+kW11kW11-50+kW11-50+kW11kW3-11kW3-11kWPublicslowPublicfastPrivateLocationsegmentCharginglocationsandusecasesChargingbylocation(%ofelectricitydemand)EVChargingMarketOutlook8Comments•Asideofbatterycapacity/chargingspeed,dwell-timeandaccesstoalocationdeterminewherecharginghappens•Destinationandon-the-gochargingrepresentthebestusecaseforfastcharginggivenlowdwelltime•PublicfastchargerstocaptureagrowingshareofelectricitydemandduetohigherandincreasingaveragethroughputascarandchargerspeedsincreaseStrategy&TheEVchargingvaluechainhassixmainrevenuepools,rangingfromchargepointhardwaretoadditionalVAS1)MainrevenuepoolsandmodelparametersEUR/kWhcost(energy+gridconnection)chargedtoCPOEndcustomerpriceperchargerMonthlysubscriptionfeepercharger•Developmentofsoftwaretooperateandmonitorthechargepoint,i.e.ChargePointManagementSystems(CPMS)•Production/saleofchargepointhardware(ACandDCchargers)andnecessaryaccessories,incl.wholesalesandresell/financingmargins%appliedontopofchargingfeegoingtotheCPO•Accesstoandadmini-strationofchargingservicetoendcustomersacrossmultipleCPOnetworks(incl.roaming),i.e.E-MobilityServiceProvider(EMSP)•OthersoftwaredrivenservicesValueearnedonownershipofchargerandlocationrights•RealestaterightsandownershipofoneormultiplechargestationswithrelatedCAPEXcostCostperchargingstationandallocationperchargerandsocket+coststooperateanddevelopchargernetwork•Hardwareserviceprovision,incl.installingallchargepointcomponents•Management/operationsofchargepointnetwork(sourcingelectricity,maintenance,ITnetwork,customerserviceetc.)•Energyprocurementcontract(includingGoOs)•Localdistributionsystemoperationresponsibleforoperatinginfrastructurenecessaryforelectricitysupplytothechargepointstation(atrequiredpowerlevel)KeyrevenueleverTrendtowardsaggregationofRevenuepoolsbychargingplayers–eitherin-houseorviastrategicpartnershipsChargingmarketcomponentsforprivateandpublicchargingsegmentsRevenuepoolscurrentlyoutofscope:DemandfromPHEV/Electricityhedging/Smartenergy(vehicletogridandbehindthemetersolutions)/additionaldigitalandnon-digitalValueAdded-Servicesforendconsumers,operatorsandownersEVChargingMarketOutlook9ElectricityprovisionChargepointhardwareChargepointsoftwareAdd.e-mobilitySoftwareledvalueaddedservicesLandandassetChargerrelatedservices1)ValueaddedservicesSource:Strategy&analysisStrategy&22July2020Waystoplaytorealizetherevenuepools,their2035potentialandcurrentfinancialperformancepereach10EVChargingMarketOutlookStrategy&OwnersOwnerofa)thelandonwhichthechargersareinstalledandb)insomecasesalsothechargersInstallerandmaintenanceElectricianswhoareinstallingthechargersandmaintainingitSmartchargepointproviderEngineeringandmanufacturingofchargingHWplustheSWthatmakesitsmartChargepointoperatorandownerInstallsandoperateschargepointsbythemselves(excludeslandrightownership)ChargingsolutionproviderOne-stopshopthatinstallsandoperateschargepointsValueaddedserviceprovidersProvidesservicesaroundcharging(non-digitalanddigital)possibilitytohedgeelectricityChargepointSWHWagnosticSWthatenablesoperationandbetterintegrateswithothersystemsAcrossthechargingsegmentsandrevenuepoolsweseesevenkeyplaystappingintooneormorepoolsSource:Strategy&analysisWaystoplayintherevenuepool/customersegmentmatrixEVChargingMarketOutlook11CommentsRevenuepoolsChargepointhardwareElectricityChargepointsoftwareLandandassetChargerrelatedservicesAdd.e-mobilityandotherservices134possibilitytohedgeelectricity2567•Takingthe6revenuepools,wesee7distinctwaystoplayintheemergingEVchargingecosystem•Ontheonehandfocusedplaystargetingpurelysoftwareorservices;ahardwareonlyplaywillnolongerwork(needsstrongSW/integration)•Ontheotherhandcombinationsofrevenuepoolsintoend-to-endsolutionprovidersoroperatorandownerplaysStrategy&100bn+chargingmarketby’35withstronggrowthacrossplays,marketseesshiftfromone-offsalestorecurringrevenuemodelsNote:1)Revenueavailable;2)Revenuepoolforelectricitynotincludedingraph(EUR~4bnin2021andEUR~120bnin2035),thisrevenuepoolwillbecomeincreasinglyaddressablethroughtheadoptionofBiDiandtakingtradingandhedgingpositionsSource:Strategy&analysisRevenuepoolsize1)foreachwaytoplay,excl.electricity2)2021-2035EVChargingMarketOutlook12•Shiftfromone-offHWandinstallationservicestorecurringoperationandvalueaddedservices•Smartchargepointproviderswithslowestgrowthduetocombinationofneededfurtherroll-outandHWupgradeandfallingHWcosts•Ownersin2021withnegativevalueduetooperationalcostsnotleavinganyrevenueleftfortheinfraowner–morematuremarketin‘35allowsforsignificantrevenuecapturebyowners•Additionale-mobilityandotherservicesdoublinginshareoftotalrevenuepoolasthemarketmatures,enabledbySWintegrationsandoptimisationsRevenuepooldevelopment2021-2035perbusinessmodel[EURbn],marketshareofyeartotal[%],andCAGR[%]35%29%28%24%38%47%20212035~7~108+21%EuropeUSAChinaTotalSmartchargepointproviderChargepointmanagementsoftwareOwners(siteandcharger)InstallerandmaintenanceValueaddedserviceprovidersChargingsolutionproviderChargepointoperatorandowner~4(51%)~17(16%)~1(11%)~7(6%)-~1(-12%)~21(20%)~1(20%)~11(10%)~0(4%)~8(7%)~1(7%)~12(30%)~1(20%)~33(11%)+12%+17%n.a.+16%+27%+16%+34%Chargerownersaresubsidizingtherevenueforoperatingandservicingthestationsin2021(particularlyinChina)PureCPOcontribution:1.4BnEUROwnersubsidizing:-0.9BnEUR2345671CommentsStrategy&WithBiDichargingandBESSavailability,additionalrevenuepoolsopenupinenergymanagementbehind&infrontofmeterAdditionalchargingrevenuepools–selectedplayersTypeofchargingSmartchargingBidirectionalcharging•Adjustchargingpowertosolarproduction•Modifychargerateorchargetime•Definechargingstrategy•UseEVbatteryasstationarystorageforresidentialhomeoremergencypowerbank•Equipparkingspaceswithwallboxes1:1•Managelimitedchargingpower•UsefleetofEVsascloudstorageforsolarbufferingandpeakshaving•HugebasicsetofchargingEVsallowsprequalificationforancillaryservices•PrequalifyfleetofEVsforfrequencycontainmentreservejustlikededicatedstationarystorage•ChargeEVswheneverwindgenerationexceedsgridcapacity•BuildupstoragecapacitybasedonEVfleetforwholesaletradingBehindthemeterInfrontofthemeter•Batterysupplementedloadmgmt.•Batteriescanbechargedwhendemandingridislowandsupportchargingintimesofhighdemand•SellingbatterycapacitytolocalDSOflexibilitymarketsEVChargingMarketOutlook13StorageatprivatelocationCloudstorageatcondominiumFrequencycontainmentreserveAssetbackedtradingLoadbalancing/peakshavingFrequencycontainmentreserve(utilizationlevelmonetisation)Costandconsump-tionoptimisa-tionatsingleassetValuemaximisa-tionacrossmultipleassetsBatterysupportedchargepointsAssetbackedtrading€50HzFCRNote:BiDi–BiDirectional,BESS–BatteryEnergyStorageSystems,DSO–DistributionSystemOperatorSource:Strategy&analysisV1GV2GStrategy&ChargingnativeEnergysolutionintegratorAutomotiveEl-manufacturerOEMsupplierConstructionElectriciansO&GUtilityTechnologyplayersThechargingmarketattractsmanynewandestablishedplayertypescompetingregionallyandgloballyformarketshareSource:Strategy&analysisTypeofplayersactiveacrossthestrategicplaysEVChargingMarketOutlook14400+EUplayers1000+EUplayersMostlysmallerlocalplayersSelectedfewleaders+somesmallerplayersNichecompanies+venturesoflargercompaniesFewerplayerswithoverlapfromCPOsWaystoplayCompetitiveintensity(#ofplayers)n/aSmartchargepointproviderChargepointmanagementsoftwareInstallersandmaintenanceValueaddedserviceprovidersChargingsolutionproviderOwnersChargepointoperatorandowner2345671Typicalrealestateusagerightholders(realestate,groceries,parkingandotherdestinationowners)E.g.logisticssoftwareE.g.paymentplatformsNewEstablishedHighcompetitiveintensityLowcompetitiveintensityStrategy&Whilemostplaysshowstronggrowth(40+%p.a.),onlyselectfewproviders(mainlySCCPs)haveso-farapositiveEBITDANote:1)Ifnotpublished2022financials,EBITDA%’21andCAGR’19-’21isused2)2)Spirii’sgrowthiscalculatedbasedongrossprofit(estimatedrevenuebasedon60%GM)3)RevenuebasedonQ3’22fullyear2022guidance,EBITDAmarginbasedonYTDSep’22revenueandYTDSep’22EBITDASource:CapitalIQ,Valu8,Eikon,Orbis,CompanyreportsFinancialperformanceselectedplayerswithpubliclyavailablefinancialsperwaytoplayEBITDAmargin(%)vs.‘19-’221)revenueCAGR(%)050100150600-850-250-150-100-50050100CTEKGaroEfacec1ZaptecKempowerAlfenABLEBITDA(%,latest)Heidelberg1AptivWallboxEaseeTritiumSizebyRevenue(EURm)-250-150-1000-5050010050150100600-850ChargePointEVBox1efimobABB1BlinkCompleoPodpoint-250-150-1000-5050010050150100600-850MerRecharge1EVgoSpirii1,2Volta1FastnedInstavolt1Allego31000600-850150-250-150-100-5005010050EVAGlobal1VirtaGlobal1ChargepanelCurrentECO1RevenueCAGR(%,2019-2022)Smartchargepointprovider(SCCP)ChargingsolutionproviderChargepointoperatorandownerChargepointmanagementsoftwareMostmaturebusinessmodelwithvolumeandsetuptoallowforpositiveEBITDAalreadywhilegrowingfastSlightlynegativeEBITDAmargin,buttheyareshowingstronggrowthDataavailableonlyonafewcompanies,growthphaseandearlyadoptiondrivesnegativeEBITDAInfrastructure-likecash-flowprofile,lowutilizationdrivesnegativeEBITDA,butstrongroll-outandsalesCAGREVChargingMarketOutlook15Rev(EURm):121Rev.CAGR:39%EBITDA:5%Rev(EURm):106Rev.CAGR:49%EBITDA:-18%Rev(EURm):30Rev.CAGR:78%EBITDA:-83%Rev(EURm):1Rev.CAGR:43%EBITDA:-50%MediansMediansMediansMediansStrategy&CPOsandownerswithhighestEV/salesmultiples,reflectingstronginvestorsentimentNote:1)asof26thApril,20232)CHF325mraisedfor12%equity(CHF2.7bnvaluation)and2022ErevenuesofCHF~410m.(CMDFeb’22estimate).USD/CHFexchangerateof0.9used.Source:CapitalIQ,Strategy&analysisEV/sales(’23E)multiples1)perwaytoplayforpubliclylistedplayersEV/salesKempowerAlfenZaptecWallboxCTEK3.06.32.92.12.11.6FastnedEVGOAllegoVolta6.58.57.93.1ChargepointBlinkChargingABBe-mobility2)PodpointCompleo3.14.23.76.60.90.1AcquiredbyShellinJan’23SmartchargepointproviderstradingatattractiveEV/salesmultipleswithstillstrongoutlook,althoughtheirgrowthisexpectedtoslowfollowingthenext5-10yearsofsignificantinfrastructureramp-upCPOsandownerstradeathighestEV/salesmultiplesastheseareexpectedtocapturealargeshareoffuturerevenuepoolsastheinstalledbasegrowsandchargerutilizationincreasesFiledforinsolvencyinDec’22Solutionprovidersarestrugglingtoscaleprofitably,leadingtofinancingissuesforcertainplayers,whilstmarketleaders(likeChargePointandBlink)areexpectedtogrowstronglyandtradeathighermultiplesSmartchargepointproviderChargingsolutionproviderChargepointoperatorandownerFromFeb’23pre-IPOprivateplacementEVChargingMarketOutlook16Strategy&StrongincreaseinM&AdealsrecentlywithhighestactivitywithinHWandincreasinginterestacrossotherwaystoplayNote1)M&AdealsincludethePitchBookdealtypesBuyout/LBO;CorporateandM&AandPEGrowth/expansion.Earlystagefinancing,publicmarketsdealsanddebtfinancingdealsareexcludedhere.SeeDeepdive2formoredetailsSource:PitchBook,Strategy&analysisNumberofEVchargingM&Adeals1)andtransactionvalueofdiscloseddeals10985232154101016545712164711131612121581332016120173212018322019120202021202213162026367386+37%HardwareInstallerandmaintenanceChargingsolutionproviderValueaddedserviceprovidersCPOwithHWinvestmentSoftwareNumberofEVchargingM&Adeals1)perwaytoplayTransactionvalueEURbn(disclosedtransactions)0.120162017201820192020202120220.23.13.50.20.20.10.20.20.90.31.60.20.90.90.70.8+60%4(31%)36(42%)4(25%)7(35%)8(31%)8(22%)40(55%)xxNumber(share)ofdiscloseddealsComments•StrongincreaseinM&Adealactivityin’21and‘22•86M&Adeals1)in’22(outof~300transactions–seeDeepdive2,ofwhichthe36discloseddealsamountedtoadealvalueofEUR3.5bn(avg.EUR~100m)•Hardwareinvestmentsaccountforasignificantshareofthedeals(~30%),butlatelytherehasbeenstrongincreaseinactivityacrossotherwaystoplaysEVChargingMarketOutlook17Strategy&22July2020Considerationsforprofitablegrowthgoingforwardperwaystoplay18EVChargingMarketOutlookStrategy&FocusingonselectbusinessmodelconsiderationsdependentonwaystoplaywillbekeytoachieveprofitablegrowthNote:1)ThirdpartytypicallyincludefinancialsponsorssuchasinfrastructurefundsSource:Strategy&analysisBusinessmodelconsiderationsbywaystoplay19SelectedelementsofbusinessmodelConsiderationsforprofitablegrowthgoingforward–capabilitiestodevelopSellasmanychargersasefficientlythroughscalablechannelswithsmartfeaturestomonetizeinstalledbasethroughassetlifetime•Designwithlifetimevalue(SWandservices)andwiderenergy/mobilityecosystemintegration•Globalproduction(inhouse/contractmanufacturing)andqualitycontrol•StrongsaleschannelsandpartnernetworkfocusincludingenduserandinstalleractivationIncreaseadoptionoflatestsoftwareacrosstheinstalledbaseastheEVcharginghardwareroll-outaccelerates,usageandintegrationpricing•Clearcustomervaluepropositionwithkeyfunctionalitytooperatechargepointsefficiently•Cloud-basedsolutionswithself-servicesalesandmarketingtoenablemaximumscaleofcost-base•ModernUI,intensivecollaborationtocapturedataandgenerateinsight/increaseuptimeIncomefromrentalofpremisestoCPOs,dwelltimespendatdestinationandpotentialtoco-ownchargerswithusagelinkedreturns•Considerownershipoptions(landonlyvs.land+charginginfrastructure)•Offerattractiveadjacentofferingstoconsumersandattractotherbusinessestolocations•EnsureanintelligentutilizationofchargepointsInstallasmanychargersaspossibleandbecomepointofcontactforcustomersupportandhardwaremaintenance•Becomeago-toresalepartnerforhardwareproviders•Maintainlocalfootprintandproximitytoclients•Strongafter-salesofferingCapturesustainableshareofrevenuefromexistingplayers/end-usersasthemarketmatures,enabledbysoftwareintegrations•EnableseamlessEVcharginguserexperience•Integratewiththewiderchargingecosystem•LeveragedatatodeliverincreasedvaluethroughinsightsandanalyticsMaximiseelectricitythroughputwhilemaintainingelectricitymark-upandcosttoserveacrossthechargingnetwork•Clearlocationstrategy(public/fleet)securingkeysitesearlyandoptimizeagainstgridavailability•Customercentricityandintegrations(car/routing,payment,dwelltimelocationattractiveness)•Costbasecontrol(HW,el-prices),operationalexcellenceandoptimizeownvsthirdparty1)financingGrowinstalledbaseandmonetizelandownersthroughacompletechargingsolutiondelivery•Software-drivenwithhardwareprovisioningthroughcontractmanufacturers•Customercentricityandintegrationincustomerjourney•Maintaincost-basecontrolandstrongaccesstocapitalwhilescalingEVChargingMarketOutlookWaystoplaySmartchargepointproviderChargepointmanagementsoftwareInstallersandmaintenanceValueaddedserviceprovidersChargingsolutionproviderOwnersChargepointoperatorandowner2345671Strategy&22July2020DeepdiveOne:Publicfastchargingoperatorandowner20EVChargingMarketOutlookStrategy&CPOsmustmanagethevariousstakeholdersefficientlytoenablethebestpossiblechargingexperienceforEVdriversNote:1)Transmissionsystemoperator(TSO),Distributionsystemoperator(DSO)Source:Strategy&analysisChargepointoperator(CPO)ecosystem21EVdriver/user(B2B&B2C)eMSPMobilityserviceproviderprovideaccessandpaymentservicestodriversovermobileapplicationsCPOChargePointOperatorInstalls,managesandoperateschargingstationsthroughchargepointmgmt.softwareTSO/DSO1)Transmission/distributionOperatingthetransmission(central)gridanddistribution(regional)gridsconnectingtothechargingstationChargingstationlocationownerBusinessthatprovidesEVchargingattheirprivateorpubliclocations(suchasgasstations,retailers,publiccarparksetc.)RoamingagreementbetweenCPOandMSPSubscriptionEVdriversubscribestoeMSPplatformRoamingplatformMSPsandCPOscollaboratewithroamingplatformstoensurebroadestchargingnetworkpossible(aggregators)CarOEMs&chargerHWmanufacturersRegulation(emissions/tax,permitting,parking,chargingstandards)Financing(banks,regulatoryincentives,infrafunds,OEMs)EnergysupplyEnergyproviderssupplyingenergyHardwareCarOEMsarebuildingEVswithmorepowerfulbatteriesthatprovidelongerrangesandhigherchargingspeedCheaperandfasterchargersarebuilt,andbatteryenergystorageisofferedonsitetoenablepeakshavingEVChargingMarketOutlookStrategy&WeexpecttheCPObusinesstofollowfourkeydevelopmentstagesbasedonabilitytodriveutilisationandmaintainpricingSource:Strategy&analysisCPOutilizationrates–indicativepositioning•Assuminganabilitytoretainpricemark-uponpurchasedelectricity,utilizationofinstalledchargersisthekeydriverforprofitabilityforCPOsandowners.Fromourexperience,weobservefourkeystagesoffastpublicnetworkbusinessbuildupinEuropewithsimilarlessonsglobally:1.SelectiveCAPEX,focusonsitesexclusivity•WhentheBEVsstockislowandnotsomanychargersneeded,focusistosecurekeysitesforfutureroll-out.Installedchargerstypicallywithutilisation<5%.Italy,Spainatthephase2.KeyCashburnfromnewsitesandlowutilisation•AsBEVsales/stockincrease,thefocusisonaquickroll-outtoavoidcharginganxiety.AsInfrastructuregrowthoutpacesBEVs,utilisationimprovesonlyto5-10%.CurrentstageforGermany,UK,Netherlands3.Harvestabovehurdleratereturns•AsthestockofBEVsincreasefurtherandutilisationincreasesto10-15%likeinNorway,thefocusshiftstooptimisingutilisationthroughrightpartnershipsandadditionalvalueadd4.Managemarginpressurefromcompetition•Goingforward,especiallyinlate2020s/early30,withincreasedcompetitionandincreasedmarginpressuretofocusonfurtherbusinessnetworkoptimisation(managingexpansionandclosuresselectively)PublicchargingutilizationratesinselectedEuropeancountriesCommentsUtilisationandvalueaddoptimisationFocusonroll-outSecurekeysitesPortfolioUtilisation%Maturity–level15%+10-15%5-10%0-5%SelectiveCAPEX,focusonsitesexclusivityKeyCashburnfromnewsitesandlowutilHarvestabovehurdleratereturnsManagemarginpressurefromcompetitionPortfoliooptimisationbasedonmarginalreturn/uniteconomicsEVChargingMarketOutlook22Strategy&TheCPObusinessmodelisassetheavywithsignificantcapex,butpotentialforstrongreturnsandshortassetpaybackSource:Strategy&analysisTypicalCPOcashflowTT+1T+2T+3T+4T+5T+6CAPEXOPEXRevenueCurrentobservedpaybacktimesof2-5yearsdependingonmarketmaturityandlocationqualityKeyconsiderationsimpactingcashflow•CAPEX−Optimisechargerpower,sub-stations/gridconnection,onshorepowergenerationtocurrentdemand−Scaleforfuturegrowth(increase#ofchargers,higherpower/connection)toensurepositivecustomerexperience•Revenue−Maximizechargeruptime/utilisation−Stableandfairlyperceivedelectricitypricemark-upwithdynamic,demand-basedpricing•OPEX−Deploydigitalandagilesupportfunction−Prioritisemaintenancetomaximiseassetlifetimeanduptime−ControlpowercostthroughPPAandhedgingTypicalCPOcashflowdevelopmentEVChargingMarketOutlook23Strategy&FastnedillustratestheuniteconomicsofCPOandownerdrivingROICupthroughhigherkWhperstationandstableOPEXNote:1)OperationalEBITDAmarginisdefinedas“Grossprofitfromrevenuesrelatedtocharging+otheroperatingincome/(loss)-networkoperationcosts–exceptionalitem”2)AnnualizedQ4stationeconomicseachyearSources:Companyreports,Reuters,Strategy&analysisFastnedaveragestationeconomics2)Initialinvestment,EURkGrossprofit,EURk2553073404295141819202122+19%265148801381819202122+39%181920212220(33%)14(24%)40(35%)79(34%)+58%18192021220.420.460.450.360.460%StationROIC,%18192021227%4%9%15%181920212262(6.3%)111(9.9%)107(7.6%)222(10.4%)307(13.2%)+40%GrossprofitperkWh,EURkWhperstation(utilisation),thousands-3%•ThegrowthinCAPEXdrivenbyaveragenumberofchargersperstationincreasingfrom4to5+’21-’22andrelatedsitecostssuchasgridconnectionsandotherstationrelatedcosts•Despitevolatileelectricitymarkets,FastnedhasmaintainedastablegrossprofitperkWh•Thestronggrowthingrossprofitperstationisdrivenbytheincreasedutilisation(6%to13%)andhigherpoweroutputchargersyielding50%CAGRinkWhperstation•Utilizationisthekeydriverforhigherprofitability,asseenbyFastned’sstationeconomics•Fastned’scurrentstationEBITDAandcapexlevelsimpliesastationROICof~15%,whichimpliesa6-7yearspaybackperiodOperationalEBITDA1),EURk-7(-20%)•ThestrongEBITDAdevelopmentismainlydrivenbytheincreasedvolume•Operationalcostsperstationremainfairlystable,althoughlargerstationsandhighinflationdrivesomecostincreases~14~25~15Paybackperiod(yrs)~6.5n.a.EVChargingMarketOutlook24Strategy&~3.0~6.0~3.0~3.0~14.0InamaturingNorwegianmarket,observedutilisationreflectpositiveROICandapaybackof~2-5yearsformajorityofsitesinurbanareasNote1)Averageobservedutilizationfrom16.12.2022–13.03.2023.Basedonaverageofdailycomputedutilizationdatafrom~1’000chargingstations2)Only50kWchargers(e.g.38kWor125kWarenotincluded)3)Usingaverageutilizationrates.ChargerROIC=OperationalEBITDA/Capex.Payback=1/ROICSource:CPOchargingdata,Strategy&analysisObservedtime-basedutilization1andestimatedROICforNorwegianCPOs010203040506080Time-basedUtilization,%Est.payback3)(in#ofyears)StreetDestinationGasstations~4.0~6.0~5.0Slow≤22kWFast50kW2)Ultra-fast150kW+AverageutilizationSlow≤22kWFast50kW2)Ultra-fast150kW+Slow≤22kWFast50kW2)Ultra-fast150kW+Comments•ObservedaverageutilizationratesforNorwegianCPOsof~13%(medianof11%)across~1000publicchargerstations•Highestaverageutilization(~18%)observedfortheultra-fast(150kW+)on-the-gochargersatgasstations−Hightrafficvolumeandlimitedcompetitiondrivedemand–customers’lowdwelltimeleadtopreferencefor150kW+•ACstreetchargerswithlowutilizationacrossthefullsample,butifincludingonlychargersinlargermaincities,theaverageis~18%•Overall,attractivepaybackforACstreetcharging(~3yrs),aswellasfastchargingatdestinationandgasstations(~3yrs)•Achievinghigherutilisationlevelsneedstobeconsideredinconnectionwith“positiveuserexperience”especiallyavoidingqueues(ruleofthumbunder25%utilisation)~2.0Average(alllocations)Average(maincitiesonly)~3.0Maincities(avg.)n.a.EVChargingMarketOutlook25PositiveuserexperienceStrategy&22July2020DeepdiveTwo:Dealmakingactivitybydealtype,waytoplayandacquirer26EVChargingMarketOutlookStrategy&•CompaniesestablishedintheEVchargingmarket•SeekopportunitytoexpandtheirEVchargingportfoliothroughadditionalHWinvestments(newproductsandorgeos),withadditionalsoftwareandservicestostrengthensolutionofferingDifferentindustryplayersareactivelycarvingoutmaterialpositionsacrosstheEVvaluechainSource:Pitchbook,PwCStrategy&analysisEVchargingmarketconsolidatorarchetypesCapabilitiesleveragedinEVchargingmarket•Companieshistoricallyactivewithinbothupstreamanddownstreamactivities•Focusgraduallyshiftingtowardsrenewablesandadjacentmarkethorizontals•Typicallyactiveinfuelandretailsegmenteitherdirectlyorthroughpartners•Energyproviderssupplyinghouseholdsandbusinesseswithpower•Playinbothasset-lightsolutionandasset-heavyCPO+ownershipmodel•Forasset-heavybusinessmodel,anincreasingmovetoco-ownershipwithfinancialsponsors•CarmakersandsupplierstotheindustryseeanopportunitytotakepartintheEVchargingmarket•CombinationofM&A,JVandin-houseorganicdevelopmentofcapabilitiesrequiredtosucceed•Successfulfirstmoverstypicallyattractingfundingfrominvestmentcompaniesetc.andbeingusedasaplatformforfurtherM&Aroll-up•Infra-fundsacquiringCPOsandowners,whiletraditionalPEslookingbroadlyacrossHW,SWandservicesElectricityChargepointhardwareChargepointsoftwareAdditionalvalueaddLandandassetServicesNosingle/clearconnectionCarpointofsalekeytosellB2CchargerHWExistingR&DcapabilitiesExistingservicepartnerset-upEVecosystemtocreatecustomerlockinAcquiringearlysucceedersandaddingcapabilitiesNolegacyfromadjacentmarketsgives“cleanslate”AccesstocapitalNetworkandpartnershipsOwnerofattractivegasstationlocationsIn-depthknowledgeofenergymarketsExistingservicepartnerset-upEstablishedcustomerbasefromfuelandretailIn-depthknowledgeofenergymarketsEstablishedcustomerbasefromenergyprovisionAccesstoenergythroughownproduction/contractsGridintegrationwithadvancedmeteringandbalancingEVChargingMarketOutlook27HW-orientedwithproductionorservicecapabilityPureplayEVchargingbusinessKnowledgeonhowtooperateanEVchargingbusinessEstablishedcustomerbasefromexistingchargingnetworkIndustryplayersOilandgasUtilitiesAutomotiveFinancialsponsorsABCDEDescriptionStrategy&EVcharginghasseenasteadyincreasein#ofdeals(350in‘21and326in’22)andamarkedincreaseintheirvalueSource:PitchBook,Strategy&analysisNumberofdealsandtransactionvalueofdiscloseddealsEVChargingMarketOutlook286487114118139256179314861646095147201620172018201920202021202295135175182199351326+23%20162017201820192020202120221.02.44.61.18.715.99.3+45%Non-disclosedDisclosedEURbnNumberofdealsTransactionvalue(disclosedtransactions)DealDate:From:01-Jan-2012;DealOption:Searchonafulltransaction;DealStatus:Completed;Announced/InProgress;DealTypes:AllBuyoutTypes;OtherPrivateEquityTypes;AllVCStages;AllRoundNumbers;AllSeries;M&A/ControlTransactions;Non-ControlTransactions;OtherM&ATransactions;PublicInvestments>IPO;AllGeneralDebt;Locations:UnitedStates;Europe;Asia>EastAsia>China;MiddleEast>Israel;SearchHQOnly;EmergingSpaces:Energy>ElectricVehicleChargingInfrastructure;Keywords:electricvehiclecharging;evcharging;publiccharginginfrastructure;vehiclecharging;chargingsoftware;chargingsolutions;charginginfrastructure;SearchEmergingSpacesORKeywords;Strategy&EuropeleadstheshiftfromearlystagefinancingtoM&Agiventhemorematuremarket,USwithsignificantuptickin’21-’22EarlyStage:ProductCrowdfunding,EquityCrowdfunding,Accelerator/Incubator,SeedRound,Angel(individual),EarlyStageVC,LaterStageVCPublicEquity:PIPE(Privateinvestmentinpublicequity,Reversemerger,IPOM&A:Buyout/LBO;CorporateandM&A,PEGrowth/expansionDebt:DebtRefinancing,Repayment,ConvertibleDebtSource:PitchBook,Strategy&analysisTypesoffinancingsplitonlocationsEVChargingMarketOutlook2969%74%68%63%53%52%6%19%16%20%23%35%38%6%3%6%4%2012-20172%4%4%20182%4%20194%4%20208%2%2%20215%4%1%20221909699109173171+16%77%76%81%72%65%69%14%14%16%14%10%7%14%23%5%4%2012-20173%7%20186%1%1%20195%20202%4%20213%3%3%2022210587076140118+19%70%76%85%64%97%76%10%10%8%21%11%6%8%7%12%7%11%2%2012-20175%5%5%2018201920203%20213%2022502113143837+15%EarlystagePublicequityJVM&ADebtTheEuropeanmarketisthemostmatureandseesthemostM&Adeals,whichismainlydrivenbyfinancialinvestorsTheUSmarketisnotasmaturewithinEVcharging,however,thereisahighleveloffinancialactivityTheAsianmarketislaggingintermsofquantityofdeals,butexperiencethesamegrowth(%)asEuropeandtheUS326Europe(incl.UK+Israel)Americas(US)Asia(China)Strategy&Outof~300trackedM&Adeals,financialsponsorsaccountfor40%withinter-sectorplayers20%andUtilityandO&G17%Source:PitchBook,Strategy&analysis2012-2022–M&Atransactionsbybuyerandtargettype(waystoplay)300%20%40%60%80%100%16%Utility17%20%8%11%17%29%8%Automotive9%31%9%2%23%24%O&G18%36%8%21%16%PE/Investmentcompanies7%5%7%8%7%16%21%49%38%22%InfrastructurefundsChargingindustryplayer44%13%8%3%13%50%21%12%6%19%8%Other6914351283374868%6%20%4%3%2012-2022EarlystagePublicequityJVM&ADebt1,683Total#ofdealsM&AdealsbybusinessmodelsallocatedtoinvestortypesSmartchargepointproviderInstallerandmaintenanceValueaddingserviceproviderCPOandownerChargingsolutionproviderChargepointmanagementsoftwareKeydealrationaleperinvestortypesEVChargingMarketOutlookChargingindustryplayer•Geographicalexpansionandscaleofoperations•Strengthenedsolutioncapability(higherverticalintegration)AO&G•CPOandownerdeals(assetownership)•SoftwaretooptimizeoperationofitschargingnetworkBUtility•Solutioncapability•Energymgmt.valueadd(e.g.gridintegrationwithadvancedmeteringandbalancing)CAuto-motive•Investinginhardwaretoenableroll-outofchargepointsandimproveaccessibility•SoftwareforaseamlesschargingexperienceDPE/assetmgmt.companies•Investbroadlyacrosshardware,softwareandservices•GenerallyincreasinginvestmentappetiteE1Infra-structurefunds•FocusonCPOs+owner(e.g.assetownershipdeals)•StrongrecentincreaseininvestmentsE2ABCDE1E22.60.50.11.30.61.22.0Totaldealsize’12-’22(EURbn)ColourhighlightforsegmentswithhigherthanmarketaverageshareofM&AStrategy&GenerallystronginterestintheEVchargingspacewithfinancialsponsorsshowingparticularincreasein#ofdealsSource:PitchBook,Strategy&analysisM&Atransactionsbybuyerandtargettype,yearandselecteddeals3113134124223235105412-’1711’18’191’201’211’22691921+37%62221322122212-’171’181’191’2011’21111’22275105+26%11211112-’171’181’19’20111’2111’222253+11%311412-’17’18’19’2011’211’2235+124%163233223326235627232512-’17’18’191’20’21’22511141423+46%15612327212-’171’1811’1911’2011’211’22245916+68%ChargingindustryplayersAutomotiveO&GUtilitiesPEfundsInfrastructurefundsSmartchargepointproviderChargepointsoftwareonlyInstallerandmaintenanceValueaddedserviceproviderCPOandownerChargingsolutionproviderCombinedFinancialsponsors0.00.00.01.60.90.0Totaldealsize’12-’22(EURbn)0.00.00.01.60.90.0Totaldealsize’12-’22(EURbn)0.00.00.00.10.30.1Totaldealsize’12-’22(EURbn)0.00.00.00.70.60.0Totaldealsize’12-’22(EURbn)0.00.00.00.20.70.3Totaldealsize’12-’22(EURbn)0.00.30.20.41.00.1Totaldealsize’12-’22(EURbn)EVChargingMarketOutlookStrategy&Authorsandcontributors32ChristianBrickensteinPartnerchristian.brickenstein@strategyand.de.pwc.comAutomotiveStrategyContributorsHenningRennertPartnerhenning.rennert@strategyand.de.pwc.comAutomotiveStrategyEditorial:JørgenFrostBøMarkusAndersenStevenvanArsdaleDanielAdamTimJoussenNoelKretzMilosBartosekDirectorbartosek.milos@pwc.comInfrastructureandMobilityDealsRegionalinput:PanosStergiopoulosMassimoLeonardiDavidRodriguezVillanuevaVladislavaIovkovaAkshaySinghJunJinAuthorsEVChargingMarketOutlook©2023PwC.Allrightsreserved.PwCreferstothePwCnetworkand/oroneormoreofitsmemberfirms,eachofwhichisaseparatelegalentity.Pleaseseewww.pwc.com/structureforfurtherdetails.MentionsofStrategy&refertotheglobalteamofpracticalstrategiststhatisintegratedwithinthePwCnetworkoffirms.FormoreaboutStrategy&,seewww.strategyand.pwc.com.NoreproductionispermittedinwholeorpartwithoutwrittenpermissionofPwC.Disclaimer:Thiscontentisforgeneralpurposesonly,andshouldnotbeusedasasubstituteforconsultationwithprofessionaladvisors.

1、当您付费下载文档后,您只拥有了使用权限,并不意味着购买了版权,文档只能用于自身使用,不得用于其他商业用途(如 [转卖]进行直接盈利或[编辑后售卖]进行间接盈利)。
2、本站所有内容均由合作方或网友上传,本站不对文档的完整性、权威性及其观点立场正确性做任何保证或承诺!文档内容仅供研究参考,付费前请自行鉴别。
3、如文档内容存在违规,或者侵犯商业秘密、侵犯著作权等,请点击“违规举报”。

碎片内容

碳中和
已认证
内容提供者

碳中和

确认删除?
回到顶部
微信客服
  • 管理员微信
QQ客服
  • QQ客服点击这里给我发消息
客服邮箱