2023年全球能源展望:播下能源转型的种子(英)--未来能源研究所VIP专享VIP免费

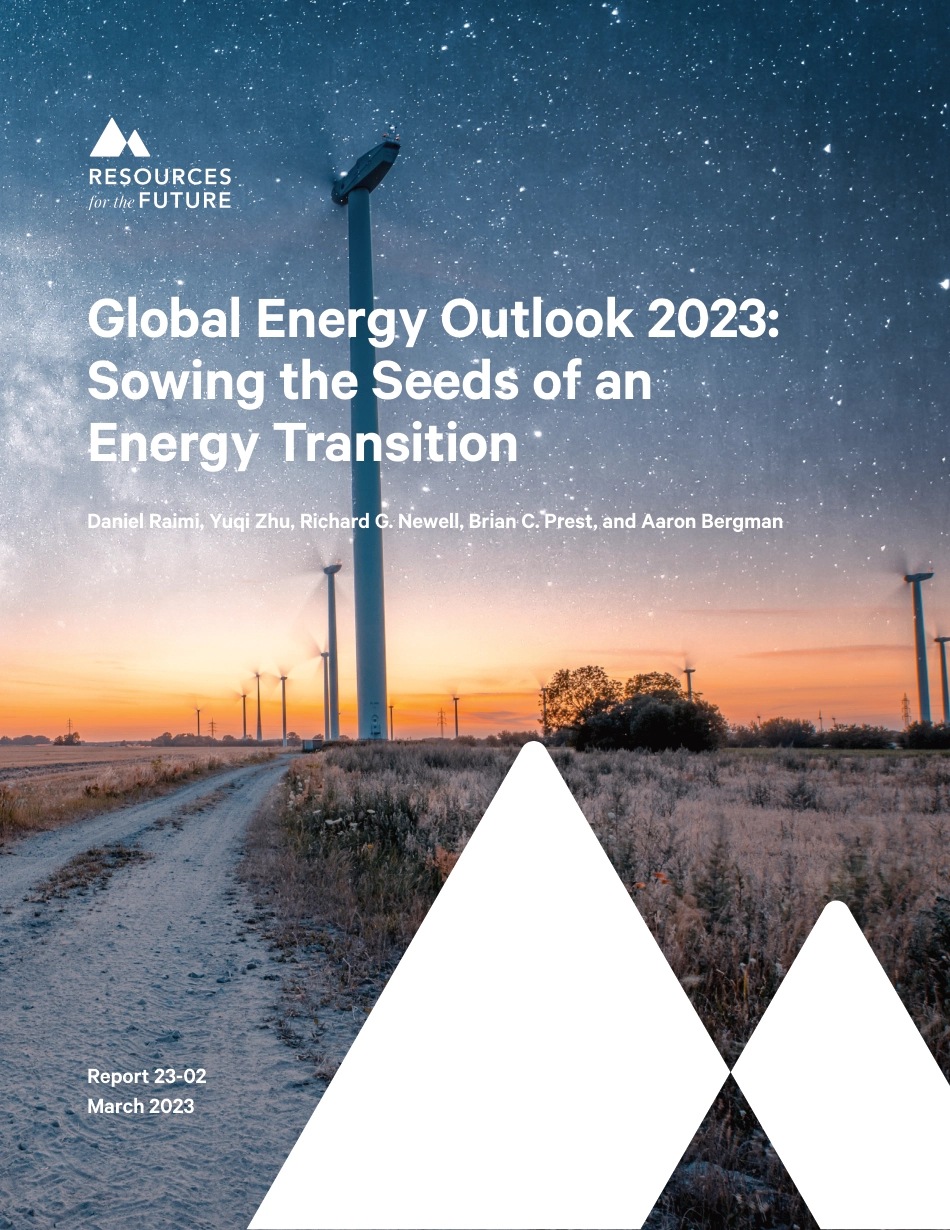
Global Energy Outlook 2023: Sowing the Seeds of an Energy Transition A
Global Energy Outlook 2023:
Sowing the Seeds of an
Energy Transition
Daniel Raimi, Yuqi Zhu, Richard G. Newell, Brian C. Prest, and Aaron Bergman
Report 23-02
March 2023
Resources for the Future i
About the Authors
Daniel Raimi is a fellow at Resources for the Future (RFF) and a lecturer at the
Gerald R. Ford School of Public Policy at the University of Michigan. He works on a
range of energy policy issues with a focus on tools to enable an equitable energy
transition. He has published in academic journals including Science, Science Advances,
Environmental Science and Technology, Journal of Economic Perspectives, Review
of Environmental Economics and Policy, Energy Research and Social Science, and
Energy Policy and in popular outlets including The New Republic, Newsweek, Slate,
and Fortune. He has presented his research for policymakers, industry, and other
stakeholders around the United States and internationally, including before the
Energy and Mineral Resources Subcommittee of the US House’s Natural Resources
Committee. In 2017, he published The Fracking Debate (Columbia University Press),
a book that combines stories from his travels to dozens of oil- and gas-producing
regions with a detailed examination of key policy issues.
Yuqi Zhu joined RFF as a senior research associate in 2022 after receiving his master’s
degree in public policy from the Harvard Kennedy School. Prior to graduate school,
he worked in corporate development at Liberty Media, a media and communications
holding company in Denver.
Dr. Richard G. Newell is the president and CEO of RFF, an independent, nonprofit
research institution that improves environmental, energy, and natural resource
decisions through impartial economic research and policy engagement. From 2009 to
2011, he served as the administrator of the US Energy Information Administration (EIA),
the agency responsible for oicial US government energy statistics and analysis. Dr.
Newell is an adjunct professor at Duke University, where he was previously the Gendell
Professor of Energy and Environmental Economics and founding director of its Energy
Initiative and Energy Data Analytics Lab. He has also served as the senior economist
for energy and environment on the President’s Council of Economic Advisers and was
a senior fellow, and later a board member, at RFF.
Brian C. Prest is an economist and fellow at RFF specializing in the economics of
climate change, energy economics, and oil and gas supply. Prest uses economic
theory and econometrics to improve energy and environmental policies by assessing
their impacts on society. His recent work includes improving the scientific basis
of the social cost of carbon and economic modeling of various policies around oil
and gas supply. His research has been published in peer-reviewed journals such as
Nature, the Brookings Papers on Economic Activity, the Journal of the Association of
Environmental and Resource Economists, and the Journal of Environmental Economics
and Management. His work has also been featured in popular press outlets including
the Washington Post, the Wall Street Journal, the New York Times, Reuters, the
Associated Press, and Barron’s.
Aaron Bergman is a fellow at RFF. Prior to joining RFF, he was the lead for
macroeconomics and emissions at the EIA, managing EIA’s modeling in those areas.
Before working at EIA, Bergman spent over a decade in the policy oice at the
Global Energy Outlook 2023: Sowing the Seeds of an Energy Transition ii
Department of Energy, working on a broad array of climate and environmental policies.
Bergman has worked in the White House at the Oice of Science and Technology Policy,
managing the Quadrennial Energy Review and handling the methane measurement
portfolio, and at the Council on Environmental Quality, working on carbon regulation.
Bergman entered the federal government in 2009 as a Science and Technology Policy
Fellow with the American Association for the Advancement of Science, after working in
high energy physics.
Acknowledgements
We thank Stu Iler, who initially developed the platform for harmonizing outlooks. Thanks
also to Erin Campbell for her early work on this year’s analysis. We also thank those
who assisted by providing data and context, including Matthias Kimmel and Rodrigo
Quintero at BNEF; Michael Cohen and Jorge Blazquez at bp; April Ross at ExxonMobil;
Paul Andrew Holtom, Astrid Nåvik, Ottar Skagen, and Eirik Waerness at Equinor; Tim
Gould, Laura Cozzi, and Pawel Olejarnik at IEA; and Suehiro Shigeru at IEEJ.
About RFF
Resources for the Future (RFF) is an independent, nonprofit research institution in
Washington, DC. Its mission is to improve environmental, energy, and natural resource
decisions through impartial economic research and policy engagement. RFF is
committed to being the most widely trusted source of research insights and policy
solutions leading to a healthy environment and a thriving economy.
The views expressed here are those of the individual authors and may dier from those
of other RFF experts, its oicers, or its directors.
Sharing Our Work
Our work is available for sharing and adaptation under an Attribution-
NonCommercial-NoDerivatives 4.0 International (CC BY-NC-ND 4.0) license. You
can copy and redistribute our material in any medium or format; you must give
appropriate credit, provide a link to the license, and indicate if changes were made,
and you may not apply additional restrictions. You may do so in any reasonable
manner, but not in any way that suggests the licensor endorses you or your use. You
may not use the material for commercial purposes. If you remix, transform, or build
upon the material, you may not distribute the modified material. For more information,
visit https://creativecommons.org/licenses/by-nc-nd/4.0/.
GlobalEnergyOutlook2023:SowingtheSeedsofanEnergyTransitionAGlobalEnergyOutlook2023:SowingtheSeedsofanEnergyTransitionDanielRaimi,YuqiZhu,RichardG.Newell,BrianC.Prest,andAaronBergmanReport23-02March2023ResourcesfortheFutureiAbouttheAuthorsDanielRaimiisafellowatResourcesfortheFuture(RFF)andalecturerattheGeraldR.FordSchoolofPublicPolicyattheUniversityofMichigan.Heworksonarangeofenergypolicyissueswithafocusontoolstoenableanequitableenergytransition.HehaspublishedinacademicjournalsincludingScience,ScienceAdvances,EnvironmentalScienceandTechnology,JournalofEconomicPerspectives,ReviewofEnvironmentalEconomicsandPolicy,EnergyResearchandSocialScience,andEnergyPolicyandinpopularoutletsincludingTheNewRepublic,Newsweek,Slate,andFortune.Hehaspresentedhisresearchforpolicymakers,industry,andotherstakeholdersaroundtheUnitedStatesandinternationally,includingbeforetheEnergyandMineralResourcesSubcommitteeoftheUSHouse’sNaturalResourcesCommittee.In2017,hepublishedTheFrackingDebate(ColumbiaUniversityPress),abookthatcombinesstoriesfromhistravelstodozensofoil-andgas-producingregionswithadetailedexaminationofkeypolicyissues.YuqiZhujoinedRFFasaseniorresearchassociatein2022afterreceivinghismaster’sdegreeinpublicpolicyfromtheHarvardKennedySchool.Priortograduateschool,heworkedincorporatedevelopmentatLibertyMedia,amediaandcommunicationsholdingcompanyinDenver.Dr.RichardG.NewellisthepresidentandCEOofRFF,anindependent,nonprofitresearchinstitutionthatimprovesenvironmental,energy,andnaturalresourcedecisionsthroughimpartialeconomicresearchandpolicyengagement.From2009to2011,heservedastheadministratoroftheUSEnergyInformationAdministration(EIA),theagencyresponsibleforofficialUSgovernmentenergystatisticsandanalysis.Dr.NewellisanadjunctprofessoratDukeUniversity,wherehewaspreviouslytheGendellProfessorofEnergyandEnvironmentalEconomicsandfoundingdirectorofitsEnergyInitiativeandEnergyDataAnalyticsLab.HehasalsoservedasthesenioreconomistforenergyandenvironmentonthePresident’sCouncilofEconomicAdvisersandwasaseniorfellow,andlateraboardmember,atRFF.BrianC.PrestisaneconomistandfellowatRFFspecializingintheeconomicsofclimatechange,energyeconomics,andoilandgassupply.Prestuseseconomictheoryandeconometricstoimproveenergyandenvironmentalpoliciesbyassessingtheirimpactsonsociety.Hisrecentworkincludesimprovingthescientificbasisofthesocialcostofcarbonandeconomicmodelingofvariouspoliciesaroundoilandgassupply.Hisresearchhasbeenpublishedinpeer-reviewedjournalssuchasNature,theBrookingsPapersonEconomicActivity,theJournaloftheAssociationofEnvironmentalandResourceEconomists,andtheJournalofEnvironmentalEconomicsandManagement.HisworkhasalsobeenfeaturedinpopularpressoutletsincludingtheWashingtonPost,theWallStreetJournal,theNewYorkTimes,Reuters,theAssociatedPress,andBarron’s.AaronBergmanisafellowatRFF.PriortojoiningRFF,hewastheleadformacroeconomicsandemissionsattheEIA,managingEIA’smodelinginthoseareas.BeforeworkingatEIA,BergmanspentoveradecadeinthepolicyofficeattheGlobalEnergyOutlook2023:SowingtheSeedsofanEnergyTransitioniiDepartmentofEnergy,workingonabroadarrayofclimateandenvironmentalpolicies.BergmanhasworkedintheWhiteHouseattheOfficeofScienceandTechnologyPolicy,managingtheQuadrennialEnergyReviewandhandlingthemethanemeasurementportfolio,andattheCouncilonEnvironmentalQuality,workingoncarbonregulation.Bergmanenteredthefederalgovernmentin2009asaScienceandTechnologyPolicyFellowwiththeAmericanAssociationfortheAdvancementofScience,afterworkinginhighenergyphysics.AcknowledgementsWethankStuIler,whoinitiallydevelopedtheplatformforharmonizingoutlooks.ThanksalsotoErinCampbellforherearlyworkonthisyear’sanalysis.Wealsothankthosewhoassistedbyprovidingdataandcontext,includingMatthiasKimmelandRodrigoQuinteroatBNEF;MichaelCohenandJorgeBlazquezatbp;AprilRossatExxonMobil;PaulAndrewHoltom,AstridNåvik,OttarSkagen,andEirikWaernessatEquinor;TimGould,LauraCozzi,andPawelOlejarnikatIEA;andSuehiroShigeruatIEEJ.AboutRFFResourcesfortheFuture(RFF)isanindependent,nonprofitresearchinstitutioninWashington,DC.Itsmissionistoimproveenvironmental,energy,andnaturalresourcedecisionsthroughimpartialeconomicresearchandpolicyengagement.RFFiscommittedtobeingthemostwidelytrustedsourceofresearchinsightsandpolicysolutionsleadingtoahealthyenvironmentandathrivingeconomy.TheviewsexpressedherearethoseoftheindividualauthorsandmaydifferfromthoseofotherRFFexperts,itsofficers,oritsdirectors.SharingOurWorkOurworkisavailableforsharingandadaptationunderanAttribution-NonCommercial-NoDerivatives4.0International(CCBY-NC-ND4.0)license.Youcancopyandredistributeourmaterialinanymediumorformat;youmustgiveappropriatecredit,providealinktothelicense,andindicateifchangesweremade,andyoumaynotapplyadditionalrestrictions.Youmaydosoinanyreasonablemanner,butnotinanywaythatsuggeststhelicensorendorsesyouoryouruse.Youmaynotusethematerialforcommercialpurposes.Ifyouremix,transform,orbuilduponthematerial,youmaynotdistributethemodifiedmaterial.Formoreinformation,visithttps://creativecommons.org/licenses/by-nc-nd/4.0/.ResourcesfortheFutureiiiHighlightsRecentpolicydevelopmentsintheUnitedStates,increasedambitionintheEuropeanUnion,andeffortsbyothernationsaresowingtheseedsofanenergytransition.Althoughcoal,oil,andgasconsumptionareatorneartheirall-timehighsglobally,climateambitionandactionaregrowinginpublicandprivatesectors.Howquickly,andatwhatscale,willtheseseedsbearfruit?Globalenergyadditionshavecontinued,reboundingfromthelowsof2020andtheCOVID-19pandemic.In2021,globalcoaldemandroughlyequaleditspreviouspeak,andpreliminary2022datafromIEAshowitreachinganall-timehigh.Oilandnaturalgasdemandremainatorneartheirall-timeglobalhighs.Cleanenergytechnologiesareseeingrecordlevelsofinvestment.Thistrendwillneedtoaccelerateiftheworldistohaveanychanceoflimitingglobalmeantemperatureriseto1.5°Cor2°Cby2100.Underscenariosthatachievetheseclimatetargets,windandsolartogetherproducemoreelectricityin2050thanallofglobalelectricitygenerationin2021.TheUnitedStatespassedmajorfederalclimatelegislation,butquestionsaboutimplementationremain.TheUSsubsidy-basedapproachisprojectedtoreduceemissions,butthespeedandscaleofreductionswilldependonnoncostbarriers,suchaslocalacceptanceofenergyinfrastructureandstateandlocalpermittingprocesses.IndiaandChinaareatdifferentstagesofenergydevelopment.AsIndiabecomestheworld’smostpopulouscountry,itsenergydemandisprojectedtogrowstronglyinthedecadesahead,withtheenergymixheavilydependentonclimatepolicyambition.InChina,adecliningpopulationandslowingeconomicgrowthleadtostagnantordecliningenergydemand,withadecliningrelianceonfossilfuels.GlobalEnergyOutlook2023:SowingtheSeedsofanEnergyTransitionivContents1.Introduction12.KeyFindings33.InFocus133.1.WhitherPeakOilandGasDemand?133.2.AssessingRegionalGrowthTrendsforWindandSolar163.3.FuelsoftheFuture183.3.1.Electricity193.3.2.Hydrogen213.3.3.Biomass224.DataandMethods245.Statistics286.Endnotes37GlobalEnergyOutlook2023:SowingtheSeedsofanEnergyTransition11.IntroductionThefutureoftheglobalenergysystemisdeeplyuncertain,andthechoicesthataremadeinthecomingyearswillhaveenormousconsequencesforthefutureoftheclimateand,indeed,humancivilization.Tounderstandhowourenergysystemischanging,eachyearvariousorganizationsproducelong-termprojectionsthatimagineawiderangeoffuturesbasedondivergentvisionsaboutpolicies,technologies,prices,andgeopolitics.Becausetheseprojectionsvarywidelyanddependheavilyontheirdifferentassumptionsandmethodologies,theyaredifficulttocompareonanapples-to-applesbasis.Inthisreport,weapplyadetailedharmonizationprocesstocompare14scenariosacrosssevenenergyoutlookspublishedin2022.WealsoincludeBP’sEnergyOutlook2023,whichwaspublishedinJanuary2023.Takentogether,thesescenariosofferabroadscopeofpotentialchangestotheenergysystemasenvisionedbysomeofitsmostknowledgeableorganizations.Table1showsthehistoricaldatasets,outlooks,andscenariosexaminedhere;detailsareprovidedinSection4.AbriefdescriptionofourmethodologyappearsunderDataandMethods(Section4),withselectdataindicatorsunderStatistics(Section5).Forthefullmethodology,datasets,andinteractivegraphingtools,visitwww.rff.org/geo.Table1.OutlooksandScenariosExaminedinThisReportSourceDatasetoroutlookScenario(s)YearsGrubler(2008)Historical—1800–1970IEA(2022)Historical—1970–2020BNEF(2022)NewEnergyOutlook2022EnergyTransitionScenario(ETS)NetZeroScenario(NZS)To2050BP(2023)OutlookforEnergy2023NewMomentumAcceleratedNetZeroTo2050Equinor(2022)EnergyPerspectives2022WallsBridgesTo2050ExxonMobil(2022)2022EnergyOutlookReferenceTo2050IEA(2022)WorldEnergyOutlook2022StatedPolicies(STEPS)AnnouncedPledges(APS)NetZeroEmissionsby2050(NZE)To2050IEEJ(2022)EnergyOutlook2023(publishedin2022)ReferenceAdvancedTechnologiesTo2050OPEC(2022)WorldOilOutlook2022ReferenceTo2045ResourcesfortheFuture2Throughoutthefiguresincludedinthisreport,weuseaconsistentlabelingsystemthatdistinguishesthedifferentscenarios(seeTable2):•For“Reference”scenarios,whichassumelimitedornonewpolicies,weusealong-dashedline.ThissetcomprisesReferencescenariosfromExxonMobil,IEEJ,andOPEC.•For“EvolvingPolicies”scenarios,whichassumethatpoliciesandtechnologiesdevelopaccordingtorecenttrendsand/ortheexpertviewsoftheteamproducingtheoutlook,weusesolidlines.ThissetcomprisesBNEFETS,BPNewMomentum,andIEASTEPS.Althoughtheydonotfollowthesamesetsofassumptions,wealsoincludeEquinorWallsandIEEJAdvancedTechnologiesscenariosinthisgroupbecausetheirtrajectoriesforcarbondioxide(CO2)emissionsaresimilartothoseinotherEvolvingPoliciesscenarios.ForIEAAPS,whichassumesthatgovernmentsimplementallannouncedenergyandclimatepolicies,weuseadot-dashline.•For“AmbitiousClimate”scenarios,whicharebuiltaroundlimitingglobalmeantemperaturerisebelow2°Cby2100,weuseshort-dashedlines.Justonescenariometthisdefinition:BP’sAcceleratedTransition.•ForAmbitiousClimatescenarios,designedtolimitglobalmeantemperatureriseto1.5°Cby2100ornet-zeroemissionsby2050,weuseadottedline.ThissetincludesBNEFNZS,BPNetZero,EquinorBridges,andIEANZE.Figuresandtablesinthisreportsometimesrefertoregionalgroupingsof“East”and“West.”iTable3providesthoseregionalgroupings.iThisyear,regionaldatawerelimitedforroughlyhalfofthescenarios,makingitimpossibletocreateconsistent“East”and“West”groupingsformanyscenarios.Table2.LegendforScenarioTypesReferenceEvolvingPoliciesAmbitiousClimate(2°C)AmbitiousClimate(1.5°C)Exxon-MobilBNEFETSBPAccel.BNEFNZSIEEJReferenceBPNewMomentumBPNetZeroOPECReferenceEquinorWallsEquinorBridgesIEAAPSIEANZEIEASTEPSIEEJAdvancedTable3.RegionalDefinitionsfor“East”and“West”“East”Africa,Asia-Pacific,MiddleEast“West”Americas,Europe,EurasiaGlobalEnergyOutlook2023:SowingtheSeedsofanEnergyTransition32.KeyFindingsDespitepledgesfromgovernmentsandmajorcorporationsaroundtheworldtoreducegreenhousegasemissions,theworldismostlycontinuingitslonghistoryofaddingto,ratherthantransitioningawayfrom,olderenergysources.Althoughpolicymakers,civilsociety,andbusinessleadershavebegunsowingtheseedsoftheenergytransition,muchmoreactionwillberequiredtoensurethattheseseedsbearfruitatthescaleandspeednecessarytoaverttheworsteffectsofclimatechange.Globalinvestmentincleanenergytechnologies,ledbyrenewablepowerandelectrictransportation,grewtoanestimated$1.1trillionin2022,up31percentfromtheprioryear.11Andyet,preliminarydataindicatethatworldCO2emissionsgrewby1percentthatsameyear,surpassingtheir2019peak.12Suchtrendsillustratetheimmensescaleoftheglobalenergysystemandthechallengeofshiftingitnotjusttowardcleansourcesbutalsoawayfrompollutingsources.Atthesametime,moreandmorepolicymakersandprivatesectorleadersaremakingcommitmentstoreduceemissionstonetzerointhedecadesahead.Thesecommitmentsareshiftingtheenergysystematnationalandregionalscales,particularlyindevelopedeconomiesinEuropeandNorthAmerica.Nonetheless,theprojectionsincludedinthisanalysis,andthosepreparedbyotherexpertsandorganizations,13–15demonstrateclearlythattheworldneedstomatchwordswithactionstoreduceemissionsandlimitglobalwarmingto2°C,letalone1.5°C,bytheendofthecentury.Figure1.GlobalPrimaryEnergyDemand,bySourceDatasources:Grubler,1IEA,7andIEA.10ResourcesfortheFuture4Althoughemissionsandfossilfuelconsumptionremainatorneartheirall-timehighsglobally,someregions—particularlyEurope—appeartohaveenteredatrueenergytransition,withfossilfuelsourcesbeingdisplacedatlargescalebycleanertechnologies.Russia’sinvasionofUkraineandtheresultingenergyinsecurityhaveacceleratedEurope’sshiftawayfromfossilfuels.Europe’sprogressinreducingemissionshasbeendrivenbyitspioneeringcarbonmarket,alongwithotherpoliciesthatsupportthedeploymentofrenewableelectricity,encouragelow-orzero-emissionstransportationoptions,andlevyhightaxesonfuelssuchasdieselandgasoline.However,theregion’senergytransitionhascomewithchallenges,someofwhichhavebeenexacerbatedbytheRussianinvasionofUkraine.Forexample,mostEuropeannationshaveneededtoincreasetheirrelianceoncoal-firedelectricitytoensurereliablepowersuppliesinthefaceofhighpricesanduncertainsuppliesfornaturalgas.IntheEuropeanUnion,coaldemandgrewby14percentin2021,followingtheCOVID-19pandemiclows,butisprojectedtogrowagainby7percentin2022.16Lookingforward,Europe’spolicyframeworkislikelytodrivedeepreductionsintheuseofcoalandotherfossilfuelsinthecomingyears.Forexample,ExxonMobil’sReferenceandIEA’sSTEPSprojectthattheshareoffossilfuelsinEurope’sprimaryenergymixfallsfrom68–70percentin2021to59–62percentby2030,followedbyfurtherreductionsinsubsequentyears.Figure2.PrimaryEnergyDemandinEurope,bySourceDatasource:BPStatisticalReviewofEnergy.Excludesnonmarketedbiomass.GlobalEnergyOutlook2023:SowingtheSeedsofanEnergyTransition5Negativeemissionstechnologies(NETs)—suchasdirectaircapture—andcarboncaptureandstorage(CCS)playalargeroleineveryAmbitiousClimatescenarioexaminedhere.Aslongasfossilfueluseandgreenhousegasemissionsremainhigh,achievinginternationaltargetsof1.5°Cor2°Cby2100willbecomeevermorereliantonlarge-scaleNETs,CCS,andperhapsevenmorecontroversialtechnologiessuchassolargeoengineering.17Overroughlythepast30years,energy-relatedCO2emissionsgrewbyalmosttwo-thirds.By2050,lessthan30yearsfromtoday,projectionsrangefromfurtheremissionsgrowthof10percenttoemissionsreductionsofgreaterthan100percent,asinEquinor’sBridges,whichenvisionsnet-negativeglobalCO2emissionsbymidcentury.CCSplaysasubstantialroleinmanyscenarios,includingsomewithrelativelymodestclimatepolicyassumptions.By2050,CCSisprojectedtocaptureatleast1gigatonneofCO2peryearinReferenceScenariosfromEquinorandExxonMobil,EvolvingPoliciesscenariosfromIEAandbp,andallAmbitiousClimatescenarios.ThelargestvolumesofCCSareseeninthefour1.5°Cscenarios,whereannualcaptureratesexceed5gigatonnes(includingNETsandCCSthatavoidemissions)—morethanallenergy-relatedCO2emissionsfromtheUnitedStatesin2021.ChallengesassociatedwiththisscaleofCCSdeploymentincludecosts,socialacceptanceofassociatedinfrastructure,andprotocolsformonitoring,reporting,andverificationtoensurethatcapturedcarbonremainssafelystoredforcenturiestocome.18Figure3.GlobalEnergy-RelatedCO2EmissionsNotes:NegativeemissionsincludedirectaircaptureandbiomassenergywithCCS.Weexcludenegativeemissionsfromland-usechangeand“nature-basedsolutions”(e.g.,afforestation).ResourcesfortheFuture6Thefutureofglobalenergydemandvariesconsiderablydependingonassumptionsabouttechnologicalinnovation,energyefficiency,andgovernmentpolicy.UnderseveralReferenceandEvolvingPoliciesscenarios,globalenergydemandrisestonearly700QBtubymidcentury.Butunderotherscenarios,particularlythosethatachievenet-zeroemissionsby2050,globalenergydemanddeclinesconsiderablyasglobaldemandforenergyservicesismetmuchmoreefficiently.Allscenariosenvisionlowercoalconsumptionin2050than2021,butliquidsconsumptionishigherunderfourofthe14scenariosconsideredhere.Naturalgasdemandishigherin2050undereightscenarios.Asinpreviousyears,windandsolargrowatdramaticratesunderallscenarios,buttherangeisquitewide.By2050,windandsolaraccountfor10percent(ExxonMobil)toroughly50percent(EquinorBridges)ofglobalprimaryenergydemand.Recentannouncementsrelatedtonuclearfusiontechnologyhavegeneratedexcitementacrosstheenergyworld,19butnooutlooksexaminedherespecificallyconsideritspotentialduringtheprojectionperiod.Comparedwith5percentin2021,nuclear’ssharein2050rangesfrom5percent(IEEJReference)to14percent(BNEFandBPNetZero).Underthreeofthefournet-zeroscenarios,energyconsumptionfromnuclearmorethandoublesby2050,driveninsomecasesbytheproductionofhydrogenforendusesinothersectors.Figure4.WorldPrimaryEnergyMixin2021andProjectionsfor2050Notes:Orderedfromhighesttolowestlevelsoffossilfuelconsumptionin2050.“Liquids”excludesbiofuelsforBNEF.“Other”includeshydroforBNEF,andwindandsolarforEquinor,IEEJ,andOPEC.GlobalEnergyOutlook2023:SowingtheSeedsofanEnergyTransition7Globalelectricitydemandisprojectedtogrowbetween62and185percentby2050comparedwith2021levels.Theshareoffossilfuelsintheelectricitymixdeclinesfrom59percentin2021to2–55percentby2050,butinsomeReferencescenarios,theaggregateleveloffossilfuelsusedforpowergenerationgrows.UndermostAmbitiousClimatescenarios,windandsolartogethergeneratemoreelectricityin2050thanallsourcescombinedin2021.Intwoscenarios(BNEFNZE,IEANZE),windorsolaraloneproducesmoreelectricitythanallsourcesgloballyin2021.UnderallscenariosotherthanIEEJReference,electricityfromcoal,today’slargestgenerationsource,declinesconsiderablyby2050,whilenaturalgasconsumptionfallsinjustoverhalfofthescenarios.UndermostAmbitiousClimatescenarios,useofcoalandnaturalgascontinuesinthepowersectorthroughmidcenturybutispairedwithCCStoreduceemissions.Insomeoutlooks,hydrogenbeginstoplayasubstantialroleinthepowersectorbymidcentury,exceeding1,000TWhofglobalgenerationby2050infourscenarios(BPNetZero,EquinorBridges,IEEJAdvancedTechnology,andIEANZE).However,mostscenariosthatenvisionamajorroleforhydrogeninthefutureenergysystemprojectitsplayingamoresubstantialroleforotherapplications,particularlyindustrialheatandlong-distancetransportation.Figure5.WorldElectricityMixNotes:2050scenariosarrangedindecliningorderoffossilfuelelectricitygeneration.“Other”includesoil,geothermal,andmarine.ForBNEFitalsoincludeshydro.ResourcesfortheFuture8Russia’sinvasionofUkrainehasreinforcedEurope’seffortstoreducefossilfuelconsumptionandassociatedCO2emissions.IntheUnitedStates,thepassageoftheInflationReductionActisalsoexpectedtoshifttheenergysystemawayfromfossilfuelsandtowardcleanersources.TheeffectsoftheseshiftsinEuropeandtheUnitedStatescanbeseenbycomparingnaturalgasdemandinlastyear’sprojections(2022forBP20and2021forIEA21)withthemostrecentoutlooks.What’smore,projectionsfornaturalgasdemandintherestoftheworldareconsiderablylowerthanintheequivalentscenariosfromlastyear.Howdotheseprojectionscomparewiththosefromadecadeago?ConsiderIEA’s2012NewPoliciesScenario(NPS,roughlyequivalenttotoday’sSTEPS),whichprojectedthatglobalnaturalgasdemandin2020wouldbe130QBtu.In2021,globaldemandexceededthisprojectionbyroughly6percent,reflectingagrowingmarketforgloballiquefiednaturalgasandabundantlow-costsuppliesofshalegasintheUnitedStates,amongotherthings.The2012IEANPSprojectedglobalnaturalgasdemandof152QBtuin2030.Thisyear’sprojections,however,envisionmuchslowerorevendeclininggrowth,reaching143QbtuunderIEASTEPSandfallingto126QbtuundertheIEAAPSby2030.Althoughtheyarewellbelowprojectionsfromadecadeago,thecurrentEvolvingPoliciesscenariosenvisionsubstantiallyhighernaturalgasdemandthanthelevelsassociatedwithachievinginternationalclimategoals.Forexample,globalnaturalgasdemandin2050inReferenceandEvolvingPoliciesscenariosrangesfrom142to191QBtu,aboutthreetimesthelevelenvisionedinAmbitiousClimatescenarios,whichfallbetween38and65QBtuby2050.Figure6.PreviousandCurrentProjectedNaturalGasDemandfromBPandIEANote:HistoricaldatafromBP.22GlobalEnergyOutlook2023:SowingtheSeedsofanEnergyTransition9Globaldemandforcoalhasalsobeenreviseddownwardthisyear.However,near-andmedium-termconcernsovernaturalgassupplieshaveresultedinanupwardrevisionforEuropeintheIEA’sSTEPSandlittlechangeinBP’sNewMomentumscenario.ThetransitionawayfromcoalisparticularlysharpintheUnitedStates,where2030demandunderthisyear’sIEASTEPSisprojectedtoberoughlyhalfthelevelprojectedjustlastyear.OutsideEuropeandtheUnitedStates,projectionsoffuturecoaldemandhavealsobeenreviseddownwardinIEASTEPSandBPNewMomentum.Althoughglobalcoaldemandwasprojectedtobegindecliningby2030orbeforeunderlastyear’sscenarios,thatdeclineoccursmorequicklyinthisyear’sprojections.Expectationsforfuturecoaldemandhavechangedevenmoresignificantlyduringthepastdecade.In2012,theIEANPSprojectedglobalcoaldemandof162QBtuin2020,whichisroughly7percenthigherthantheactualamountconsumedin2021(2020demandwasevenlower,butthiswaslargelyduetotheeffectsoftheCOVID-19pandemic).By2030,the2012IEANPSprojectedglobalcoaldemandrisingto166QBtu.However,noscenarioexaminedherereachesthislevelby2030.Thehighestprojectionforglobalcoaldemandin2030comesfromIEEJ’sReferencescenario,whichreaches156QBtuinthatyear.Nonetheless,theprojectedcoaldemandinReferenceandEvolvingPoliciesscenariosvastlyexceedsthelevelsneededtolimitglobalwarmingto1.5°Cor2°Cby2100.In2050,mostAmbitiousClimatescenariosprojectglobalcoaldemandbetween15and17QBtu,comparedwitharangefrom77to156QBtuunderReferenceandEvolvingPoliciesscenarios.Figure7.PreviousandCurrentProjectedCoalDemandfromBPandIEANote:HistoricaldatafromBP.22ResourcesfortheFuture10Undermostscenarios,globaloildemandisconsiderablylowerby2050thanitistoday.UnderReferencescenariosfromExxonMobil,IEEJ,andOPEC,oilconsumptionplateausinthe2030sandremainsatorabove100mb/dthrough2050,alevelthatisincompatiblewithachievinginternationalclimatetargets.EvolvingPoliciesscenariosillustrateafairlywiderangeoffutureconsumption,butscenariosthatlimitglobaltemperatureriseto1.5°Cby2100projectthatoildemandfallstoroughly20to25mb/dbymidcentury.Futureoildemandvariesconsiderablyacrossregionsandscenarios.Forexample,allthreeofBP’sandIEA’sscenariosprojectdemandintheAsia-Pacificregiontopeakby2030andthendecline,whereasReferencescenariosfromExxonMobilandIEEJprojectregionaldemandgrowththrough2050.InChina,demandpeaksby2030underallscenariosotherthanOPEC’sReferencecase(ExxonMobildoesnotpublishChina-specificprojections).InIndia,demandgrowsunderallReferenceandEvolvingPoliciesscenariosbutbeginsdeclininginthe2030sor2040sunderAmbitiousClimatescenarios.InNorthAmerica,oildemandpeaksin2025to2030andfallsunderallscenarios.However,therateofdeclinevariesdramaticallybetweenscenarios.By2050,NorthAmericanoildemandrangesfromhighsaround16mb/dunderExxonMobil’sReferenceandIEASTEPStolowsofjust3mb/dunderAmbitiousClimatescenarios.InLatinAmerica,demandremainsrelativelyflatthrough2050underReferenceandEvolvingPoliciesscenariosbutfallsbymorethanhalfundermostAmbitiousClimatescenarios.Figure8.WorldOilDemandNote:Whereoutlooksdonotprovideprojectionsinphysicalunits(mb/d),weconverttomb/dusingafactorof1.832QBtupermb/d.GlobalEnergyOutlook2023:SowingtheSeedsofanEnergyTransition11EnergydemandinChinahasspikedoverrecentdecades,roughlytriplingsince2000.However,China’spopulationisexpectedtobegindecliningintheyearsahead,reducingtheprojectedrateofeconomicgrowth.Asaresult,primaryenergydemandinChinaislowerbymidcenturyundermostscenariosexaminedhere,particularlytheAmbitiousClimatescenarios.Thisisamarkedchangefromlastyear,whenmorethanhalfofscenariosprojectedconsiderablegrowthindemandbymidcentury.23By2050,coaldemandinChinaisprojectedtobewellbelow2021levels,fallingby28percent(IEEJReference)to93percent(BPNetZero).China’soildemandalsodeclinesconsiderablyinallscenariosexceptOPECReference.UnderIEASTEPSandAPS,oildemandby2050fallsby8and48percent,respectively,highlightingthegapbetweenChina’scurrentandexpectedgovernmentpolicesandannouncedclimategoals.UnderAmbitiousClimatescenarios,China’soildemanddeclinesbyroughly60to80percent.NaturalgasalsodeclinesconsiderablyunderAmbitiousClimatescenariosbutgrowsundermostotherscenarios.NuclearinChinagrowsdramaticallyunderallscenarios.In2021,nuclearaccountedforroughly3percentofChina’sprimaryenergymix.By2050,theabsolutelevelofnuclearpowermorethantriplesundermostscenariosandaccountsforroughly10percentofthemixunderEvolvingPoliciesscenarios,suchasIEASTEPS.Nuclear’sshareisevenhigherunderAmbitiousClimatescenarios,contributing13to22percentofChina’sprimaryenergyby2050.WindandsolaraccountforthebulkofrenewablesgrowthinChina,withmoremodestgrowthfromhydropower.Comparedwith3percentin2021,windandsolarareprojectedtocontribute15percentormoreofChina’sprimaryenergyby2050inscenariosthatreportthesedata.Figure9.PrimaryEnergyDemandinChinaNotes:Region-specificdatanotavailableforBNEF,ExxonMobil,orIEANZE.Projectionsorderedfromhighesttolowestlevelsoffossilfueldemand.ResourcesfortheFuture12In2023,IndiaisexpectedtosurpassChinatobecometheworld’smostpopulousnation.24Asitcontinuestogrowandmodernize,India’senergydemandisprojectedtogrowunderallscenariosexaminedhere.Thecompositionofthatgrowth,however,varieswidelyacrossscenarios.UnderReferenceandEvolvingPoliciesscenarios,India’sdemandforallfossilfuelsgrowsthrough2050,butunderAmbitiousClimatescenarios,itmostlydeclines.In2021,India’senergymixwasdominatedbycoal(46percent),oil(23percent),andbiomass(22percent).By2050,India’scoaldemandgrowsunderhalfofthescenariosexaminedhere,rangingfrommorethandoubling(IEEJReference)tofallingby80percent(EquinorBridges).Oildemandincreasesunderallbutthreescenarios,oneofwhichistheIEAAPS,whichindicatestheambitionofIndia’sannounced(butnotyetimplemented)effortstoreduceemissions.India’suseofbiomassenergy,whichhasbeendominatedbytraditionalbiomass(i.e.,locallygatheredandcombustedmaterialssuchaswoodanddung),staysatafairlyconsistentlevel,around8to10QBtuundermostscenarios.However,thisconsistencymasksconsiderablechangesastraditionalbiomassisdisplacedbymodernbioenergy(e.g.,woodpellets,biofuels)incertainsectorsoftheeconomy.Nuclear,wind,andsolargrowdramaticallyinIndiaunderallscenarios.Thesethreesourcescombinedaccountedforjust3percentofIndia’sprimaryenergymixin2021.By2050,theygrowto15percentormoreundermostscenarios,reachingashighas50to60percentofIndia’senergymixunderAmbitiousClimatescenariosfromBPandEquinor.Figure10.PrimaryEnergyDemandinIndiaNotes:Region-specificdatanotavailableforBNEF,ExxonMobil,orIEANZE.Projectionsorderedfromhighesttolowestlevelsoffossilfuelconsumption.GlobalEnergyOutlook2023:SowingtheSeedsofanEnergyTransition133.InFocus3.1.WhitherPeakOilandGasDemand?Anenergytransitionthataddressesclimatechangemustinvolveshiftingenergydemandawayfromoilandgas,butprospectsfortherepeatedlypredictedtimeof“peakoil”haveremainedelusive.BothIEA’sandBP’sscenarioshavelongfeaturedsteadilyincreasingconsumptionofbothoilandgas,exceptintheirmostaggressivedecarbonizationscenarios.However,thoseorganizations’recentlyreleasedscenarioshavebeguntobreakfromthatpattern,indicatingshiftingviewsamonganalystsandinstitutions.Importantly,theseupdatedscenariosincorporatemajorchangestoenergymarketsthatoccurredin2022,includingRussia’sinvasionofUkraineandthepassageoftheInflationReductionActintheUnitedStates.Figure11showsbothIEA’sandBP’sscenariosforoilandgasdemandovertime.Inanotablechangefrompastscenarios,nowforthefirsttime,toourknowledge,allofBP’sscenariosfeatureloweroildemandin2025thanin2019(seetopleftpanel),suggestingthatglobaloildemandmayalreadybepeaking.Bycontrast,asrecentlyaslastyear,BP’shighest-fossilcase(NewMomentum)hadoildemandpeakingin2030.Meanwhile,IEASTEPScontinuestoforeseerisingandelevatedlevelsofoildemandgrowththrough2040(bottomleftpanel),althoughtheNZEscenariofeaturesmoreaggressivedeclinesinoildemandby2030thananyofBP’sscenarios.Onnaturalgas,IEA’sandBP’slong-termprospectsaremorecloselyaligned,withgrowthanddeclineingasdemandpossiblethrough2050,dependingonthescenario.OfBP’sscenarios,onlyintheNetZerocasehavewealreadypassed“peakgas.”AsforIEA,its2022STEPSfeaturesroughlyflatgasdemandthrough2050,breakingfromits2021projection,whichfeaturedmodestbutpersistentgrowthinthecomingdecades.ResourcesfortheFuture14Whenpeakoildemandorpeakgasdemanddoesoccur,whatregionsmightweexpecttoplaythelargestrolesinthispartofglobaldecarbonization?Figure12tellsthisstorybyplottingBP’sscenariosofoilandgasconsumptionacrosssixregionsthatconstituteglobaldemand.OildemandbroadlydeclinesinNorthAmericaandEurope-EurasiabutrisessomewhatinAsia-Pacificbeforepeakingtowardtheendofthisdecade,thendecliningsharply.NaturalgasconsumptionalsodeclinesbroadlyinNorthAmericaandEurope-Eurasia,butthealternativescenariosenvisionverydifferentpathwaysofnaturalgasdemandinAsia,theprimarydriverofuncertaintyinlong-termglobalgasdemandandthepossibilityofpeakgas.Acrossthelow,medium,andhighfossilscenarios,Asia-Pacificgasdemandeitherpeaksin2030or2035orcontinuestorisethrough2050.Theserangesdemonstratelargeuncertaintiesinthetimingofpeakoilandpeakgas.Nonetheless,revisionsinthisyear’sscenariosfromBPandIEAhighlightthepotentialforanaccelerationoftheenergytransition.Figure11.GlobalOilandNaturalGasDemand,CurrentandPreviousOutlooksfromBP(top)andIEA(bottom)GlobalEnergyOutlook2023:SowingtheSeedsofanEnergyTransition15Figure12.BPPathwaysofOil(top)andGas(bottom)Demand,byRegionResourcesfortheFuture163.2.AssessingRegionalGrowthTrendsforWindandSolarInrecentyears,growthinrenewableenergy—especiallywindandsolar—hasachievedsignificantmomentum.InAmbitiousClimatescenarios,renewablegenerationsourcesareenablingtheshiftawayfromfossilfuels.However,thepaceofgrowthvarieswidelyacrossscenarios.Inthemostconservativescenario(IEEJReference),windandsolarpowergenerationisexpectedtotripleby2050,butinthemostambitiousscenario(BNEFNZS),itisexpectedtogrowbyafactorof21(Figure13).Severalfactorshavecontributedtotheserenewables’acceleratinggrowth,includingpolicysupportincriticalregionsandanoveralldeclineincapitalcostsforequipment.However,projectedgrowthisnotevenlydistributedacrossregions,especiallyinthenearterm.Onlyafewregionsareexpectedtocontributemostofthegrowthinwindandsolargenerationthrough2030.EnergysecurityconcernsduetoRussia’sinvasionofUkrainehavespurredEuropeancountriestoacceleratetheirshiftawayfromimportedfossilfuels,particularlynaturalgas,andtowardrenewables.InMay2022,theEuropeanCommissionpresentedtheREPowerEUplan,whichaimtoincreasetheshareofrenewablesinprimaryenergyconsumptionfrom40to45percentby2030.25TheCommissionestimatesthattherenewableenergyshareofelectricitygenerationwillreach69percentby2030intheplan.IntheUnitedStates,theInflationReductionActhasprovidedsupportforrenewables.26Thebillextendsexistingtechnology-specificenergyinvestmentandproductiontaxcreditsthrough2024,atwhichpointthetaxcreditswillbecomeFigure13.HistoricalandProjectedWindandSolarGenerationthrough2050GlobalEnergyOutlook2023:SowingtheSeedsofanEnergyTransition17emissions-basedratherthantechnology-specific.Additionalmeasures,includingtheEnvironmentalProtectionAgency’s$27billionGreenhouseGasReductionFundandthe$40billioninloanauthorityprovidedtotheDepartmentofEnergy’sLoanProgramOffice,seektomobilizeprivatecapitalforcleanenergyprojects.China’srecent14thFive-YearPlanincludesupwardlyrevisedgoalsinrenewablepowergrowthandtargetsa50percentincreaseinrenewablepowergenerationfrom2020to2025.27Asuiteofpolicyincentives,availableland,andseveralplannedgigawatt-andutility-scalecleanenergybasesareexpectedtoboostChina’srenewableenergy.Allscenarios(exceptEquinorBridges)locatemostofthegrowthinwindandsolargenerationinChina,NorthAmerica,andtheEuropeanUnionoverthenextdecade(Figure14).Theseregionsareprojectedtoaccountfor62percent(EquinorWalls)to83percent(BPAccelerated)ofallsuchgrowth.However,theaggregatelevelofwindandsolardeploymentinChina,NorthAmerica,andtheEuropeanUniondiffersconsiderablybetweenmostReferenceandEvolvingPoliciesscenarios(EquinorWalls,BPNewMomentum,IEASTEPS,IEAAPS)andtheAmbitiousClimatescenarios(BPAcceleratedandBPNetZero).Thisgapsuggeststheneedforadditionalpolicysupportfordisplacingfossil-basedresourcesifclimatetargetsaretobemet,aswellaspoliciesaddressingissuessuchasregulatoryandpermittingchallenges,transmission,andprivatefinancingthatcanacceleratewindandsolardeployment.Figure14.GrowthinWindandSolarPowerGeneration,byRegion,2019–2030Notes:EquinorandBPdatainFigure14use2019asbaseyear.IEAdatauses2020asbaseyearbecauseofdataavailability.ResourcesfortheFuture18ThedividebetweenEvolvingPolicyandAmbitiousClimatescenariosbecomesmoreapparentinthelongterm,from2030to2050,especiallyoutsidetheUnitedStates,EuropeanUnion,andChina(Figure15).Acrossscenarios,therestoftheworldisexpectedtocontribute39to66percentofthegrowthinwindandsolargenerationfrom2030to2050.However,EvolvingPoliciesscenariosprojectthatgrowthintheseregionswillbelessthanhalfofthetotalgenerationnecessaryformeetingnet-zerogoals.Toremainontrackfornetzero,muchgreatercleanenergyinvestmentinemerginganddevelopingeconomiesisnecessary.AccordingtoIEA,theWorldBank,andtheWorldEconomicForum,investmentinemerginganddevelopingcountrieswillneedtoincreasesevenfold,fromlessthan$150billionin2020tomorethan$1trillionby2030.283.3.FuelsoftheFutureInafuturewherefossilfuelsplayasmallerroleintheprimaryenergymix,newenergysourceswillbeneededtofulfillessentialenergyservices.Thethreefuelsthatplaythelargestroleindecarbonizationacrossscenariosareelectricity,hydrogen,andbioenergy—particularlytheformsofthesesourcesthatinvolvelow,zero,orevennegativegreenhousegasemissions.Ofcourse,thesefuelsarealreadyavailable:electricityisusedthroughouttheeconomy,hydrogenforrefiningandinchemicalsproduction,andbioenergyforselectindustrial,electricityandheatgeneration,andtransportationapplications.Weexaminetheoutlookforeachenergysourceinthissection.Figure15.GrowthinWindandSolarPowerGeneration,byRegion,2030–2050GlobalEnergyOutlook2023:SowingtheSeedsofanEnergyTransition193.3.1.ElectricityElectricitygenerationisshowninFigure16,andelectricityconsumptionasafractionoftotalfinalconsumptionisshowninFigure17.Inmostcases,electricitygenerationishigherintheAmbitiousClimatescenarios.Thetwohighestlevelsofgeneration,byasignificantmargin,aretheBNEFandIEANetZeroscenarios.Thisisalsothecasefortheconsumptionfraction,whichexceeds50percentforIEANZEand45percentforBNEFNZS.Interestingly,generationisalsoquitehighintheIEAAPSscenario.Figure16.WorldElectricityGeneration,AllSourcesNote:ExxonMobilpresentselectricitygenerationdatainnetgeneration,whereasotheroutlooksprovidedataingrossgenerationterms(i.e.,beforeon-siteelectricityconsumption)ResourcesfortheFuture20Onewaytovisualizetherelationshipbetweenelectrificationanddecarbonizationistoplotelectricitygenerationalongsidecarbondioxideemissions.Figure18showsthevaluesfortheyear2050ineachscenario.Figure17.ShareofElectricityinWorldFinalEnergyConsumptionFigure18.WorldElectricityGenerationandNetCO2Emissionsin2050GlobalEnergyOutlook2023:SowingtheSeedsofanEnergyTransition21Here,weagainseethehighestlevelsofgenerationintheIEAandBPNetZeroscenarios.Althoughmostofthepointsreflectaroughlylinearrelationship,withgenerationincreasingasemissionsdecline,theEquinorBridgesscenariohasgenerationcomparabletoscenarioswithmuchhigheremissionswhileachievingnegativeoverallemissions.ThislikelyreflectsthefactthatEquinor’soutlookdoesnotincludeelectricityusedforhydrogenproductioninitsmeasureofelectricitygeneration.Inadditiontohighlevelsofelectricitygeneration,thesescenariosallhavesubstantialhydrogenproduction(asdoestheIEEJAdvancedTechnologiesscenario).AmongtheEvolvingPoliciesscenariosforwhichdataareavailable,thetwoscenarioswiththelargesthydrogenproductionhaveelectricityasahigherfractionofconsumption.Althoughisolatingtheunderlyingsourceofhydrogeninthesescenarios(e.g.,electrolysisversussteamreforming)withoutfurtherinvestigationisdifficult,itappearsthathydrogenproducedfromelectrolysisisleadingtoincreasedelectricityconsumptioninthesescenarios.iiThehydrogenproductionintheIEEJAdvancedTechnologiesscenariomayalsonotcauseaslargeanincreaseinelectricitygenerationbecausetheincreaseddemandfromhydrogenproductionisoffsetbyreductionsindemandduetoenergyefficiency.Weexplorehydrogenoutlooksfurtherinthenextsection.3.3.2.HydrogenHydrogenuse(inthescenariosthatincludeit)isshowninFigure19.ThethreescenarioswherehydrogenplaysthelargestrolesareBNEFandBPNetZero(both10percentoffinalenergyconsumptionin2050),andNetZero(IEANetZero(6percent).EvolvingPoliciesscenariossuchastheIEEJAdvancedTechnologiesandtheIEAAPSincludesomehydrogenconsumptionbutconsiderablylessthantheirtwoambitiousscenarios.ProjectionsfromBPgenerallyshowahighershareofhydrogeninfinalenergyconsumptionthanotherscenarios,butthisispartlytheresultofBP’shistoricaldata,whichshowshydrogenplayingalargerrolethanotherhistoricaldatasets.Thecauseoftheunderlyingdiscrepancyinhistoricaldataisunclear,andmayresultfromdifferentaccountingorreportingprotocolsacrossorganizations.iiBasedoninternalcommunication,weunderstandthatEquinor’soutlookdoesnotincludeelectricityusedforhydrogenproductioninitsmeasureofelectricitygeneration,whichmakesdirectcomparisonwithotherscenariosdifficult.ResourcesfortheFuture22Althoughmostoutlooksdonotreporthowthehydrogenisproduced,somedoprovidetheseprojections.In2019,BPreportsthat99.99percentofallhydrogenproductioncamefromfossilfuels,primarilysteammethanereforming.Initsoutlook,BPprojectsthattheshareoffossil-basedhydrogenproductiondecreasesto59,36,and28percentby2050underitsNewMomentum,Accelerated,andNetZeroscenarios,respectively.InitsNetZeroscenario,BPprojectsthatin2050,windandsolarprovidetwo-thirdsoftheenergytoproducehydrogen,primarilythroughwaterelectrolysis.UnderIEA’sSTEPS,68percentofthe24metrictonsoflow-emissionshydrogenproductioncomesfromwaterelectrolysisby2050,withtheremaindercomingfromfossilfuelswithCCUS.UndertheAPSandNZE,waterelectrolysisplaysamuchlargerrole,producingroughlythree-quartersofalllow-emissionshydrogenby2050.3.3.3.BiomassPrimaryenergyconsumptionfrombiomassisshowninFigure20,anditsshareofthetotalisshowninFigure21,includingbothtraditionalbiomass(e.g.,wood,dung,andagriculturalby-products)andmarketed,commercial-scalebiomass(e.g.,woodpellets)butexcludesbiofuels.Comparedwithhydrogenandelectricity,biomasshasverydifferentpatterns.Pleasenotethatwehavenotbeenabletocompletelyharmonizethesedata,sotheoveralllevelsandsharesofprimaryenergyarenotalignedacrosssources,asseeninthevarietyofstartingpointsforoutlooksinyears2025and2030.Eventakingintoaccountthecalibrationissue,theIEAscenariosshowthehighestabsolutelevelsofbiomassconsumption,regardlessofscenariotype.Figure19.ShareofHydrogeninWorldFinalEnergyConsumptionGlobalEnergyOutlook2023:SowingtheSeedsofanEnergyTransition23Figure20.WorldBiomassPrimaryEnergyConsumptionFigure21.ShareofBiomassinWorldPrimaryEnergyConsumptionResourcesfortheFuture24Unlikeelectricity,biomassdoesnotappeartohaveastrongrelationshipbetweenconsumptionandemissions(Figure22).Thislikelyreflectsassumptionsabouttheeconomicsandavailabilityofbiomass.Moreover,exceptfortheIEAscenarios,mostprojectionsshowalevelingofforevenadecreaseintheabsolutelevelofbiomassconsumption.Someofthisreflectsanoffsettingdeclineintraditionalbiomassasmoremodernformsofbiomass,suchaswoodpellets,becomemoreprevalent.4.DataandMethodsInthispaper,weexaminedprojectionsfromthefollowingpublications:•BNEF:NewEnergyOutlook2022•BP:EnergyOutlook2023•Equinor:EnergyPerspectives2022•ExxonMobil:2022OutlookforEnergy•IEA:WorldEnergyOutlook2022•IEEJ:EnergyOutlook2022•OPEC:WorldOilOutlook2022Theseoutlooksvaryacrossmanydimensions,includingdifferencesinmodelingtechniques,historicaldata,economicgrowthassumptions,andpolicyscenarios.Generally,scenarioscanbegroupedintothreecategories:(1)Reference,whichassumenomajorpolicychanges;(2)EvolvingPolicies,whichincorporatethemodelingteam’sexpectationsofpolicytrends;and(3)alternatives,whicharetypicallybasedoncertainpolicytargetsortechnologyassumptions.WefocusonAmbitiousClimatescenarios,amajorsubsetof(3).Table4summarizesthescenariosincludedinthisyear’sanalysis.Figure22.WorldBiomassEnergyConsumptionandNetCO2Emissionsin2050GlobalEnergyOutlook2023:SowingtheSeedsofanEnergyTransition25Table4.SourcesandScenariosSourceScenarioGrubler(2008)HistoricaldataIEA(2022)HistoricaldataBNF(2022)ETS:Baselineassessmentofhowtheenergysectormayevolve,basedprimarilyoncostprojections,withlimitednewpolicies.NZS:Achievesnet-zeroemissionsby2050withrapiddeploymentofexistingtechnologiesandemergenceofnewtechnologies,suchasCCSandcleanhydrogen.BP(2023)NewMomentum:Reflectscurrentpoliciesand“placesweight”onachievingrecentlyannouncedambitionsforemissionsreductions.Accelerated:Emissionsfall75percentbelow2019levelsby2050,consistentwithIntergovernmentalPanelonClimateChange(IPCC)scenarioslimitingwarmingto2°Cby2100.NetZero:Emissionsfall95percentbelow2019levelsby2050,consistentwithIPCCscenarioslimitingwarmingto1.5°Cby2100.Equinor(2023)Walls:Beginswithcurrentpoliciesandassumesthatfutureclimateandenergypoliciesslowlybecomemoreambitious.Bridges:Ascenariodesignedaroundlimitingwarmingto1.5°Cby2100ExxonMobil(2023)Reference:Beginswithcurrentmarket,technology,andpolicytrends.Theextenttowhichadditionalenergyandclimatepoliciesareincludedisunclear.IEA(2022)StatedPoliciesScenario(STEPS):Focusesonwhatgovernments“areactuallydoing,”includingexistingpoliciesandthoseunderdevelopment.Roughlyconsistentwith2.5°Cwarmingby2100.AnnouncedPledgesScenario(APS):Includesannouncedclimatecommitmentsbygovernmentsandnongovernmentalentities,includingnet-zeropledges,regardlessofimplementationstatus.Roughlyconsistentwith1.7°Cto1.8°Cwarmingby2100.NetZeroEmissionsby2050(NZE):Thisfollowsanupdatedroadmaptonet-zeroemissionsby2050,consistentwith1.5°Cwarmingby2100.AlsoachievesUNSustainableDevelopmentGoals,suchasuniversalenergyaccessby2030.IEEJ(2022)Reference:Useshistoricaltrendstoevaluatefuturechangesincurrentpoliciesandtechnologies.AdvancedTechnologies:Includes“maximumcarbondioxideemissionsreduction”measures,newtechnologydeployment,andadditionalenergysecurityefforts.OPEC(2022)Reference:Incorporatespoliciesthathavebeenenacted.Assumessomefuturepolicychanges,butdetailsarenotspecified.ResourcesfortheFuture26Variationsinunderlyingassumptionsaboutthefutureofpolicies,technologies,andmarketsproduceusefulvariationamongoutlooks,allowinganalyststoviewawiderangeofpotentialenergyfutures.However,outlooksalsohaveimportantmethodologicaldifferencesthatcancomplicatedirectcomparisonsandreducetheabilitytodrawinsights.Onemajordifferenceisthechoiceofreportingunits.Forprimaryenergy,outlooksuseQBtu,milliontonnesofoilequivalent(mtoe),orexajoules.Inthisreport,westandardizeallunitstoQBtu.Forfuel-specificdata,outlooksusemillionbarrelsperday(mbd)ormillionbarrelsofoilequivalentperday(mboed)forliquidfuels,billioncubicmeters(bcm)ortrillioncubicfeet(tcf)fornaturalgas,andmilliontonnesofcoal-equivalent(mtce)orshorttonsforcoal.Table5presentsthereportingunitsforeachoutlook,andTable6providesrelevantconversionfactors.Table5.UnitsofEnergyConsumption,byOutlookBNEFBPEquinorExxonMobilIEAIEEJOPECPrimaryenergyunitsPJEJmtoeqBtuEJmtoemboedFuel-orsector-specificunitsLiquidsNAmbdNAqBtumbdmtoembdOilPJmbdmbdqBtumbdmtoembdBiofuelsNAmbdmtoeqBtumboedmtoembdNaturalgasPJbcmbcmqBtubcmmtoemboedCoalNAEJmtoeqBtumtcemtoemboedElectricityTWhTWhTWhqBtuTWhTWhNANotes:Unitsareperyearunlessotherwisenoted.“NA”indicatesthatfuel-specificdataarenotavailableforagivensource.Table6.ConversionFactorsforMajorEnergyUnitsPrimaryenergyMultiplybyNaturalgasMultiplybyCoalMultiplybymtoetoQBtu0.0397bcmtobcfd0.0968mtcetoshortton1.102mboed1toQBtu1.976bcmtotcf0.0353mtcetomtoe0.7EJtoQBtu0.948Notes:Thereisnoagreed-uponfactorforboe.IEAreportsthattypicalfactorsrangefrom7.15to7.40boepertoe,andOPECusesaconversionfactorof7.33boepertoe.Wederive1.976QBtu/mboedbymultiplying49.8mtoe/mboed(=1toe/7.33boe365daysperyear)by0.03968QBtu/mtoe.GlobalEnergyOutlook2023:SowingtheSeedsofanEnergyTransition27Aseconddifferenceamongoutlooksisthatassumptionsabouttheenergycontentinagivenphysicalunitoffuelresultindifferentconversionfactorsfordatapresentedinenergyunits(e.g.,QBtu)andthosepresentedinphysicalunits(e.g.,mbdorbcm).Amongtheoutlooksweexamine,theseassumptionsvarybyupto10percent.Althoughconversionunitvariationsmayappearsmall,theyareamplifiedwhenappliedacrossthemassivescaleofglobalenergysystems,particularlyoverlongtimehorizons.Athirddifferenceresultsfromvaryingdecisionsaboutincludingnonmarketedbiomass,suchaslocallygatheredwoodanddung,inhistoricaldataandprojectionsforprimaryenergyconsumption.Inpreviousyears,BPandtheUSEnergyInformationAdministration(EIA)hadnotincludedthesesourcesintheirprojections.However,BP’sEnergyOutlook2023doesincludenonmarketedbiomass,allowingforenhancedcomparability(theEIApublishesitsInternationalEnergyOutlookeverytwoyearsanddidnotpublishitin2022).Yetanotherdifferencerelatestocomparingtheenergycontentoffossilandnonfossilfuels.Theprimaryenergycontentofoil,naturalgas,andcoalisrelativelywellunderstoodandsimilaracrossoutlooks.However,asubstantialportionofthatembodiedenergyiswastedasheatduringcombustion.Becausenonfossilfuels,suchashydroelectricity,wind,andsolar,donotgeneratesubstantialamountsofwasteheat,identifyingacomparablemetricforprimaryenergyisdifficult,andoutlookstakevariousapproaches.Otherdifferencesinoutlooksinclude(1)differentcategorizationsforliquidsfuelsandrenewableenergy,(2)differentregionalgroupingsforaggregateddataandprojections,(3)useofnetversusgrosscalorificvaluesforreportingtheenergycontentoffossilfuels,(4)useofnetversusgrossgenerationforreportingelectricitydata,and(5)whetherandhowtoincludeflarednaturalgasinenergyconsumptiondata.Toaddressthosechallengesandallowforamoreaccuratecomparisonacrossoutlooks,NewellandIler29applyaharmonizationprocess.Weupdateanduseithere.Fordetails,seeRaimiandNewell.30ResourcesfortheFuture285.StatisticsTable7.GlobalIndicatorsPopulationEnergyGDPNetCO2GDP/capitaEnergy/GDPEnergy/CapitaNetCO2/energy$inPPPtermsMillionsqBtu$T,2020BMT$1,000/person1,000Btu/$1,000Btu/personMMT/qBtu19905,279350532210.06.666.364.020207,7495601383217.94.072.357.020217,8355901453418.54.175.457.02050BPNewMomentum9,7355953022531.02.061.242.3BPAccelerated9,735465302731.01.547.715.8BPNetZero9,735417302131.01.442.82.8IEASTEPS9,6926993362934.72.172.141.4IEAAPS9,6925953311134.21.861.419.1IEANZE9,692504333134.31.552.01.0OPEC(2045)9,4576942953431.22.473.349.0$inMERterms20207,749560913211.76.272.357.02050BNEFETS9,6285962102521.82.861.941.3BNEFNZS9,628529210021.82.554.90.1EquinorBridges9,730430186(1)19.22.344.2(1.9)EquinorWalls9,7306021852219.03.361.937.0ExxonMobil9,7006582212522.83.067.838.2IEEJAdvancedTech9,5975702101721.92.759.429.7IEEJReference9,5977002103721.93.373.052.9Notes:HistoricaldatafromIEA.NetCO2emissionsincludepositive(gross)andnegativeemissionsfromsourcessuchasdirectaircaptureandbioenergywithCCS.CO2emissionsdataincludefossilfuelcombustionandexcludeindustrialprocessemissions.GlobalEnergyOutlook2023:SowingtheSeedsofanEnergyTransition29Table8.WorldPrimaryEnergyConsumptionqBtuTotalCoalLiquidsNaturalgasNuclearHydroOtherrenewables196015156421703341990350881316621738202056014916713228157020215901571781392915742050BNEFETS5969714214534NA178BNEFNZS52955416576NA292BPNewMomentum595911391583519154BPAccelerated4652283834824203BPNetZero4171647575826214EquinorBridges4301548394519265EquinorWalls602771541444319164ExxonMobil658882001784419128IEASteps6991061961424423187IEAAPS59545121875326264IEANZE5041549386028314IEEJAdvancedTech570761251495522144IEEJReference7001462091913421140GlobalEnergyOutlook2023:SowingtheSeedsofanEnergyTransition30Table9.LiquidsConsumption,byRegionWorldAvg.annualgrowthWestAvg.annualgrowthEastAvg.annualgrowthmbdmbdCAAGRmbdmbdCAAGRmbdmbdCAAGR196023ndnd1990721.63.9%50212020910.70.8%41-0.3-0.7%420.72.3%2021970.81.0%43-0.2-0.5%450.82.4%20502020–20502020–20502020–2050BNEFETS78-0.5-0.5%——————BNEFNZS23-2.3-4.6%——————BPNewMomentum76-0.5-0.6%28-0.4-1.3%450.10.2%BPAccelerated46-1.5-2.3%14-0.9-3.4%27-0.5-1.5%BPNetZero26-2.2-4.1%7-1.1-5.9%14-1.0-3.7%EquinorBridges27-2.2-4.0%——————EquinorWalls84-0.2-0.3%——————ExxonMobil1100.60.6%35-0.2-0.5%650.71.4%IEASTEPS1080.50.5%34-0.2-0.6%560.50.9%IEAAPS66-0.8-1.1%16-0.8-3.1%35-0.3-0.7%IEANZE27-2.2-4.0%—————IEEJAdvancedTech.68-0.8-1.0%—————IEEJReference1150.80.8%35-0.2-0.5%630.71.3%OPEC(2045)1120.70.7%——————Notes:“Liquids”includesonlyoilforBNEFandEquinor;biofuelsdatawerenotavailable.Regionaltotalsmaynotsumbecauseofdifferenttreatmentofinternationalaviationandbunkerfuelsand,forIEA,exclusionofbiofuelsinregionaldata.Wherevolumetricdataarenotpublished,weassumeaconversionfactorof1.832QBtupermbd,or0.54585mbdperQBtu.ResourcesfortheFuture31Table10.NaturalGasConsumption,byRegionWorldAvg.annualgrowthWestAvg.annualgrowthEastAvg.annualgrowthTCFTCFCAAGRTCFTCFCAAGRTCFTCFCAAGR196015ndnd1990611.54.7%52920201222.02.3%740.71.1%471.35.8%20211282.22.4%770.80.1%501.30.2%20502020–20502020–20502020–2050BNEFETS1340.40.3%——————BNEFNZS60-2.1-2.4%——————BPNewMomentum1450.80.6%66-0.3-0.4%791.11.7%BPAccelerated76-1.5-1.6%33-1.4-2.7%44-0.1-0.3%BPNetZero52-2.3-2.8%23-1.7-3.7%29-0.6-1.6%EquinorBridges36-2.9-4.0%——————EquinorWalls1330.40.3%——————ExxonMobil1651.41.0%730.00.0%911.51.7%IEASTEPS1310.30.2%61-0.4-0.6%690.7-0.3%IEAAPS80-1.4-1.4%34-1.3-2.5%45-0.1-1.6%IEANZE35-2.9-4.1%——————IEEJAdvancedTech.1380.50.4%——————IEEJReference1771.81.2%840.40.4%891.42.1%OPEC(2045)1561.10.8%——————Note:Wherevolumetricdataarenotavailable,weassumeaconversionfactorof0.923TCFperQBtu.GlobalEnergyOutlook2023:SowingtheSeedsofanEnergyTransition32Table11.CoalConsumption,byRegionWorldAvg.annualgrowthWestAvg.annualgrowthEastAvg.annualgrowthQBtuQBtuCAAGRQBtuQBtuCAAGRQBtuQBtuCAAGR196056ndnd1990881.11.5%523620201492.01.8%26-0.9-2.3%1232.94.2%20211572.21.9%28-0.8-1.9%1283.04.2%20502020–20502020–20502020–2050BNEFETS97-1.7-1.4%——————BNEFNZS55-3.1-3.3%——————BPNewMomentum91-1.9-1.6%9-0.6-3.4%82-1.4-1.3%BPAccelerated22-4.2-6.1%2-0.8-8.5%20-3.4-5.8%BPNetZero16-4.4-7.2%1-0.8-9.7%14-3.6-6.9%EquinorBridges15-4.5-7.4%——————EquinorWalls77-2.4-2.2%——————ExxonMobil88-2.0-1.7%6-0.7-4.9%82-1.4-1.3%IEASTEPS106-1.4-1.1%12-0.5-2.6%94-0.9-0.9%IEAAPS45-3.5-3.9%7-0.6-4.4%38-2.8-3.8%IEANZE15-4.5-7.4%——————IEEJAdvancedTech.76-2.4-2.2%——————IEEJReference146-0.1-0.1%15-0.4-1.9%1320.30.2%OPEC(2045)115-1.1-0.9%——————ResourcesfortheFuture33Table12.NuclearConsumption,byRegionWorldAvg.annualgrowthWestAvg.annualgrowthEastAvg.annualgrowthQBtuQBtuCAAGRQBtuQBtuCAAGRQBtuQBtuCAAGR19600001990210.7180.630.12020280.20.9%210.10.5%70.12.8%2021290.21.0%210.10.5%80.13.0%20502020–20502020–20502020–2050BNEFETS340.20.7%——————BNEFNZS761.63.4%——————BPNewMomentum350.20.8%13-0.3-1.6%220.53.9%BPAccelerated480.71.9%17-0.1-0.6%310.85.2%BPNetZero581.02.5%210.00.1%361.05.7%EquinorBridges450.61.6%——————EquinorWalls430.51.5%——————ExxonMobil440.520200.0-0.2%240.64.3%IEASTEPS440.521210.00.0%230.54.1%IEAAPS530.824240.10.4%290.74.9%IEANZE601.12.6%——————IEEJAdvancedTech.550.92.3%——————IEEJReference340.20.7%18-0.1-0.4%160.32.9%OPEC(2045)460.60.7%——————GlobalEnergyOutlook2023:SowingtheSeedsofanEnergyTransition34Table13.ElectricityGeneration,byRegionCoalNaturalgasHydroNuclearOtherrenewablesOilTotal19904,4031,7522,1422,0131721,24211,86420209,4396,3334,3432,6733,25666426,708202110,2026,5514,3272,7763,79668228,3342050BNEFETS4,3343,514nd3,16335,3399746,447BNEFNZS2,8452,799nd7,33567,789080,769BPNewMomentum6,6839,2566,0003,55024,30022750,015BPAccelerated5073,3817,5744,95040,577156,990BPNetZero4532,5338,0635,87344,486161,410EquinorBridges7621,3175,4334,24038,7503950,542EquinorWalls4,9527,6255,7004,09422,49727345,143ExxonMobil6,76711,1495,7134,33820,57524148,784IEASTEPS5,9526,7306,8094,26025,78131249,845IEAAPS2,5943,9027,5435,10341,95217561,268IEANZE8275728,2515,81057,768373,231IEEJAdvancedTech.4,2549,5426,4645,30025,03720350,800IEEJReference11,43413,6586,0103,31410,87149045,777Notes:HistoricaldatafromIEA.OPECdoesnotpublishelectricitydata.BNEFgroupshydrowithotherrenewables.Equinorexcludeselectricitygenerationusedinelectrolysistoproducehydrogen.ResourcesfortheFuture35Table14.GlobalRenewableElectricityGeneration,bySourceHydroBiomass/biogas/wasteWindSolarGeothermalOtherTotal19902,1421313.90.13602,31320204,3437091,59684694117,59820214,3277461,8701,01897648,1232050BNEFETSnd33216,69413,530nd4,78435,339BNEFNZSnd28639,05822,546nd5,89967,789BPNewMomentum6,0001,05411,34911,6781665230,300BPAccelerated7,5741,56821,12217,20940427348,151BPNetZero8,0631,24423,37618,42749794352,550EquinorBridges5,4331,38315,90017,026nd4,44244,183EquinorWalls5,7001,1929,15211,162nd99128,197ExxonMobil5,713nd8,30710,614nd1,65526,288IEASTEPS6,8091,95110,69112,44745823432,590IEAAPS7,5433,17917,41619,92768674349,495IEANZE8,2513,28023,48628,5068571,63866,019IEEJAdvancedTech.6,464nd10,2909,8464824,41931,501IEEJReference6,010nd4,7173,9043191,93116,881Notes:OPECdoesnotpresentelectricitygenerationdata.BNEFincludeshydroandgeothermalin“other.”Equinorincludesgeothermalin“other.”ExxonMobilincludesbiomassandgeothermalin“other.”IEEJincludesbiomassin“other.”GlobalEnergyOutlook2023:SowingtheSeedsofanEnergyTransition36Table15.NetCarbonDioxideEmissions,byRegionWorldAvg.annualgrowthWestAvg.annualgrowthEastAvg.annualgrowthMMTMMTCAAGRMMTMMTCAAGRMMTMMTCAAGR199022.4——13.9——6.0——202031.90.31.2%10.0-0.1-1.1%23.20.64.6%202133.70.41.3%ndndndndndnd20502020–20502020–20502020–2050BNEFETS24.6-0.2-0.9%——————BNEFNZS0.1-1.1-18%——————BPNewMomentum25.2-0.2-1%——————BPAccelerated7.4-0.8-5%——————BPNetZero1.2-1.0-10.4%——————EquinorBridges-0.8-1.1NA——————EquinorWalls22.3-0.3-1.2%—————ExxonMobil25.1-0.2-0.8%7.6-0.1-1%17.6-0.2-0.9%IEASTEPS28.9-0.1-0.3%—————IEAAPS11.3-0.7-3%——————IEANZE0.5-1.0-12.9%——————IEEJAdvancedTech.16.9-0.5-2.1%——————IEEJReference37.00.20.5%10.20.00.1%24.70.00.2%OPEC(2045)34.00.10.2%——————Notes:HistoricaldatafromIEA.NetCO2emissionsincludepositive(gross)andnegativeemissionsfromsourcessuchasdirectaircaptureandbioenergywithCCS.CO2emissionsdataincludefossilfuelcombustionandexcludeindustrialprocessemissions.BPandIEAregionaldataareexcludedbecausetheyincludemethaneemissions(BP),flaring(BP),andindustrialprocessemissions(BPandIEA).ResourcesfortheFuture376.Endnotes1.A.Grubler,EnergyTransitions,inEncyclopediaofEarth(EnvironmentalInformationCoalition,NationalCouncilforScienceandtheEnvironment,2008).2.InternationalEnergyAgency,WorldEnergyBalancesDatabase(2022).3.BNEF,NewEnergyOutlook2022,https://about.bnef.com/new-energy-outlook/(2022).4.BP,EnergyOutlook2023,https://www.bp.com/en/global/corporate/energy-economics/energy-outlook.html(2023).5.Equinor,EnergyPerspectives2022:GlobalMacroeconomicandEnergyMarketOutlook,https://www.equinor.com/sustainability/energy-perspectives(2022).6.ExxonMobil,2022OutlookforEnergy,https://corporate.exxonmobil.com/energy-and-innovation/outlook-for-energy(2022).7.InternationalEnergyAgency,WorldEnergyOutlook2022,https://www.iea.org/reports/world-energy-outlook-2022(2022).8.InstituteofEnergyEconomics,Japan,IEEJOutlook2023:ChallengesforAchievingBothEnergySecurityandCarbonNeutrality,https://eneken.ieej.or.jp/en/whatsnew/442.html(2022).9.OPEC,WorldOilOutlook2022,https://woo.opec.org/(2022).10.InternationalEnergyAgency,IEAWorldEnergyStatisticsandBalances,https://www.oecd-ilibrary.org/energy/data/iea-world-energy-statistics-and-balances_enestats-data-en(2018).11.BNEF,EnergyTransitionInvestmentTrends2023,https://about.bnef.com/energy-transition-investment/(2023).12.P.Friedlingsteinetal.,GlobalCarbonBudget2022,EarthSystemScienceData14:4811–900(2022).13.ClimateActionTracker,2030EmissionsGap:CATProjectionsandResultingEmissionsGapinMeetingthe1.5°CParisAgreementGoal,https://climateactiontracker.org/global/cat-emissions-gaps/(2022).14.UNEnvironmentProgramme,EmissionsGapReport2022:TheClosingWindow:ClimateCrisisCallsforRapidTransformationofSocieties,https://www.unep.org/resources/emissions-gap-report-2022(2022).15.V.Srikrishnan,Y.Guan,R.S.J.Tol,andK.Keller,ProbabilisticProjectionsofBaselineTwenty-FirstCenturyCO2EmissionsUsingaSimpleCalibratedIntegratedAssessmentModel,ClimaticChange170:37(2022).16.IEA,CoalMarketUpdate:July2022,https://www.iea.org/reports/coal-market-update-july-2022(2022).17.J.E.Aldyetal.,SocialScienceResearchtoInformSolarGeoengineering,Science374:815–18(2021).18.S.M.Smithetal.,TheStateofCarbonDioxideRemoval,http://dx.doi.org/10.17605/OSF.IO/W3B4Z(2023)doi:10.17605/OSF.IO/W3B4Z.19.USDepartmentofEnergy,DOENationalLaboratoryMakesHistorybyAchievingGlobalEnergyOutlook2023:SowingtheSeedsofanEnergyTransition38FusionIgnition,https://www.energy.gov/articles/doe-national-laboratory-makes-history-achieving-fusion-ignition(2022).20.BP,EnergyOutlook2022,https://www.bp.com/en/global/corporate/energy-economics/energy-outlook.html(2022).21.InternationalEnergyAgency,WorldEnergyOutlook2021,https://www.iea.org/reports/world-energy-outlook-2021(2021).22.BP,StatisticalReviewofWorldEnergy2022,https://www.bp.com/en/global/corporate/energy-economics/statistical-review-of-world-energy.html(2022).23.D.Raimietal.,GlobalEnergyOutlook2022:TurningPointsandTensionintheEnergyTransition,https://www.rff.org/publications/reports/global-energy-outlook-2022/(2022).24.UnitedNationsDepartmentofEconomicandSocialAffairsPopulationDivision,WorldPopulationProspects2022,https://population.un.org/wpp/(2022).25.EuropeanCommission,REPowerEUPlan,https://energy.ec.europa.eu/communication-repowereu-plan-com2022230_en(2022).26.WhiteHouse,BuildingaCleanEnergyEconomy:AGuidebooktotheInflationReductionAct’sInvestmentsinCleanEnergyandClimateAction,cleanenergy.gov,https://www.whitehouse.gov/wp-content/uploads/2022/12/Inflation-Reduction-Act-Guidebook.pdf(2023).27.B.Han,China’sRenewables14thFive-YearPlan:OfficialTargetstoBeRemarkablyOutpaced?S&PGlobal,https://www.spglobal.com/commodityinsights/en/ci/research-analysis/chinas-renewables-14th-fiveyear-plan-official-targets.html(2022).28.IEA,WorldBank,andWorldEconomicForum,FinancingCleanEnergyTransitionsinEmergingandDevelopingEconomies,InternationalEnergyAgency(2021).29.R.G.NewellandS.Iler,TheGlobalEnergyOutlook,http://www.nber.org/papers/w18967(2013)doi:10.3386/w18967.30.D.RaimiandR.G.Newell,GlobalEnergyOutlookComparisonMethods:2023Update,www.rff.org/geo(2023).ResourcesfortheFuture39

1、当您付费下载文档后,您只拥有了使用权限,并不意味着购买了版权,文档只能用于自身使用,不得用于其他商业用途(如 [转卖]进行直接盈利或[编辑后售卖]进行间接盈利)。
2、本站所有内容均由合作方或网友上传,本站不对文档的完整性、权威性及其观点立场正确性做任何保证或承诺!文档内容仅供研究参考,付费前请自行鉴别。
3、如文档内容存在违规,或者侵犯商业秘密、侵犯著作权等,请点击“违规举报”。

碎片内容

碳中和
已认证
内容提供者

碳中和

确认删除?
回到顶部
微信客服
  • 管理员微信
QQ客服
  • QQ客服点击这里给我发消息
客服邮箱