H1 2021 Solar Industry UpdateVIP专享VIP免费

H1 2021
Solar Industry Update
David Feldman
Kevin Wu
Robert Margolis
June 22, 2021
NREL/PR-7A40-80427
NREL | 2NREL | 2
Global Solar Deployment
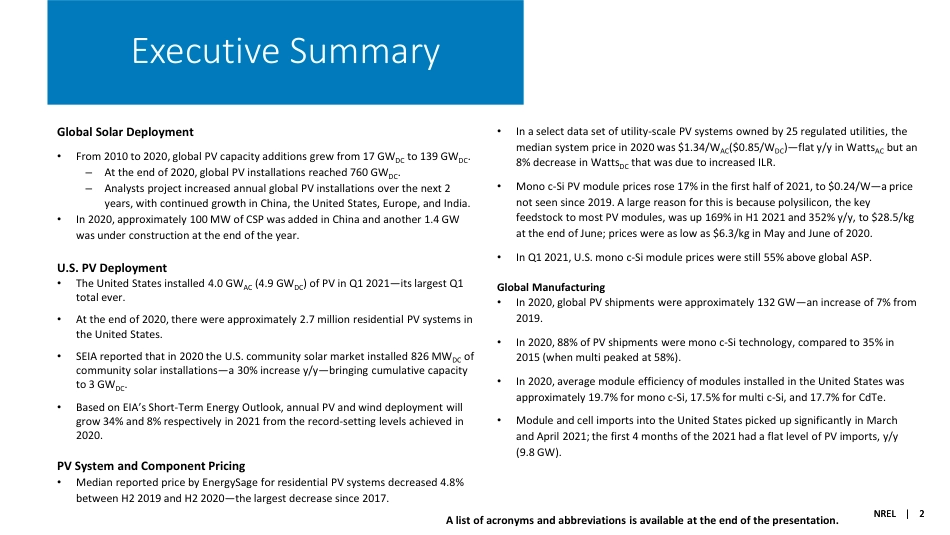
From 2010 to 2020, global PV capacity additions grew from 17 GWDC to 139 GWDC.
At the end of 2020, global PV installations reached 760 GWDC.
Analysts project increased annual global PV installations over the next 2
years, with continued growth in China, the United States, Europe, and India.
In 2020, approximately 100 MW of CSP was added in China and another 1.4 GW
was under construction at the end of the year.
U.S. PV Deployment
The United States installed 4.0 GWAC (4.9 GWDC) of PV in Q1 2021its largest Q1
total ever.
At the end of 2020, there were approximately 2.7 million residential PV systems in
the United States.
SEIA reported that in 2020 the U.S. community solar market installed 826 MWDC of
community solar installationsa 30% increase y/ybringing cumulative capacity
to 3 GWDC.
Based on EIA’s Short-Term Energy Outlook, annual PV and wind deployment will
grow 34% and 8% respectively in 2021 from the record-setting levels achieved in
2020.
PV System and Component Pricing
Median reported price by EnergySage for residential PV systems decreased 4.8%
between H2 2019 and H2 2020the largest decrease since 2017.
In a select data set of utility-scale PV systems owned by 25 regulated utilities, the
median system price in 2020 was $1.34/WAC($0.85/WDC)—flat y/y in WattsAC but an
8% decrease in WattsDC that was due to increased ILR.
Mono c-Si PV module prices rose 17% in the first half of 2021, to $0.24/Wa price
not seen since 2019. A large reason for this is because polysilicon, the key
feedstock to most PV modules, was up 169% in H1 2021 and 352% y/y, to $28.5/kg
at the end of June; prices were as low as $6.3/kg in May and June of 2020.
In Q1 2021, U.S. mono c-Si module prices were still 55% above global ASP.
Global Manufacturing
In 2020, global PV shipments were approximately 132 GWan increase of 7% from
2019.
In 2020, 88% of PV shipments were mono c-Si technology, compared to 35% in
2015 (when multi peaked at 58%).
In 2020, average module efficiency of modules installed in the United States was
approximately 19.7% for mono c-Si, 17.5% for multi c-Si, and 17.7% for CdTe.
Module and cell imports into the United States picked up significantly in March
and April 2021; the first 4 months of the 2021 had a flat level of PV imports, y/y
(9.8 GW).
Executive Summary
A list of acronyms and abbreviations is available at the end of the presentation.
NREL | 3
Global Solar Deployment1
U.S. PV Deployment
2
PV System Pricing
3
Global Manufacturing
4
Component Pricing
5
Market Activity
6
PV Price Increases
Agenda
H12021SolarIndustryUpdateDavidFeldmanKevinWuRobertMargolisJune22,2021NREL/PR-7A40-80427NREL2NREL2GlobalSolarDeployment•From2010to2020,globalPVcapacityadditionsgrewfrom17GWDCto139GWDC.–Attheendof2020,globalPVinstallationsreached760GWDC.–AnalystsprojectincreasedannualglobalPVinstallationsoverthenext2years,withcontinuedgrowthinChina,theUnitedStates,Europe,andIndia.•In2020,approximately100MWofCSPwasaddedinChinaandanother1.4GWwasunderconstructionattheendoftheyear.U.S.PVDeployment•TheUnitedStatesinstalled4.0GWAC(4.9GWDC)ofPVinQ12021—itslargestQ1totalever.•Attheendof2020,therewereapproximately2.7millionresidentialPVsystemsintheUnitedStates.•SEIAreportedthatin2020theU.S.communitysolarmarketinstalled826MWDCofcommunitysolarinstallations—a30%increasey/y—bringingcumulativecapacityto3GWDC.•BasedonEIA’sShort-TermEnergyOutlook,annualPVandwinddeploymentwillgrow34%and8%respectivelyin2021fromtherecord-settinglevelsachievedin2020.PVSystemandComponentPricing•MedianreportedpricebyEnergySageforresidentialPVsystemsdecreased4.8%betweenH22019andH22020—thelargestdecreasesince2017.•Inaselectdatasetofutility-scalePVsystemsownedby25regulatedutilities,themediansystempricein2020was$1.34/WAC($0.85/WDC)—flaty/yinWattsACbutan8%decreaseinWattsDCthatwasduetoincreasedILR.•Monoc-SiPVmodulepricesrose17%inthefirsthalfof2021,to$0.24/W—apricenotseensince2019.Alargereasonforthisisbecausepolysilicon,thekeyfeedstocktomostPVmodules,wasup169%inH12021and352%y/y,to$28.5/kgattheendofJune;priceswereaslowas$6.3/kginMayandJuneof2020.•InQ12021,U.S.monoc-Simodulepriceswerestill55%aboveglobalASP.GlobalManufacturing•In2020,globalPVshipmentswereapproximately132GW—anincreaseof7%from2019.•In2020,88%ofPVshipmentsweremonoc-Sitechnology,comparedto35%in2015(whenmultipeakedat58%).•In2020,averagemoduleefficiencyofmodulesinstalledintheUnitedStateswasapproximately19.7%formonoc-Si,17.5%formultic-Si,and17.7%forCdTe.•ModuleandcellimportsintotheUnitedStatespickedupsignificantlyinMarchandApril2021;thefirst4monthsofthe2021hadaflatlevelofPVimports,y/y(9.8GW).ExecutiveSummaryAlistofacronymsandabbreviationsisavailableattheendofthepresentation.NREL3GlobalSolarDeployment1U.S.PVDeployment2PVSystemPricing3GlobalManufacturing4ComponentPricing5MarketActivity6PVPriceIncreasesAgendaNREL4GlobalSolarDeployment1U.S.PVDeployment2PVSystemPricing3GlobalManufacturing4ComponentPricing5MarketActivity6PVPriceIncreases•From2010to2020,globalPVcapacityadditionsgrewfrom17GWDCto139GWDC.–Attheendof2020,globalPVinstallationsreached760GWDC.•Q12021PVinstallationsincreasedsignificantly,y/y,formanyleadingmarkets.–FromQ12020toQ12021,installsinChina,theUnitedStates,andGermanyincreased35%–45%,andinstallsinIndiaincreased89%.•AnalystsprojectincreasedannualglobalPVinstallationsoverthenext2years,withcontinuedgrowthinChina,theUnitedStates,Europe,andIndia.•In2020,approximately100MWofCSPwasaddedinChina.NREL5NREL5GlobalAnnualPVCapacityAdditionsbyCountry•From2010to2020,globalPVcapacityadditionsgrewfrom17GWDCto139GWDC.–TheCOVID-19pandemicdidnotsignificantlyimpactsolardeploymentin2020,withcountriesinstallingmoreinH2afterlockdownswerelifted.•Europeanmarketsledinthebeginningofthedecade,butPVgrowthtransitionedtoAsia.–Attheendof2020,57%ofcumulativePVinstallationswereinAsia,22%wereinEurope,and15%wereintheAmericas.–TheUnitedStatesisthecountrywiththesecond-largestcumulativeinstalledPVcapacity.•Brazil(3.1GWDC)andMexico(1.5GWDC)joinedtheUnitedStatesastheonlycountriesintheWesternHemispheretoinstallmorethan1GWofPVin2020.–ArecentsurgeofROWinstallationsindicatesthe“globalization”ofPV.Sources:IEA,SnapshotofGlobalPVMarkets:2021;PVPSSnapshot2020;TrendsinPhotovoltaicApplications2019.02040608010012014016020102011201220132014201520162017201820192020PVAnnualInstallations(GWDC)RestofWorldRestofEuropeGermanyUnitedStatesIndiaJapanChinaNREL6NREL6TopPVMarkets•Attheendof2020,globalPVinstallationsreached760GWDC,anannualincreaseof139GWDCfrom2019.•TheleadingfivemarketsincumulativePVinstallationsattheendof2020wereChina,theUnitedStates,Japan,Germany,andIndia.–Vietnam,withmorethan11GWofinstallationsin2020,bumpedIndiaoutofthetopfiveforannualdeployment.•China’sannualPVinstallationsgrew60%y/yin2020,representingmorethanone-thirdofannualglobaldeployment.•In2020,theUnitedStateswasthecountrywiththesecond-largestPVmarketintermsofbothcumulativeandannualinstallations.•20countriesinstalledmorethan1GWofPVin2020,and14countriesnowhavemorethan10GWofcumulativecapacity.2539371544722201616146291050100150200250300CumulativePVDeployment,2020(760GWDC)48.219.211.18.24.94.44.14.13.13.011.717.40102030405060AnnualPVDeployment,2020(139GWDC)Source:IEA,SnapshotofGlobalPVMarkets:2021.NREL7NREL7GlobalPVPenetration•TheUnitedStates,despitebeingaleadingPVmarket,isbelowthisaverageandotherleadingmarketsintermsofPVgenerationasapercentoftotalcountryelectricitygeneration,with3.4%.–IfCaliforniawereacountry,itsPVcontribution(22.7%)wouldbethehighest.•IEAestimatesthatin2020,3.7%ofglobalelectricitygenerationcamefromPV.0%2%4%6%8%10%12%14%HondurasAustraliaGermanyGreeceChileSpainNetherla…ItalyJapanIsraelBelgiumIndiaChinaEUTurkeySwitzerla…BulgariaDenmarkUKS.KoreaWorldCzechRep.PortugalUSAAustriaRomaniaMexicoThailandFranceMalaysiaSlovakiaS.AfricaMoroccoSwedenCanadaFinlandNorwayPercentageofAnnualElectricityGenerationSources:IEA,SnapshotofGlobalPVMarkets:2021;U.S.EnergyInformationAdministration(EIA),“ElectricityDataBrowser.”AccessedMarch10,2021.NREL8NREL80123456789102020202120202021202020212020202120202021AustraliaChinaGermanyIndiaU.S.Installations(GWDC)Q2-Q4Q1InternationalQ12021Installations•Q12021PVinstallationsincreasedsignificantly,y/y,formanyleadingmarkets.–FromQ12020toQ12021,installsinChina,theUnitedStates,andGermanyinstallsincreased35%–45%,andinstallsinIndiaincreased89%.–AnalystsattributedIndia’slargeincreasetodevelopersfinishingdelayed2020projects.•Despitethegrowthininstallations,itisnotnecessarilyindicativeof2021asawhole.–Asignificantportionofdeploymentoftencomestowardtheendoftheyear.–Significantsupplyconstraints,increasedcosts,andresurgentwavesofthepandemic(particularlyinIndia)mightsuppressinstallations.48GW19GWSources:AustralianPhotovoltaicInstitute.IEA,SnapshotofGlobalPVMarkets:2021.Mercom(05/03/2105/31/21).WoodMackenzie/SEIA:U.S.SolarMarketInsight:Q22021.NREL9NREL9AnnualGlobalPVDemandNotes:P=projection.Barrepresentsmedianprojection.Errorbarsrepresenthighandlowprojections.Notallsourceshavedataforallcategories.Sources:BNEF,“2Q2021GlobalPVMarketOutlook,”05/21/21;IEA,RenewableEnergyMarketUpdate:Outlookfor2021and2022.GoldmanSachsEquityResearch.AmericasCleanTechnology:Solar2021Outlook.01/04/21.IHSMarkitResearch(03/31/21).IEA,SnapshotofGlobalPVMarkets:2021.•AnalystsprojectincreasedannualglobalPVinstallationsoverthenext2years,withcontinuedgrowthinChina,theUnitedStates,Europe,andIndia.–Themedianestimateof2021globalPVsystemdeploymentprojectsa17%y/yincreasetoapproximately163GWDC.–Themedianestimateof2022globalPVsystemdeploymentprojectsanother5%y/yincreasetoapproximately172GWDC.050100150200250201920202021P2022PPVAnnualInstallations(GWDC)ROWJapanIndiaU.S.EuropeChinaNREL10NREL10GlobalCSPInstalled•From2010to2020,cumulativeglobalCSPinstallationsincreasedbyalmost6X.–InitiallymostofthegrowthcamefromSpainandtheUnitedStates.•From2015to2020,approximately2GWofCSPwasinstalledinotherpartsoftheworld,particularlytheMiddleEast,NorthAfrica,andChina.–Thereisalsosomedevelopmentinotherpartsoftheworld,suchasSouthAmerica.•In2020,approximately100MWofCSPwasaddedinChina.01234567820102011201220132014201520162017201820192020CumulativeInstallations(MWAC)OtherChinaMiddleEastSouthAfricaMoroccoSpainU.S.Sources:BNEF,“Capacity&Generation”dataset.AccessedJune2,2021.NREL11NREL11GlobalCSPPipeline•BNEFreportsaCSPpipelineof8.8GW:•1.4GWisunderconstruction.•1.2GWispermitted.•6.2GWhasbeenannounced.•Inthenearterm,CSPprojectsareprimarilyexpectedtobebuiltinChile,China,andtheMiddleEast.•Inthelongerterm,significantlymoreprojectsareplannedinChinaandtheMiddleEast.Note:PipelineisdefinedasactiveprojectsinBNEF’sdatabasethathave:securedfinancingorareunderconstruction;receivedpermit(s)forconstruction;orbeenannouncedandplanninghasbegun.TimelinesvarybythecircumstancesofindividualCSPprojects,howevereachstepcantaketwoyears,orsixyearsintotal.Sources:BNEF,“Capacity&Generation”dataset.AccessedJune2,2021.0.00.51.01.52.02.53.03.54.0ChileChinaMiddleEastSouthAfricaOtherCSPCapacity(GW)Financingsecured/underconstructionPermittedAnnounced/planningbegunNREL12NREL12CSPGlobalAveragesSource:IRENA,RenewablePowerGenerationCostsin2020.•IRENAreportsthattheweighted-averageLCOEofCSPplantsfell68%from2010to2020,to$0.108/kWh.•In2020,theglobalweighted-averagetotalinstalledcostwas$4,581/kW,whichis31%lowerthanin2019.•AveragecapacityfactorofCSPplantsincreasedfrom30%in2010to42%in2020asaresultoftechnologyimprovements,deploymentoccurringinbettersolarresourceareas,andincreaseduseandlevelsofstorage.NREL13NREL13CSPInstalledCostbyProjectSize,CollectorType,andAmountofStorage,2010–2020•IRENAreportsthatCSPCAPEXdeclinedfrom2010to2020,despiteaddingmorehoursofenergystorageonaverage.•IRENAalsoreportssystemsizehasgenerallyincreased(whichlikelyfacilitatescostreductionopportunities)andtheindustryhasdeployedamorediversesetofcollectortypes.Source:IRENA,RenewablePowerGenerationCostsin2020.NREL14GlobalSolarDeployment1U.S.PVDeployment2PVSystemPricing3GlobalManufacturing4ComponentPricing5MarketActivity6PVPriceIncreases•TheUnitedStatesinstalled4.0GWAC(4.9GWDC)ofPVinQ12021—itslargestQ1totalever.•Attheendof2020,therewereapproximately2.7millionresidentialPVsystemsintheUnitedStates.•SEIAreportedthatin2020theU.S.communitysolarmarketinstalled826MWDCofcommunitysolarinstallations—a30%increase,y/y,bringingcumulativecapacityto3GWDC.•BasedonEIA’sShort-TermEnergyOutlook,annualPVandwinddeploymentwillgrow34%and8%respectivelyin2021fromtherecord-settinglevelsachievedin2020.NREL15NREL15Q12021StateUpdatesDCNewMexicolawmakerspassedcommunitysolarlegislation,withaninitialprogramcapof100MWanda30%capacityrequirementforLMIcustomers.KansasregulatorsrejectEvergy’sproposeddistributedgenerationfees,sayingtheycouldnegativelyimpactlow-incomecustomers.However,thecommissionisnotagainstagridaccesscharge.Connecticut’sPUCapprovedtwoNEMsuccessoroptions:(1)abuy-all,sell-allfixedtariffand(2)amonthlynettingoptionsetatretailrates.Source:MeisterConsultantsGroup,50StatesofSolar:NetMeteringQuarterlyUpdate(Q12021).HECOisworkingtowardimplementinganewrooftoprentalprogram,withtheutilityinstallingsolaroncustomerrooftopsandparticipatingcustomersreceivingfixedmonthlybillcredits.WestVirginiapassedlegislationtoallowthird-partyPPAs.Ithadbeenoneofsevenstatesthatprohibitedthird-partyPPAs.•Manystatesareworkingonadoptinguniquenetmeteringsuccessorpoliciesastheycontinuetoincreasesizelimitsandaggregatecaps;however,manyutilityproposalsincludeminimumbills,higherfees,time-of-userates,andlowerexportcreditrates.•Communitysolarcontinuestoexpand,butmanystatesarefacingchallengesachievingLMIparticipationgoals.NREL16NREL16NaturalGasCC4.2NaturalGasCT2.6NaturalGas(Other)0.1Wind16.0UPV15.5DPV4.5Batteries3.8Other0.2Planned2021U.S.GenerationCapacityAdditions(Total46.9GW)U.S.GenerationCapacityAdditionsbySource:2020andPlanned2021Sources:EIA“PreliminaryMonthlyElectricGeneratorInventory.EIA“ElectricPowerMonthly”Table6.1.EIA“Short-termEnergyOutlook.”•EIAestimatesthepercentageofU.S.electriccapacityadditionsfromsolarwillgrowfrom40%in2020to43%in2021(33%UPVand10%DPV).•Itisestimatedthatwindandsolarwillrepresent77%ofallnewelectricgenerationcapacityandbatterystoragewillrepresentanother8%.•BasedonEIA’sShort-termEnergyOutlook,annualPVandwinddeploymentwillgrow34%and8%,respectivelyin2021fromtherecord-settinglevelsachievedin2020.–2020andplanned2021totalU.S.capacityadditionsrepresentasignificantincreaseintotaldeploymentfromtheprevious10-yearaverageof26GWperyear.–Morethan30%ofnewcapacityisprojectedtobeinstalledinTexas,withover3.2GWofnaturalgas,5.7GWofwind,andmorethan4.5GWofsolar.NaturalGasCC5.8NaturalGasCT1.2NaturalGas(Other)0.2Wind14.7UPV10.4DPV4.5Batteries0.5Other0.32020U.S.GenerationCapacityAdditions(Total37.6GW)NREL17NREL17EIAPVProjectPlannedPipelineAccordingtoEIAdata,theU.S.PVprojectpipelineofutility-scalePVprojectscontinuestohitrecordhighs,with15GWACofprojectsunderconstruction,7GWAChavingreceivedregulatoryapproval,and20GWACplannedasofMarch2021.Note:PipelineisdefinedasallplannedPVprojectswhichhavebeensubmittedinEIA’sForm860M.Allprojectshaveascheduledplaced-in-servicedatebetween2021-2024.Source:EIAForm860M(March2021).051015202530354045UnderconstructionRegulatoryapprovalsPlannedGWACNREL18NREL18U.S.InstallationBreakdownAnnual:EIA(GWAC)•TheUnitedStatesinstalled4.0GWACofPVinQ12021,itslargestQ1totalever—up27%y/y.–ResidentialandC&Iwereup2%andutility-scalePVwasup40%inQ12021.•Texas,Florida,andCaliforniarepresentedhalfofU.S.PVcapacityinstalledinQ12021,whichissimilarto2020levels.•DespiteaconcentrationofPVinstallationsinthetopthreemarkets,diversificationofgrowthcontinuesacrosstheUnitedStates.–15statesinstalledmorethan50MWACofPVinQ12021.Note:EIAdefines“utility-scale”asprojectshavingacapacitygreaterthan1MW.EIAreportsvaluesinWACwhichisstandardforutilities.TheSolarindustryhastraditionallyreportedinWDC.SeenextslideforvaluesreportedinWDC.Sources:EIA,“ElectricPowerMonthly,”formsEIA-023,EIA-826,andEIA-861(June2021,February2021,February2019).01234567Q1'16Q2'16Q3'16Q4'16Q1'17Q2'17Q3'17Q4'17Q1'18Q2'18Q3'18Q4'18Q1'19Q2'19Q3'19Q4'19Q1'20Q2'20Q3'20Q4'20Q1'21QuarterlyPVInstalled(GWAC)U.S.PVInstallationsbyMarketSegmentUtility-scaleC&IResidentialTexas810Florida602Southeast406Southwest541California535Midwest505Northeast435Other182Q12021U.S.PVInstallationsbyRegion(4.0GWAC)NREL19NREL19U.S.InstallationBreakdownAnnual:SEIA(GWDC)•SEIAreportsthattheUnitedStatesinstalled4.9GWDCofPVinQ12021—up43%y/y.•AttheendofQ12021,therewereover100GWDCofcumulativePVinstallations.•TwoMidwesternstates(IndianaandMichigan)weretop5PVmarketsinQ12021,withIndianainstallingmorePVthanCalifornia.Sources:WoodMackenzie/SEIA:U.S.SolarMarketInsight:Q22021.Unlikethevaluesonthepreviousslide,thevaluesonthisslideareinGWDCinsteadofGWAC.0123456789Q1'16Q2'16Q3'16Q4'16Q1'17Q2'17Q3'17Q4'17Q1'18Q2'18Q3'18Q4'18Q1'19Q2'19Q3'19Q4'19Q1'20Q2'20Q3'20Q4'20Q1'21QuarterlyPVInstalled(GWDC)U.S.PVInstallationsbyMarketSegmentUtilityNonresidentialPVResidentialPVCalifornia8%Texas31%Southwest6%Florida11%Southeast11%Northeast9%Midwest20%Other5%Q12021U.S.PVInstallationsbyRegion(4.9GWDC)NREL20NREL20U.S.EnergyStorageInstallationsbyMarketSegment•TheUnitedStatesinstalledapproximately0.9GWh/0.3GWACofenergystorageontotheelectricgridinQ12021,up252%y/y,asaresultofrecordlevelsofresidentialdeploymentandthesecondhighestquarterlyleveloffront-of-the-meterdeployment(thoughonlytwoprojectscameinCaliforniaonline).–Q12021wasthefirsttimeresidentialstoragesurpassed250MWh(or100MW)ofquarterlyinstalls.–Thenonresidentialmarkethasremainedrelativelyflatforthepast3years.•WoodMackenziereportsthenonresidentialmarkethashadtroublesscalingbecauseofthechallengesofstandardizingandscalingacommercialoffering.•Californiacontinuedtobefarandawaythelargestresidentialandutility-scalemarketinQ12021,withMassachusettstakingthetopspotinthenonresidentialsector.•TheBidenadministrationisproposingastandalonetaxcreditforenergystorage,whichhasthepossibilitytoincreasestoragedeploymentanddecoupleitfromsolar.Source:WoodMackenziePower&RenewablesandEnergyStorageAssociation,“U.S.EnergyStorageMonitor.”05001,0001,5002,0002,500Q1Q2Q3Q4Q1Q2Q3Q4Q1Q2Q3Q4Q1Q2Q3Q4Q1Q2Q3Q4Q12016201720182019202021QuarterlyEnergyStorageInstalled(MWh)U.S.EnergyStorageInstallationsbyMarketSegmentFront-of-the-MeterNonresidentialResidentialCalifornia84%Texas1%Massachusetts4%Hawaii3%NewJersey0%Florida1%NewYork1%Other6%Q12021U.S.EnergyStorageInstallationsbyRegion(0.8GWh)NREL21NREL210%10%20%30%40%50%60%70%80%02468101214161820162017201820192020P2021P2022P2023P20162017201820192020P2021P2022P2023PPVCapacityBatteryCapacityPercentageofMarketAnnualInstallations(GW)PVpairedwithbatteriesStandalone%ofPVwithbatteries%ofbatterieswithPVProposedProposedU.S.Utility-ScalePVandBatteries•From2016through2020,approximately650MWofU.S.utility-scalePVsystemswerebuilt—andpairedwith180MWofstorage(493MWh)—representingapproximately2%ofU.S.utility-scalePVsystemcapacityand15%ofutility-scalebatterysystemcapacity(MW)installedduringthattime.–41%ofutility-scalebatterycapacity(inMWhcapacity)installedbetween2016and2020waspairedwithPV.•EIAreportsanother11.1GWofutility-scalePVareproposedtobebuilt—andpairedwith6.1GWofbatterystorage—from2021through2023.–Thepercentageofutility-scalePVsystemspairedwithbatteriesisexpectedtoincrease15%in2021,28%in2022,and38%in2023.Source:U.S.EIA,FormEIA-8602020ER.NREL22NREL22U.S.ResidentialPVPenetration•Since2005,whenCongresspassedtheinvestmenttaxcredit,thenumberofresidentialPVsystemsinstalledannuallyhasgrownbyapproximately32%peryear,orbyabout60X.•Attheendof2020,therewereapproximately2.7millionresidentialPVsystemsintheUnitedStates.–Still,only2.0%ofhouseholdsownorleaseaPVsystem(orabout3.2%ofhouseholdslivinginsingle-familydetachedstructures).–However,solarcontributionsvarybylocation.Hawaii,California,andArizonahaveresidentialsystemsonanestimated32%,15%,and9%ofsingle-familydetachedstructures.•Attheendof2020,AustraliaandGermanyhadapproximately2.7millionand2.0millionPVsystems,respectively,butwithmuchsmallerpopulations.Sources:Res.PVInstallations:2000-2009,IREC2010SolarMarketTrendsReport;2010-2020,WoodMackenziePowerandRenewables/SEIA:U.S.SolarMarketInsight2020Year-in-Review;U.S.HouseholdsU.S.CensusBureau,2019AmericanCommunitySurvey;GermanSolarAssociation(BSW-Solar);AustralianPhotovoltaicInstitute.0500,0001,000,0001,500,0002,000,0002,500,0003,000,0003,500,0004,000,0000.0%0.5%1.0%1.5%2.0%2.5%3.0%3.5%4.0%2005200620072008200920102011201220132014201520162017201820192020CumulativeResidentialPVSystemsPercentageofHouseholdswithPVResidentialPVsystems(rightaxis)U.S.households(leftaxis)Single-familydetachedhouses(leftaxis)NREL23NREL23AnnualCommunitySolarAdditions•SEIAreportedthatin2020theU.S.communitysolarmarketinstalled826MWDCofcommunitysolarinstallations—a30%increase,y/y—bringingcumulativecapacityto3GWDC.•Attheendof2020,communitysolarprojectswerein40states,but79%ofthecumulativeinstalledcommunitysolarcapacitywasintheleading5states.–Communitysolargrowthhasbeendrivenbyleadingmarkets,firstinColorado,andthenMinnesotaandMassachusetts,andin2019-20inNewYork.•WoodMackenzieexpectsgrowthin2021thatisduetodelayedprojectsfrompreviousyears.GrowthisalsoexpectedtocomefromnewercommunitysolarmarketssuchasIllinois,Maine,andNewJersey.Note:WoodMackenziePowerandRenewablesandSEIAdefine“CommunitySolar”asprojectswheremultiplecustomerscansubscribetopowerofftakefromaPVsysteminstalledintheircommunityandreceivecreditsontheirutilitybills.Sources:WoodMackenziePowerandRenewables/SEIA:U.S.SolarMarketInsightQ22021.010020030040050060070080090020132014201520162017201820192020AnnualPVInstalled(GWDC)OtherNewYorkMinnesotaMassachusettsColoradoCaliforniaNREL24NREL24ModuleCharacteristicsofCaliforniaNEMDataSet•Historically,mostCaliforniadistributedPVcapacityusedmoduleswith60or72PVcells,orSunPower’s96or128count.•From2017to2020PVmoduleswithhalf-cutcells(e.g.,60x2=120;72x2=144)grewfrom4%to43%ofdistributedcapacityinstalledinCalifornia.•AlthoughbifacialpanelshaverecentlycapturedasignificantmarketshareintheUnitedStates,in2020theystillrepresentedasmallpercentagesofCalifornia’scommercial(5%)anddistributedground-mount(4%)capacity.–Thatlevelforcommercialsystemsstillrepresentsasignificantjumpfrom0.1%ofinstalledcapacityin2018and0.4%in2019.•Modulesizeinthecommercialandresidentialsectorincreasedonlymodestlyfrom2017to2020.Source:CANEMdatabase(03/31/21).02004006008001,0001,2001,4002017201820192020InstalledCapacity(MW)ModuleCellCountOtherhalf-cut144120128967260Other1.01.11.21.31.41.51.61.71.81.92.020172018201920202021ModuleSize(m2)ModuleSizeResidentialCommercialNREL25NREL251MW+U.S.PVSystemSizeDistributionbyYear•In2010,only13%oftheU.S.PVsystemsgreaterthan1MWinstalledwereabove20MWAC,withthelargestsystembeing30MWAC.•In2020,86%ofU.S.PVsystemsabove1MWACinstalledcamefromsystemsabove20MWAC,withthelargestsystembeing300MWAC.“Other”couldrepresentdataentryerrors.Source:U.S.EIA,FormEIA-8602020ER.0%10%20%30%40%50%60%70%80%90%100%20102011201220132014201520162017201820192020PercentageAnnualInstalledCapacity150MW+75MW-150MW20MW-75MW5MW-20MW<5MWNREL26NREL26U.S.Utility-ScalePVTechnologyDistributionbyYear•Thoughthin-filmPVrepresentedlessthan5%ofglobalPVdeployedfrom2010through2020,itaccountedfor29%ofU.S.utility-scalePVdeploymentsduringthisperiod.–In2020,CdTePVaccountedfor26%ofU.S.utility-scalePV.–ForFirstSolar,theleadingsupplierofCdTemodules,theU.S.markethasbeencritical,accountingfor77%ofitsrevenuefrom2016through2020.•MostofthedistributedU.S.PVmarketusesc-Simodules;therefore,CdTemarketshareforallU.S.PVsystemsislower.–CdTeaccountedforapproximately16%ofallU.S.solardeployedin2020(cumulativeandannual).“Other”includesCIGS,a-Si,butalsocouldrepresentdataentryerrors.Source:U.S.EIA,FormEIA-8602020ER.0%10%20%30%40%50%60%70%80%01234567891020102011201220132014201520162017201820192020U.S.Utility-ScaleMarketshareAnnualInstallations(GW)OtherCdTec-SiCumulativec-SimarketshareNREL27NREL27U.S.Utility-ScalePVMountingTypebyYear•Theuseofsingle-axistrackingintheU.S.utilityPVmarkethasgrownsteadilyoverthepastdecade.–Attheendof2020,73%ofallU.S.utility-scalePVsystemsusedsingle-axistracking.And87%ofU.S.utility-scalePVsystemsinstalledin2020usedsingle-axistracking.–Thisgrowthcanbeattributedtothereducedcostandincreasedreliabilityoftrackers,makingthemtheeconomicchoiceinabroaderdistributionofPVsystems(e.g.,lessirradiantclimates).“Other”includestwo-axistrackingsystemsbutcouldrepresentdataentryerrors.Source:U.S.EIA,FormEIA-8602020ER.0%10%20%30%40%50%60%70%80%01234567891020102011201220132014201520162017201820192020U.S.Utility-scaleMarketshareAnnualInstallations(GW)OtherOneAxisFixedTiltCumulativeOne-axiscapacityNREL28NREL28U.S.Utility-ScalePVAverageInverterLoadingRatio(ILR)byYear•Overthepast10years,theaverageILRhasincreasedforbothfixed-tiltandone-axistrackingPVsystemsintheUnitedStates.•TheaverageILRsforfixed-tiltandone-axistrackingsystemsinstalledin2020were1.40and1.33respectively.•Aspanelpriceshavedropped,itmakesmoreeconomicsensefordeveloperstooversizetheirPVarraysrelativetotheirinverters.•Additionally,higherILRsproduceaflatter,widerproductioncurve,whichmaybeattractivefromaloadmanagementperspective.Source:U.S.EIA,FormEIA-8602020ER.1.001.051.101.151.201.251.301.351.401.451.5020102011201220132014201520162017201820192020ILRFixedTiltOneAxisNREL29NREL29U.S.Utility-ScalePVAssetOwnershipbyYear•MostU.S.utility-scalePVsystemsareownedbyindependentpowerproducers(IPPs),whichselltheirelectricityunderlong-termcontracts.•However,from2010to2020,5.5GWofPVinstalledhasbeenownedbyelectricutilities—2.0GWwasinstalledin2020alone.•UtilitiesownPVin19states,but59%isinFloridaandanother11%isinVirginia.–TheFloridaPSCandVirginiaGeneralAssemblyestablishedrulesthatwouldencouragedirectutilityownershipofsolarassets.“Other”includescommercialandindustrialprojectsabove5MWinsize.Source:U.S.EIA,FormEIA-8602020ER.0246810121420102011201220132014201520162017201820192020AnnualInstallations(GW)OtherElectricUtilityIPPNREL30GlobalSolarDeployment1U.S.PVDeployment2PVSystemPricing3GlobalManufacturing4ComponentPricing5MarketActivity6PVPriceIncreases•ThemedianreportedpricebyEnergySageforresidentialPVsystemsdecreased4.8%betweenH22019andH22020—thelargestdecreasesince2017.•Inaselectdatasetofutility-scalePVsystemsownedby25regulatedutilities(149projectstotaling6.0GWAC),themediansystempricein2020was$1.34/WAC($0.85/WDC)—flaty/yinWattsACbutan8%decreaseinWattsDCthatwasduetoincreasedILR.NREL31NREL31SystemPricingfromSelectStates•FromH12020toH12021,themedianreportedPVsystempriceinArizona,California,Connecticut,Massachusetts,andNewYork:–Fell5%to$3.78/Wforsystemsfrom2.5kWto10kW–Fell2%to$3.25/Wforsystemsfrom10kWto100kW–Increased2%to$2.41/Wforsystemsfrom100kWto500kW–Increased5%to$1.73/Wforsystemsfrom500kWto5MW.2021YTDMW:AZ(48),CA(72),CT(2),MA(70),NY(183)•YTDNote:Systempricesabove$10/Wandbelow$0.75/Wwereremovedfromthedataset.Therewerenotenoughreportedpricesforsystemsabove5MWinthisdatasettoshowatrendovertime.Sources:AZ(06/24/21),CANEMdatabase(04/31/21);CT(05/14/21),MASREC(05/05/21)andSMART(06/01/21)programs;NYSERDA(06/24/21).$0.0$0.5$1.0$1.5$2.0$2.5$3.0$3.5$4.0$4.5$5.0H1H2H1H2H1H2H1H2H1H2H1H2H12015201620172018201920202021SystemPrice($/WDC)2.5–10kW10–100kW100–500kW500kW-5MWNREL32NREL32$0$1$2$3$4$5$6AZCACTMANYAZCACTMANYAZCAMANYAZCAMANYNY2.5kW–10kW10kW–100kW100kW–500kW500kW–5MW5MW+SystemPrice($/WDC)SystemPricingfromSelectStates,H12021•ThemedianpriceofalargesysteminNewYorkwasabout21%lessthanthemedianpriceinMassachusetts.•In2020,the20thand80thpercentilepricesinCaliforniaforasmallsystemwere$3.23/Wand$4.94/Wrespectively.•Inadditiontopricedifferencesbasedonsystemsize,thereisvariationbetweenstatesandwithinindividualmarkets.Barsrepresentthemedian,witherrorbarsrepresenting80thand20thpercentiles.2021YTDMW:AZ(48),CA(72),CT(2),MA(70),NY(183)•YTDNote:Systempricesabove$10/Wandbelow$0.75/Wwereremovedfromthedataset.Therewerenotenoughreportedpricesforsystemsabove5MWinthisdatasettoshowatrendovertime.Sources:AZ(06/24/21),CANEMdatabase(04/31/21);CT(05/14/21),MASREC(05/05/21)andSMART(06/01/21)programs;NYSERDA(06/24/21).NREL33NREL33$0$1,000$2,000$3,000$4,000$5,000$6,000$7,000$8,0002018201920202021YTDn=3621n=5281n=8828n=2695SystemPricePV+Storage($/kWDC)PV+Storage($/kWAC)PV+Storage($/kWh)ResidentialU.S.StoragePricingIn2021YTD,residentialPV+storagesystemsinArizona,California,andMassachusettshadamedianpriceof$2,400/kWh,or$5,200/kWAC($4,800/kWDC)—areductionof8%–16%comparedtofull2020medianvalues.–Mostofthesesystemsoffer2–3hoursofstorage.Sources:ArizonaGoesSolar(06/24/21);CANEMdatabase(04/31/21);MassachusettsSMARTprogram(06/01/21)Barsrepresentthemedian,witherrorbarsrepresentingthe80thand20thpercentiles.NREL34NREL34ResidentialSystemPriceReportedbyEnergySage,H22020Note:pricebasedonwinningquotedprice.Source:EnergySage,“SolarMarketplaceIntelReportH12020–H22020.”•ThemedianreportedpricebyEnergySageforresidentialPVsystemsdecreased4.8%betweenH22019andH22020—thelargestdecreasesince2017.–Someofthedecreaseinpricecanbeattributedtoa3.0%increaseinsystemsize,to10.2kW.•Residentialsystempricevariedbystate.InH22020,themedianpriceofaresidentialsysteminColoradowas37%higherthanthemedianpriceofaresidentialsystemintheborderingstateofArizona.–Partofthepricedisparitybetweenstatesisduetodifferencesinaveragesystemsize,thoughotherfactors,suchascostofliving(e.g.,California)alsoplayarole.3.803.723.643.503.353.153.103.053.002.922.892.852.7503691215$0$1$2$3$4$5H2H1H2H1H2H1H2H1H2H1H2H1H22014201520162017201820192020AverageSystemSize(kW)MedianGrossCosts($/W)PriceandSizeoverTime2.302.302.412.542.692.702.752.903.053.103.15$0$1$2$3$4$5AZNVNJFLCATXUSMAILNYCOMedianGrossCosts($/W)PricebyState,H22020NREL35NREL350123456201520162017201820192020201920202017201820192020SunrunSunPower(residential)SunnovaSystemCosts($/W)CreationCostsNetValueG&ASalesInstallationSunnova,Sunrun,andSunPowerCostandValue,2015–2021Sources:Corporatefilings.•Totalsystemcostsincreasedin2020formanynationalresidentialinstallers,withreportedcostincreasesininstallationandSG&A.–Thepandemiccauseddisruptioninmanypartsofthesolarsupplychain,andtraditionalbusinesspractices.Manyresidentialinstallershavehistoricallyreliedonface-to-facesales,andtheyspenttimeandmoneytransitioningtoamorevirtualapproach.•Thisswitchinsalesisexpectedtoresultincostsavingsgoingforward.NREL36NREL36SunrunandSunPowerCostandValue,Q12021Sources:Corporatefilings.•IncreasedcostspersistedinQ12021forSunrun,comparedtoQ12020.Sunrun’ssystemcostswerearound$4/Wanditstotalvaluecreationwasaround$5/W.•SunPower’sresidentialinstallationcostsdecreasedbyabout8%,butithadrelativelyflatpricingduetoincreasednetvalue.–SunpowerreportslowerSG&AcoststhanSunrunbecauseitreportsanaggregatedSG&Aforitsresidentialandcommercialsectors,whileSunrunfocusesmostlyontheresidentialsector.•Becauseoftheirsmallersize,residentialPVsystemstypicallyhavehigherSG&A-per-wattvalues.$2.17$2.51$3.38$3.09$0.76$1.10$0.27$0.26$0.16$0.22$0.28$0.28$0.98$1.08$0.28$0.52$0.0$1.0$2.0$3.0$4.0$5.0$6.0Q1'20Q1'21Q1'20Q1'21SunrunSunPower(residential)InstalledCost($/W)NetValueG&ASalesInstallationNREL37NREL37Utility-OwnedPVPricing(>5MW)Sources:FERCForm1filingsfromthefromthefollowingutilities:AlabamaPower,Allete,ArizonaPublicService,Avangrid,DTE,DukeEnergy,ElPasoElectric,FloridaPowerandLight,GeorgiaPower,IndianaMichiganPower,KentuckyUtilities,NevadaPower,PacificGasandElectric,PublicServiceofNewMexico,SouthernCaliforniaEdison,TampaElectric,TucsonElectric,UnitedIlluminating,UNSElectric,VirginiaElectric.Inaselectdatasetofutility-scalePVsystemsownedby25regulatedutilities(149projectstotaling6.0GWAC),themediansystempricein2020was$1.34/WAC($0.85/WDC)—flaty/yinWattsACbutan8%decreaseinWattsDCthatwasduetoincreasedILR.–Thelowestandhighestreportedpricesin2020were$0.97/WACand$1.70/WAC($0.72/WDCand$1.31/WDC).–From2010through2020,systempricesfell14%peryearonaverageperWACand16%peryearonaverageperWDC.$0$1$2$3$4$5$6$7$8$9$10200920102011201220132014201520162017201820192020InstalledCost($/W)ProjectCompletionYearMedian(AC)Capacity-weightedaverage(AC)Individualprojects(AC)Median(DC)Capacity-weightedaverage(DC)Individualprojects(DC)NREL38NREL38$0.0$0.5$1.0$1.5$2.0$2.5$3.0$3.5$4.0Dec-14May-16Sep-17Feb-19Jun-20InstalledCost($/WAC)ProjectCompletionYearSouthwestSoutheastMidwestUtility-OwnedPVPricing(>5MW)Sources:FERCForm1filingsfromthefromthefollowingutilities:AlabamaPower,Allete,ArizonaPublicService,Avangrid,DTE,DukeEnergy,ElPasoElectric,FloridaPowerandLight,GeorgiaPower,IndianaMichiganPower,KentuckyUtilities,NevadaPower,PacificGasandElectric,PublicServiceofNewMexico,SouthernCaliforniaEdison,TampaElectric,TucsonElectric,UnitedIlluminating,UNSElectric,VirginiaElectric.•Inaselectdatasetofutility-scalePVsystems(149projectstotaling6.0GWAC)ownedby25regulatedutilities,theaveragesystemsizehastrendedupwardassystempricinghastrendeddownwardoverthepast5years.Andsystemsizeincreaseshavetrendedupwardwhilesystempricingdecreaseshaveslowed.–Theaveragesystemsizeinthisdatasetwas14MWACin2015and83MWACin2020.–Theaveragesystemsizein2020(83MWAC)representeda60%increasefrom2019alone.•Systempricesinthisdatasetmaybelowerthanthenationalaverage,astheydonotincludedatafromhigher-costregions,suchasCalifornia,theNortheast,ortheMid-Atlantic—areaswithfarlessutilityownershipofPVsystems.–Systempricesinthisdatasetwerefurtherloweredin2020becauseofnumerouslargesolarplants(>70MWAC)comingonline,mostlyintheSoutheast.10MW100MWNREL39GlobalSolarDeployment1U.S.PVDeployment2PVSystemPricing3GlobalManufacturing4ComponentPricing5MarketActivity6PVPriceIncreases•In2020,globalPVshipmentswereapproximately132GW—anincreaseof7%from2019.•In2020,88%ofPVshipmentsweremonoc-Sitechnology,comparedto35%in2015(whenmultipeakedat58%).•In2020,theaveragemoduleefficiencyofmodulesinstalledintheUnitedStateswasapproximately19.7%formonoc-Si,17.5%formultic-Si,and17.7%forCdTe.•ModuleandcellimportspickedupsignificantlyinMarchandApril2021;thefirst4monthsofthe2021hadaflatlevelofPVimports,y/y(9.8GW).NREL40NREL40GlobalAnnualPVShipmentsbyRegion•In2020,globalPVshipmentswereapproximately132GW—anincreaseof7%from2019.•Since2004:–TheU.S.-manufacturedpercentageofglobalPVshipmentsdeclinedfromaround13%tolessthan1%.–Chinese-manufacturedshareofglobalPVshipmentsgrewfrom1%to67%.–TogethertheMalaysian-,Vietnamese-,andSouthKorean-manufacturedpercentageofglobalPVshipmentswentfrom0%to24%(withVietnamesegrowthcomingonrapidlyduringthelast5years).Note:Excludesinventorysalesandoutsourcing.Source:2004-2020:PaulaMints."PhotovoltaicManufacturerCapacity,Shipments,Price&Revenues2020/2021."SPVMarketResearch.ReportSPV-Supply9.April2021.0%2%4%6%8%10%12%14%16%200420062008201020122014201620182020020406080100120140PercentageofShipmentsPVModuleShipments(GW)JapanEUU.S.RestofAsiaVietnamMalaysiaTaiwanChinaU.S.ShareNREL41NREL41GlobalAnnualPVShipmentsbyTechnology•In2020,88%ofPVshipmentsweremonoc-Sitechnology,comparedto35%in2015(whenmultipeakedat58%).•MonoPPERCwasthedominantcelltypein2020,thoughn-typeshipmentsgrew181%,y/y,to13%ofthemarket.Notes:Excludesinventorysalesandoutsourcing.Includes“StandardMultic-Si”,“StandardMonoc-Si”,“a-Si”,and“CIS/CIGS.”Source:2004-2020:PaulaMints."PhotovoltaicManufacturerCapacity,Shipments,Price&Revenues2020/2021."SPVMarketResearch.ReportSPV-Supply9.April2021.0%20%40%60%80%100%20072008200920102011201220132014201520162017201820192020PercentageofGlobalPVShipmentsbyTechnologyMultic-SiMonoc-SiRibbonc-Sia-SiCdTeCIGS/CISMultiPERC7%MonoPPERC75%TOPCon(N)5%HJT/HIT(N)1%IBC(N)1%NPERC5%OtherN1%CdTe4%Other1%2020MarketSharebyCellTypeNREL42NREL42PVEfficiencyImprovements•From2010to2020,theefficiencyofmodulesinstalledintheUnitedStatesincreasedsignificantly:–14.4%to19.7%formonoc-Si–13.9%to17.5%formultic-Si–11.0%to17.7%forCdTe.•BasedonpreliminarydataforQ12020,theaverageefficiencyofmonoc-Si(19.9%)andCdTe(~18%)panelsinstalledintheUnitedStateshavecontinuedtoincrease,whilemultic-Sicontinuestolag.Sources:CdTe:FirstSolarInvestorRelations,averagemoduleefficiencyproduced.c-Si(60/72/144cell)CaliforniaInterconnectionDataset(03/31/21).10%12%14%16%18%20%22%20102011201220132014201520162017201820192020Q12021ModuleEfficiencyMulti-crystallineMono-crystallineCdTeNREL43NREL43GlobalLeadingPVManufacturers,byShipmentsRanking2015MWp2019MWp2020MWp1Trina3,631Tongwei12,752LONGI14,6832JASolar3,617LONGi10,957Tongwei12,1003HanwhaQ-Cells3,400JinkoSolar9,708JASolar10,7514CanadianSolar2,691CanadianSolar8,600AikoSolar10,5215FirstSolar2,518AikoSolar7,610TrinaSolar9,0016JinkoSolar2,400JASolar7,560JinkoSolar8,6557Yingli2,388TrinaSolar6,006CanadianSolar8,3378Motech2,100FirstSolar5,400Zhongli7,4359NeoSolar2,100HanwhaQ-Cells5,185Suntech6,31310Shungfeng-Suntech1,970UREC4,219FirstSolar5,500TotalAbove26,81577,99793,294TotalShip.MWp50,877123,485131,709•From2015to2020,shipmentsfromthetop10PVmanufacturersgrewfrom27GWto93GW,withsomecompaniesshippingmorethan10GWannually.•Newcompaniesquicklymovedtotopspots,inpartthroughtherapidgrowthofmonoc-Siproduction.•Thelistofleadingcompaniesremainedrelativelystablebetween2019and2020,asthetoptenmanufacturersgrewtheirmarketsharefrom63%to71%.Note:Excludesinventorysalesandoutsourcing.Source:2004-2020:PaulaMints."PhotovoltaicManufacturerCapacity,Shipments,Price&Revenues2020/2021."SPVMarketResearch.ReportSPV-Supply9.April2021.NREL44NREL44PVManufacturers’Margins•ThemediangrossmarginofthepubliclytradedPVcompaniesrepresentedtotheleftincreasedinQ12021,remainingabovehistoricalaverages.•Therecontinuestobesignificantvariationbyindividualcompaniesasindividualfactorscomeintoplay.Linesrepresentthemedian,witherrorbarsrepresenting80thand20thpercentilesforthefollowingcompaniesinQ12021:CanadianSolar,FirstSolar,JinkoSolar,LONGi,Maxeon,MotechIndustries,Renesola,Risen,ShanghaiAerospace,Tongwei,TrinaSolar,andUnitedRenewableEnergy.MargindatafromHanwhaQCells,JASolar,Sunpower,andYingliarealsoincludedfromQ12010toQ42020whereavailable.Source:Companyfiguresbasedonpublicfilingsandfinance.yahoo.com.-40%-30%-20%-10%0%10%20%30%40%Q1Q2Q3Q4Q1Q2Q3Q4Q1Q2Q3Q4Q1Q2Q3Q4Q1Q2Q3Q4Q1201620172018201920202021MarginsGrossMargin(%)OperatingMargin(%)NREL45NREL45-100%-80%-60%-40%-20%0%20%40%60%80%100%201220132014201520162017201820192020201220132014201520162017201820192020201220132014201520162017201820192020201220132014201520162017201820192020201220132014201520162017201820192020201220132014201520162017201820192020PolysiliconWaferCells/ModulesInvertersIntegratorsYieldcoMedianGrossMarginofSurveyedCompaniesGrossMarginAcrossSupplyChain•Ofthesectorswithimprovedgrossmarginsin2020,yieldcos,integrators,andinverterscontinuedgrowthtrendsfrompreviousyears,whilepolysiliconandwafersreverseddownwardtrends.Sources:Companyfiguresfrompublicfilingsandfinance.yahoo.com.Errorbarsrepresenthighandlowvaluesofsurveyedcompanies.CompaniessurveyedarePolysilicon–GCLPoly,RECSilicon,WackerChemie,Ferroglobe;Wafers-ReneSola,WaferWorksCorp,DanenTechnologyGroup,GreenEnergyTechnologyInc;Cells/Modules,Gintech,UnitedRenewableEnergyCorp,Motech,FirstSolar,JASolar,Yingli,TrinaSolar,CanadianSolar,PVCrystaloxSolar,HanwhaSolarOne,JinkoSolar,SunPower,LONGi,Tongwei;Inverters–SolarEdge;Enphase;SMASolar;AdvancedEnergyIndustries;Integrators-RealGoodsSolar,SolarCity,VivintSolar,Sunrun,Sunworks,EnlightRenewableEnergy,Sunnova;IPP/Yieldco-BrookfieldRenewablePartners;AlgonquinPower&UtilitiesCorp;ClearwaterEnergy,NorthlandPower,PatternEnergy,TerraformPower,TransAltaRenewables.•Allsectorssawincreasesingrossmarginin2020comparedto2019exceptcells/modules,whichhadaslightdrop.•Ofthesectorsthatimprovedin2020,wafersandintegratorssawthemostsignificantgrowthingrossmargin.NREL46NREL46-100%-80%-60%-40%-20%0%20%40%60%80%100%201220132014201520162017201820192020201220132014201520162017201820192020201220132014201520162017201820192020201220132014201520162017201820192020201220132014201520162017201820192020201220132014201520162017201820192020PolysiliconWaferCells/ModulesInvertersIntegratorsYieldcoMedianOperatingMarginofSurveyedCompaniesOperatingMarginAcrossSupplyChain•Integratorsandpolysiliconfirmslostmoneyonaveragein2020,buttheformerincreasedtheirlosseswhilethelatternarrowedtheirs.•Invertersandcells/modulessawconsistentincreasesinprofitabilityfrom2018to2020.•Yieldcoshavehistoricallyhadpositiveoperatingmargins(whichcontinuedin2020),buttheirmarginshavedecreasedfor2yearsstraight.•Wafersachievedoperatingprofitabilityin2020onaverageforthefirsttimeinatleast8years.Sources:Companyfiguresfrompublicfilingsandfinance.yahoo.com.Errorbarsrepresenthighandlowvaluesofsurveyedcompanies.Companiessurveyedare:Polysilicon–GCLPoly,RECSilicon,WackerChemie,Ferroglobe;Wafers-ReneSola,WaferWorksCorp,DanenTechnologyGroup,GreenEnergyTechnologyInc;Cells/Modules,Gintech,UnitedRenewableEnergyCorp,Motech,FirstSolar,JASolar,Yingli,TrinaSolar,CanadianSolar,PVCrystaloxSolar,HanwhaSolarOne,JinkoSolar,SunPower,LONGi,Tongwei;Inverters–SolarEdge;Enphase;SMASolar;AdvancedEnergyIndustries;Integrators-RealGoodsSolar,SolarCity,VivintSolar,Sunrun,Sunworks,EnlightRenewableEnergy,Sunnova;IPP/Yieldco-BrookfieldRenewablePartners;AlgonquinPower&UtilitiesCorp;ClearwaterEnergy,NorthlandPower,PatternEnergy,TerraformPower,TransAltaRenewables.NREL47NREL47ModuleandCellImportData•6.3GWofPVmoduleswereimportedintotheUnitedStatesinQ12021,down11%y/y.•0.5GWDCofcellswerealsoimportedinQ12021,down26%.–ModuleandcellimportspickedupsignificantlyinMarchandApril2021;thefirst4monthsofthe2021haveaflatlevelofPVimports,y/y(9.8GW).•Inadditiontoimports,FirstSolarproducedapproximately500MWDCofCdTePVmodules.Note:WeadjustedThailand’sreportedimportsinmegawattsforFebruarybecauseofalikelyreportingerror.Sources:FirstSolarpublicfilings;Imports,byValueandMW:U.S.InternationalTradeCommission,2021.050010001500200025003000350040004500500001002003004005006007008009001,000Jan-16May-16Sep-16Jan-17May-17Sep-17Jan-18May-18Sep-18Jan-19May-19Sep-19Jan-20May-20Sep-20Jan-21PVImportsintoU.S.(MW)PVImportsintoU.S.($MM)Cells($)Modules($)Cells(MW)Modules(MW)NREL48NREL48Q12021U.S.ModuleImportsbyTariff•InQ12021,2.1GWDCofimportedPVmodules(33%ofallPVmoduleimports)didnotreportatariff.–In2020,55%ofimports(mostofwhichwerec-Si)didnotreportatariff.Thedifferenceislikelyduetotheremovalofthebifacialtariffexemptioninlate2020.•Forapproximately0.3GWofimportedc-Simodules—subjecttoSection201—nodutieswerereported.Whythishappenedisunclear.Note:Moduledatausescodes8541406015,8541406020,and8541406035.WeassumedallmodulesnotsubjecttoSection201tariffsarereportedunder“FreeunderHSChapters1-98”or“EnteredintoU.S.VirginIslands,”withexemptionscomingfromHTScode8541406015,andtechnologiesnotapplicablereportedunderHTScode854140603.WeassumeallpanelssubjecttoSection201dutieshavebeenreportedunder“Dutiable-HSchapter99.”WeadjustedThailand’sreportedimportsinmegawattsforFebruarybecauseofalikelyreportingerror.Source:Imports,byMW:U.S.InternationalTradeCommission,2021.Section201DutyReportedSection201Dutiable,butNoDutyReportedc-SiExemptfromSection201Thin-filmModules,notsubjecttoSection2010.00.51.01.52.02.53.03.54.04.5Section201DutyReportedNoSection201DutyReportedU.S.PVModuleImports(GW)NREL49NREL49CellImportDatabyTariff•A2.5-GWDCquotaexemptsthefirst2.5GWofimportedc-SiPVcellseachreportingyearsubjecttotheSection201tariff.–Inthefirst3yearsofthetariffs,theUnitedStatesdidnotreachthecap.•BasedonPVcellimportssinceFebruary2021,theUnitedStatesisprojectedtoexceedthecapinOctober;however,thishigherlevelisbecauseoftheweekofApril26–May3,whenmorethan250MWofcellswereimported.Excludingthatweek,theUnitedStateswouldstillbeprojectedtofallshortofthecap.Note:CelldatausesHTScodes8541406025.Sources:Imports,byMW:U.S.InternationalTradeCommission,2021;U.S.CustomsandProtectionCommodityStatusReports.00.511.522.533.5PVCellsImportedIntoU.S.(GW)U.S.PVCellImportCap(February2021–February2022)NREL50NREL50CalculatedU.S.ModulePricing•BasedonthereportedvalueandcapacityofimportedPVmodules,theaveragepriceofaPVmoduleintheUnitedStatesbeforetariffsdroppedfrom$0.39/WinQ22018to$0.27/WinQ12021.•Additionally,asaresultoftheunderlyingpricereductionandstepdownoftheSection201tariff,thesedutieshavebeencutby60%,onaper-wattbasis(fromapproximately$0.12/Wto$0.05/W).Sources:Imports,byValueandMW:U.S.InternationalTradeCommission,2020.$0.00$0.10$0.20$0.30$0.40$0.50$0.60Q2Q3Q4Q1Q2Q3Q4Q1Q2Q3Q4Q120182019202021CalculatedU.S.ModulePriceImportedvalue/Watt201TariffRateNREL51GlobalSolarDeployment1U.S.PVDeployment2PVSystemPricing3GlobalManufacturing4MarketActivity5ComponentPricing6PVPriceIncreases•Monoc-SiPVmodulepricesrose17%inthefirsthalfof2021,to$0.24/W—apricenotseensince2019.–Alargereasonforthisisbecausepolysilicon,thekeyfeedstocktomostPVmodules,wasup169%inH12021and352%y/y,to$28.5/kgattheendofJune;priceswereaslowas$6.3/kginMayandJuneof2020.•InQ12021,U.S.monoc-Simodulepriceswereflat—similartoglobaltrends—buttheywerestilltradingata55%premiumoverglobalASP.NREL52NREL52PVValueChainSpotPricing•Monoc-SiPVmodulepricesrose17%inthefirsthalfof2021,to$0.24/W—apricenotseensince2019.–Multic-SiPVmodulesrose22%to$0.21/W—apricealsonotseensince2019.•Polysiliconwasup169%inH12021and352%y/yto$28.5/kgattheendofJune;priceswereaslowas$6.3/kginMayandJuneof2020.–InJune2020,polysiliconrepresentedapproximately10%–15%ofmonoc-SimoduleASP.InJune2021,itrepresented40%–50%ofmonoc-SimoduleASP.Source:BloombergNEFSolarSpotPriceIndex(06/21/21).KilogramtoWattConversion:4.78gramsperwatt(2016);4.73gramsperwatt(2017),fromCowen&Co.(05/11/17)addDeutscheBank(07/19/17);4.35(2019);4.10(2019);3.85(2020);3.60(2021)fromBernreuter.$0.00$0.05$0.10$0.15$0.20$0.25$0.30AverageSellingPrice($/W)PolysiliconCells(mono)Modules(monoc-Si)Modules(multic-Si)NREL53NREL53ModuleAverageSellingPrice:GlobalversusUnitedStates•InQ12021,U.S.monoc-Simodulepriceswereflat—similartoglobaltrends—buttheywerestilltradingata55%premiumoverglobalASP.–BeforeQ42020,bifacialmodulesweretradingafewcentsbelowmonoc-SiintheUnitedStatesbecauseofanexemptiontotheSection201tariffs;however,thatexemptionwasremovedinQ42020.Source:WoodMackenziePower&Renewables/SEIA.$0.0$0.1$0.2$0.3$0.4$0.5$0.6$0.7$0.8Q1Q2Q3Q4Q1Q2Q3Q4Q1Q2Q3Q4Q1Q2Q3Q4Q1Q2Q3Q4Q1Q2Q3Q4Q12015201620172018201920202021PVModuleASP($/W)U.S.(multic-Si)Global(multic-Si)U.S.(monoc-Si)Global(monoc-Si)U.S.(bifacialmonoPERC)NREL54NREL54PVExperienceCurve•Thisexperiencecurvedisplaystherelationship,inlogarithmicform,betweentheaveragesellingpriceofaPVmoduleandthecumulativeglobalshipmentsofPVmodules.•ForeverydoublingofcumulativePVshipmentsfrom1976to2020,therehasbeenonaveragea~22%reductioninPVmoduleprice.•Since2008,thePVindustryhasexperiencedacceleratedimprovements,puttingmoduleASPsbelowthehistoricalexperiencecurvesince2012.–In2020,actualmodulepricingwas$0.33/W,whichwaswellbelowwhatthehistoricalexperiencecurvewouldhavesuggested($0.51/W).Source:SPVMarketResearch.ReportSPV-Supply9.April2021.0.11101001,00001101001,00010,000100,0001,000,00010,000,000ModuleASP(2019$/W)CumulativeGlobalShipments(MW)NREL55GlobalSolarDeployment1U.S.PVDeployment2PVSystemPricing3GlobalManufacturing4ComponentPricing5MarketActivity6ForcedLaborinChina•InH12021,theS&P500wasup14%,whilesolarstocksweredown13%.•H12021stockperformancesvariedbycompanyinpartduetoincreasesinmaterialcosts.NREL56NREL56$0$10$20$30$40$50$60$70$80$90Jan-19Apr-19Jul-19Oct-19Jan-20Apr-20Jul-20Oct-20Jan-21Apr-21PricePerSREC(SimpleAverage)Lower-PricedMarketsPAMDOHIn-stateSRECPricingSource:SRECTrade,https://www.srectrade.com/,accessed06/29/21.SRECTrade(06/04/21)•PennsylvaniaSRECshaveincreased64%in2021,withtheintroductionoflegislationtosignificantlyincreaseitsRPSsolarcarve-out.–AllotherSRECmarketswererelativelyflatorwentdown.•OnJune1,Maryland’supdatedRPSwaspassedintolaw.Itgivesthestatemoretimetogettoits14.5%solarcarve-outby2030(startingin2022)andincreasesthecompliancepaymentpenalties(startingin2023).$0$50$100$150$200$250$300$350$400$450$500Jan-19Apr-19Jul-19Oct-19Jan-20Apr-20Jul-20Oct-20Jan-21Apr-21PricePerSREC(SimpleAverage)Higher-PricedMarketsNJDCMANREL57NREL57StockMarketActivity•InH12021,theS&P500wasup14%,whilesolarstocksweredown13%.–ThedownturninsolarstocksislikelyduetoabroadercorrectionincleanenergyETFsafterthehugegainsthatfollowedlastyear’sU.S.presidentialelection.•H12021stockperformancesvariedbycompany.–InstallersandPVtrackermanufacturershavelostmarketvalueinpartduetoincreasesinmaterialcosts.–Polysiliconmanufacturershaveperformedwellduetoincreasedpolysiliconpricing.Note:TheTANindexisweightedtowardparticularcountriesandsectors.Asof08/31/20,52%ofitsfundswereinU.S.companies.Itstoptenholdings,representing63%ofitsvalue,wereSunrun,SolarEdge,Enphase,FirstSolar,Xinyi,VivintSolar,Daqo,SunPower,SolariaEnergia,andEncavis.Source:Stockmarket:YahooFinance(07/07/21).-100%-50%0%50%100%150%200%250%300%Jan-20Mar-20May-20Jul-20Sep-20Nov-20Jan-21Mar-21May-21Jul-21%Change(Index:01/02/20AdjustedClose)InvescoSolarETF(TAN)S&P500IndexRussell2000-80%-60%-40%-20%0%20%40%60%80%100%120%AtlanticYieldSunworksSunPowerSunnovaSunrunAzurePowerGinlongEnphaseEnergySolarEdgeArrayTech.SoltechSolargigaEnergyFirstSolarJinkoSolarCanadianSolarTainergyTechShunfengDaqoWackerChemieMeyerBurgerYieldcosInstallersInvertersTrackersPVManufacturersPolyEquip.IndividualStockPerformance(H12021)NREL58GlobalSolarDeployment1U.S.PVDeployment2PVSystemPricing3GlobalManufacturing4ComponentPricing5MarketActivity6PVPriceIncreases•PVsystemsarefacingsignificantupwardpressureforthefirsttimeinoveradecadebecauseofincreasesinpolysiliconpriceandsupply-chaindisruptionscausedinlargepartbytheCOVID-19pandemic.NREL59NREL59PVPriceIncreases•PVsystemsarefacingsignificantupwardpressureforthefirsttimeinoveradecade.–GlobalPVmodulepriceincreased17%inthefirst6monthsof2021,afterfallingbyapproximately90%overtheprevious10years.•The352%increaseinpolysiliconprice,thekeyrawmaterialforproducePVmodules,hasbeenattributedasthemajorculpritofincreasedPVmoduleprice.•Inlate2020andearly2021,therewasalsoasignificantshortageofEVAandglass.–PVsystempriceincreasesarebeingfeltasaresultoftheincreasedpricesofsteel,aluminum,andcopper—allmaterialsthatareusedtorackandwirePVmodules.–Additionally,someinverters(inparticularmicroinverters)areexpectingdelaysbecauseofthebroadersemiconductorshortage.–Finally,freightchargeshaveincreasedsignificantly,whichisparticularlyimpactfultosolarPVinstallationsinacountryliketheUnitedStatesthatimportsasignificantamountofPVequipment.•Developers,analysts,andmanufacturershavesaidthehigherpricesareaffectingdemandandmightdelayprojectsoutto2022.Sources:SeattleTimes(05/24/21);NortonRoseFulrbight(06/15/21).NREL60NREL60SolarModulePriceIncrease:Polysilicon•Polysiliconpricesincreasedthreefoldfrom$6.27/kginJune2020to$28.46/kginJune2021.–Thepriceincreasehasbeenattributedtoasupply/demandimbalancecausedbysignificantcapacityexpansioninwaferandcellmanufacturing.Nowthatpolysiliconisthelimitingfactor,downstreamentities(waferandcellproducers)havebeenstockpilingpolysiliconsuppliesinanticipationofgrowingdemand,especiallyaramp-upinutility-scaledeploymentinChina.•Although,newpolysiliconcapacitycameonlineinearly2021,expectedsurgingdemandlaterthisyearmeansshortagesareexpectedtopersistintheshorttermuntilpolysiliconcapacityexpansionscomeonlinein2022–2023.–PotentialtradebarriersmightalsoimpactpolysiliconpriceandavailabilitythroughtradebarriersfortheuseofpolysiliconproducedfromChina’sXinjiangregion,whichcurrentlyhosts35%ofglobalpolysiliconmanufacturingcapacity.Sources:Bloomberg5/23/21,PVTech4/24/21,PVMagazine5/18/21,BloombergNEFSolarSpotPriceIndex(06/21/21).$0$10$20$30$40$50$602011201220132014201520162017201820192020PolysiliconSpotPrice($/kg)NREL61NREL61GlobalPVDependenceofXinjiang•TheU.S.andsomeothercountriesarecurrentlyexaminingwaysoflimitingsolar-relatedproductsmanufacturedinXinjiangfromenteringtheirsupplychains,duetoconcernsoverforcedlaborintheregion.•While35%ofglobalpolysiliconmanufacturingcapacityiscurrentlylocatedinXinjiang,47%ofpolysiliconproducedin2020wasproducedinthatregion.–FactoriesinXinjiangoperatedabovecapacityin2020,whilefactoriesinotherregionssuspendedsomeoralloperationslastyearbecauseofflooding,explosions,oruneconomicmarketconditions.•Globalpolysiliconmanufacturingcapacityisexpectedtomorethandoubleinthenextfewyears,andasignificantamountofcapacityisunderconstructionorhasbeenannounced.–41%ofpolysiliconplantsunderconstructionareinXinjiang,butonly4%ofcapacityannouncementsarethere.–MostoftheannouncedcapacityisrepresentedbythreeChineseplantsoutsideofXinjiang:-501001502002503000100200300400500600700800900OperationConstructionAnnounced2020ProductionManufacturingCapacityGW(Assuming3g/W)MetricTons('000s)XinjiangOtherpartsofChinaOutsideChinaCompanyChineseProvinceScheduledOnlineYearCapacity(‘000MT)PotentialAdditionalCapacityEastHopeNingxia2023250150XinteInnerMongolia2022100100GCL-PolyInnerMongoliaN/A300N/ASources:BNEF,“2Q2021GlobalPVMarketOutlook;”“1Q2021GlobalPVMarketOutlook.”PVTech(03/01/21).BernreuterResearch(02/08/21,05/21/21).NREL62NREL62SemiconductorChipShortageOverviewAseveresemiconductorchipshortagehasaffectedmanyindustriessincemid-to-late2020,withtheautomotive,IT,andapplianceindustriesbeinghithardest.Theprimarycauseistwo-fold:•Intheshort-term,afasterthanexpectedeconomicrecoveryledmanymanufacturerstoquicklyscaleupchipordersafterscalingdownatthebeginningofthepandemic.Thisleftchipsuppliersunpreparedtomeetsurgingdemand,whichledtodelaysandlongwaittimes.Certainindustries(e.g.,microinverters)weremoreaffectedbecausechipmanufacturersprioritizedhighermarginproducts(e.g.,videogameconsoles).–EnphasereportedinQ1thatdespiteananticipateddemandboom,thefirmwilllikelybeconstrainedbychipsupplyforatleasttherestoftheyear.–SolarEdge,ontheotherhand,reportedlystockpiledenoughsupplytomeetdemandfortheyear.•Chipsuppliersacrosstheworldhaveindicatedanintenttoexpandcapacity,butthiscouldtakeayearormore,furthercontributingtotheshortage.Sources:Aljazeera(04/29/21);CNBC5/4/21,PVTech4/28/21,PVMagazine2/9/21,GreentechMedia8/26/20NREL63NREL63SolarModulePriceIncrease:ShippingandOtherMaterials•Freight/shippingcostshaveincreased3-4XinthepastthreequartersforshipmentsfromChinatotheWest(mostprominentlyforsolarmodules).–SuddendemandspikesacrossmanyindustriesforgoodsshippedfromChinatotheWesttriggeredthecostincreases.Itwasreportedthatonly4ofevery10containerssenttoNorthAmericafromChinaweresentback,with6remainingatthearrivalport.Somecontainershavebeensentbackemptybecauseoftheincreaseddemand.•Pricesformanysteelcommoditiesarealsoup,withsomeinputsdoublinginpricesinceearly2021.–Somefirmsinthesolarindustry,suchasthosethatmaketrackers,relyheavilyonsteel.Forexample,ArrayTechnologiesreportedthatalmosthalfthecostofthePVtrackersitproducesiscostrelatedtosteel.–Forbothsteelandshipping,whereimpactsarewidespreadacrosssectors,costsareexpectedtonormalizeoncetheeconomicrecoveryfromthepandemicreacheslaterstagesandsupplycancatchuptodemandacrossmoresectors.•AglassshortageinChina,wherepricesdoubledattheendof2020,continuedtoplagueChinesesolarsupplychainsinQ12021.–Theshortagewasdrivenbyacombinationofagrowingpreferenceforbifacialmodules,whichrequiremoreglass,largerformatpanels,andChina’senvironmentalregulations,whichhadrestrictedincreasesinglassproductioncapacity.–Analystsexpectshortagestopersistthroughoutthefirsthalfof2021,butnewcapacityisexpectedtocomeonlinelaterintheyear.Sources:Bloomberg5/23/21;HellenicShippingNews(06/04/21);NYTimes(03/06/21);PVMagazine1/29/215/18/216/3/21;Reuters12/3/20.www.nrel.govwww.nrel.govThankYouNREL/PR-7A40-80427SpecialthankstoNateBlair,AdamWarren,MikeMeshek,andMadelineSchroeder.NREL65NREL65ListofAcronymsandAbbreviations•ASPaveragesellingprice•BNEFBloombergNewEnergyFinance•CAPEXcapitalexpenditures•C&Icommercialandindustrial•C-Sicrystallinesilicon•CCcombinedcycle•CdTecadmiumtelluride•CSPconcentratingsolarpower•DCdirectcurrent•DPVdistributedPV•EIAU.S.EnergyInformationAdministration•ETFexchangetradedfund•EVAethyleenvinylacetate•FITfeed-in-tariff•G&Ageneralandadministrativeexpenses•GWgigawatt•GWhgigawatt-hour•H1firsthalfofyear•H2secondhalfofyear•HECOHawaiiElectricCompany•HIT/HJTheterojunction•IBCinterdigitatedbackcontact•IEAInternationalEnergyAgency•IPPindependentpowerproducer•IRENAInternationalRenewableEnergyAgency•ITCinvestmenttaxcredit•kgkilogram•kWkilowatt•kWhkilowatt-hour•LMIlowandmoderateincome•mmeter•MLPEmodule-levelpowerelectronics•Monoc-Simonocrystalline•Multic-Simulticrystalline•MWmegawatt•MWhmegawatt-hour•NEMnetenergymetering•PERCpassivatedemitterandrearcontact•Polypolysilicon•PPApowerpurchaseagreement•PUCpublicutilitiescommission•PVphotovoltaic•R&Dresearchanddevelopment•ROWrestofworld•Qquarter•S&PStandardandPoor’s•SEIASolarEnergyIndustriesAssociation•SG&Aselling,generalandadministrativeexpenses•SMARTSolarMassachusettsRenewableTarget•SRECsolarrenewableenergycertificate•TANInvescoSolarETF•TopContunneloxidepassivatedcontacts•TWterawatt•TWhterawatt-hour•Wwatt•y/yyearoveryear•YTDyeartodate

1、当您付费下载文档后,您只拥有了使用权限,并不意味着购买了版权,文档只能用于自身使用,不得用于其他商业用途(如 [转卖]进行直接盈利或[编辑后售卖]进行间接盈利)。
2、本站所有内容均由合作方或网友上传,本站不对文档的完整性、权威性及其观点立场正确性做任何保证或承诺!文档内容仅供研究参考,付费前请自行鉴别。
3、如文档内容存在违规,或者侵犯商业秘密、侵犯著作权等,请点击“违规举报”。

碎片内容

碳中和
已认证
内容提供者

碳中和

确认删除?
回到顶部
微信客服
  • 管理员微信
QQ客服
  • QQ客服点击这里给我发消息
客服邮箱