特斯拉可持续性能源发展“宏图计划”第三篇章(英)VIP专享VIP免费

Master Plan Part 3 – Sustainable Energy for All of Earth
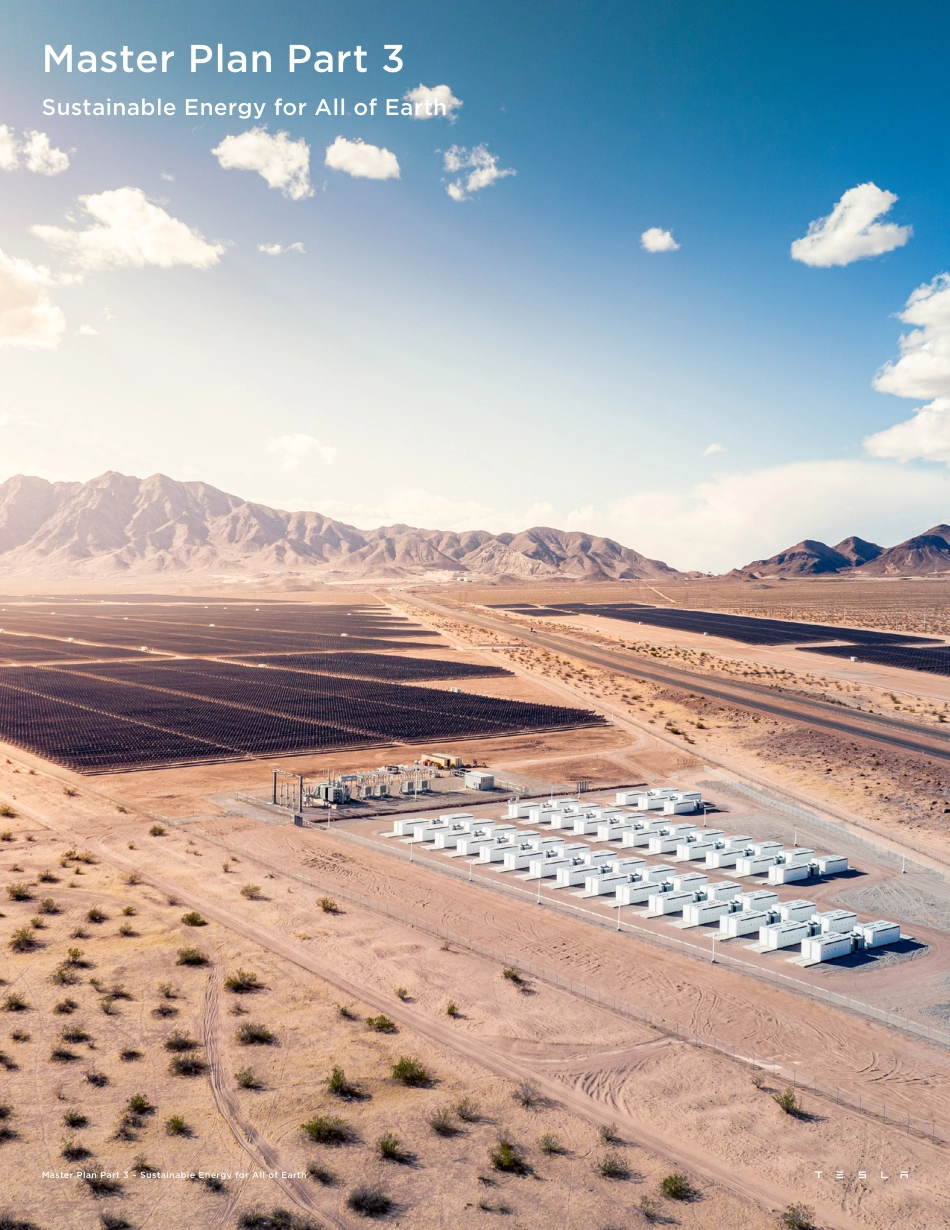
Master Plan Part 3
Sustainable Energy for All of Earth
02 Master Plan Part 3 – Sustainable Energy for All of Earth
Table of Contents
Executive Summary
The Current Energy Economy is Wasteful
The Plan to Eliminate Fossil Fuels
1. Repower the Existing Grid with Renewables
2. Switch to Electric Vehicles
3. Switch to Heat Pumps in Residential, Business & Industry
4. Electrify High Temperature Heat Delivery and Hydrogen
5. Sustainably Fuel Planes & Boats
6. Manufacture the Sustainable Energy Economy
Modeling The Fully Sustainable Energy Economy
Energy Storage Technologies Evaluated
Generation Technologies Evaluated
Model Results
US Only Model Results – Meeting New Electrification Demand
World Model Results – Meeting New Electrification Demand
Batteries for Transportation
• Vehicles
Ships and Planes
World Model Results – Electrification & Batteries for Transportation
Investment Required
Land Area Required
Materials Required
Conclusion
Appendix
Appendix: Generation and storage allocation to end-uses
Appendix: Build the Sustainable Energy Economy – Energy Intensity
03
04
05
05
05
07
09
12
12
13
18
19
20
20
21
22
22
23
24
26
30
31
37
38
38
39
Acknowledgements
We appreciate the many prior studies that have pushed the topic of
a sustainable energy economy forward, the work of the International
Energy Agency (IEA), U.S. Energy Information Administration (EIA),
U.S. Department of Energy National Laboratories, and the input from
various non-Tesla aliated advisors.
Tesla Contributors
Felix Maire
Matthew Fox
Mark Simons
Turner Caldwell
Alex Yoo
Eliah Gilfenbaum
Andrew Ulvestad
Tesla Advisors
Drew Baglino
Rohan Ma
Vineet Mehta
Published on April 5, 2023
03 Master Plan Part 3 – Sustainable Energy for All of Earth
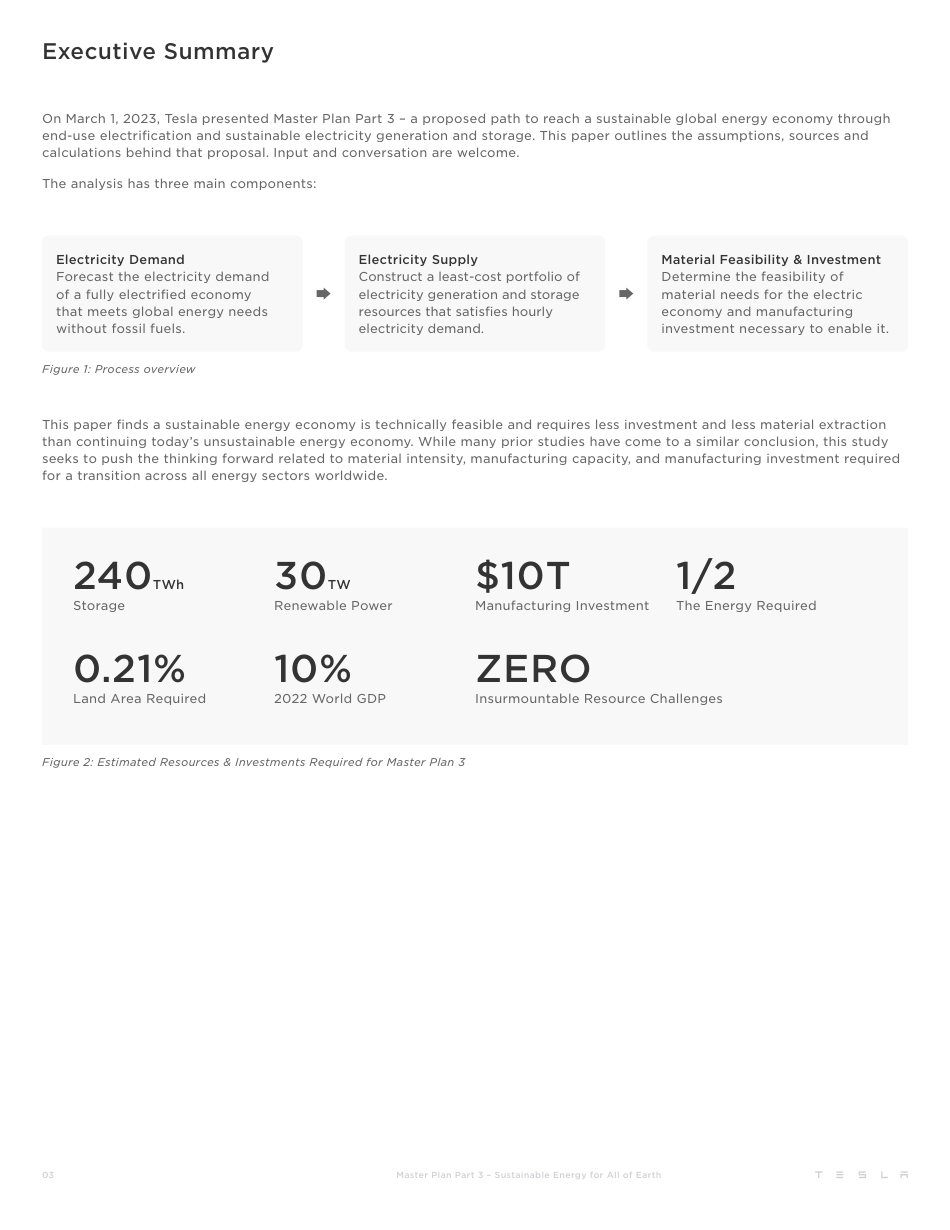
240TWh
Storage
$10T
Manufacturing Investment
0.21%
Land Area Required
ZERO
Insurmountable Resource Challenges
30TW
Renewable Power
1/2
The Energy Required
10%
2022 World GDP
On March 1, 2023, Tesla presented Master Plan Part 3 – a proposed path to reach a sustainable global energy economy through
end-use electrification and sustainable electricity generation and storage. This paper outlines the assumptions, sources and
calculations behind that proposal. Input and conversation are welcome.
The analysis has three main components:
This paper finds a sustainable energy economy is technically feasible and requires less investment and less material extraction
than continuing today’s unsustainable energy economy. While many prior studies have come to a similar conclusion, this study
seeks to push the thinking forward related to material intensity, manufacturing capacity, and manufacturing investment required
for a transition across all energy sectors worldwide.
Electricity Demand
Forecast the electricity demand
of a fully electrified economy
that meets global energy needs
without fossil fuels.
Electricity Supply
Construct a least-cost portfolio of
electricity generation and storage
resources that satisfies hourly
electricity demand.
Material Feasibility & Investment
Determine the feasibility of
material needs for the electric
economy and manufacturing
investment necessary to enable it.
Figure 2: Estimated Resources & Investments Required for Master Plan 3
Figure 1: Process overview
Executive Summary
MasterPlanPart3–SustainableEnergyforAllofEarthMasterPlanPart3SustainableEnergyforAllofEarth02MasterPlanPart3–SustainableEnergyforAllofEarthTableofContentsExecutiveSummaryTheCurrentEnergyEconomyisWastefulThePlantoEliminateFossilFuels1.RepowertheExistingGridwithRenewables2.SwitchtoElectricVehicles3.SwitchtoHeatPumpsinResidential,Business&Industry4.ElectrifyHighTemperatureHeatDeliveryandHydrogen5.SustainablyFuelPlanes&Boats6.ManufacturetheSustainableEnergyEconomyModelingTheFullySustainableEnergyEconomy•EnergyStorageTechnologiesEvaluated•GenerationTechnologiesEvaluatedModelResults•USOnlyModelResults–MeetingNewElectrificationDemand•WorldModelResults–MeetingNewElectrificationDemand•BatteriesforTransportation•Vehicles•ShipsandPlanes•WorldModelResults–Electrification&BatteriesforTransportationInvestmentRequiredLandAreaRequiredMaterialsRequiredConclusionAppendix•Appendix:Generationandstorageallocationtoend-uses•Appendix:BuildtheSustainableEnergyEconomy–EnergyIntensity0304050505070912121318192020212222232426303137383839AcknowledgementsWeappreciatethemanypriorstudiesthathavepushedthetopicofasustainableenergyeconomyforward,theworkoftheInternationalEnergyAgency(IEA),U.S.EnergyInformationAdministration(EIA),U.S.DepartmentofEnergyNationalLaboratories,andtheinputfromvariousnon-Teslaaffiliatedadvisors.TeslaContributorsFelixMaireMatthewFoxMarkSimonsTurnerCaldwellAlexYooEliahGilfenbaumAndrewUlvestadTeslaAdvisorsDrewBaglinoRohanMaVineetMehtaPublishedonApril5,202303MasterPlanPart3–SustainableEnergyforAllofEarth240TWhStorage$10TManufacturingInvestment0.21%LandAreaRequiredZEROInsurmountableResourceChallenges30TWRenewablePower1/2TheEnergyRequired10%2022WorldGDPOnMarch1,2023,TeslapresentedMasterPlanPart3–aproposedpathtoreachasustainableglobalenergyeconomythroughend-useelectrificationandsustainableelectricitygenerationandstorage.Thispaperoutlinestheassumptions,sourcesandcalculationsbehindthatproposal.Inputandconversationarewelcome.Theanalysishasthreemaincomponents:Thispaperfindsasustainableenergyeconomyistechnicallyfeasibleandrequireslessinvestmentandlessmaterialextractionthancontinuingtoday’sunsustainableenergyeconomy.Whilemanypriorstudieshavecometoasimilarconclusion,thisstudyseekstopushthethinkingforwardrelatedtomaterialintensity,manufacturingcapacity,andmanufacturinginvestmentrequiredforatransitionacrossallenergysectorsworldwide.ElectricityDemandForecasttheelectricitydemandofafullyelectrifiedeconomythatmeetsglobalenergyneedswithoutfossilfuels.ElectricitySupplyConstructaleast-costportfolioofelectricitygenerationandstorageresourcesthatsatisfieshourlyelectricitydemand.MaterialFeasibility&InvestmentDeterminethefeasibilityofmaterialneedsfortheelectriceconomyandmanufacturinginvestmentnecessarytoenableit.Figure2:EstimatedResources&InvestmentsRequiredforMasterPlan3Figure1:ProcessoverviewExecutiveSummary04MasterPlanPart3–SustainableEnergyforAllofEarthToday’sEnergyEconomy(PWh/year)AccordingtotheInternationalEnergyAgency(IEA)2019WorldEnergyBalances,theglobalprimaryenergysupplyis165PWh/year,andtotalfossilfuelsupplyis134PWh/year1ab.37%(61PWh)isconsumedbeforemakingittotheendconsumer.Thisincludesthefossilfuelindustries’self-consumptionduringextraction/refining,andtransformationlossesduringelectricitygeneration.Another27%(44PWh)islostbyinefficientend-usessuchasinternalcombustionenginevehiclesandnaturalgasfurnaces.Intotal,only36%(59PWh)oftheprimaryenergysupplyproducesusefulworkorheatfortheeconomy.AnalysisfromLawrenceLivermoreNationalLabshowssimilarlevelsofinefficiencyfortheglobalandUSenergysupply2,3.Figure3:GlobalEnergyFlowbySector,IEA&TeslaanalysisaThe2021and2022IEAWorldEnergyBalanceswerenotcompleteatthetimeofthiswork,andthe2020datasetshowedadecreaseinenergyconsumptionfrom2019,whichlikelywaspandemic-relatedandinconsistentwithenergyconsumptiontrends.bExcludedcertainfuelsuppliesusedfornon-energypurposes,suchasfossilfuelsusedinplasticsmanufacturing.TheCurrentEnergyEconomyisWasteful05MasterPlanPart3–SustainableEnergyforAllofEarthInanelectrifiedeconomywithsustainablygeneratedenergy,mostoftheupstreamlossesassociatedwithmining,refiningandburningfuelstocreateelectricityareeliminated,asarethedownstreamlossesassociatedwithnon-electricend-uses.Someindustrialprocesseswillrequiremoreenergyinput(producinggreenhydrogenforexample),andsomeminingandrefiningactivityneedstoincrease(relatedtometalsforbatteries,solarpanels,windturbines,etc.)Thefollowing6stepsshowtheactionsneededtofullyelectrifytheeconomyandeliminatefossilfueluse.The6stepsdetailtheelectricitydemandassumptionsforthesustainableenergyeconomyandleadstotheelectricitydemandcurvethatismodeled.ModelingwasdoneontheUSenergyeconomyusinghigh-fidelitydataavailablefromtheEnergyInformationAdministration(EIA)from2019-2022c,andresultswerescaledtoestimateactionsneededfortheglobaleconomyusinga6xscalingfactorbasedonthe2019energyconsumptionscalarbetweentheU.S.andtheworld,accordingtoIEAEnergyBalances.Thisisasignificantsimplificationandcouldbeanareaforimprovementinfutureanalyses,asglobalenergydemandsaredifferentfromtheU.S.intheircompositionandexpectedtoincreaseovertime.ThisanalysiswasconductedontheU.S.duetoavailabilityofhigh-fidelityhourlydata.Thisplanconsidersonshore/offshorewind,solar,existingnuclearandhydroassustainableelectricitygenerationsources,andconsidersexistingbiomassassustainablealthoughitwilllikelybephasedoutovertime.Additionally,thisplandoesnotaddresssequesteringcarbondioxideemittedoverthepastcenturyoffossilfuelcombustion,beyondthedirectaircapturerequiredforsyntheticfuelgeneration;anyfutureimplementationofsuchtechnologieswouldlikelyincreaseglobalenergydemand.01RepowertheExistingGridwithRenewablesTheexistingUShourlyelectricitydemandismodeledasaninflexiblebaselinedemandtakenfromtheEIA4.FourUSsub-regions(Texas,Pacific,Midwest,Eastern)aremodeledtoaccountforregionalvariationsindemand,renewableresourceavailability,weather,andgridtransmissionconstraints.Thisexistingelectricaldemandisthebaselineloadthatmustbesupportedbysustainablegenerationandstorage.Globally,65PWh/yearofprimaryenergyissuppliedtotheelectricitysector,including46PWh/yearoffossilfuels;howeveronly26PWh/yearofelectricityisproduced,duetoinefficienciestransformingfossilfuelsintoelectricityd.Ifthegridwereinsteadrenewablypowered,only26PWh/yearofsustainablegenerationwouldberequired.02SwitchtoElectricVehiclesElectricvehiclesareapproximately4xmoreefficientthaninternalcombustionenginevehiclesduetohigherpowertrainefficiency,regenerativebrakingcapability,andoptimizedplatformdesign.Thisratioholdstrueacrosspassengervehicles,light-dutytrucks,andClass8semisasshownintheTable1.cUShourlytimeseriesdatausedasmodelinputsareavailableathttps://www.eia.gov/opendata/browser/fordownload.dEmbeddedinthe26PWh/yearis3.5PWh/yearofusefulheat,mostlyproducedinco-generationpowerstations,whichgenerateheatandpowerelectricity.eTesla’sglobalfleetaverageenergyefficiencyincludingModel3,Y,SandXfTesla’sinternalestimatebasedonindustryknowledgeElectricVehiclesVehicleClassEfficiencyRatioICEVehicleAvg575MPGe(450Wh.mi)fLightTruck/Van4.3X17.5MPG115MPGe(292Wh.mi)ePassengerCar4.8X24.2MPG22MPGe(1.7kWh.mi)fClass8Truck4.2X5.3MPG(diesel)Table1:ElectricvsInternalCombustionVehicleEfficiencyThePlantoEliminateFossilFuels06MasterPlanPart3–SustainableEnergyforAllofEarthAsaspecificexample,Tesla’sModel3energyconsumptionis131MPGevs.aToyotaCorollawith34MPG6,7,or3.9xlower,andtheratioincreaseswhenaccountingforupstreamlossessuchastheenergyconsumptionrelatedextractingandrefiningfuel(SeeFigure4).Toestablishtheelectricitydemandofanelectrifiedtransportationsector,historicalmonthlyUStransportationpetroleumusage,excludingaviationandoceanshipping,foreachsub-regionisscaledbytheEVefficiencyfactorabove(4x)8.Tesla’shourbyhourvehiclefleetchargingbehavior,splitbetweeninflexibleandflexibleportions,isassumedastheEVchargingloadcurveinthe100%electrifiedtransportationsector.Supercharging,commercialvehiclecharging,andvehicleswith<50%stateofchargeareconsideredinflexibledemand.HomeandworkplaceACchargingareflexibledemandandmodeledwitha72-hourenergyconservationconstraint,modelingthefactthatmostdrivershaveflexibilitytochargewhenrenewableresourcesareabundant.Onaverage,Tesladriverschargeonceevery1.7daysfrom60%SOCto90%SOC,soEVshavesufficientrangerelativetotypicaldailymileagetooptimizetheirchargingaroundrenewablepoweravailabilityprovidedthereischarginginfrastructureatbothhomesandworkplaces.Globalelectrificationofthetransportationsectoreliminates28PWh/yearoffossilfueluseand,applyingthe4xEVefficiencyfactor,creates~7PWh/yearofadditionalelectricaldemand.Consumption[Wh/mi]ToyotaCorollaModel3120080010006004002000driveconsumptionupstreamlossesFigure4:ComparisonTeslaModel3vs.ToyotaCorollaThePlantoEliminateFossilFuels07MasterPlanPart3–SustainableEnergyforAllofEarth03SwitchtoHeatPumpsinResidential,Business&IndustryHeatpumpsmoveheatfromsourcetosinkviathecompression/expansionofanintermediaterefrigerant9.Withtheappropriateselectionofrefrigerants,heatpumptechnologyappliestospaceheating,waterheatingandlaundrydriersinresidentialandcommercialbuildings,inadditiontomanyindustrialprocesses.Airsourceheatpumpsarethemostsuitabletechnologyforretrofittinggasfurnacesinexistinghomes,andcandeliver2.8unitsofheatperunitofenergyconsumedbasedonaheatingseasonalperformancefactor(HSPF)of9.5Btu/Wh,atypicalefficiencyratingforheat-pumpstoday11.Gasfurnacescreateheatbyburningnaturalgas.Theyhaveanannualfuelutilizationefficiency(AFUE)of~90%12.Therefore,heatpumpsuse~3xlessenergythangasfurnaces(2.8/0.9).Figure5:HowHeatPumpsWork10AirExpansionEvaporationCompressionWaterGroundWasteHeatAirWaterSteamHeatedMaterialHeatSourceHeatSinkCondensationThePlantoEliminateFossilFuels08MasterPlanPart3–SustainableEnergyforAllofEarthResidentialandCommercialSectorsTheEIAprovideshistoricalmonthlyUSnaturalgasusagefortheresidentialandcommercialsectorsineachsub-region8.The3xheat-pumpefficiencyfactorreducestheenergydemandifallgasappliancesareelectrified.Thehourlyloadfactorofbaselineelectricitydemandwasappliedtoestimatethehourlyelectricitydemandvariationfromheatpumps,effectivelyascribingheatingdemandtothosehourswhenhomesareactivelybeingheatedorcooled.Insummer,theresidential/commercialdemandpeaksmid-afternoonwhencoolingloadsarehighest,inwinterdemandfollowsthewell-known“duck-curve”whichpeaksinmorning&evening.Globalelectrificationofresidentialandcommercialapplianceswithheatpumpseliminates18PWh/yearoffossilfuelandcreates6PWh/yearofadditionalelectricaldemand.InputEnergy/HeatDeliveredGasFurnaceHeatPump1.40.81.21.00.60.40.20.0energyconsumptionupstreamlossesFigure6:EfficiencyimprovementofspaceheatingwithheatpumpvsgasfurnaceFigure7:Residential&commercialheating&coolingloadfactorvstimeofday05101520PercentofAverageLoadTimeofDay[hr]140120907013010011080SummerWinterThePlantoEliminateFossilFuels09MasterPlanPart3–SustainableEnergyforAllofEarthIndustrialSectorIndustrialprocessesupto~200C,suchasfood,paper,textileandwoodindustriescanalsobenefitfromtheefficiencygainsofferedbyheatpumps13,althoughheatpumpefficiencydecreaseswithhighertemperaturedifferentials.Heatpumpintegrationisnuancedandexactefficienciesdependheavilyonthetemperatureoftheheatsourcethesystemisdrawingfrom(temperatureriseiskeyindeterminingfactorforheatpumpefficiency),assuchsimplifiedassumptionsforachievableCOPbytemperaturerangeareused:Temperature/ApplicationCOP60-100CHeatPump3.00-60CHeatPump4.0100-200CHeatPump1.5Table2:AssumedHeatPumpEfficiencyImprovementsbyTemperatureBasedonthetemperaturemake-upofindustrialheataccordingtotheIEAandtheassumedheatpumpefficiencybytemperatureinTable2,theweightedindustrialheatpumpefficiencyfactormodeledis2.214,15,16.TheEIAprovideshistoricalmonthlyfossilfuelusagefortheindustrialsectorforeachsub-region8.Allindustrialfossilfueluse,excludingembeddedfossilfuelsinproducts(rubber,lubricants,others)isassumedtobeusedforprocessheat.AccordingtotheIEA,45%ofprocessheatisbelow200C,andwhenelectrifiedwithheatpumpsrequires2.2xlessinputenergy16.Theaddedindustrialheat-pumpelectricaldemandwasmodeledasaninflexible,flathourlydemand.Globalelectrificationofindustrialprocessheat<200Cwithheatpumpseliminates12PWh/yearoffossilfuelsandcreates5PWh/yearofadditionalelectricaldemand.04ElectrifyHighTemperatureHeatDeliveryandHydrogenProductionElectrifyHighHeatIndustrialProcessesIndustrialprocessesthatrequirehightemperatures(>200C),accountfortheremaining55%offossilfueluseandrequirespecialconsideration.Thisincludessteel,chemical,fertilizerandcementproduction,amongothers.Thesehigh-temperatureindustrialprocessescanbeserviceddirectlybyelectricresistanceheating,electricarcfurnacesorbufferedthroughthermalstoragetotakeadvantageoflow-costrenewableenergywhenitisavailableinexcess.On-sitethermalstoragemaybevaluabletocosteffectivelyaccelerateindustrialelectrification(e.g.,directlyusingthethermalstoragemediaandradiativeheatingelements)17,18.ThePlantoEliminateFossilFuels10MasterPlanPart3–SustainableEnergyforAllofEarthIdentifytheoptimalthermalstoragemediabytemperature/applicationCharging=heatingthermalstoragemediawithelectricity,steam,hotair,etcThermalBatteryEnergy=massthermal_batteryheatcapacity∆TDischarging=coolingthermalstoragemediabyheatingsomethingelseFigure8:ThermalStorageOverviewDeliveringHeattoHighTemperatureProcessesWaterFluidstobeHeatedRadiantHeatDirectlytoProductSteamHotFluidsforDeliveryProcessMoltenSaltMoltenSalt(upto550C)AirHotAir(upto2000+C)Figure9A:ThermalStorage-HeatDeliverytoProcessviaHeatTransferFluidsFigure9B:ThermalStorage-HeatDeliverytoProcessviaDirectRadiantHeatingWaterEvaporatingMoltenSaltHeatingAirHeatingElectricresistanceheating,andelectricarcfurnaces,havesimilarefficiencytoblastfurnaceheating,thereforewillrequireasimilaramountofrenewableprimaryenergyinput.Thesehigh-temperatureprocessesaremodeledasaninflexible,flatdemand.Thermalstorageismodeledasanenergybufferforhigh-temperatureprocessheatintheindustrialsector,witharoundtripthermalefficiencyof95%.Inregionswithhighsolarinstalledcapacity,thermalstoragewilltendtochargemiddayanddischargeduringthenightstomeetcontinuous24/7industrialthermalneeds.Figure9showspossibleheatcarriersandillustratesthatseveralmaterialsarecandidatesforprovidingprocessheat>1500C.Globalelectrificationofindustrialprocessheat>200Celiminates9PWh/yearoffossilfuelfuelsandcreates9PWh/yearofadditionalelectricaldemand,asequalheatdeliveryefficiencyisassumed.ThePlantoEliminateFossilFuels11MasterPlanPart3–SustainableEnergyforAllofEarthFigure10:ThermalStorage-HeatStorageMedia30002000100025001500500050045004000350030002500200015001000Temperature(C)SpecificHeat(J/kgK)Graphite/CarbonAI203Si02MulliteSteelSandAluminumConcreteMoltenSaltThermalOilWaterNote:Bubblediametersrepresentspecificheatoverusablerange.SustainablyProduceHydrogenforSteelandFertilizerTodayhydrogenisproducedfromcoal,oilandnaturalgas,andisusedintherefiningoffossilfuels(notablydiesel)andinvariousindustrialapplications(includingsteelandfertilizerproduction).Greenhydrogencanbeproducedviatheelectrolysisofwater(highenergyintensity,nocarboncontainingproductsconsumed/produced)orviamethanepyrolysis(lowerenergyintensity,producesasolidcarbon-blackbyproductthatcouldbeconvertedintousefulcarbon-basedproducts)g.Toconservativelyestimateelectricitydemandforgreenhydrogen,theassumptionis:•Nohydrogenwillbeneededforfossilfuelrefininggoingforward•SteelproductionwillbeconvertedtotheDirectReducedIronprocess,requiringhydrogenasaninput.Hydrogendemandtoreduceironore(assumedtobeFe3O4)isbasedonthefollowingreductionreaction:ReductionbyH2•Fe3O4+H2=3FeO+H2O•FeO+H2=Fe+H2O•AllglobalhydrogenproductionwillcomefromelectrolysisgSustainablesteelproductionmayalsobeperformedthroughmoltenoxideelectrolysis,whichrequiresheatandelectricity,butdoesnotrequirehydrogenasareducingagent,andmaybelessenergyintensive,butthisbenefitisbeyondthescopeoftheanalysis19.ThePlantoEliminateFossilFuels12MasterPlanPart3–SustainableEnergyforAllofEarthhAdjustedcurrentdemandforhydrogen,removingdemandrelatedtooilrefining,asthatwillnotberequired.Assumedallofthehydrogenproducedfromcoalandnaturalgastodayisreplaced.Then,theenergyrequiredtoproducethehydrogenfromcoalandnaturalgas,comparedtoelectrolysis,iscalculated.iAccordingtotheIEA,85%ofnaturalgasnon-energyconsumptionisconsumedbyfertilizerandmethanolproduction05SustainablyFuelPlanes&BoatsBothcontinentalandintercontinentaloceanshippingcanbeelectrifiedbyoptimizingdesignspeedandroutestoenablesmallerbatterieswithmorefrequentchargestopsonlongroutes.AccordingtotheIEA,oceanshippingconsumes3.2PWh/yearglobally.Byapplyinganestimated1.5xelectrificationefficiencyadvantage,afully-electrifiedglobalshippingfleetwillconsume2.1PWh/yearofelectricity25.Shortdistanceflightscanalsobeelectrifiedthroughoptimizedaircraftdesignandflighttrajectoryattoday’sbatteryenergydensities26.Longerdistanceflights,estimatedas80%ofairtravelenergyconsumption(85Bgallons/yearofjetfuelglobally),canbepoweredbysyntheticfuelsgeneratedfromexcessrenewableelectricityleveragingtheFischer-Tropschprocess,whichusesamixtureofcarbonmonoxide(CO)andhydrogen(H2)tosynthesizeawidevarietyofliquidhydrocarbons,andhasbeendemonstratedasaviablepathwayforsyntheticjetfuelsynthesis27.Thisrequiresanadditional5PWh/yearofelectricity,with:-H2generatedfromelectrolysis21-CO2capturedviadirectaircapture28,29-COproducedviaelectrolysisofCO2Carbonandhydrogenforsyntheticfuelsmayalsobesourcedfrombiomass.Moreefficientandcost-effectivemethodsforsyntheticfuelgenerationmaybecomeavailableintime,andhigherenergydensitybatterieswillenablelonger-distanceaircrafttobeelectrifiedthusdecreasingtheneedforsyntheticfuels.Theelectricaldemandforsyntheticfuelproductionwasmodeledasaflexibledemandwithanannualenergyconstraint.Storageofsyntheticfuelispossiblewithconventionalfuelstoragetechnologies,a1:1volumeratioisassumed.Theelectricaldemandforoceanshippingwasmodeledasaconstanthourlydemand.Globalsustainablesyntheticfuelandelectricityforboatsandplaneseliminates7PWh/yearoffossilfuels,andcreates7PWh/yearofadditionalglobalelectricaldemand.06ManufacturetheSustainableEnergyEconomyAdditionalelectricityisrequiredtobuildthegenerationandstorageportfolio-solarpanels,windturbinesandbatteries-requiredforthesustainableenergyeconomy.Thiselectricitydemandwasmodeledasanincremental,inflexible,flathourlydemandintheindustrialsector.MoredetailscanbefoundintheAppendix:BuildtheSustainableEnergyEconomy-EnergyIntensity.Thesesimplifiedassumptionsforindustrialdemand,resultinaglobaldemandof150Mt/yrofgreenhydrogen,andsourcingthisfromelectrolysisrequiresanestimated~7.2PWh/yearofsustainablygeneratedelectricityh,20,21.Theelectricaldemandforhydrogenproductionismodeledasaflexibleloadwithannualproductionconstraints,withhydrogenstoragepotentialmodeledintheformofundergroundgasstoragefacilities(likenaturalgasisstoredtoday)withmaximumresourceconstraints.Undergroundgasstoragefacilitiesusedtodayfornaturalgasstoragecanberetrofittedforhydrogenstorage;themodeledU.S.hydrogenstoragerequires~30%ofexistingU.S.undergroundgasstoragefacilities22,23.Notethatsomestoragefacilities,suchassaltcaverns,arenotevenlygeographicallydispersedwhichmaypresentchallenges,andtheremaybebetteralternativestoragesolutions.Globalsustainablegreenhydrogeneliminates6PWh/yearoffossilfuelenergyuse,and2PWh/yearofnon-energyusei,24.Thefossilfuelsarereplacedby7PWh/yearofadditionalelectricaldemand.ThePlantoEliminateFossilFuels13MasterPlanPart3–SustainableEnergyforAllofEarthThese6stepscreateaU.S.electricaldemandtobefulfilledwithsustainablegenerationandstorage.Todoso,thegenerationandstorageportfolioisestablishedusinganhourlycost-optimalintegratedcapacityexpansionanddispatchmodelj.Themodelissplitbetweenfoursub-regionsoftheUSwithtransmissionconstraintsmodeledbetweenregionsandrunoverfourweather-years(2019-2022)tocapturearangeofweatherconditionsk.InterregionaltransmissionlimitsareestimatedbasedonthecurrentlinecapacityratingsonmajortransmissionpathspublishedbyNorthAmericanElectricityReliabilityCouncil(NERC)RegionalEntities(SERC30,WECC31,ERCOT32).Figure11showsthefullyelectrifiedeconomyenergydemandforthefullUS.ModeledRegionsandGridInterconnectionsMap1:USModeledRegionsandInterconnectionsPacificMidwestEasternTexas24GW37GW28GW20GWjConvexoptimizationmodelsthatcandetermineoptimalcapacityexpansionandresourcedispatcharewidelyusedwithintheindustry.Forinstance,byutilitiesorsystemoperatorstoplantheirsystems(e.g.,generationandgridinvestmentsrequiredtomeettheirexpectedload),ortoassesstheimpactofspecificenergypoliciesontheenergysystem.Thismodelbuildstheleast-costgenerationandstorageportfoliotomeetdemandeveryhourofthefour-yearperiodanalyzedanddispatchesthatportfolioeveryhourtomeetdemand.Thecapacityexpansionanddispatchdecisionsareoptimizedinonestep,whichensurestheportfolioisoptimalovertheperiodanalyzed,storagevalueisfullyreflectedandtheimpactofweathervariabilitymodeled.Otheranalysestypicallymodelcapacityexpansionandportfoliodispatchastwoseparatesteps.Thecapacityexpansiondecisionsaremadefirst(e.g.howmuchgenerationandstorageisestimatedtobetheleast-costportfoliooverthetimehorizon),followedbyseparatedispatchmodelingoftheportfoliomix(e.g.howmuchgenerationandstorageshouldbedispatchedineachhourtomeetdemandwithsufficientoperatingreserves).Thetwo-stageapproachproducespseudo-optimalresults,butallowsmorecomputationallyintensivemodelsateachstage.kThemodelisconstrainedtomeeta15%operatingreservemargineveryhourtoensurethisgenerationandstorageportfolioisrobusttoarangeofweatherandsystemconditionsbeyondthoseexplicitelymodeled.ModelingtheFullySustainableEnergyEconomy14MasterPlanPart3–SustainableEnergyforAllofEarthWindandsolarresourcesforeachregionaremodeledwiththeirrespectivehourlycapacityfactor(i.e.,howmuchelectricityisproducedhourlyperMWofinstalledcapacity),itsinterconnectioncostandthemaximumcapacityavailableforthemodeltobuild.Thewindandsolarhourlycapacityfactorsspecifictoeachregionwereestimatedusinghistoricalwind/solargenerationtakenfromEIAineachregion,thuscapturingdifferencesinresourcepotentialduetoregionalweatherpatternsl,m.CapacityfactorswerescaledtorepresentforwardlookingtrendsbasedontherecentPrincetonNet-ZeroAmericastudy33.Figure11showsthehourlycapacityfactorforwind&solarversustimeforthefullUS.Table3showstheaveragecapacityfactoranddemandforeachregionoftheUS.lEIAdoesnotreportoffshorewindproductionfortheperiodanalyzedgiventhelimitedexistingoffshorewindinstalledcapacity.TheoffshorewindgenerationprofilewasestimatedbyscalingthehistoricalonshorewindgenerationprofiletotheoffshorewindcapacityfactorestimatedbythePrincetonNet-ZeroAmericastudy.mEachregionismodeledwithtwoonshorewindandtwosolarresourceswithdifferentcapacityfactor,interconnectioncostandmaximumpotential.Thisaccountsforthefactthatthemosteconomicsitesaretypicallybuiltfirstandsubsequentprojectstypicallyhavelowercapacityfactorsand/orhigherinterconnectioncostastheymaybefartherlocatedfromdemandcentersrequiringmoretransmissionorinlocationswithhighercostland.TotalDemand[GW]18001400800160010002001200400600Jan‘19Jul‘19Jul‘20Jan‘22Jan‘20Jul‘21Jan‘21Jul‘22GreenHydrogenNewIndustryIndustrialHeatPumps(<200CElectrifiedTransportationIndustrialHeat(>200C)SyntheticFuelsResidential&CommercialHeatPumpsExistingElectricalDemand(AllSectors)Figure11:USFullyElectrifiedHourlyDemandModelingtheFullySustainableEnergyEconomy15MasterPlanPart3–SustainableEnergyforAllofEarthSolarCFRegionDemand[PWh/yr]WindCF27%23%MidwestTexas3.61.640%37%22%East4.629%27%24%PacificFullU.S.1.911.636%34%Table3:Windandsolaraveragehistoricalcapacityfactor,andfullyelectrifiedeconomydemandbyregionThemodelbuildsgenerationandstoragebasedonresource-specificcostandperformanceattributes,andaglobalobjectiveofminimizingthelevelizedcostofenergyn.Themodelassumesincreasedinter-regionaltransmissioncapacitieso.Toprovidereliableyear-roundpower,itiseconomicallyoptimaltodeployexcesssolarandwindcapacity,whichleadstocurtailment.Curtailmentwillhappenwhen(1)solarand/orwindgenerationishigherthantheelectricitydemandinaregion,(2)storageisfulland(3)thereisnoavailabletransmissioncapacitytotransmittheexcessgenerationtootherregions.Thereisaneconomictradeoffbetweenbuildingexcessrenewablegenerationcapacity,buildinggridstorage,orexpandingtransmissioncapability.Thattradeoffmayevolveasgridstoragetechnologiesmature,butwiththeassumptionsmodeled,theoptimalgenerationandstorageportfolioresultedin32%curtailment.nCostsconsideredintheobjectivefunction:levelizedcapexofnewgenerationandstoragewitha5%discountrate,fixedandvariableoperationalandmaintenance(O&M)costs.o37GWoftransmissioncapacityismodeledbetweentheMidwestandtheEast,28GWbetweenTexasandtheEast,24GWbetweenPacificandtheMidwestand20GWbetweenTexasandtheMidwest.Thiscorrespondsto~3%ofthemodeledcombinedregionalpeakload.E.g.,thepeakloadofthecombinedEastandMidwestregionswas~1.2TW,andthetransmissioncapacitybetweenMidwestandtheEastmodeledas37GW.Currently,thetransmissioncapacityis<1%ofthecombinedregionalpeakloads(withtransmissionto/fromTexasthelowest).Highertransmissioncapacitiesgenerallyreducethetotalgenerationandstoragebuildout,butthereisaneconomictradeoffbetweenbuildingmoretransmissionandbuildingmoregenerationplusstorage.CapacityFactor[%]9070503010Jan‘19Jul‘19Jul‘20Jul‘21Jan‘20Jan‘21Jan‘22Jul‘22SolarResourcesWindResourcesFigure12:USHistoricalHourlyRenewableCapacityFactorModelingtheFullySustainableEnergyEconomy16MasterPlanPart3–SustainableEnergyforAllofEarthForcontext,curtailmentalreadyexistsinmarketswithhighrenewableenergypenetration.In2020,19%ofthewindgenerationinScotlandwascurtailed,andin2022,6%ofsolargenerationinCalifornia(CAISO)wascurtailedduetooperationalconstraints,suchasthermalgenerators’inabilitytorampdownbelowtheirminimumoperatinglevel,orlocalcongestiononthetransmissionsystem34,35.Thesustainableenergyeconomywillhaveanabundanceofinexpensiveenergyforconsumersabletouseitduringperiodsofexcess,whichwillimpacthowandwhenenergyisused.InFigure12below,hourlydispatchisdepictedacrossasampleoffalldays,showingtheroleofeachgenerationandstorageresourceinbalancingsupplyanddemand,aswellastheconcentrationofeconomiccurtailmentinthemiddleofthedaywhensolarisabundant.GW1,2008002001,000600400Oct31Nov01Nov02Nov03HydrogenStorageChargingLithium-ionStorageDischargingNuclearGenerationThermalStorageChargingSolarPV-GenerationTotalDemandHydrogenStorageDischargingLithium-ionStorageChargingHydroGenerationWindGenerationWind-CurtailmentThermalStorageDischargingSolarPV-CurtailmentFigure13:Hourlygenerationin2019inUSEasternregion(excludingimports/exports)ModelingtheFullySustainableEnergyEconomy17MasterPlanPart3–SustainableEnergyforAllofEarthGeneration(GW)HydrogenStorageStateofEnergy(TWh)HydrogenStorageStateofEnergySolar+WindGenerationPre-CurtailmentFigure14:SeasonalityofHydrogenstoragecharginganddischarginginUSEasternregion(monthlyaverage)InFigure14,hydrogenstorageisgenerallyfilledduringtheshouldermonths(springandfall)whenelectricitydemandislowerasheatingandcoolingseasonsareover,andsolarandwindgenerationisrelativelyhigh.Similarly,asexcessgenerationdeclinesinsummerandwintermonths,hydrogenreservoirsdeclineprovidinginter-seasonalhydrogenstorage.Jan‘19Jul‘19Jan‘20Jul‘20Jan‘21Jul‘21Jan‘22Jul‘22302520101550900800700500600400300ModelingtheFullySustainableEnergyEconomy18MasterPlanPart3–SustainableEnergyforAllofEarthForstationaryapplications,theenergystoragetechnologiesinTable4below,whicharecurrentlydeployedatscale,areconsidered.Li-ionmeansLiFePO4/Graphitelithium-ionbatteries.Arangeofconservativefutureinstalledcostsarelistedforlithiumiongiventhevolatilityincommoditiesprices(especiallylithium).Whilethereareotheremergingtechnologiessuchasmetal-air(Fe<->Fe2O3redoxcouple)andNa-ion,thesearenotcommerciallydeployedandthereforenotconsidered.Lifetime20yearsr100years50+years100years20yearsr2030-2040InstalledCostp$78/kWhrNA$19/kgofH239>$270/kWh36$184-$231/kWhrRTE95%r-98%80%4495%rStorageMechanical-H2-E-chemTechnicalPotential(limitation)Industrialthermalloadsonly<90TWh(volume&in-flows)37-<26TWh(reservoirvolumes)36-O&MCost(/kW-yr)$15.00qNANA$17.8044$0.8038AnnualCyclingLimitNA~5.7(in-flowlimited)NANA365rTechnologyThermal(15h)SeasonalHydro(~2mo)Geological/SaltCavernsPumpedHydroLi-ion(4h-8h)Table4:EnergyStorageTechnologiesEvaluatedpThisincludesthestorageequipmentcost,balanceofsystem,interconnectionandinstallationcost.qEfficiencyfortheelectricitytothermalconversion.Themodeldoesnotincludegeneratingelectricityfromheat.EnergyStorageTechnologiesEvaluated19MasterPlanPart3–SustainableEnergyforAllofEarthO&MCost(/kW-yr)$15.9741$76.5144$127.3541$27.5741$61.4144$99.3244Lifetime30years4430yearss<80years30yearss100years30years44GenerationSolarOffshoreWindNuclearOnshoreWindHydroGeothermalUSTechnicalPotential(limitation)<153TW(availableland)42<1TW43,45NA(deploymentpace)<11TW(availableland)42<152GW(riverflowrates)46<100GWuCapacityFactor23-28%4048-49%40ModelingOutput36-52%40NA>95%47ModelConstraintTechnicalpotentialperregion/resourceclass40Technicalpotentialperregion/resourceclass40TechnologyonlyavailableinEastregionNoNewNuclearTechnicalpotentialperregion/resourceclass40152GWExogenouslyBuiltNoNewBuild2030-2040InstalledCost$752/kW44+interconnection40$2,401/kW44+interconnection40$10,500/kWt$855/kW44+interconnection40$4,200/kW44to$7,000/kW$5,616/kW44Table5:GenerationTechnologiesEvaluatedrInternalestimate.sAssumedlifetimeimprovement.TheNREL2019CostofWindEnergyReviewestimateswindcostwith25-yearlifetimeasreferenceandcreatessensitivitieswith30-yearlifetimetAssumed50%highercapexthantheEIACostandPerformanceCharacteristicsofNewGeneratingTechnologiesuExcludingDeepEnhancedGeothermalSystemResourcesTheTablebelowdetailsallthegenerationtechnologiesconsideredinthesustainableenergyeconomy.Installedcostsweretakenfromstudiesfor2030-2040fromNRELandthePrincetonNet-ZeroAmericastudy.GenerationTechnologiesEvaluated20MasterPlanPart3–SustainableEnergyforAllofEarthUSOnlyModelResults–MeetingNewElectrificationDemandFortheUS,theoptimalgenerationandstorageportfoliotomeettheelectricitydemand,eachhour,fortheyearsmodeledisshownintheTablebelow.AnnualGenerationCurtailedw(TWh)InstalledCapacity(GW)InstalledCapacity(GW)AnnualGenerationv(TWh)InstalledCapacity(TWh)ElectricityGenerationTechnologyStorage/OtherTechnologies1,7211,9718156,0606.5OnshoreWind8hLithium-ionStorage2,4313,0524184,046NaSolarPVElectrolyzerNa1521,686620120HydroTotal62644532126.9OffshoreWindIndustrialThermalStorageNa99Na699107Nuclear(Existing)HydrogenStoragex4,2145,33811,637TotalTable6:ModelResultsforUSonlyvAfteraccountingforcurtailment.wThemodelcurtailswind/solargenerationwhentheelectricitysupplyishigherthantheelectricitydemandandbattery/thermal/hydrogenstoragearefullalready.Curtailedwind/solargenerationisgenerationthatisn’tconsumedbyend-uses.x17.8TWhofjetfuelderivedfromH2arestoredwithcurrentinfrastructureySolarandstorageisdeployedatlessthanone-thirdofsuitableresidentialbuildingsdesignatedbyNREL.FourhoursofstorageisassumedforC&Ideploymentandforbackupgeneratorsubstitution.ModelResultsInaddition,1.2TWhofdistributedstationarybatteriesareaddedbasedonincrementaldeploymentsofdistributedstationarystoragealongsiderooftopsolaratresidentialandcommercialbuildings.Thisincludesstoragedeploymentsat15millionsingle-familyhomes48withrooftopsolar,industrialstoragepairedwith43GW49,50ofcommercialrooftopsolar,andstoragereplacementofatleast200GW51ofexistingbackupgeneratorcapacityy.Distributedstoragedeploymentsareexogenoustothemodeloutputsgivendeploymentdrivenbyfactorsnotfullyreflectedinaleast-costmodelframework,includingend-userresiliencyandself-sufficiencywhenstorageispairedwithrooftopsolar.21MasterPlanPart3–SustainableEnergyforAllofEarthApplyingthe6stepstotheworld’senergyflowwoulddisplaceall125PWh/yearoffossilfuelsusedforenergyuseandreplacethemwith66PWh/yearofsustainablygeneratedelectricityz.Anadditional4PWh/yearofnewindustryisneededtomanufacturetherequiredbatteries,solarpanelsandwindturbines(assumptionscanbefoundinAppendix:BuildtheSustainableEnergyEconomy–EnergyIntensity).TheglobalgenerationandstorageportfoliotomeettheelectricitydemandwascalculatedbyscalingtheUSresourcemixby6x.Asnotedabove,thisisasignificantsimplificationandcouldbeanareaforimprovementinfutureanalyses,asglobalenergydemandsaredifferentfromtheU.S.intheircompositionandexpectedtoincreaseovertime.ThisanalysiswasconductedontheU.S.duetoavailabilityofhigh-fidelityhourlydata.SustainableEnergyEconomy[PWh/year]Figure15:SustainableEnergyEconomy,GlobalEnergyFlowbySector,IEA&TeslaanalysiszRemaining~9PWh/yearoffossilfuelsareconsumedthroughnon-energyusesWorldModelResults–MeetingNewElectrificationDemand22MasterPlanPart3–SustainableEnergyforAllofEarthVehiclesTodaythereare1.4Bvehiclesgloballyandannualpassengervehicleproductionof~85Mvehicles,accordingtoOICA.Basedonpacksizeassumptions,thevehiclefleetwillrequire112TWhofbatteriesaa.Autonomyhaspotentialtoreducetheglobalfleet,andannualproductionrequired,throughimprovedvehicleutilization.Standard-rangevehiclescanutilizethelowerenergydensitychemistries(LFP),whereaslong-rangevehiclesrequirehigherenergydensitychemistries(highnickel).Cathodeassignmenttovehiclesegmentislistedinthetablebelow.HighNickelreferstolowtozerocobaltNickelManganesecathodescurrentlyinproduction,underdevelopmentatTesla,Tesla’ssuppliersandinresearchgroups.aaToapproximatethebatterystoragerequiredtodisplace100%ofroadvehicles,theglobalfleetsize,packsize(kWh)/Globalpassengerfleetsizeandannualproduction(~85Mvehicles/year)isbasedondatafromOICA.ThenumberofvehiclesbysegmentisestimatedbasedonS&PGlobalsalesdata.Forbusesandtrucks,theUS-to-globalfleetscalarof~5xisusedasglobaldatawasunavailableTeslaEquivalentVehicleSalesCathodeGlobalFleetGlobalFleet(TWh)VehicleTypePackSize(kWh)[TBD]42MLFP686M36Compact53[TBD]10MSemiHeavy2MHighNickel163M16HighNickel13.3M11Commercial/PassengerVans100LongRangeHeavyTruck800[TBD]1MLFP5M2Bus300Model3/Y24MSemiLight1MLFP380M28LFP6.7M3Midsized75ShortRangeHeavyTruck500ModelS/X,Cybertruck9M-89MHighNickel149M15-1,403M112LargeSedans,SUVs&Trucks100Total-Table7:VehicleFleetBreakdownBatteriesforTransportation23MasterPlanPart3–SustainableEnergyforAllofEarthGlobalElectricFleet40M380M20M300M700MShipsandPlanesWith2.1PWhofannualdemand,ifshipscharge~70timesperyearonaverage,andchargeto75%ofcapacityeachtime,then40TWhofbatteriesareneededtoelectrifytheoceanfleet.Theassumptionis33%ofthefleetwillrequireahigherdensityNickelandManganesebasedcathode,and67%ofthefleetwillonlyrequirealowerenergydensityLFPcathode.Foraviation,if20%ofthe~15,000narrowbodyplanefleetiselectrifiedwith7MWhpacks,then0.02TWhofbatterieswillberequired.Theseareconservativeestimatesandlikelyfewerbatterieswillbeneeded.LongerRangeShipPlaneNi/MnBasedHighNickel120.02CathodeGlobalFleet(TWh)ShorterRangeShipTotalLFP-2840Table8:ElectricShipandPlaneFleetBreakdownBatteriesforTransportation24MasterPlanPart3–SustainableEnergyforAllofEarthTable9summarizesthegenerationandstorageportfoliotomeettheglobalelectricitydemandandthetransportationstoragerequiredbasedonthevehicle,shipandplaneassumptions.Explanationofhowthegenerationandstorageportfolioswereallocatedtoend-usescanbefoundinAppendix:Generationandstorageallocationtoend-uses.VehicleBatteries(TWh)StationaryThermalBatteries(TWh)Planes&ShipsBatteries(TWh)SolarGeneration(TW)Solar+Wind(TW)WindGeneration(TW)Electrolyzers(TW)HydrogenStorage(TWh)StationaryE-chemBatteries(TWh)---6.810.63.8--RepowertheExistingGridwithRenewables22.9--11241.4-2.74.82.1--4018.330.312.12.5642SwitchtoHeatPumpsinResidential,Business&Industry6.7Total46.2---2.13.71.62.5642Hydrogen4.4112----3.34.91.5--402.13.71.6--SwitchtoElectricVehicles3.7SustainablyFuelPlans&Boats4.4-41.4-1.32.81.5--ElectrifyHighTemperatureHeatDelivery4.1Table9:GenerationandStoragePortfoliotoMeettheGlobalElectricityDemand&TransportationBatteriesWorldModelResults–Electrification&TransportationBatteries25MasterPlanPart3–SustainableEnergyforAllofEarthTable11:Solar&WindWaterfall2520353015105Solar&WindFarms(TW)115534430Table10:StorageWaterfallRepowertheExistingGridwithRenewablesRepowertheExistingGridwithRenewablesSwitchtoHeatPumpsSwitchtoHeatPumpsSustainablyFuelPlanes&BoatsSustainablyFuelPlanes&BoatsSwitchtoElectricVehiclesSwitchtoElectricVehiclesSustainablyProduceHydrogenSustainablyProduceHydrogenElectrifyHighTemperatureHeatDeliveryElectrifyHighTemperatureHeatDeliveryTotalTotal20025015010050Vehicle&StationaryBatteries(TWh)23116746444240WorldModelResults–Electrification&BatteriesforTransportation26MasterPlanPart3–SustainableEnergyforAllofEarthASustainableEnergyEconomyis60%theCostofContinuingFossilFuelInvestmentsInvestmentcataloguedhereisinclusiveofthemanufacturingfacilities,miningandrefiningoperationsformaterialsthatrequiresignificantgrowth,andhydrogenstoragesaltcaverninstallation.Manufacturingfacilitiesaresizedtothereplacementrateofeachasset,andupstreamoperations(e.g.,mining)aresizedaccordinglybb.Materialsthatrequiresignificantcapacitygrowthare:Formining:nickel,lithium,graphiteandcopper.Forrefining:nickel,lithium,graphite,cobalt,copper,batterygradeironandmanganese.Inadditiontoinitialcapex,5%/yearmaintenancecapexwitha20-yearhorizonisincludedintheinvestmentestimate.Usingtheseassumptions,buildingthemanufacturinginfrastructureforthesustainableenergyeconomywillcost$10trillioncc,ascomparedtothe$14trillionprojected20-yearspendonfossilfuelsatthe2022investmentrate52.Dollarsofcapitalinvestment[Trillions]20yearsofinvestmentInfossilfuelsAt2022rate20yearsinvestmentinSustainableenergyeconomy$16$10$8$14$12$6$4$4$-CoalNaturalGasOilFigure16:InvestmentComparisonbbForexample,if46TWhofstationaryLFPbatterystorageisrequired,andthelifeofabatteryis20years,thenthemanufacturingcapacityissizedto2.3TWh/yearccIn-scopemanufacturingcapacityinvestments:windturbines,solarpanels,batterycells,upstreambatteryinputs,mining,refining,electricvehicles,heatpumps,andelectrolyzers,carboncapture,andFischerTropsch.Saltcavernhydrogenstorageisalsoincluded$10T$14TInvestmentRequired27MasterPlanPart3–SustainableEnergyforAllofEarthSolarPanelFactories610$424BGW/yr.$212B$347.3MFirstSolarAlabamafactoryestimate,plusinternalestimateforsolarrecyclingGeneration-Mining/Refining1,013$277BGW/yr.$138B$136.6MInternalestimateofindustryaveragebasedonpublicindustryreportsStationaryE-chemFactories(e.g.Megapack)2,310$46BGWh/yr.$23B$10MInternalestimateofindustryaverageElectrolyzers2.5B$1,155BkW/yr.$577B$230AssumesPEMTechnology;costwilldependonlearningcurveachieved53VehicleFactories89M$1,780BCar/yr.$890B$10KInternalestimateofindustryaverageUpstreamE-chemforStationary2,070$67BGWh/yr.$34B$16.2MInternalestimateTransportation-Mining/Refining9,178$1,674BGWh/yr.$837B$91.2MInternalestimateofindustryaveragebasedonpublicindustryreportsFischerTropsch(syntheticfuels)Total5.5M-$770B$10,421BBarrelperday-$385B$5,211B$70K-Assumesefficiencycurveasprojectscaleincreases56-CategoryAnnualCapacity(units)TotalInvestment(includes20yrs.of5%sustainingcapex)UnitInitialInvestmentCapitalIntensity/UnitNotes/SourceStationary-Mining/Refining2,310$378BGWh/yr.$189B$81.9MInternalestimateofindustryaveragebasedonpublicindustryreportsE-chemBatteryFactories11,488$2,183BGWh/yr.$1,091B$95MInternalestimateofIndustryavg,includesrecyclingHeatPumpsNa$60BTotal$30BNaAssume$3Bmfgcapextoreplacehomeheatpumps;conservatively$30BforallheatpumpsWindTurbineFactories402$21BGW/yr.$11B$26.5MInternalestimateUpstreamE-chemforVehicles9,178$443BGWh/yr.$221B$24.1MInternalestimateStationaryThermalFactories2,070$99BGWh/yr.$50B$24MInternalestimateCarbonCapture(syntheticfuels)HydrogenStorage800MNA$320B$725BTonCO2/yr.kg$160B$362B$200$19Yettobedemonstratedatlargescale;costwilldependonlearningcurveachieved54,55$19/kg39Table12:InvestmentSummaryInvestmentRequired28MasterPlanPart3–SustainableEnergyforAllofEarthTable13Providesadditionaldetailintomining,refining,vehiclefactories,batteryfactoriesandrecyclingassumptions.Miningandrefiningassumptionsareaninternalestimateofindustryaveragebasedonpublicindustryreports:2,8502,850NiNi10,4466,78510,446TotalMiningCapexTotalMiningCapexGrLHM(Li)Gr$145B$57Bkt/yearkt/year$104B$204B$178B$502B$662Bkt/yearkt/yearkt/year$51M$20M$10M$30M$17MktRequired/YearktRequired/YearRequiredCapexRequiredCapexUnitUnitCapitalIntensity/UnitCapitalIntensity/Unit6,78516LHM(Li)Co6,6006,0256,600530CuFeCuMn$170B$0kt/yearkt/year$83B$84B$132B$7Bkt/yearkt/yearkt/yearkt/year$25M$30M$12.5M$14M$20M$14MTable13A:AdditionalInvestmentAssumptionDetailTable13B:AdditionalInvestmentAssumptionDetailMiningRefiningInvestmentRequired29MasterPlanPart3–SustainableEnergyforAllofEarth89M11,488VehicleFactoriesEchemBatteryRecycling2,0706109,178TotalMiningCapexTotalMiningCapexThermalBatteryFactorySolarRecyclingUpstreamBatteryMaterials$890B$172BInternalestimateofindustryaverageInternalestimateCars/yearGWh/year$21B$9BInternalestimateInternalestimate$229BInternalestimate$2,082B$215BGWh/yearGW/yearGWh/year$10K$15M$10M$14M$24.9MAnnualCapacityNeededAnnualCapacityNeededRequiredCapexRequiredCapexNotes/SourceNotes/SourceUnitUnitCapitalIntensity/UnitCapitalIntensity/Unit11,4882,070E-ChemBatteryFactoriesThermalBatteryRecycling2,310402BatterypackFactoryTurbineRecycling$919B$29BInternalestimateofindustryaverageInternalestimateGWh/yearGWh/year$23B$6BInternalestimateInternalestimateGWh/yearGW/year$80M$14M$10M$14MTable13C:AdditionalInvestmentAssumptionDetailTable13D:AdditionalInvestmentAssumptionDetailVehicle&BatteryFactoriesRecyclingInvestmentRequired30MasterPlanPart3–SustainableEnergyforAllofEarthSolarlandarearequirementisestimatedbasedonaUSLawrenceBerkeleyNationalLaboratory(LBNL)empiricalassessmentofactualUSprojects,whichfoundthatthemedianpowerdensityforfixed-tiltsystemsinstalledfrom2011-2019was2.8acres/MWdc57.ConvertingMWdctoMWacusinga1.4conversionratioyieldsroughly3.9acres/MWac.Therefore,theglobalsolarpanelfleetof18.3TWwillrequireroughly71.4millionacres,or0.19%ofthetotal36.8billionacresgloballandarea.WindlandarearequirementisestimatedbasedonaUSNationalRenewableEnergyLaboratory(NREL)studywhichfoundthatthedirectlandusageis0.75acresperMW58.Therefore,theglobalwindturbinefleetof12.2TWwillrequireanestimated9.2millionacres,or0.02%oftotallandarea.SolarDirectLandArea0.19%ofLandWindDirectLandArea0.02%ofLandTable14:SolarandWindDirectLandAreabyContinentLandAreaRequired31MasterPlanPart3–SustainableEnergyforAllofEarthAssumptionsThetotalmaterialsrequiredforsolarpanels,windturbines,andcircuitmilesmilesarecalculatedbasedonthirdpartymaterialintensityassumptions.Batterymaterialintensityisbasedoninternalestimates.SolarpanelandwindturbinematerialintensityassumptionsarefromaEuropeanCommissionreport.Solarcellsarewafer-basedcrystallinesilicon,andrareearthmineralsareeliminatedfromwindturbines,giventheprogressdemonstratedindevelopingtechnologies59.BasedonIEA’s2050NetZeropathwaysstudy,approximately60millioncircuitmileswillneedtobeaddedorreconductoredgloballytoachieveafullysustainable,electrifiedglobaleconomy.Distributioncapacitywillprimarilybeexpandedbyreconductoringexistinglinesandexpandingsubstationcapacitythatcanaccommodatesignificantgrowthinpeakandaverageend-userdemand.High-voltagetransmissionwillprimarilyexpandgeographiccoveragetoconnectlargewindandsolargenerationcapacitytodenselypopulatedareas.Forpurposesofestimatingmaterialrequirements,90%ofthe60millioncircuitmileswillbereconductoringofexistinglow-voltagedistributionsystemsand10%willbenewcircuit-milesfromhigh-voltagetransmission,whichisthecurrentratioofUScircuitmilesbetweenhigh-voltagetransmissionandlow-voltagedistribution60,61.56,20042,900---7,500----328,250-8,05079019,40096---exclude,designout1,05034045,50018--exclude,designout-exclude,designoutConcreteGlassManganeseIronNeodymiumAluminumNickelTerbiumZincPraseodymiumSolarWindNoteston/GW62,800-4,300--7,900--2,0004119,5004,6002,9751093---exclude,designoutexclude,designout-5258----exclude,designout--SteelPolymersCopperMolybdenumBoronPlasticChromiumDysprosiumSiliconSilverTable15:GenerationMaterials:TonsperGW62MaterialsRequired32MasterPlanPart3–SustainableEnergyforAllofEarth--0.331,4880.270.78--0.401,100--0.12-0.23---------0.7512,883209,138Ni52,266HVOverhead0.09--Al802MVOverhead0.17Cu-981-Fe-LVOverhead0.04SiLFPCopperNi/MnBasedGlassThermalLeadHighNiAluminumConcretekg/kWhSteelkg/km-11,6500.610.42--6631.050.06-0.63---14,100---0.73-0.89--4.00--17,500Co-HVUnderground0.54LHM(Li)-531-P177LVUnderground-824-Mn-MVUnderground0.59GrTable16:BatteryMaterials:kgperkWhTable17:TransmissionMaterials:kgperkm63Usingtheaboveassumptions,12,815milliontonnesintotal(444milliontonnesannually)willberequiredtomanufacture30TWofgeneration,240TWhofbatterystorage,and60Mtransmissionmiles.MaterialsRequiredLHMisequivalenttoLiOH-H2Oandhasapproximately6xthemassastheLithiumalone33MasterPlanPart3–SustainableEnergyforAllofEarth--4021071505----------371495162,82694--1455--0.070.002--60.240341215613353193813,43411714550.070.00260.2363NickelNickel523AluminumAluminum613PhosphorusPhosphorus35319GraphiteGraphite2-SiliconSilicon1136IronIron--PlasticPlastic--SilverSilver--ChromiumChromiumTransmissionTransmissionGenerationGenerationTotalTotalBatteryBatteryMaterialMaterial------662--1154110.488329--1002,019674,9911662,734919,288310------562106631647893301817,01023412,815444118756210CobaltCobalt--ZincZinc493CopperCopper--GlassGlass80ManganeseManganese--ConcreteConcrete79343TotalTotal1187LHM(Li)LHM(Li)--PolymersPolymersTable18:TotalMaterialIntensity[Mt]TotalMaterialsAnnualMaterialsMaterialExtractionThemassflowsassociatedwiththesematerials(i.e.,howmuchearthismoved)reliesonoregradeandthrough-processyield.Usinganinternalestimateofindustryaveragecompiledfrompublicindustryreports(SeeTable19),therequiredannualmassflowisestimatedtobe3.3gigatonnes(Gt).Massflowscanreduceifaluminum(50%oregrade)issubstitutedforcopper(1%oregrade),whichispossibleinmanyusecases.Itisassumedthat50%oflithiumisextractedfrombrine100%oregrade,ifthisisnotthecase,thenthemassflowassociatedwithlithiumwouldincreaseby0.8Gt.AccordingtotheCircularityGapReport2023,68Gtofmaterial,excludingbiomass,isextractedfromtheeartheachyear–fossilfuelsaccountfor15.5Gtofthis64.Inasustainableenergyeconomy,materialextractionwilldecreaseby10.8Gt–withmostfossilfuelextractionreplacedby3.3Gtofrenewablematerialextraction.Theassumptionisthatfossilfuelextractionassociatedwithnon-energyenduses(i.e.plasticsandotherchemicals)continues,approximately9%ofthefossilfuelsupply,accordingtotheIEA.MaterialsRequired34MasterPlanPart3–SustainableEnergyforAllofEarth3,335Total3701.0%3744.9%5212.5%12816.9%480%29361.5%5100%1850.002%034.5%79%Nickel90%Aluminum50%Phosphorus86%Graphite38%Silicon65%Iron100%Plastic75%Silver65%ChromiumPeakOreMined(Mt)Ore%Through-ProcessYield50.4%485.6%9550.9%30100%241.9%360100%8600.7%2100%77%Cobalt82%Zinc81%Copper100%Glass75%Manganese65%Concrete58%LHM(Li)100%PolymersTable19:AnnualMaterialExtractionRequiredddddAssume50%oftheLithiumwasextractedfrombrine.100%oreminedforthatportionofLithiumsupplyMaterialAvailabilityThetotalmaterialinTable18extractionisevaluatedagainst2023USGSresourcestoassessfeasibility.Forsilver,theUSGSdoesnotpublisharesourcesestimate,soreserveswereused.Theanalysissuggeststhatsolarpanelswillrequire13%ofthe2023USGSsilverreserves,butsilvercanbesubstitutedwithcopper,whichischeaperandmoreabundant65.Graphitedemandcanbemetwithbothnaturalandartificialgraphite-theformerisminedandrefined,andthelatterisderivedfrompetroleumcoke66.Asaresult,thegraphiteresourcebasewasincreasedtoaccountforartificialgraphiteproductionfromoilproducts.Ifonlyasmallfractionoftheworld’soilresourceisusedforartificialgraphiteproduction,graphiteresourceswillnotbeaconstraint67.Ongoingdevelopmentisaimedatevaluatingothercarboncontainingproductsasfeedstockforartificialgraphiteproduction,includingCO2andvariousformsofbiomass68.Insum,therearenofundamentalmaterialsconstraintswhenevaluatingagainst2023USGSestimatedresources.Furthermore,ResourcesandReserveshavehistoricallyincreased–thatis,whenamineralisindemand,thereismoreincentivetolookforitandmoreisdiscovered69.Annualmining,concentrating,andrefiningofrelevantmetaloresmustgrowtomeetdemandfortherenewableenergyeconomy,forwhichthefundamentalconstraintsarehumancapitalandpermitting/regulatorytimelines.MaterialsRequired35MasterPlanPart3–SustainableEnergyforAllofEarthMaterialstoBuildRequired30TWGeneration,240TWhStorage,and60MMilesofConductorsRelativeto2023USGSEstimatedResourcesLithiumZincIronSilverCobaltAluminumPhosphorusNickelCopperManganeseGraphite0%40%20%60%80%10%50%30%70%90%100%Figure17:MaterialsRequiredRelativeto2023USGSEstimatedResourcesFigure18GlobalMineralsReserve/Resourcebase-CorrectingPublicPerception200220022006200620102010201420142018201820222022224466113355779988WhatPeopleThinkHappensGlobalReservesGlobalReservesWhatActuallyHappensNiLiCoCuGlobalMineralsReserve/ResourceBase–CorrectingPublicPerceptionMaterialsRequired36MasterPlanPart3–SustainableEnergyforAllofEarthRecyclingTosupportthisplan,significantprimarymaterialdemandgrowthisrequiredtorampmanufacturingforthesustainableenergyeconomy,oncethemanufacturingfacilitiesareramped,primarymaterialdemandwilllevelout.Inthe2040’s,recyclingwillbegintomeaningfullyreduceprimarymaterialdemandasbatteries,solarpanelsandwindturbinesreachend-of-lifeandvaluablematerialsarerecycled.Althoughminingdemandwilldecrease,refiningcapacitywillnot.RawMaterialDemandDemandgrowthlevelsoutasrecyclingvolumesincreaseandvehicle/stationarystoragemarketsnearsaturationDemanddropsasEoLvolumesapproachtotaldemandvolumesRefiningdemandwillcontinuetoincreasewithenergyconsumption/GDP/populationgrowthSignificantdemandincreaseasthe“circuitisfilled”202820332038204320482023Figure20IllustrativeRecyclingImpactonProcessFlow,assuming80%criticalmaterialrecoveryFigure19:IllustrativeRecyclingImpactonProcessFlow,assuming80%criticalmaterialrecovery2030’s2050’sMinedOreMinedOreEngineeredProducts(Precursor,Cathode)EngineeredProducts(Precursor,Cathode)Crushing/InertingCrushing/inertingCollection/SortingCollection/SortingRefiningRefiningCellsCellsProducts(Vehicle/Storage)Products(Vehicle/Storage)MaterialsRequired37MasterPlanPart3–SustainableEnergyforAllofEarthConclusionAfullyelectrifiedandsustainableeconomyiswithinreachthroughtheactionsinthispaper:1.RepowertheExistingGridwithRenewables2.SwitchtoElectricVehicles3.SwitchtoHeatPumpsinResidential,Business&Industry4.ElectrifyHighTemperatureHeatDeliveryandHydrogenProduction5.SustainablyFuelPlanes&Boats6.ManufacturetheSustainableEnergyEconomyModelingrevealsthattheelectrifiedandsustainablefutureistechnicallyfeasibleandrequireslessinvestmentandlessmaterialextractionthancontinuingtoday’sunsustainableenergyeconomy.240TWhStorage$10TManufacturingInvestment0.21%LandAreaRequiredZEROInsurmountableResourceChallenges30TWRenewablePower1/2TheEnergyRequired10%2022WorldGDPFigure2:EstimatedResources&InvestmentsRequiredforMasterPlan338MasterPlanPart3–SustainableEnergyforAllofEarthInthisanalysis,generationandstorageneedsareestimatedatthesystemlevel,i.e.,answeringthequestion:howmuchwind/solarandstorageisrequiredtoreachasustainableenergyeconomy.Themodeldoesnotexplicitlycalculatetherequiredgenerationandstoragetoelectrifyeachend-useseparately.Asanillustration,theallocationofthetotalsystemneedstoeachend-useiscalculatedusingtheoutputfromthecapacityexpansionmodel.Todoso,thecoincidencebetweenthehourlydemandprofileandthesolarandwindgeneration,aftercurtailment,iscalculatedforeachend-use.Windandsolarinstalledcapacityisallocatedtoeachend-usebasedontheirannualweightedaveragecoincidencefactor.Forinstance,12%oftheannualwindgenerationcoincidedwiththeEVchargingdemand.Asthemodeloutputindicatedtheneedfor15.2TWofwind,12%ofthattotalwasallocatedtoEVchargingorabout1.9TW.Thesamemethodologywasappliedtoallocatebatterystoragecapacitytoeachend-use,bymatchingstoragedischargestoend-usedemand.Generally,end-useswiththeleastflexibilitytoshiftthedemand,suchasresidentialheating,areallocatedmorestoragethanend-useslikeindustrialhigh-gradeheatwheretheavailabilityofthermalstorageisassumed.Thisallocationmethodologyisadirectionalillustrativeestimateoftheimpactofeachend-useonthetotalsolar/windandstoragerequirement,astheneedfromeachend-useisinterrelatedandcannotfullybeseparatedfromeachother.6.82.72.13.822.9RepowerExistingGridwithRenewables2.16.71.64.4SwitchtoHeatPumpsinHomes,BusinessesandIndustrySustainablyFuelPlaneandBoats22,53811,4869,028Solar(TW)Wind(TW)StationaryStorage(TWh)End-UseGlobalElectricityDemand(TWh)3.33.41.53.7SwitchtoElectricVehicles3.149.5eeElectrifyingHighTemperatureHeatDeliveryandHydrogen9,31417,472eeIncluding8TWhofstationaryelectricitystorage,excludingh2storage.Appendix:Generation&StorageAllocationtoEnd-Uses39MasterPlanPart3–SustainableEnergyforAllofEarthManufacturingthebatteries,solarpanels,andwindturbinesinthesustainableenergyeconomyitselfrequires4PWh/yearofsustainablepower.Toarriveatpowerdemand,theenergyintensityofmanufacturingisestimatedasshowninthefiguresbelow:1,0721900.651.47342125GWhConsumedPerGWProducedGWhConsumedPerGWProduced0.100.26TotalPWhConsumedTotalPWhConsumed1,0523120.421.09Solar71LFPggNi/MnBasedggThermal72,ffTurbine70HighNigg6107,7152922,070GW/YearProductionGW/YearProduction4023,481ffEnergyintensityofgraphiteisusedasaproxyforthermalbatteriesggInternalestimateTable20:AnnualEnergyIntensityofWindTurbineandSolarPanelProductionTable21:AnnualEnergyIntensityofBatteryProductionAppendix:EnergyIntensity40MasterPlanPart3–SustainableEnergyforAllofEarthhttps://www.iea.org/data-and-statistics/data-product/world-energy-balanceshttps://flowcharts.llnl.gov/http://www.departmentof.energy/https://www.eia.gov/electricity/gridmonitor/dashboard/electric_overview/US48/US48https://afdc.energy.gov/data/10310https://www.fueleconomy.gov/feg/noframes/45011.shtmlhttps://www.fueleconomy.gov/feg/bymodel/2022_Toyota_Corolla.shtmlhttps://www.eia.gov/opendata/browser/https://iea.blob.core.windows.net/assets/4713780d-c0ae-4686-8c9b-29e782452695/TheFutureofHeatPumps.pdfhttps://www.iea.org/reports/the-future-of-heat-pumps/how-a-heat-pump-workshttps://www.sciencedirect.com/science/article/pii/S1364032116309418https://www.energy.gov/energysaver/furnaces-and-boilershttps://www.iea.org/commentaries/clean-and-efficient-heat-for-industryhttps://backend.orbit.dtu.dk/ws/portalfiles/portal/149827036/Contribution_1380_final.pdfhttps://backend.orbit.dtu.dk/ws/portalfiles/portal/151965635/MAIN_Final.pdfhttps://www.iea.org/data-and-statistics/charts/industrial-heat-demand-by-temperature-range-2018https://www.sandia.gov/ess-ssl/wp-content/uploads/2020/12/ESHB_Ch12_Thermal_Ho.pdfhttps://medium.com/antora-energy/turning-sunshine-and-wind-into-24-7-industrial-heat-and-power-cheaper-than-fossil-fuels-69355cdcde04https://www.bostonmetal.com/green-steel-solution/https://www.iea.org/reports/hydrogenhttps://www.ncbi.nlm.nih.gov/pmc/articles/PMC7712718/https://agupubs.onlinelibrary.wiley.com/doi/full/10.1029/2022GL101420https://www.sciencedirect.com/science/article/abs/pii/S0360319920331426https://www.iea.org/data-and-statistics/charts/natural-gas-consumption-for-non-energy-use-by-application-2019-2025https://www.nature.com/articles/s41560-022-01065-yhttps://pubs.acs.org/doi/10.1021/acsenergylett.9b02574https://www.energy.gov/eere/bioenergy/articles/sustainable-aviation-fuel-review-technical-pathways-reporthttps://www.iea.org/reports/direct-air-capturehttps://iopscience.iop.org/article/10.1088/2516-1083/abf1cehttps://www.serc1.org/docs/default-source/committee/resource-adequacy-working-group/2020-serc-probabilistic-assessment-report-redacted.pdf?sfvrsn=58904e0c_2https://www.wecc.org/Reliability/TAS_PathReports_Combined_FINAL.pdfhttps://www.ercot.com/files/docs/2020/07/30/ERCOT_DC_Tie_Operations_Document.docxhttps://netzeroamerica.princeton.edu/img/NZA%20Annex%20A3%20-%20Inputs%20catalog%20for%20EER%20modeling.xlsxhttps://www.ref.org.uk/ref-blog/371-constraint-payments-to-wind-power-in-2020-and-2021http://www.caiso.com/Documents/ProductionAndCurtailmentsData_2022.xlsxhttps://www.nrel.gov/gis/psh-supply-curves.htmlhttps://agupubs.onlinelibrary.wiley.com/doi/10.1029/2022WR032210?af=Rhttps://energy.mit.edu/wp-content/uploads/2022/05/The-Future-of-Energy-Storage.pdfhttps://www.osti.gov/pages/biblio/1840539#:~:text=Unlike%20underground%20pipes%2C%20the%20installed,3%2Fkg-H212345678910111213141516171819202122232425262728293031323334353637383941MasterPlanPart3–SustainableEnergyforAllofEarth404142434445464748495051525354555657585960616263646566676869707172https://netzeroamerica.princeton.edu/the-reporthttps://www.eia.gov/outlooks/aeo/assumptions/pdf/table_8.2.pdfhttps://www.nrel.gov/docs/fy12osti/51946.pdfhttps://www.nrel.gov/wind/offshore-resource.htmlhttps://atb.nrel.gov/electricity/2022/technologieshttps://www.nrel.gov/docs/fy22osti/83650.pdfhttps://www.energy.gov/eere/water/articles/hydropower-vision-report-full-reporthttps://www.nrel.gov/analysis/tech-cap-factor.htmlhttps://www.nrel.gov/docs/fy18osti/70901.pdfhttps://www.nrel.gov/docs/fy16osti/65938.pdfhttps://www.greentechmedia.com/articles/read/the-us-has-145-gigawatts-of-untapped-commercial-solar-potentialhttps://www.energy.gov/sites/prod/files/2009%20Smart%20Grid%20System%20Report.pdfhttps://www.iea.org/reports/world-energy-investment-2022/overview-and-key-findingshttps://www.nrel.gov/docs/fy19osti/72740.pdfhttps://iea.blob.core.windows.net/assets/78633715-15c0-44e1-81df-41123c556d57/DirectAirCapture_Akeytechnologyfornetzero.pdfhttps://carbonengineering.com/wp-content/uploads/2019/11/APS_DAC_Report-FINAL_Original.pdfhttps://www.researchgate.net/publication/271200536_Establishing_a_European_renewable_jet_fuel_supply_chain_the_technoeconomic_potential_of_biomass_conversion_technologieshttps://emp.lbl.gov/publications/land-requirements-utility-scale-pvhttps://www.nrel.gov/docs/fy09osti/45834.pdfhttps://www.energy.gov/eere/articles/advanced-wind-turbine-drivetrain-trends-and-opportunitieshttps://www.iea.org/data-and-statistics/data-product/net-zero-by-2050-scenario#https://www.energy.gov/sites/default/files/2022-05/Next%20Generation%20Grid%20Technologies%20Report%20051222.pdfhttps://eitrawmaterials.eu/wp-content/uploads/2020/04/rms_for_wind_and_solar_published_v2.pdfhttps://www.sciencedirect.com/science/article/pii/S0921344920305176?via%3Dihubhttps://www.circularity-gap.world/2023#downloadhttps://www.fraunhofer.de/en/press/research-news/2022/september-2022/out-with-the-silver-in-with-the-copper-a-new-boost-for-solar-cells.htmlhttps://asbury.com/media/1225/syntheticgraphiteparti.pdfhttps://www.opec.org/opec_web/en/data_graphs/330.htmhttps://pubs.rsc.org/en/content/articlelanding/2020/gc/d0gc02286ahttps://www.nature.com/articles/s41560-022-01129-zhttps://www.vestas.com/content/dam/vestas-com/global/en/sustainability/reports-and-ratings/lcas/LCA%20of%20Electricity%20Production%20from%20an%20onshore%20EnVentus%20V162-6.2.pdf.coredownload.inline.pdfhttps://krichlab.physics.uottawa.ca/wp-content/uploads/2014/06/Peng2013_Review-LCA-EPBTGHG-SolarPV.pdfhttps://static1.squarespace.com/static/6213f06671d00e605c9eea45/t/62ce206273cd8e10b634d6bb/1657675880422/TOWARD%2BA%2BLIFE%2BCYCLE%2BINVENTORY%2BFOR%2BGRAPHITE%2BPRODUCTION_carbonscape.pdf

1、当您付费下载文档后,您只拥有了使用权限,并不意味着购买了版权,文档只能用于自身使用,不得用于其他商业用途(如 [转卖]进行直接盈利或[编辑后售卖]进行间接盈利)。
2、本站所有内容均由合作方或网友上传,本站不对文档的完整性、权威性及其观点立场正确性做任何保证或承诺!文档内容仅供研究参考,付费前请自行鉴别。
3、如文档内容存在违规,或者侵犯商业秘密、侵犯著作权等,请点击“违规举报”。

碎片内容

碳中和
已认证
内容提供者

碳中和

确认删除?
回到顶部
微信客服
  • 管理员微信
QQ客服
  • QQ客服点击这里给我发消息
客服邮箱