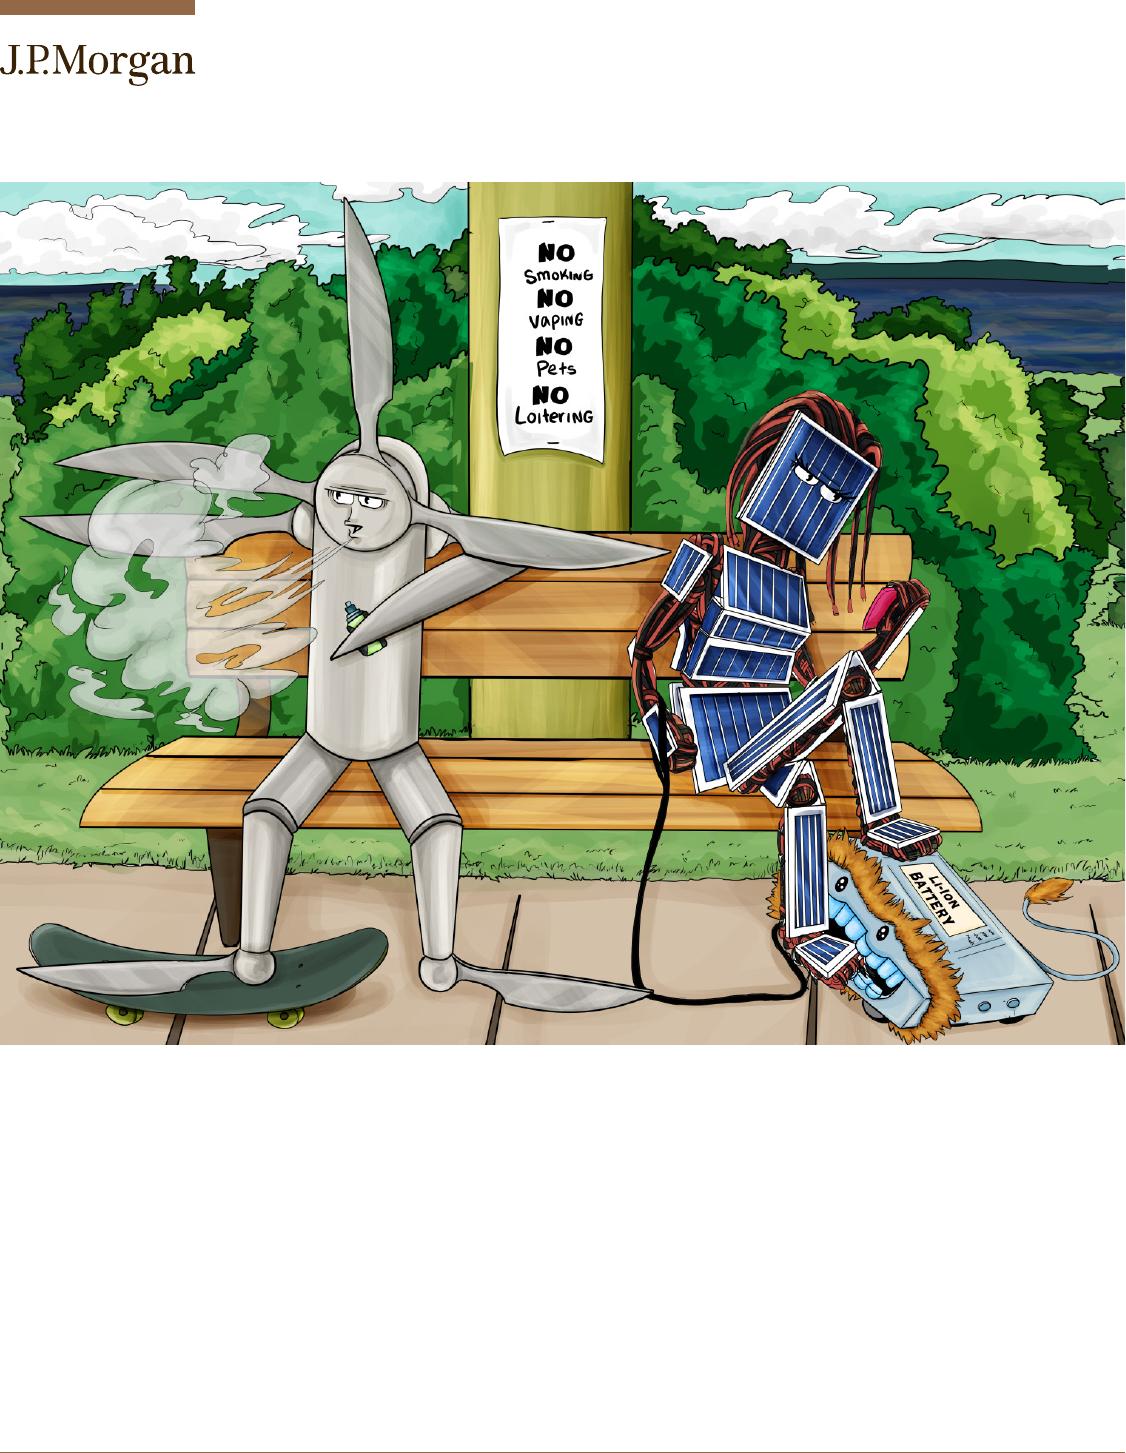
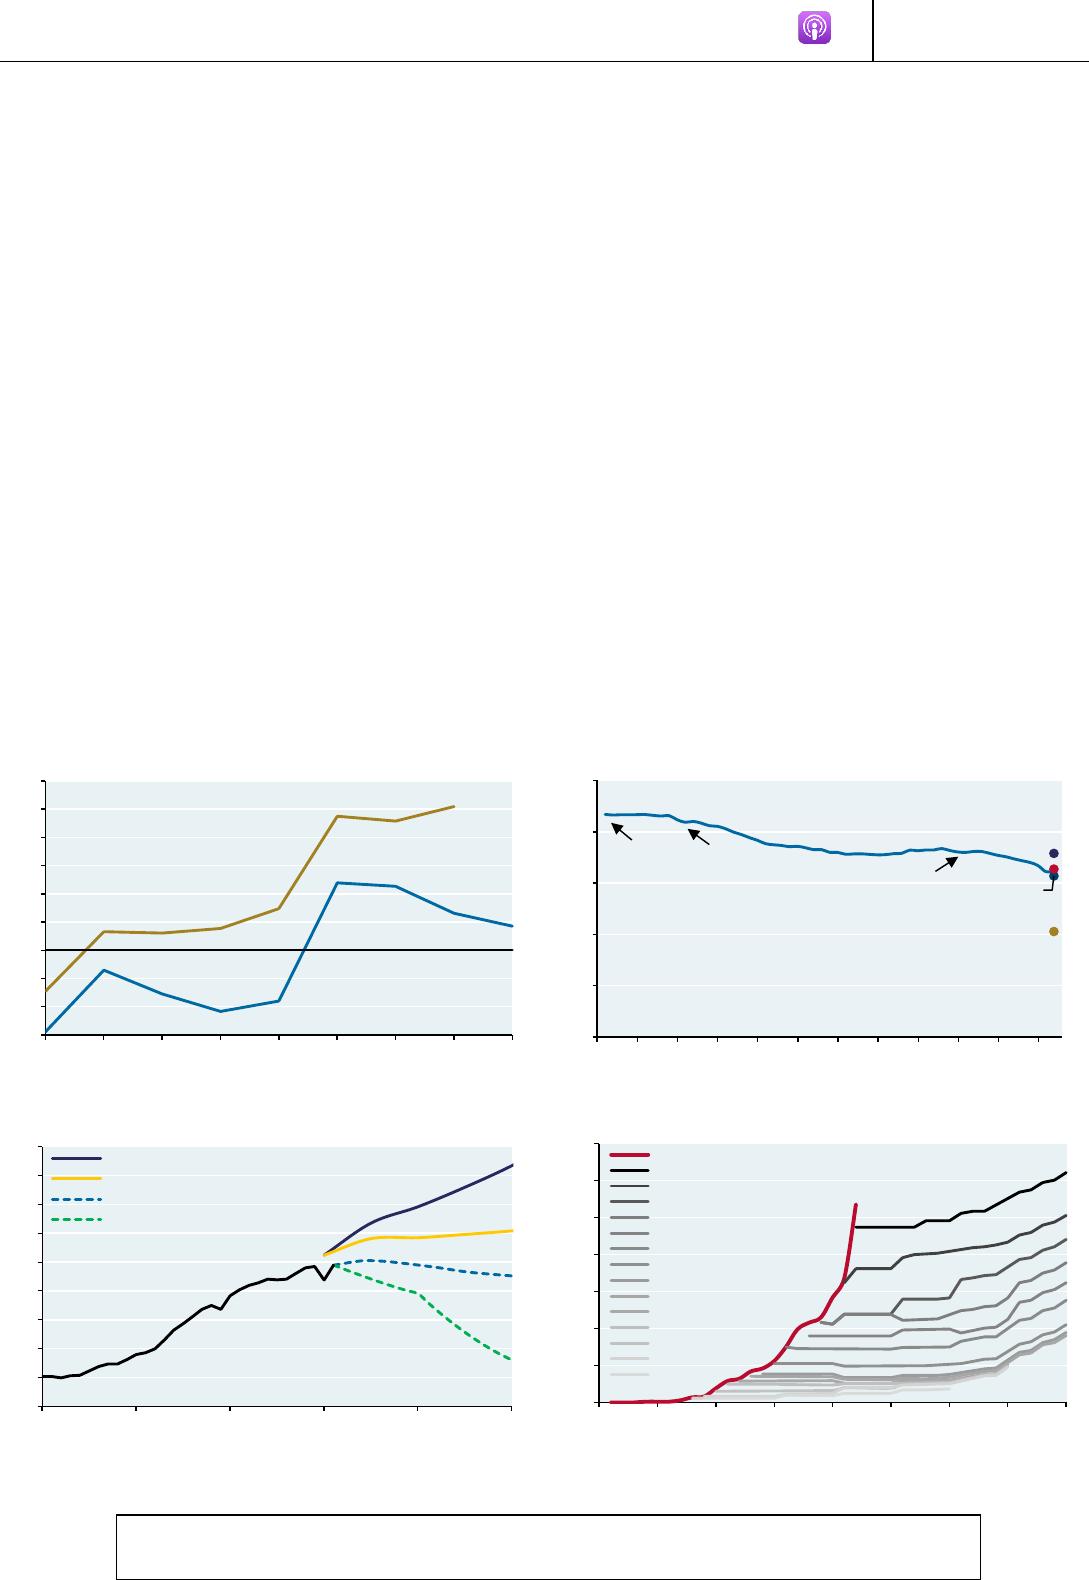
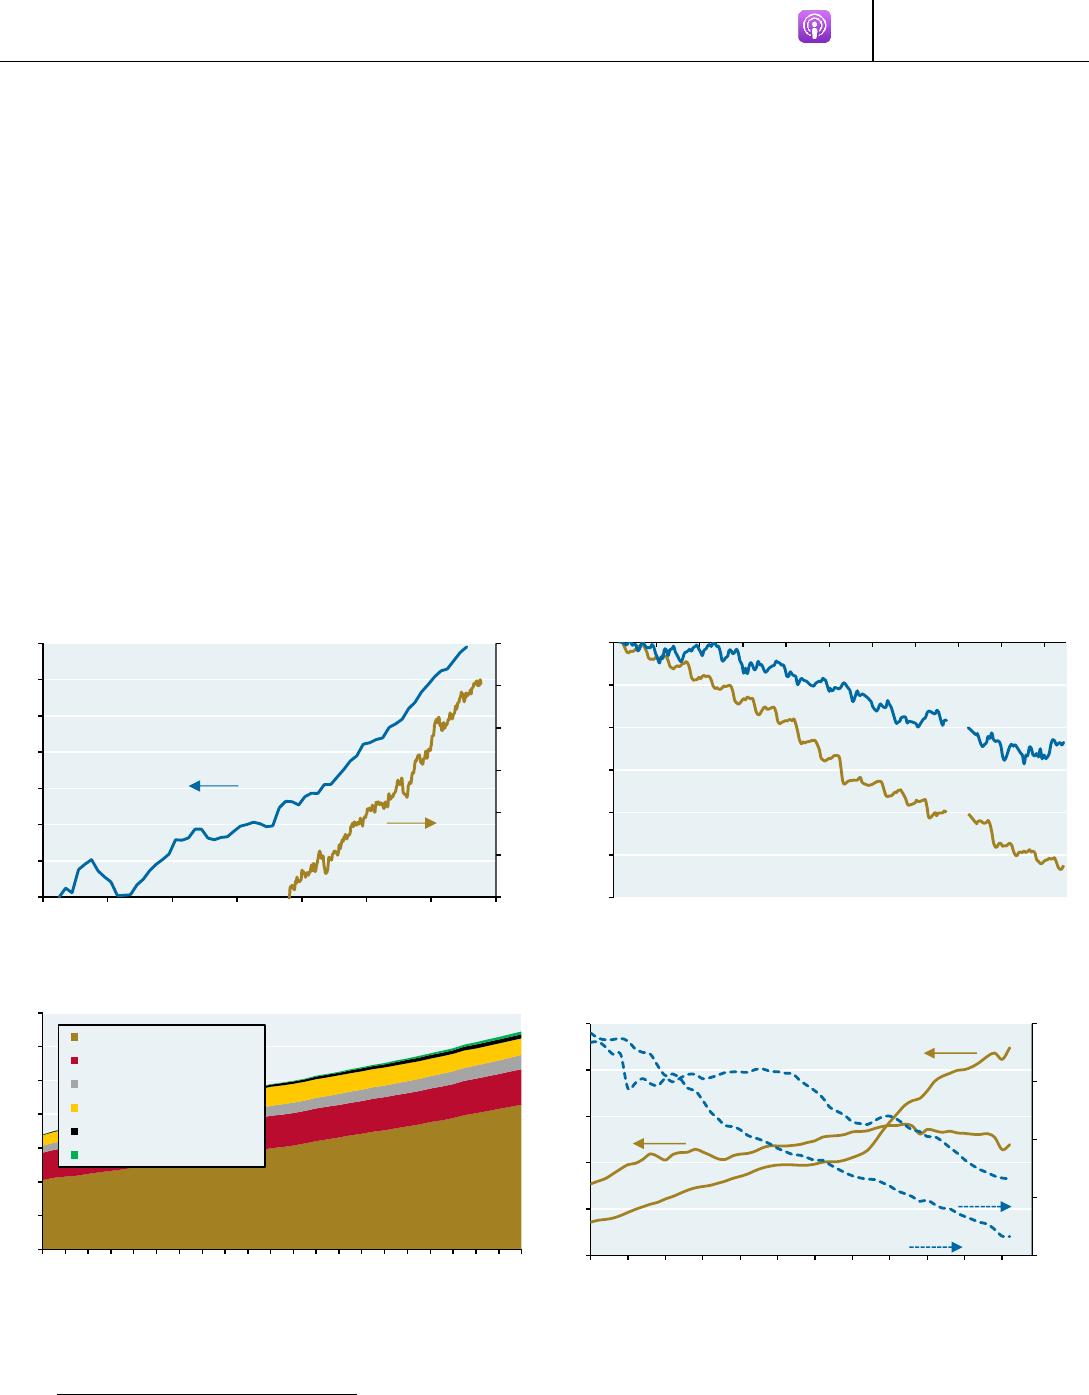
EYEONTHEMARKETANNUALENERGYPAPER13THEDITIONGrowingPains:TheRenewableTransitioninAdolescenceRenewablesaregrowingbutdon’talwaysbehavethewayyouwantthemto.Thisyear’stopicsincludetheimpactofrisingcleanenergyinvestmentandnewenergybills,howgriddecarbonizationisoutpacingelectrification,thelongtermoildemandoutlook,theflawedconceptoflevelizedcostwhenappliedtowindandsolarpower,thescrambleforcriticalminerals,theimprovingeconomicsofenergystorageandheatpumps,thetransmissionquagmire,energyfrommunicipalwaste,carbonsequestration,awhydrogenupdate,theRussia-Chinaenergypartnership,methanetrackingandsomefuturisticenergyideasthatyoucanjustignore,fornow.ByMichaelCembalestChairmanofMarketandInvestmentStrategyforJ.P.MorganAsset&WealthManagementEYEONTHEMARKET•MICHAELCEMBALEST•J.P.MORGAN13thannualenergypaperMarch28,20231INVESTMENTPRODUCTSARE:●NOTFDICINSURED●NOTADEPOSITOROTHEROBLIGATIONOF,ORGUARANTEEDBY,JPMORGANCHASEBANK,N.A.ORANYOFITSAFFILIATES●SUBJECTTOINVESTMENTRISKS,INCLUDINGPOSSIBLELOSSOFTHEPRINCIPALAMOUNTINVESTEDGrowingPains:TheRenewableTransitioninAdolescence2023EyeontheMarketenergypaperAstherenewabletransitionhitsitsteenageyears,it’stimetotakestockofwhathasbeenaccomplishedsofar:•“Cleantech”isoutpacingfossilfuelinvestmentevenbeforenewUS/Europeanenergybills•Globalwind+solargenerationexceedednuclearforthefirsttimein2021•TheIEAprojectspeakglobalfossilfueldemandthisdecadeevenunderitsslowertransitioncase•Projectedrenewablecapacityadditionsof~2,500GWoverthenextfiveyearswouldmatchtheprior20•ThepaceofEVsales,residentialheatpumpadoptionandUSbatteryplantbuild-outshasincreased•Hybridsolar-storageprojectsarebecomingmorecompetitivewithgaspeakerplants•China2022renewablecapacityadditions=US,Europe,India,SoutheastAsiaandLatinAmericacombined•Economiesofscale:asillustratedbelow,theIEAhasconsistentlyunderestimatedsolarcapacityadditionsEvenso,decarbonizationofenergyusewillbeagradualprocess.After$6.3trillionspentonrenewableenergyandanother$3.3trillionspentonelectricitynetworkssince2005,globalenergyuseisstill~80%reliantonfossilfuels,fromalowof70%inEuropeto86%inEMex-China.Theglobalmeasurehasdeclinedbyjust5%since2005duetochallengeselectrifyingindustrial,commercial,residentialandtransportenergy.There’salsotoomuchfocusonfossilfuelshares;whatmattersevenmoreistheamountoffossilfuelsused(chart,lowerleft).Forthemostpart,renewableenergydisplacesfossilfuelsthatpowerHVACsystemsinhomesandofficebuildings.Renewablesalsodecarbonize10%-15%ofindustrialenergyuse,andthestockofelectriccars,vans,trucks,busesandbikesreducesglobaloilconsumptionby~2mmbarrelsaday,whichis~2%ofoiluse.Butthepillarsofmodernsociety(steel,cement,ammonia,plastics)arestillmadeprimarilyusingfossilfuels,particularlyindevelopingcountriestowhomtheWesthasoutsourcedthemostenergyintensivekindsofmanufacturing.0.7x0.8x0.9x1.0x1.1x1.2x1.3x1.4x1.5x1.6x201520162017201820192020202120222023CleantechspendingoutpacingfossilfuelsRatio,cleantech/fossilfuelcapitalspendingbyyearSource:S&PGlobal,IEA,JPMAM.2023.IEAS&PGlobalCleantech:renewablepowerplusgridsandstorage(S&P);plusEVs,biofuels,nuclearandCCS(IEA)USEUChinaEMexChina50%60%70%80%90%100%'65'70'75'80'85'90'95'00'05'10'15'20Source:BPStatisticalReviewofWorldEnergy,JPMAM.2022.Fossilfuelshareofprimaryenergysince1965%ofglobalprimaryenergyconsumptionfromcoal,oilandnatgasNuclearadoptioneraSolar/winderabeginsPre-existinghydropower250300350400450500550600650700199020002010202020302040EIA,Highoildemand/slowertransition,Oct2021EIA,Lowoildemand/fastertransition,Oct2021IEA,StatedPolicies,Jan2023IEA,AnnouncedPledges,Jan2023Futureglobalfossilfueldemand:dependswhoyouaskExajoulesSource:EnergyInformationAdmin.,Int'lEnergyAgency,JPMAM.2022050100150200250300350200020052010201520202025203020352040Actualsolaradditions2022iea2021iea2020iea2019iea2018iea2017iea2016iea2015iea2014iea2013iea2012iea2011iea2010iea2009ieaIEAconsistentlyunderestimatedsolarcapacitygrowthGWofglobalannualsolaradditionsvsIEA10-yearforecastsSource:CarbonBrief,BNEF.2022.IEA=InternationalEnergyAgency.Note:solar=2%ofprimaryenergyusein2022EYEONTHEMARKET•MICHAELCEMBALEST•J.P.MORGAN13thannualenergypaperMarch28,20232Evidencepointingtotheneedforamorerapidtransitionappearsbelow:risingoceantemperaturesandsealevels,fallingicesheetmass,risinggreenhousegasconcentrationsandrisingemissionsdespiteimprovingCO2intensity.Solet’slookatthetransition’sprimaryobstacles:permittingdelaysforgenerationandtransmission,frequentlackofeminentdomainintheWest,availabilityofcriticalmineralsandrisingresourcenationalism,highcostperunitofenergyneededtodecarbonizeindustrialheat,backupthermalpowerandstoragecostsrequiredtoaccompanyintermittentwindandsolarpower,challengesforgridmanagersintegratingthousandsofnewwindandsolarprojects,thelongusefullivesofexistingmachines/vehicles/furnacesandthetimeittakesforsocietiestobuildnew“primemovers”(enginesandturbines)toutilizenewformsofenergy.Ifthat’swhatisconstrainingthepaceofchange,Iremaintotallyunconvincedthatstarvingtheoil&gasindustryofcapitalwillmakethetransitiongoanyfaster,particularlysincenewpoolsofcapitalwillstepin1aslongasdemandforfossilfuelsexists.Suchanapproachcouldalsoexposecountriestoenergyshortagesthatrenewablesarecurrentlyunabletofill.Whileitsenergypriceshavedeclinedfrompeaklevels,Europeisstillpayingaheavypriceformismanagingenergysupplieswhileitstransitionisongoing.Advicetoahandfulofcountrieswithampleoilandgasreserves:therenewabletransitionispickingupspeed,but“don’tquityourdayjob”.Asshownonthepriorpage2,youwillneedthoseoil&gasreservesformanyyearstocomeunlesstheworlddeliversonasetofveryambitiouspledgestodecarbonizeatatotallyunprecedentedpace.MichaelCembalest,JPMorganAssetManagement1WarrenBuffetthasa$60bnstakeinChevron&Occidental,offeredseveralbilliontobuyDominiongas/transmissionassetsuntilanti-trustconcernsforcedawithdrawal,andownsstakesinKinderMorganpipelines.2EIA2021projectionsonthepriorpageprecedeRussia’sinvasionofUkraineandEuropeanpolicyresponses,aswellastheUSenergybill.IexpectthenextEIAreleaseinSep2023toshowlowertrajectoriesoffossilfueluse.02040608010012005010015020025030035019551965197519851995200520152025OceanheatcontentandsealevelZettajoules,vs1957baselineMillimeters,vs1993baselineSource:NASA/NOAA.2022.1ZJ=1021joules.Forthelastdecade,theoceanhasbeenabsorbing10ZJofheatperyear...whichisequalto~20xannualglobalprimaryenergyconsumptionHeatcontentSealevel-6,000-5,000-4,000-3,000-2,000-1,000020022004200620082010201220142016201820202022AntarcticaandGreenlandicesheetmassMassvariation,gigatonnesSource:NASA.November2022.GreenlandAntarctica0.00.51.01.52.02.53.03.51979198119831985198719891991199319951997199920012003200520072009201120132015201720192021CarbondioxideMethaneNitrousoxideChlorofluorocarbonsHydrochlorofluorocarbonsHydrofluorocarbonsGreenhouseeffect:radiativeforcingbyGHGwattspersquaremeterSource:NOAAGlobalMonitoringLaboratory.2022.EMDMEMDM0.150.250.350.450.550510152025'65'70'75'80'85'90'95'00'05'10'15'20Source:BP,Conf.Board,JPMAM.2022.Note:DM=DevelopedMarkets;EM=EmergingMarkets.CO2emissionsvolumesvsintensityCO2,billiontonnesTonnesofCO2/thousand$2021GDPEYEONTHEMARKET•MICHAELCEMBALEST•J.P.MORGAN13thannualenergypaperMarch28,20233TableofContentsExecutiveSummary:adetailedlookatthegoalsandrealitiesoftheenergytransition..........................................4Energyinvestmentupdate.................................................................................................................................11Essentialenergycharts.......................................................................................................................................12[1]Numbersin,Garbageout:thepracticalirrelevanceof“levelizedcostofenergy”forwindandsolarpower.....14[2]Crudeoilin,refinedproductsout:decliningUSgasolinedemand,risingdemandforotheroilproducts..........18[3]Intothequeue,butnotout:theslowpaceofgridexpansionandrenewableinterconnection........................19[4]Resourcenationalismin,globalizationout:thescrambletoreshoreproductionandprocessingofmineralsusedintherenewabletransition;nuclearpower/SMRupdate....................................................................................24[5]Energyin,mostoftheenergyout:theeconomicsbehindtheriseinco-locatedstorageandsolarpower........33[6]Garbagein,EnergyOut:thebenefitsandlimitationsofmunicipalsolidwasteasasourceofenergy,andtheongoingdisputeoverforestbiomassinEurope...................................................................................................35[7]CCSproposalsin,mostlythrownout:thehitrateofplannedcarboncapture&sequestrationprojectshasbeenlow,butthatmaychange(alittle)withnewincentivesandeconomiesofscale..................................................38[8]CaliforniaDreaming:theimprobablereveriesofelectricplanes,nuclearfusion,space-basedsolarpower,directaircarboncaptureandfullyautonomouscarnetworks.......................................................................................41Epilogue:HowEuropesurvivedthewinterof2022andwhatcomesnextforRussia/China..................................44Appendix:USmethaneupdateasmorestudiesshowhigherleakageratesthanreportedEPAdata.....................48AcronymsANL:ArgonneNationalLaboratory;bcm:billioncubicmeters;BP:BritishPetroleum;bpd:barrelsperday;BTU:Britishthermalunit;CCS:carboncaptureandstorage;DACC:directaircarboncapture;E&P:explorationandproduction;EIA:EnergyInformationAdministration;EPA:EnvironmentalProtectionAgency;EV:electricvehicle;FERC:FederalEnergyRegulatoryCommission;GJ:gigajoule;GW:gigawatt;HVAC:heating,ventilationandairconditioning;HVDC:high-voltagedirectcurrent;IEA:InternationalEnergyAdministration;IRENA:InternationalRenewableEnergyAgency;ISO:independentsystemoperator;ITC:investmenttaxcredit;kbd:thousandbarrelsperday;kt:kilotons;LBNL:LawrenceBerkeleyNationalLaboratory;LCOE:levelizedcostofenergy;LFP:lithiumironphosphate;LNG:liquefiednaturalgas;MJ:megajoule;MW:megawatt;NHTSA:NationalHighwayTrafficSafetyAdministration;NIB:neodymium,ironandboron;NMC:nickel,manganeseandcobalt;NREL:NationalRenewableEnergyLaboratory;O&M:operations&maintenance;PPA:PowerPurchaseAgreement;PV:photovoltaic;REE:rareearthelements;TW:terawatt;TWh:terawatt-hour;USDA:USDepartmentofAgriculture;USGS:USGeologicalSurveyEYEONTHEMARKET•MICHAELCEMBALEST•J.P.MORGAN13thannualenergypaperMarch28,20234ExecutiveSummary:adetailedlookatthegoalsandrealitiesoftheenergytransitionTheWesthassetahighbar.Ineachchart,dottedlinesrepresentannualwindandsolarcapacityadditionsneededtomeetstatedtargetsby2030,whilesolidlinesshowhistoricalcapacityadditionsfromallgenerationsources.Inotherwords,theUSandEuropeneedtosustainnewwindandsolaradditionsatapaceequaltohistoricalpeakadditions,orabovethem.ThegoalsareparticularlyambitiousinGermany,whosetransitionisfraughtwithelectricitypriceandreliabilityrisk3.Asweexplaininthesectionsthatfollow,constraintsrelatedtocriticalminerals,projectsitingandgridconnectionmayrestraincapacityadditionsbelowthesetargets.China’ssituationisdifferent.Itsstatedwindandsolargoalsarewithinreachcomparedtothepaceofrecentcapacityadditions.ButChinaneedsmorethanjustnewwindandsolarpower,whichiswhyitisbuildingcoalaswell.In2022,Chinaapproved106GWofnewcoalcapacity,thehighestfigurein7years,andwhichisequaltothelast5yearsofdecommissionedcoalcapacityintheUSandEuropecombined.3GermanyplanstoshutteritslastthreenuclearplantsinAprilandaccelerateitsexitfromcoalto2030,whileaddingwind,solarandnaturalgasplantsthatcaneventuallyrunonhydrogen.Atthesametime,electricitydemandisprojectedtoriseby33%duetoincreaseduseofEVs,heatpumpsandelectrolyzers,requiringGermany’selectricitygridtodoubleinsize.Germanyisalreadythesecond-mostexpensiveelectricitymarketinEurope;earlierthisyear,BloombergNEFestimatedthecostofGermany’splanat$1trillionby2030.TheevidenceisstackedagainstthisplanbeingachievedotherthanataveryhighcostthatcouldacceleratetheexodusofGermanmanufacturing.TheheadofGermanchemicalstradeunionVerbandderChemischenIndustriecommentedthatGermanyrisks“turningfromanindustrialcountryintoanindustrialmuseum.”Inaddition,McKinseyestimatesthatGermany’speakloadcapacitywillfallto90GWby2030whileitspeakloaddemandwillriseto120GW,creatingalargepotential30GWshortfall.05010015020025030035019811991200120112021AllgenerationsourcesWindandsolaronlySource:EIA,Princeton(REPEAT),JPMAM.2022.UScapacityadditionsandprojectionsGrosselectricitycapacityadditions,wattsperyearpercapita2022Energybill020406080100120140198019902000201020202030AllgenerationsourcesWindandsolaronlySource:EuropeanCommission,EIA,JPMAM.2022.EuropeanUnioncapacityadditionsandprojectionsGrosselectricitycapacityadditions,wattsperyearpercapitaREPowerEUGWtarget050100150200250300350200220072012201720222027AllgenerationsourcesWindandsolaronlySource:FraunhoferISE,JPMAM.2022.GermanycapacityadditionsandprojectionsGrosselectricitycapacityadditions,wattsperyearpercapita2023RenewableEnergySourcesAct020406080100120140160198019902000201020202030AllgenerationsourcesWindandsolaronlySource:SCMP,CREA,EIA,JPMAM.2022.ChinacapacityadditionsandprojectionsGrosselectricitycapacityadditions,wattsperyearpercapitaStatedGWtarget25%non-fossiltargetExecutiveSummaryEYEONTHEMARKET•MICHAELCEMBALEST•J.P.MORGAN13thannualenergypaperMarch28,20235Ifthesenewcapacitytargetsaremetandthegridisfurtherdecarbonized,CO2emissionswouldfallbutnotachievetheholygrailofdecarbonization.Thereason:electricityisonly20%-30%oftotalenergyconsumption.Theholygrailis(a)electrificationofenergydemandcurrentlymetviadirectcombustionoffossilfuelssoitcanthenbedecarbonized,and(b)combustionofrenewableorsyntheticfuelsinplaceoffossilfuels.Asshownbelow,directfossilfueluseissubstantialacrossallfourend-usesectorswhetherwe’retalkingaboutadevelopedcountryliketheUSorahighlyindustrialized,developingcountrylikeChina.Overthelast20years,thepaceofelectrificationhasbeenslow.Thenextchartshowselectricityasashareofenergyconsumptionasoftheyear2000,andasof2021.Afewcountriesrelyonelectricityformorethan30%butthey’retypicallysmallerwithabundanthydroorgeothermalpower4.Mostlargercountriesrelyonelectricityforlessthan25%ofenergyconsumption,withsmallgainsof3%-5%sincethenewmillenniumbegan.4Smallercountrieswithhighelectrificationsharesofprimaryenergy,orhighrenewablesharesofelectricity,arerarelyroadmapsforlargerones.CountrieslikeUruguay,Iceland,Norway,CostaRica,NewZealand,SwedenandDenmarktendtohavelowerpopulationdensity,lowertransmissionneedsandmostimportantlylowereconomiccomplexity.ThelatterisestimatedbyHarvardinitsAtlasofEconomicComplexity,andalsobyMIT’sObservatoryofEconomicComplexity.Thesemeasuresassesseachcountry’sabilitytoproduceawiderangeofcomplexproductsacrossindustries,whichinturndrivestheneedformoredevelopedenergysystems.Also:thesecountriesoftenbenefitfromuniqueandabundanthydro,geothermalorsugarcanebiomassresources,andsomebenefitfromproximitytolargercountriesforgridstabilization(Uruguay/Brazil,Denmark/Germany).051015202530IndustrialTransportResidentialbuildingsCommercialbuildingsDirectrenewablesDirectfossilfuelsElectricityUSfinalenergyconsumptionbysectorandfuelSource:EnergyInformationAdministration,JPMAM.2021.QuadrillionBTUsoffinalenergyconsumedbysector01020304050607080IndustrialTransportResidentialbuildingsCommercialbuildingsDirectrenewablesDirectfossilfuelsElectricityChinafinalenergyconsumptionbysectorandfuelSource:EnergyInformationAdministration,JPMAM.2021.QuadrillionBTUsoffinalenergyconsumedbysector0%10%20%30%40%50%60%70%ICENORSWEISRFINBULSWIBANSLOTAIFRAJPNVIEEGYPHICHIBRADENINDUSGERITAUKRUSSAUBy2021By2000Thegradualadvanceofelectrification,2000to2021ElectricityshareoffinalenergyconsumptionSource:BPStatisticalReviewofWorldEnergy,JPMAM.2022.ExecutiveSummaryEYEONTHEMARKET•MICHAELCEMBALEST•J.P.MORGAN13thannualenergypaperMarch28,20236Thetwoenergytransitions.Asshownontheleft,thereareactuallytwoenergytransitionstakingplace:thedecarbonizationofelectricitygenerationviatheadditionofrenewablepower(greendottedline),andtheelectrificationofenergyusesothatitcanthenbedecarbonized(blueline).Thelatterishardertodothantheformer.Let’sdiscussdecarbonizationpotentialintheorderofeachsector’sdirectfossilfueluse:firsttheindustrialsector,thentransportandthenresidentialandcommercialbuildings.Industrialenergyuse5.Plastics,cement,steel,ammonia/fertilizerandotherindustrialmaterialsformthebuildingblocksofthemodernworld.Pathwaysfordecarbonizingthemincludeincreasedelectrificationofindustrialheat,substitutionoffossilfuelsusedforprocessheatandincreasedrenewableelectricityonthegrid.We’vewrittenbeforeonthephysical/chemicalconstraintsandcostsofelectrifyingindustrialproduction(seelinkonpage10).Theshortanswer:directelectrificationoftenresultsinthelossofwasteheatusedinmanyindustrialchemicalreactions,manynon-metallicproductsarehardertoelectrify,andelectricitycurrentlycostsalotmorethannaturalgasperunitofdeliveredenergywhenusedforindustrialheat.Asconfirmationofthispoint,notehowtheelectricityshareofUSindustrialenergyusehasbeenunchangedfordecades.Electricitysharesofindustrialenergyuseareloweverywhere:Africa10%,US12%,Japan13%,India15%,Europe17%andChina21%.Wherearetheelectrificationopportunities?Onequarterofindustrialenergyusesrequiretemperatureslessthan100⁰C,whicharepresumablyeasiertoelectrify;andhighlyefficientindustrialheatpumpscanbeusedfordrying,pressing,sterilizing,stainingandsteaming.Withintherelatedcategoryofindustrialheat,projectedgainsinrenewablesharesoverthenextfewyearsaregenerallysmall.5IntheUS,industrialenergyconsumptionis80%manufacturing,9%miningwiththerestsplitbetweenconstructionandagriculture.Withinmanufacturing,themajorsubsectorsarechemicals37%,petroleumandcoalproducts22%,paper11%,primarymetals8%,food6%andnon-metallicminerals4%.Electricityshareofglobalfinalenergyconsumption,0.23%peryearsince2005Renewableshareofglobalelectricitygeneration,0.55%peryearsince200510%15%20%25%30%35%1990199520002005201020152020GriddecarbonizationoutpaceselectrificationofenergyusePercentSource:BPStatisticalReviewofWorldEnergy,JPMAM.2022.050100150200250IndustrialTransportResidentialbuildingsCommercialbuildingsDirectrenewablesDirectfossilfuelsElectricityGlobalfinalenergyconsumptionbysectorandfuelSource:EnergyInformationAdministration,JPMAM.2021.QuadrillionBTUsoffinalenergyconsumedbysector0%5%10%15%20%25%30%35%40%45%19501960197019801990200020102020ElectricityshareofUSindustrialenergyuseunchangedfordecades,ShareofindustrialenergyuseSource:EIA,JPMAM.January2023.NaturalgasElectricityPetroleum0%10%20%30%40%50%60%BrazilIndiaEUUSRestofWorldChina20212027PercentRenewableshareofindustrialheatconsumptionSource:IEA.2022.ExecutiveSummaryEYEONTHEMARKET•MICHAELCEMBALEST•J.P.MORGAN13thannualenergypaperMarch28,20237Transportation/oildemand.EVsaleswere10%ofglobalpassengercarsaleslastyear,rising68%in2022withanother40%gainprojectedfor2023;andthat’sjustbatteryelectricvehicleswithoutincludingplug-inhybrids.Thetop4globalspotswereheldbyTesla,BYD(whoseorderbookisnow3xTesla’s),SAICandVWGroup.EVperformancemetricsarealsoimproving:ArgonneNationalLabciteslongeraverageEVrange(300miles),faster0-60acceleration(5seconds),morepower(250kW)andbetterfuelefficiency(29kWhper100miles)forEVssoldintheUS.Asshownontherighthowever,ittakesmanyyearsofhighEVsalestoelectrifylargeportionsofthefleetgiventhe12-13yearaveragelifeofmoderncombustionenginevehicles,usingtheUSasanexample.RatherthangettingcaughtupincompetingprojectionsofEVpenetration,let’sgettothebottomline:whatmightglobaloildemandlooklikein10-15years?Suchprojectionsarecomplex:theyrequireestimatesofEVdemand,population,mileagetraveled,vehiclereplacement,incentivesandhome-sourcingrules6,ICEmileageandprojectionsofdemandfromnon-transportsectorswhichaccountforalmosthalfofglobaloilconsumption;althoughtobeclear,refiningandpartofthe“Other”categoryarelinkedtopassengercars/EVsaswell.Somewidelycitedestimatesappearbelow.Ifthey’reright,oildemandwillfinallystoprisinginexorablyintothefuture,butitcouldtake20yearsforglobaloildemandtomeaningfullydecline.SomeBPandIEAscenariosprojectlargerdemanddeclines,butthey’rebackloadedafter2030.6OnMarch31st,TreasuryreleasedfinalguidanceonEVsubsidieswhichwillbeeffectiveApril18.It’salongstory,butthebottomlineisthatSen.Manchin’sobjectivespartiallysurvived:EVsubsidieswillbeconfinedtovehicleswhosebatteryassemblyandcriticalmineralsarepredominantlysourcedfromtheUSoritsallies,withclausesdisallowingsubsidieswhenbatterycomponentsorcriticalmineralsaresourcedfrom“foreignentitiesofconcern”,withfurtherguidanceforthcoming.Thesetestsgetstricterovertime;andtheyareappliedseparately,withbatteryassemblyandcriticalmineralseachaccountingfor50%ofthe$7,500subsidy.ChinaChinaChinaEuropeEuropeEuropeUSUSOthersOthers024681012202120222023est.OthersUSGlobalsalesofbatteryelectricvehiclesNumberofvehicles,millionsSource:WSJ,LMCAuto,EVVolumes.January16,2023.0%1%2%3%4%5%6%7%2010201220142016201820202022EVshareoflightdutyvehiclesales,3mo.avg.EVshareoflightdutyvehiclefleetEVshareoflightdutyvehiclemilestraveledShareofgasolineconsumptiondisplacedbyEVsEVshareofelectricityuseIttakestimeforEVsalestoimpactentirefleetPercentSource:ANL,JPMAM.2023.JPMIB405060708090100110197019801990200020102020203020402050Oildemand,supplyfromexistingfieldsanddemandprojections,MillionbarrelsperdaySource:BP,EIA,IEA,OPEC,WoodMac,BNEF,JPMorganIB,JPMAM.2023.Oilsupply(assumingnonewdevelopment)BPNMWoodMacOPECIEAAPIEASPOPECReference/Adv.TechCasesJPMIBInvestmentBankWoodMackenzieBaseCaseBNEFBloombergNewEnergyFinanceIEASPStatedPoliciesBPNMNewMomentumIEAAPAnnouncedPledgesBNEF53%47%PassengerRoadfreightAviation&shippingOtherChemicalsOilrefineriesBuildingsPowerTransportNon-transportGlobaloildemandbysectorPercentSource:IEA,JPMAM.2022.16%11%12%17%6%8%4%27%ExecutiveSummaryEYEONTHEMARKET•MICHAELCEMBALEST•J.P.MORGAN13thannualenergypaperMarch28,20238There’salotwrittenaboutbiofuelsbutapartfromBrazilandIndonesia,biofuelcontributionstofuelsuppliesaresmall.TheUSnowsupportsbiofuelswith$10billionintaxcreditsfornewproductionandinfrastructure,buttheboosttobiofuelsasashareoftransportfuelusemaybejust2%-3%ontopofexistingethanolconsumption7.Similarly,renewableaviationfuels(RAF)mayrepresentjust1%ofglobaljetfuelconsumption5yearsfromnow,withtheUSpossiblyreaching2%witha$1.75pergallonSustainableAviationFuelCreditintheenergybill8.RAFpathwaysneedmorecompellingproofstatementsthananythingwe’veseensofar.Asshowninthe2ndchart,estimatedcostsforrenewableaviationfuelsare2x-8xhigherthanjetfuelprices9.Somethingtowatch:theriskofbiofuelfeedstocksupplyconstraintsregardinganimalfats,wasteoilsandotherresidueoils(3rdchart).Inthebox:thenever-endingfoodfightovercornethanol’scarbonfootprintasbushelsofUScorngrownforethanolarenowroughlythesameasthosegrownforhumanandlivestockconsumption.7IntheUS,ourcommoditiesanalystsexpect300kbdofbiodieselby2024(~8%ofUSdieselproduction)8Irefertothe“energybill”ratherthanthe“InflationReductionAct”,sincealargepartoftheprojectedIRAdeficitreductioncomesfromrevenuesraisedbytheInternalRevenueServiceaftera$45bninfusionfornewenforcementagents.AsexplainedintheSeptember2022EyeontheMarket,GAOdataonrevenuesraisedperIRSauditarelowerthantheimpliedCBOestimatesusedtoscoretheIRA.9“Netzeroaviationfuels:resourcerequirementsandenvironmentalimpacts”,RoyalSociety,February20230%5%10%15%20%25%USBrazilIndo-nesiaIndiaCanadaEuropeRestofWorldGlobal20212027BiofuelshareoftransportdemandShareoftransportdemandSource:IEA.2022.SugarcanemolassesCorngrainSugarcaneAgriresiduesEnergycropsRenewableelectricityMunicipalwasteAgriresiduesEnergycropsSoyoilPalmoilPalmdistillateUsedcookingoil0.00.51.01.52.02.53.03.54.04.5HydroprocessedestersandfattyacidsGasificationPowertoliquidsAlcoholtojetSynthesizedisoparaffinsJetfuelfromfossilfuelsSource:RoyalSocietyPolicyBriefing.February2023.Energycropsincludeoilseed,miscanthusandpoplar.RenewablejetfuelcostestimatesCost(Eurosperliter)0%20%40%60%80%100%201020122014201620182020202220242026UsedcookingoilandanimalfatsUsedcookingoil,animalfatsandotherwasteoilsVegetableoilsSugarcaneMaizeBiofueldemandshareofglobalproduction/supplyPercentSource:IEA,JPMAM.2023.FoodFight:competingstudiesoncornethanolA2022studypublishedintheProceedingoftheNationalAcademyofSciences(fromresearchersattheUniversityofWisconsin-Madison)concludedthatethanolisworsefortheenvironmentthangasoline,contradictingapriorstudycommissionedbytheUSDA.Thenewstudyestimatesthatethanol’scarbonintensityis24%higherthangasoline,whilethe2019USDAstudyfoundthatethanol’scarbonintensityis39%lower.Thenewstudyaccountsforemissionsresultingfromlandusechanges(i.e.,tillingofcroplandthatwouldhavebeenretiredorenrolledinconservationprograms).Unsurprisingly,theCEOoftheRenewableFuelsAssociationdescribedthenewstudyas“fictionalanderroneous”andfilledwithworst-caseassumptions.ExecutiveSummaryEYEONTHEMARKET•MICHAELCEMBALEST•J.P.MORGAN13thannualenergypaperMarch28,20239Commercialandresidentialbuildingheat.Decarbonizationofbuildingheattakesseveralforms:increaseduseofrenewablesonthegrid,increasedelectrificationofheatviaheatpumps(discussedlastyear,seelinkonp.10),renewabledistrictheat(mostlyusedinScandinavia)anddirectuseofgeothermalandsolarthermalenergy.Renewablegainsforbuildingheatmaybefasterthanintheindustrialsector.Europeanheatpumpadoptionisrisingasboilersalesdecline,andintheUS,propaneandheatingoilcustomersareprobablytheprimarydriversofheatpumpsovertakinggasfurnacesales.Significantimprovementsinheatpumptechnologyhavetakenplaceoverthelastdecade:asperthefourthchart,CO2emissionsfromanair-to-airheatpumparenowlowerthanthemostefficientgasboiler,despitehigherthermallossesfromgridelectricityvsonsitegascombustion.AnoffsetinEurope:homesaddingheatpumpsareaddingairconditioningtoo,andmanyforthefirsttime;declinesinwinterenergyusecouldbepartiallyoffsetbyrisingsummerenergyuse(seesecondbox).0.00.51.01.52.02.53.0'10'11'12'13'14'15'16'17'18'19'20'21'22MillionsBrine-waterSanitaryhotwaterAir-airAir-waterEuropeanheatpumpsalesreach3millionunitsAnnualsales,millionsSource:EuropeanHeatPumpAssociation.February2023.GasfurnaceHeatpump1.01.52.02.53.03.54.02009201120132015201720192021USheatpumpsalesexceedgasfurnacesalesAnnualsales,millionsSource:AirConditioning,HeatingandRefrigerationInstitute.2023.$5$10$15$20$25$30$35$40200020042008201220162020HeatingoilPropaneNaturalgasHeatingoilandpropaneusers;greaterincentivetoswitchtoheatpumps,US$permillionBTU,residentialpricingSource:EIA,JPMAM.February2023.1=naturalgasboiler(98%efficiency)0.00.51.01.52.02.5201020212010202120102021Source:IEA,JPMAM.2022.Largeefficiencygainsinheatpumptechnologysince2010HeatpumpCO2emissionsratiovsnaturalgasboilerperunitofheatNorthAmericaEuropeAsiaPacific0%5%10%15%20%25%30%35%EUChinaUSRestofWorldIndiaSub-S.Africa20212027Source:IEA.2022.RenewableshareofbuildingheatconsumptionPercentExecutiveSummaryIEAprojectionsofrenewableheatsharesarerising.Theseincreasesreflecttwoprimaryfactors:fallingbuildingheatconsumptionsinceheatpumpsrequirelessenergyperunitofheatthanon-sitefuelcombustion;andtheby-productofmorerenewablesonthegridthatgeneratetheelectricitywhichisusedbytheheatpumpsthemselves.USvsEuropeanairconditioningtrendsUShomeownersuse~1,800kWhperdwellingeachyearforairconditioning.InmostcountriesinEurope,thisfigureislessthan100kWh.Heatpumpsarealsoairconditioners….sotheenergy/CO2benefitsofheatpumpsinEuropewilllikelybeoffsetbysummeruse.EYEONTHEMARKET•MICHAELCEMBALEST•J.P.MORGAN13thannualenergypaperMarch28,202310Concludingremarksforthisyear’sExecutiveSummaryIseequiteafewenergypaperswhoseauthorsprojectseismicchangesintheenergylandscapeoutto2050,withsomecomponenttransitionsprojectedtooccurin2035,2040orevenlater.Ihavenoideahowtheyclaimtohavevisibilitythatfarout;justthinkaboutwhathappenedintheworldoverthelast3years.Decarbonizationofelectricity,passengercarsandwinterheatinginhomesandbuildingsisadvancinginmanypartsoftheworld;thatpartisclearandfossilfuelusewillalmostcertainlystarttoplateauinthedevelopedworld,buttheprocesswilltakeyears/decades.Onindustrialenergyuse,thefutureislesscleargivenobstaclesdiscussedabove,particularlyinthedevelopingworld.That’saboutasfarasIcansee.OnethinktankthatmodeledtheUSenergybillonbehalfoftheUSSenateprojectedmassivesolarandwindexpansionandGHGdeclinesoutto2035.Itsreportwasalsoaccompaniedbythefollowingcaveat,ifyouwereabletospotit:“Severalconstraintsthataredifficulttomodelmaylimitthesegrowthratesinpractice,includingtheabilitytositeandpermitprojectsatrequisitepaceandscale;toexpandelectricitytransmission,CO2transportandstoragetoaccommodatenewgeneratingcapacity;andtohireandtraintheexpandedenergyworkforcetobuildtheseprojects.”So,aslongastherealitiesoftheworldinwhichwelivedon’tgetintheway,thegoalsareallachievable.That’showIrecommendthatyouinterpretlong-datedenergyprojectionsfromWallStreetfirms,energythinktanksandgovernments:theytypicallyassumethatinvestorsandlenderstakeadvantageofsubsidiesinanoptimizedworldinwhicheconomicincentivesarethesoledriversofchange.Theultimatepathoffossilfueldemanddepictedonpage1willbedeterminedbytechnology,policy,trade,chemistry,physics,geopolitics,trade,costandnationalism,allofwhichwediscussinthesepaperseachyear.Myview:fossilfuelusewillevolveclosertotheslowerofthetwoIEAscenarios.Ifthat’sthecase,itwouldbeprematuretorelyonrenewableenergyformorethanitisorganicallycapableofproviding,andcountriesthatconstrainaccesstofossilfuels10alongsiderenewablesmayregretit.Inthisyear’stopicsectionswestartwith“levelizedcost”,aflawedconceptwhichdoesnotincorporatetherealityofenergysystemswithalotofintermittentrenewablepower,andwhichinspiredthisyear’scoverart.Othertopicsincludetransmission,theavailabilityandcostoftransitionminerals,thedisputeoversmallmodularreactornuclearwaste,peakingUSgasolinedemand,theinfrastructureandenergychallengesrequiredformeaningfulcarbonsequestration,makingenergyfromgarbage,improvingenergystorageeconomics,methanetracking,theRussia-Chinaenergyaxisandthedistractionof“futurist”ideasthatareunlikelytomakealargecontributiontodecarbonizationanytimesoon(electricplanes,fusion,DACC,spacesolar,etc).MichaelCembalestJPMorganAssetManagement10SomeenergyprojectionsrefertotheendoftheageofUSoil&gasresourceexpansion.Perhaps,butitwouldn’tbeforalackofavailablesupply.AccordingtoEIA/USGSdata,unprovenreservesofUSoil&naturalgasare6.9xand5.3xhigherthanUSprovenreserves.Beforegettingintothisyear’stopics,here’salinktowhatwewroteonthreeissuesdiscussedlastyear:hydrogen(or“whydrogen”,aswerefertoit),electrificationofindustrialenergyuseandthetechnologyandgriddemandsofresidentialheatpumps.Theirfundamentalshaven’tchangedmuchsoratherthanincludethemagain,wecreatedawebpageforclientstoaccessthem:EyeontheMarketEnergyArchives.ExecutiveSummaryEYEONTHEMARKET•MICHAELCEMBALEST•J.P.MORGAN13thannualenergypaperMarch28,202311EnergyinvestmentupdateWhiletheenergydiscounttothemarkethasrecoveredfromits90-yearlowin2020,thesectorstilltradesatadiscounttothemarketonaP/EbasisandwhenlookingatROEvspricetobookvalue.Theperformancegapbetweenrenewablesandtraditionalenergycontinuestonarrowfrom2021levels.Energycompaniesareprofitableagainafteradecadeofnegativenetcashflow,andUSshalesectorreinvestmentrateshavefallentothelowestlevelsinadecade.EnergyMaterialsIndustrialsConsumerdiscretionaryConsumerstaplesHealthcareFinancialsInfotechCommunicationservicesUtilitiesRealestateAutosRetailingSoftware&servicesSemiconductorsAirlinesHealthcareequipmentHealthcareprovidersBiotechPharmaLifesciencetools&servicesS&P5001x2x3x4x5x6x7x8x9x10x10%15%20%25%30%35%40%S&P500valuationsvsreturnonequitySource:Factset,JPMAM.March25,2023.Consensusforward12monthreturnonequityConsensusforward12monthpricetobookratio-$12-$8-$4$0$4$8$12$16$20$2420132014201520162017201820192020202120222023Source:Bloomberg.Q42022.OilandgasindustryfinallyturnsaprofitFreecashflow,$billionsS&P1500OilandGasE&PIndexShalerevolutionportfolio(22companies)0.30.60.91.21.51.82.12.42.71928193819481958196819781988199820082018Source:EmpiricalResearch.February2023.Equalweightedportfolio.Energysectorvaluationshaverisenfromall-timelowsvsmarket,Energystockspricetobookdividedbymarketpricetobook1928-2022averageRenewablescomposite(equalweighted)MSCIWorldEnergyIndex(oil,gasandpipelines)05010015020025030035040045050020182020202120222023"Reportsofmydeathweregreatlyexaggerated"Index(100=Dec2018)Source:Bloomberg,JPMAM.March17,2023.NASDAQCleanEdgeWilderhillCleanEnergyFTSERenew/AltEnergyS&PGlobalCleanEnergyMACGlobalSolar-5%0%5%10%15%20%25%30%199520002005201020152020S&P500energyshareofmarketcapandnetincomePercentSource:Factset,JPMAM.March17,2023.MarketcapshareNetincomeshare0%20%40%60%80%100%120%140%160%180%200%$0$4$8$12$16$20$24$282013201420152016201720182019202020212022CashflowfromoperationsCapitalspendingReinvestmentrateUSshalereinvestmentrateat10-yearlowUS$,billionsPercentSource:Bloomberg,JPMAM.Q42022.EnergyinvestmentupdateEYEONTHEMARKET•MICHAELCEMBALEST•J.P.MORGAN13thannualenergypaperMarch28,202312EssentialenergychartsWeupdatemanyessentialchartseachyeartotracktheenergytransition.HerearesomethatdonotappearelsewhereintheExecutiveSummaryorintheindividualsections.Onthispage:thedeclineinwindandsolarpowerpurchaseagreementprices;renewablesharesofprimaryenergyandelectricitybyregion;globalwindandsolargenerationovertakesnuclearpower;howelectrificationismostlyusedbyhomesandbuildingsforspacecoolingandotherHVACintheUS;coalreliancebycountry;andhowChinesecoaladditionsoffsetdecommissioningintherestoftheworld.$0$20$40$60$80$100$120$140$160$180$200$220201020122014201620182020Source:LawrenceBerkeleyNationalLaboratory,IRENA.2021.AveragepowerpurchaseagreementbyyearofoperationReal2020$permegawatthourUSwindGlobalwindUSsolarphotovoltaicGlobalsolarphotovoltaicNote:PPAsreflectthebenefitofsubsidiessuchastheUSITC0%10%20%30%40%50%60%70%80%BRACANEURCHNJPNUSINDRUSKORGlobalRenewablesas%ofelectricitygenerationRenewablesas%ofprimaryenergyRenewableshareofprimaryenergyandelectricityPercent,includinghydropowerSource:BP,JPMAM.2022.Note:largest9countriesbyprimaryenergyuse.05001,0001,5002,0002,5003,000'65'70'75'80'85'90'95'00'05'10'15'20Globalnuclearvssolar+windelectricitygenerationTerawatt-hoursSource:BPStatisticalReviewofWorldEnergy,JPMAM.2022.NuclearWind+Solar012345ResidentialCommercialIndustrialSpaceheating,waterheating,motorsandprocessheatSpacecooling,lighting,ventilation,refrigeration,computersandotherelectronicequipmentUSelectricityuses:primarilyHVACQuadrillionBTUsSource:EIA,JPMAM.2022.Transporttoosmalltoplotat0.06quads.0%10%20%30%40%50%60%70%80%'90'93'96'99'02'05'08'11'14'17'20SouthAfricaChinaIndiaVietnamPolandIndonesiaJapanGermanyUSCoalshareofprimaryenergyconsumptionPercentSource:BPStatisticalReviewofWorldEnergy,JPMAM.2022.-40-20020406080100200020042008201220162020TheimpactofChinaonglobalcoalcapacityCoalcapacity:additionsandretirements,gigawattsSource:CentreforResearchonEnergyandCleanAir.2021.OtheradditionsChinanetadditionsUS/EUnetretirementsOtherretirementsEssentialchartsEYEONTHEMARKET•MICHAELCEMBALEST•J.P.MORGAN13thannualenergypaperMarch28,202313Onthispage:shareofglobaloil,gas&coalreservesbycountry;changesinregionalenergyindependencesince1980;EVmetalscostsperbatterytype;sharesofenergyintensivemanufacturingindevelopedanddevelopingcountries;arelatedchartshowingtheprojecteddeclineinprimaryenergyconsumptioninthedevelopingworld,offsetbyrisingenergyconsumptiongrowthinthedevelopingworld(butnotChina);andthecostofelectricityvsnaturalgasperunitofenergywhenusedforindustrialheat.MiddleEastMiddleEastUSUSUSRussiaRussiaRussiaLatamRoWRoWChinaAfricaAfricaAustraliaEuropeCanadaIndia0%10%20%30%40%50%60%70%80%90%100%OilGasCoalShareofglobalfossilfuelreserves,2020Percent,includingunprovenbutrecoverablereservesfortheUSSource:BPStatisticalReviewofWorldEnergy,EIA,JPMAM.2022.-800-600-400-20002004006008001,00019801990200020102020Source:BPStatisticalReview,NBSChina,JPMAM.2022.EnergydependenceandindependenceNetimportsofoil,naturalgasandcoalinmilliontonnesofoilequiv.EuropeUSChinaRussiaNetexporterNetimporter$0$400$800$1,200$1,600$2,000$2,400$2,800$3,200$3,600Jan'20Jul'20Jan'21Jul'21Jan'22Jul'22Jan'23LithiumNickelManganeseCobaltOxidebatteryNMC:Li,Ni,Mn,Co,Cu,Al,steelLithiumNickelCobaltAluminumOxidebatteryNCA:Li,Ni,Co,Al,Cu,steelLithiumIronPhosphatebatteryLFP:Li,Cu,Al,steel,ironEstimatedmetalscostperEVbatterytypeUS$per60kWhbatterySource:Univ.ofBirmingham(UK),ANL,Bloomberg,JPMAM.March20,2023.UsingUSlithiumhydroxideprices0%10%20%30%40%50%60%70%80%90%100%1995202119982022199820221998202220052021Source:UNDESA,Worldsteel,PlasticsEurope,USGS,JPMAM.2022.Ashiftinenergyintensivemanufacturingtotheemergingworld,%ofglobalproductionManufacturingSteelAmmoniaCementDevelopedeconomiesEmergingeconomiesPlastic-20-1001020304050EUJapanUSLatinAmericaSEAsiaex-China/IndiaMiddleEastAfricaChinaIndiaHistoricalchange2010to2021Projectedchange2021to2050Source:IEAStatedPoliciesScenario.2022.ProjectedEMenergyuseoffsetsDMdeclinesChangeinprimaryenergy,petajoules0PJCaliforniaTexasIndianaLouisianaOhioIllinoisPennsylvaniaUKItalyGermanySpainFranceChinaJapan0x1x2x3x4x5xSource:EIA,Eurostat,CEIC,JPMAM.October2022.StatesshownarelargestindustrialusersofUSprimaryenergy.Electricity:1.5x-4.5xmorecostlythangasforindus.heatElectricitycostperMJdividedbynaturalgascostperMJ,industrialusers,assuming85%industrialfurnaceefficiencyEssentialchartsEYEONTHEMARKET•MICHAELCEMBALEST•J.P.MORGAN13thannualenergypaperMarch28,202314[1]Numbersin,Garbageout:thepracticalirrelevanceof“levelizedcostofenergy”forwindandsolarpower“Levelizedcostofenergy”isadistractionifyou’retryingtounderstandtotalsystemcostsofelectricity.Why?Whencomputedforindividualgenerationorstoragetechnologies,LCOEdoesnotproperlytakeaccountof:(a)theneedforbackuppower,storageandreservemarginstomaintainsystemreliability(b)thevalueofelectricitysuppliedatdifferenttimesofthedayoryear(c)theneedtooverbuildwindandsolarcapacitytomeetdemandindeeplydecarbonizedsystemsInotherwords,LCOEonlymeasuresthecostofamarginalMWhofwindorsolarpowerandtypicallydoesnotincludeanyoftheseothercapitaloroperatingcosts.That’swhyIgenerallyignoreit,andI’mamazedathowmanypeoplestilldon’trealizethatLCOEisamisleadingbasisforestimatingtotalsystemcoststogovernments,electricityconsumersandtaxpayers.IspokeaboutthisrecentlywithPaulJoskow11atMIT.PaulremindedmethatLCOEwasoriginallydevelopedtocomparecostsofdispatchablebaseloadnuclearandcoalplantswiththesamecapacityfactors(similargenerationattributes),andremindedmeofsomethinghewrotebackin2011:LCOEis“inappropriateforcomparingintermittentgeneratingtechnologieslikewindandsolarwithdispatchablegeneration…andalsoovervaluesintermittentgeneratingtechnologiescomparedtodispatchablebaseloadgeneration”.12Paulcontinuestobelievethat“LCOEcomparisonsofbaseloadandintermittent,non-dispatchablegenerationmakelittlesense,andthatwhat’sneededinsteadisasystem-widemodelratherthansimplisticLCOEcalculations”.ConsiderGermany,whoseambitiousEnergiewendetransitionisoneoftheworld’smostadvancedeffortsatdecarbonization.AsGermany’srenewableenergyuseroseto17%ofitsprimaryenergyconsumptionand45%ofitselectricityconsumption,itsCO2emissionsandfossilfuelconsumptiondeclined.Sofarsogood,buthowmuchdiditallcost?EventhoughoverallGermanenergyandelectricityconsumptionfell,installedelectricitygenerationcapacitydoubled.WhatintheHölleisgoingonhere,andhowcouldmarginalLCOEforwind/solarbeofanyuseunderstandingtotalcostsifthisiswhathighrenewablesystemsrequire?Let’stakeacloserlook.11PaulL.JoskowistheElizabethandJamesKillianProfessorofEconomicsEmeritusatMIT.HewasthePresidentoftheAlfredP.SloanFoundationfrom2008through2017andreturnedtoMITin2018.HewastheDirectoroftheMITCenterforEnergyandEnvironmentalPolicyResearchfrom1999through2007.HeisaResearchAssociateattheNationalBureauofEconomicResearchandamemberoftheCouncilonForeignRelations.12“ComparingCostsofIntermittentandDispatchableElectricityGeneratingTechnologies”,PaulJoskow,AmericanEconomicReview,2011556065707580859095100105200220062010201420182022GermanyCO2emissionsandfossilfueluseIndex(100=2002)Source:AGEnergiebilanzen,BP,JPMAM.2023.FossilfuelsusedforprimaryenergyconsumptionFossilfuelsusedforelectricitygenerationCO2emissionsInstalledgenerationcapacityPrimaryenergyconsumptionElectricityconsumption80100120140160180200200220062010201420182022GermanygenerationcapacityandenergyuseIndex(100=2002)Source:BundesverbandBDEW,FraunhoferInstitute,JPMAM.2023.ProblemswithLCOEEYEONTHEMARKET•MICHAELCEMBALEST•J.P.MORGAN13thannualenergypaperMarch28,202315“Intermittencygonewild”:what’swrongwithLCOE,usingreal-lifeexamplesTexaswindcapacityfactorsaveraged32%inDecember2022.Butthatdoesn’tmeanthatwindprovidedsteadypowerat32%ofinstalledcapacity;asshownontheleft,Texaswindgenerationvariedfromalowof5%ofcapacitytoapeakof70%duringthemonth.Whythismatters:LCOEissoblissfullyunawareofrealitythatitiscalculatedtheexactsamewaywhetherTexaswindcapacityfactorsare32%foreveryhourofDecember,oriftheyaverage32%butvaryfrom5%-70%.Thisispreposteroussinceinthelatterscenario,backupthermalpower/storageneedsaremuchhigherthanintheformer.LCOEisthecocktailnapkinofenergymath.Whatactuallyhappened?OnDec23,temperaturesdroppedto13⁰-28⁰Fvsaveragelevelsof45⁰F,causingelectricitydemandtospiketoitshighestleveleverwhilerenewableoutputcollapsed.Risingelectricitydemandwasmetbynaturalgasoutputdoubling.EvenifTexaswindandsolarcapacitywere5x(!!)larger,theneedforgasfiredpowerthatdaywouldonlyhavebeen20%lower.Inotherwords,amassivegapthatonlybackuppowercouldfill,noneofwhichisaccountedforinLCOE.Whataboutenergystorage?Lowwindconditionslastedfor3days,inwhichcasemanybillionsofdollarsof4-6hourstoragewouldhavebeenneededinstead.InGermany,lowwindconditionscanlastforweeks13,persistingforsuchalongtimethattheyhavetheirownword:a“dunkelflaute”.DuringlastDecember’sdunkelflaute,theelectricitydemandgapwasmetbymoregenerationfromcoalandimportedLNG.ThesituationmaybemorechallengingnextwinterwhenthelastofGermany’snuclearplantsmayhavebeendecommissioned.LCOEisoflittleuseinGermanyforthesamereasonsasinTexas:itcompletelyignoresbackuppowerneeds.It’snocoincidencethatelectricitycostsinEuropetendtorisewithrenewablepenetration;that’sanothersignthatLCOEismissingthebiggerpicture.13Offshorewindcandisappeartoo:foraweekinMarch2022,UKoffshorewindcapacityfactorsaveragedjust12%.Also:contiguousregionssharecommonwindpatterns.InadjacentERCOT,SPP,MISOandPJMregionsintheUS,pairwisecorrelationsofwindgenerationbyhourrangedfrom0.58to0.68in2021.0%10%20%30%40%50%60%70%1-Dec8-Dec15-Dec22-Dec29-DecERCOTwindcapacityfactorsbyhour,December2022PercentSource:EIA,JPMAM.December2022.Decemberaverage10203040506070801-Dec8-Dec15-Dec22-Dec29-DecSolarERCOTbaseloadandrenewablegenerationvsdemand,December2022,GWSource:EIA,JPMAM.December2022.NuclearWindElectricitydemand0102030405060708031-Oct14-Nov28-Nov12-Dec26-DecHydroSolarNuclearGermanygenerationbysource,Nov-Dec2022MWper15minuteinterval,thousandsSource:FraunhoferISE,JPMAM.2022.WindBiomassElectricitydemand"Diedunkelflaute"BEBGCZDKDEEEIEELESFRHRITLVLTLUHUMTNLATPLPTROSISKFISEISNO0.100.150.200.250.300.350.00.51.01.52.02.53.03.5HouseholdelectricitypricesvswindandsolarpenetrationinEuropebycountry,Electricityprices,EUR/kWh(H22021)Windandsolargeneration,TWhpercapitaSource:Eurostat,JPMAM.2022.ProblemswithLCOEEYEONTHEMARKET•MICHAELCEMBALEST•J.P.MORGAN13thannualenergypaperMarch28,202316Alternativeassessmentsofhighrenewablesystems:capacitycreditsandloadcarryingcapacityGridmanagershavedevelopedtheirownlanguagetoanalyzestability,adequacyandcostforsystemswithhighrenewablepenetration.Iwillbrieflydiscusstwoofthem:capacitycreditsandeffectiveloadcarryingcapacity.Capacitycreditsrefertotheamountofthermalcapacitythatcanbedisconnectedwhenaddingmorewindandsolarpowertoagivengrid.UsingdatafromUSISOs,wecomputedtheamountofnaturalgasthatcanbedisconnectedwhenaddingsolarandwindtomeetanother10%ofdemand.Theresult:duetowindandsolarintermittencyandtheneedtomeetdemandandmaintainsystemreliability,only10-30MWofnaturalgascouldbedisconnectedforevery100MWofnewwindandsolarcapacity.Thesecapacitycreditsdeclineasmorewindandsolarareaddedtothesystem,whichtheIEAacknowledgesaswell:“thesystemvalueofvariablerenewablessuchaswindandsolardecreasesastheirshareinthepowersupplyincreases”.Bottomline:capacitycreditsareanotherwayofillustratingthatLCOEignoressystemwidecapacityrequirements.Amorerobustapproach.Somegridmanagersuseeffectiveloadcarryingcapacity(ELCC)toassesstheimpactonsystemreliabilityfromaddingrenewables;seeboxforadescriptionofhowitworksandwhousesit.Oneexample:assumethatCaliforniabuildsadeeplydecarbonizedsystemwith20GWofwind,150GWofsolarand75GWofstorage.AsperthechartontheleftfromE3EnergyandEnvironmentalEconomics,thissystemwouldonlyhave50GWofreliableloadwithwhichtomeetdemand(ELCC=50GW).Alternativelystated:ifthissystemneeded50GWofreliablepowerandwasdesignedwithrenewablesonly,itwouldneed245GWofwind,solarandstoragetomakeitwork.ThemarginalELCCofwind,solarandstorageareattheirhighestwhenrenewablesarefirstaddedtothesystem;theircontributiontosystemreliabilityfallsrapidlyafterthat.LCOEreflectsnoneoftheserealities,whichiswhytheISOsandutilitiesshowninthetextboxlookatELCCinstead.NYISO(NY)CAISO(California)ERCOT(Texas)PJM(MidAtlantic)SOCO(Southeast)SPP(Midwest)ISNE(NewEngland)MISO(UpperMidwest)0%10%20%30%40%50%60%70%80%90%100%HowmuchnaturalgascapacitycanbereducedperMWofnewwindandsolarpower?Source:EIAdata,JPMAMcomputations.2022.%,computedfor2021,assumingnewwindandsolar=10%ofdemand050100150200250RenewablecapacityELCCcapacityvalueDiversitybenefit6-hrstorageWindSolarCalifornia'sELCC:245GWofwind/solar/storageonlyprovides50GWofloadcarryingcapacity,GWSolar4-hrstorage0%20%40%60%80%100%0153045607590105120135150ThemarginalELCCofCalifornia'ssolar,windandstorage%,thermalcapacityremoved/nameplatecapacityaddedGWWindEffectiveloadcarryingcapacity(ELCC)•UsedbyCAISO,PJM,NYISOandMISOinResourceAdequacyPlanningpresentations;andbyutilitiessuchasDuke,ElPasoElectric,NovaScotiaPowerandentitiesinColorado,PortlandandNewMexico•Incorporatesreservemarginrequirement•Probabilisticscenarioanalysisbyhour,weekandmonthofallthefactorsaffectingthegrid:windandsolargeneration,othergenerationsourcesalreadyonthegrid,loaddemand,possiblegeneratoroutageratesduetoweatherconditions,etc•Incorporatesthediversitybenefitfromaddingwind,solarandstorageatthesametimeSource:"Long-RunResourceAdequacyunderDeepDecarbonizationPathwaysforCalifornia",E3,June2019.ProblemswithLCOEEYEONTHEMARKET•MICHAELCEMBALEST•J.P.MORGAN13thannualenergypaperMarch28,202317Onefinalwaytoillustratethebigpicture:“levelizedfullsystemcostsofelectricity”.AnanalysisfromRiceUniversityusedERCOTinTexastoanalyzetotalsystemcost.Theapproachassumesthat95%ofsystemloadmustbemetfromoneofthefollowing:biomass,coal,naturalgascombinedcycleplants,naturalgascombustionturbines,orwind+solar+storage(allowingforasmallamountofdispatchablethermalpower).Onceadequatecapacitytomeetdemandisdetermined,theall-incostofthatcapacityiscomputed.Usingthisapproach,wind+solar+storagesystemsare~2xmoreexpensivethannaturalgas.Whilethisapproachhasitslimitations,it’sabetterestimateofthetruecostofwind,solarandstoragethanLCOE.ThesameapproachappliedtoGermanyyieldsevenhigherfullsystemcostsforwind+solar+storage14.Wouldlower-costenergystoragehelp?Theanalysisalsoassessedwhetherfallingstoragecostscouldreducethefullsystemcostsofdeeplydecarbonizedsystems.Theanswer:notbyverymuch,evenwhenstoragecostsfallby50%ormorefromtoday’slevels.Toconclude,astarkwarningfromPJM15,theIndependentSystemOperatorrunningtheMid-AtlanticregionandthelargestISOintheUS:•Thegrowthrateofelectricitydemandislikelytocontinuetoincreaseat~1.5%peryearfromelectrificationcoupledwiththeproliferationofhigh-demanddatacenters•Coalandgasgeneratorsarebeingretiredatarapidpaceduetogovernmentandprivatesectorpoliciesaswellaseconomics(retirementsby2030=21%ofinstalledcapacity)•Retirementsareatriskofoutpacingnewresources,duetoacombinationofindustryforcesincludingsitingandsupplychainissues;95%ofthePJMgenerationqueueisrenewableswithcompletionratesofjust5%(!)•PJM’sinterconnectionqueueiscomposedprimarilyofintermittentandlimited-durationresources.Giventheiroperatingcharacteristics,PJMstatesthatit“needsmultiplemegawattsoftheseresourcestoreplace1MWofthermalgeneration”•ThecurrentpathcoulderodePJM’sreservemarginfrom23%in2023tojust5%by2030Ontheissueofso-called“levelizedcostsofenergy”,myworkhereisdone.14TexasvsGermany.SeasonalelectricitydemandvariationismuchhigherinTexasduetohighersummertimeairconditioninguse.TexasbenefitsfromhighercapacityfactorsthanGermanyforwind(35%vs20%)andsolar(23%vs11%);andbenefitsfrompeaksolarcapacityfactorscoincidingwithperiodsofhigherdemand.Onwindcapacityfactors,someresearchersbelievethatrisingArctictemperaturesreducethetemperaturegapvstheequator,andtherebyweakenthejetstream(“Globalstilling:isclimatechangeslowingdownthewind”,YaleSchooloftheEnvironment,JimRobbins,Sep2022).Ifso,windcapacityfactorsmightundershoottargets,andinstancesofwind“dunkelflautes”mightincrease(globalstillness).15“EnergytransitioninPJM:ResourceRetirements,ReplacementsandRisk”,PJM,February24,2023$0$25$50$75$100$125$150BiomassCoalNaturalgascombinedcycleNaturalgascombustionturbineNuclearWindSolarStorageMeanVarianceUS$perMWhERCOT:levelizedfullsystemcostofelectricitySource:"LevelizedFullSystemCostsofElectricity-2023Updates",Idel.2023.$6gasWind,solarandstorageNuclearNaturalgascombinedcycle$0$25$50$75$100$125$15010%20%30%40%50%60%70%80%90%100%ERCOT:levelizedfullsystemcostbyelectricitysourceasafunctionofstoragecosts,US$perMWhStoragecostsasa%ofcurrentlevelsSource:"Levelizedfullsystemcostsofelectricity-2023Updates",Idel.2023.ProblemswithLCOEEYEONTHEMARKET•MICHAELCEMBALEST•J.P.MORGAN13thannualenergypaperMarch28,202318[2]Crudeoilin,refinedproductsout:decliningUSgasolinedemand,risingdemandforotheroilproductsMycolleaguesatJPMorgan’sCommoditiesResearchgrouppublishedaninterestinganalysisonoilrefining16.In2022,despiteareboundinvehiclemilestraveledto2019levels,USmotoristsconsumed6%lessgasolinethanin2019.Partoftheexplanation:anincreaseinvehiclefueleconomy(perhapsareactiontohighgasolineprices)andalsoasmallincreaseinelectrification.Wherethisgetsinteresting…let’stakethistotheextreme:whatifUSgasolinedemandalreadypeakedandisinpermanentdecline(whichiswhattheauthorsbelieve),whileatthesametime,demandforrefinedproductssuchasjetfuelanddistillates(heatingoil,petrochemicalfeedstocks,diesel,waxes,lubricatingoils)remainsthesameorkeepsgrowing?ThiswouldbeabigdealforUSrefinerssincegasolineaccountsfor44%ofUSrefinedproductsdemand,higherthaninothercountries.Inotherwords,fallinggasolinedemandcouldputdownwardpressureonUSrefiningmargins.Whatwouldrefinersdoifthisweretohappen?USrefinerscurrentlyhavelimitedabilitytochangethecompositionofrefinedproductsfromeachbarrelofcrude(thegasolinecomponentofUScrudeoilrefininghasbeenunchangedfor30years;onlydistillatesroseafewpercentvsotherproducts).Asaresult,refinersmighthavetoshrinkcapacitytomakeupforfallingrefiningmargins;inwhichcasepricesfordistillatesmightriseduetodecliningsupply.Inaddition,USrefinersmighthavetospendcapitaltoshifttheirrefiningoutputawayfromgasolineandtowardsotherproducts(whichisexpensive);and/orswitchtonaturalgasliquidsasfeedstockforchemicals.Alloftheseoutcomescouldleadtohigherrefinedproductprices.Maybeadeclineinwork-from-hometrendswillboostgasolinedemandandvehiclemilesbycommutersintheyearsahead;butifitdoesn’t,therecouldbemajorchangesinstoreforUSrefinersandnon-USrefinersservingtheUSmarket.16“CyclicalandstructuralchangesinUSgasolinedemand:drivingmoreonless”,NatashaKanevaandPrateekKedia,JPMorganGlobalCommoditiesResearch,February2,20231001201401601802002202402602805,0005,5006,0006,5007,0007,5008,0008,5009,0009,50019701975198019851990199520002005201020152020Gasolinedemand(lhs)Milestraveled(rhs)USgasolineconsumptionvsvehiclesmilestraveledMillionbarrelsperdayBillionmilestraveledSource:EIA,JPMAM.2022.1214161820222426281975198019851990199520002005201020152020USreal-worldaveragefueleconomybymodelyearMilespergallonSource:J.P.MorganGlobalCommoditiesResearch.2022.GasolineDistillatesJetOthers0%10%20%30%40%50%60%1993199820032008201320182023USrefineryyieldsbyproductPercent,refinedproductshareof1barrelofcrudeoilSource:EIA,J.P.MorganCommoditiesResearch.December2022.15.015.516.016.517.017.518.018.519.019851990199520002005201020152020Source:EIA.December2022.USrefinerycrudeoildistillationcapacityMillionbarrelsperdayOilrefiningEYEONTHEMARKET•MICHAELCEMBALEST•J.P.MORGAN13thannualenergypaperMarch28,202319[3]Intothequeue,butnotout:theslowpaceofgridexpansionandrenewableinterconnectionIftheholygrailofdecarbonizationiselectrification,theworldwillhavetogetbetteratmovingelectronsaround.That’scertainlywhatdeepdecarbonizationplansexpect:aspertheIEA,existinggridinfrastructureintheUS,EuropeandChinawillneedtobesubstantiallyreplacedorexpandedby2030and2050.Unfortunately,gridtransformationslookalmostnothinglikethatintheUSorEurope.Thenextchartshowsgrowthinhighvoltagedirectcurrentlines(HVDC,>400kV)thatoptimizethetransmissionofrenewableenergyfromremotelocations.China,BrazilandIndiahavebeenactiveoverthelastdecade,whiletheUSandEuropehavenot.TheUShasthearoundthesameamountofHVDCasDenmark,andalsothelowestprojectedHVDCintensity(kilometersoftransmissionperGWofgenerationcapacity)intheentiretable.AccordingtoLBNL,theopportunitylossfromUSunderinvestmentinregionalgridlinkagesin2022wasatitshighestlevelinadecade,usingregionalelectricitypricedifferencesasproxy17.17BerkeleyLabElectricityMarketsTransmissionValueFactSheet,LBNL,February2023;seeFigure10.00.51.01.52.02.53.03.5EUUSChinaNew,builtin2031-2050New,builtin2022-2030Current,replacedfrom2022-2050Current,stillinusein2050TransmissiongriddevelopmentKilometers,millionsSource:IEA,JPMAM.2022.0510152025EUUSChinaNew,builtin2031-2050New,builtin2022-2030Current,replacedfrom2022-2050Current,stillinusein2050DistributiongriddevelopmentKilometers,millionsSource:IEA,JPMAM.2022.05,00010,00015,00020,00025,00030,00035,00040,00045,00050,00020062008201020122014201620182020HighvoltagedirectcurrentlinesbycountryDistanceof400+kV,kmSource:GlobalTransmissionReport,JPMAM.2022.ChinaSpainFranceBrazilCanadaUS,Denmark,ItalyIndiaHighvoltagedirectcurrentlineoutlookLength(km)Intensity(km/GW)Length(km)Intensity(km/GW)ProjectionyearChina47,9902265,988302025France22,03116022,5221112031Brazil22,02011724,9401092031Spain21,76619422,2091382029India19,08747165,6351972026Canada5,117345,11734N/AUS2,46222,46222026Denmark2,0831502,847842029Italy1,552133,239192029UK30745,045652030Germany22315,562242031Mexico002,242202027CurrentCountryProjectedSource:GTR,JPMAM.2022.Note:Intensityreferstokilometersoftransmissionpergigawattofelectricitygenerationcapacity.HVDClinesdefinedasDClineswithvoltage>400kV.TransmissionEYEONTHEMARKET•MICHAELCEMBALEST•J.P.MORGAN13thannualenergypaperMarch28,202320Inpriorenergypapers,IreviewedthestateofaffairsinUStransmission:lackofeminentdomain,failedeffortstocreateacceleratedtransmissioncorridors,thelaundrylistofcancelledtransmissionprojectsandareviewofNorthernPass,anHVDClinethatwassupposedtobringhydropowerfromQuebectoMassachusettsat5centsperkWhuntilNewHampshireandMainekilledit(despitecommitmentsfromdeveloperstoburymostofitunderground).Ialsodiscussedchallengesforgridmanagersinintegratingthousandsofsmallwind,solarandstorageprojectscomparedtopastintegrationsofcoal,gasandnuclear.Thisyear,somenewandupdatedchartsontheUS:•Thefirstchartshowshowwindandhydropoweraregenerallylocatedfurtherfrompopulationcentersthannaturalgasandnuclearpower.UsingEIAdata,wecomputedtheMW-weightedaveragedistanceofallgenerationplantsfrompopulationclustersofatleast2millionpeople.Moredistance=moretransmission•ThesecondchartisVaclav’spreferredapproach.Forthelastthirtyyears,theUSgridoperatedwith35-45milesoftransmissionperTWhofelectricitygeneration.Usingatypicaldeepdecarbonizationplananditsassociatedtransmissionrequirements,weestimatethatthe“transmissionintensity”ofhighrenewablesystemswouldbeatleastdoublethecurrentlevel.That’salotofnewtransmission•Butaswehaveexplained,gridexpansioniswaybelowadeepdecarbonizationtrajectory.ThelasttwochartsshowhistoryoftheUSgridandhowthepaceofexpansionslowedfrom1.5%to1.0%inthelast5years,includingrebuildsandupgrades.Only~300milesofhighervoltagetransmissionwerebroughtonlineintheUSin2021,withhalfcomingfromtheWesternSpiritTransmissionlinetotransmitNewMexicowindWindGeothermalHydroSubbituminouscoalSolarBituminouscoalNaturalgasNuclear020406080100120140160Distancerequiredforpowergenerationfacilitiestoreach2millionpeople,Source:EIA,CensusBureau,JPMAMcomputations.2022.Kilometers,MW-weightedaverageThousandsofgigawatt-milesperTWhoftotalelectricitygenerationWindandsolarasa%oftotalelectricitygeneration0%10%20%30%40%50%60%70%80%90%304050607080901001101990200020102020203020402050TransmissionintensityofadecarbonizedgridThousandsofGW-milesperTWhPercentSource:DOE,UTAustin,PrincetonNetZero,JPMAM.2022.2020Deepdecarbonizationplan01002003004005006007008009001,0001,1001,20019781988199820082018202820382048UStransmissiongrowth,historyvstargetsThousandsofgigawatt-milesSource:DOE,UTAustin,Larsonetal(Princeton),JPMAM.2022.1.5%growth5.7%annualgrowth05001,0001,5002,0002,5003,0003,5004,000201320142015201620172018201920202021Non-RTO/ISONewYorkNewEnglandSPPPJMMISOERCOTCAISORecenttransmissionlinegrowthhasdeclinedfrom1.5%to1.0%,Milesaddedperyear,totalgridsize=~200,000GW-milesSource:S&PGlobal,JPMAM.2022.Note:Transmissionlines>100kV.TransmissionEYEONTHEMARKET•MICHAELCEMBALEST•J.P.MORGAN13thannualenergypaperMarch28,202321Transmissioncompletiontimes.Whileprojectslessthan150mileshavebeencompletedin5-10years,projectsmorethan400miles(e.g.,fromWichitaKStoStLouisMO)mayrequire15-20yearstocomplete.AnupdateoncloggedUSinterconnectionqueues.ThePJMqueuehasgrownby2.4xsince2019assolar,storage,windandhybridprojectsoverwhelmtheabilityofgridmanagerstointegratethem.OtherISOqueuegrowthmultiplesareshowninthesecondchart.Thethirdchartshowsaverageyearsbetweeninterconnectionrequestandprojectcommissioning,andthetableshowswindandsolarpowerinthequeuevsinstalledwindandsolarcapacity.Becarefulregardingwhatqueuesmeanandwhattheydon’t,whichweexplainnext.04812162002004006008001,0001,200UStransmissionlines:lengthvstimetocompletionYears,estimatedoractualcompletiontimeMilesSource:"TheChallengesofDecarbonizingtheU.S.ElectricGridby2035",Moch&Lee(Harvard).February2022.InterstateSinglestateBuiltDeadEst.completiondateNocompletiondateStatus:Linetype:05010015020025030020072009201120132015201720192021Battery(hybrid)Battery(standalone)Solar+batterySolarOffshorewindWindOtherCoalNuclearGasThecloggedPJMinterconnectionqueueCumulativegigawattsofcapacityinthequeueSource:LBNL,JPMAM.2023.0.0x0.5x1.0x1.5x2.0x2.5xPJMCAISOMISONYISOISO-NEERCOTSPPIncreaseininterconnectionqueuefrom2019to2021Source:LBNL,JPMAM.2022.0123456789201320142015201620172018201920202021CAISO-PVERCOT-PVPJM-PVAllISOs-AlltypesMediantimebetweeninterconnectionrequestandplantcommissioningforselectISOs,YearsSource:IEA,LBNL.2022.Note:Alltypesincludesgas,solarandwindforCAISO,ERCOT,PJMandNYISO.ISOQueue/Cap%Excl.offshorewindCAISO421%392%ERCOT224%224%ISO-NE628%134%MISO415%415%NYISO1914%705%PJM1078%980%SPP289%289%Source:LBNL,JPMAM.2022Windandsolarinterconnectionqueuesasa%ofinstalledwindandsolarcapacity,2021OnTranswestExpress,designedtotransmitWyomingwindpowertotheNevada/Californiaborder.AsinglefamilyinNorthwestColoradosecuredasagegrouseandelkconservationeasementthatblockedtransmissiononits56,000acreranch.TheeasementalsoblockedtheGatewaySouthtransmissionprojectrunningparalleltoTranswest.Theimpassehasbeenresolvedandconstructioncanbegin,buttheprojectisnowinyear18.Since1990,theuseofconservationeasementsinColoradohasrisenfrom100,000acresto2.7mmacres.Of7largetransmissionprojectsfast-trackedbytheObamaadministrationin2011,2havebeencompleted,4arependingand1hasbeencancelled.TransmissionEYEONTHEMARKET•MICHAELCEMBALEST•J.P.MORGAN13thannualenergypaperMarch28,202322However,becarefulwheninterpretingthemeaningof“aprojectbeinginthequeue”.Theseprojectsbydefinitionhavenotbeenapprovedforinterconnection,maynothaveraisedmuchcapitalotherthanforfilingfees,andmaynothavebeenevaluatedbydevelopersastowhethertheywillservethemerchantorfixedpowerpurchaseagreementmarketplace.Thecompletionratesofprojectsinthequeueareverylow,andshouldnotbeinterpretedasrepresentingthegenerationpotentialoffuturewindandsolardevelopment.AccordingtoLBNL,windandsolarprojectsenteringthequeuefrom2000to2017onlyhadcompletionratesof16%and10%.AsstatedearlierintheLCOEsection,thelargestISO(PJM)citesawind/solarcompletionrateofjust5%.Thenexttwochartsshowhowrenewableinterconnectioncostsdwarfthoseofnaturalgas,andhowsolarandwindinterconnectioncostshavebeenrisingwhilegasandstorageinterconnectioncostsarefalling.Bottomline:interconnectiondelaysandcostsareasourceoffrictionintherenewabletransition.Delaysandrisingcostsresultinrisingwind/solarcurtailmentandcongestion,asillustratedbelow.ThisisnotjustaproblemintheUS;theWindEuropeassociationwarnedlastyearof2,000windprojectsawaitingpermissionfromSpanishauthorities,with19GWofprojectsinneedoffullenvironmentalimpactassessmentswithoutwhichdeveloperswouldneedtostartfromscratch.TheGermanWindAssociationalertedinvestorsofsimilarrisks.ThechartontherightshowsthatwindandsolarqueuesinEuropearesimilartothoseintheUS.$0$50$100$150$200$250$300$350$400NaturalgasSolarSolarHybridStorageOnshorewindOffshorewindInterconnectioncostsbyfueltypeforallprojectsUS$perkW,2017-2022averageSource:LBNL.2023.Note:includescompleted,activeandwithdrawnprojects.$0$20$40$60$80$100NaturalgasSolarSolarHybridStorageOnshorewind2000-20162017-2022InterconnectioncostsovertimeforcompletedprojectsUS$perkWSource:LBNL.2023.CurtailmentandcongestioncostsbyISO,2019-2021ISO2019curtailment2021curtailment2019congestioncost(mmUS$)2021congestioncost(mmUS$)Interconnectionqueuecapacity(GW)CurtailmentfiguresinGWhdirectlyfromISOreportsCAISO9611,505$152$16493ERCOT2,3706,617$110$1,400137MISO245301$900$2,800314SPP1,1916,351$457$1,20094Curtailmentfiguresin%ofgenerationfromLBNLWindReport,windcurtailmentonlyISO-NE1.9%1.8%$33$50461NYISO1.5%2.0%$462$62428PJM0.0%1.8%$583$995105Source:S&PGlobal.September1,2022.0.00.51.01.52.02.53.03.54.04.5SpainUKItalySPPERCOTMISOCAISOPJMEuropeanqueuessimilartoUSkWofcapacityinthequeuepercustomerSource:BNEF,WorldBank,JPMAM.2023.TransmissionEYEONTHEMARKET•MICHAELCEMBALEST•J.P.MORGAN13thannualenergypaperMarch28,202323Mostdecarbonizationplansentailtheneedtobuildtransmissionandintegratelargeamountsofintermittentpower.IthoughtitwasinterestingthattheIEAassumesthesechallengeswillbemetinthelongrunby(i)asubstantialincreaseinbatteryusewhichisnegligibletoday,and(ii)alotof“demandresponse”,whichisanicewayofsayingthatelectricityconsumerswillshifttheirloaddemandtomatchelectricitysupply,perhapswitheconomicincentives.Bothchangeswouldbemajordeparturesfromtoday’senergysystems.Let’sconcludewithNewEngland,aregionknownforprogressivethinking,environmentalactivism,universitydivestmentpolicies,thinktanksandlegionsofpeoplefocusedonenergypolicy.It’salsoanelectricityalbatrossfortheaveragecitizenandsmallbusiness,withthehighestelectricitypricesintheUS.ElectricitypricesinMassachusettsarenotthatdifferentthanAlaska,eventhoughMassachusettsisonly200milesfromamplenaturalgasandlowelectricitypricesintheMarcellusshaleregion.NewEnglandfacesthefollowingchallenges,noneofwhichitsstakeholdershavebeenabletosolve:•noexpansionofexisting5-pipelinenetworkdespiterelianceonnaturalgasrisingfrom12%ofgenerationin2000to46%in2022.NewYorkStateblockedtheConstitutionPipelinewhichcouldhavealleviatedthegassupply/demandsituationinNewEngland;otherpipelineprojectswereshelvedwhenthistookplace•whenit’scoldandheatingdemandspikes,localgasdistributioncompanieswithfirmservicecontractstoprovidegasforresidentialandcommercialspaceheatingtakeprecedenceoverpowercompanieswithinterruptibleservicecontracts,drivingupelectricityprices•notenoughstoragecapacityintheregiontostoremoregaseveniftheyobtainedit;lackofadequatenaturalgascapacityresultedlastwinterinfueloilusedfor30%ofelectricitygeneration,andinsufficientelectricitypeakingcapacitytoallowforlarge-scaleadditionsofnewcustomers•HVDCtransmissionprojectsformoreCanadianhydropowerblockedbyMaineandNewHampshire.There’salsoapossibleshiftinCanadianpolicy(aftertheresignationoftheHydroQuebecCEO)toluremoreindustrialcompaniestoQuebec,reducingitscapacityforhydropowerexports•whilerooftopsolartakestheedgeoffofpeaksummerdemand,nosuchluckinthewinter•supplementingpipelinegaswithLNGimportsfromotherpartsoftheUSisnotanoptionduetotheJonesAct,whichstipulatesthatonlyUSshipscantransportgoodsbetweenUSports.Unfortunately,therearenotenoughspareUSLNGtankers•offshorewinddelayascostincreasespromptdeveloperstorenegotiatePPAcontracts(Avangrid/Mass.)Allofthisistakingplacebeforethenextwaveofelectrificationofcarsandwinterheating.Asmentionedearlier,NewEnglanddidn’tlandnewEVbatteryfactoryprojects.Electricitycostsmaybeonemajorreasonastowhy.CoalNaturalgasNaturalgasOilFossilfuelsw/CCUSHydrogen&ammoniaNuclearNuclearHydroHydroOtherrenewablesBatteriesDemandresponse0%25%50%75%100%20212050STEPSHydrogen&ammoniaFossilfuelsw/CCUSWherewillgridflexibilitycomefrominthefuture?PercentSource:IEA.2022.OtherrenewablesNewEnglandNYNJPAILINMIOHWIIAKSMNMONENDSDDEFLGAMDNCSCVAWVALKYMSTNARLAOKTXAZCOIDMTNVNMUTWYCAORWAAlaska051015202530ResidentialCommercialIndustrialSource:EIA.2022.NewEngland:sameelectricitypricesasAlaskaCentsperkWh,November2022TransmissionEYEONTHEMARKET•MICHAELCEMBALEST•J.P.MORGAN13thannualenergypaperMarch28,202324[4]Resourcenationalismin,globalizationout:thescrambletoreshoreproductionandprocessingofmineralsusedintherenewabletransition;nuclearpower/SMRupdateYouneedcertainmineralstobuildwindandsolarcapacityonetime,whileyouneedoil,gasandcoaltorunthermalcapacityallthetime.Renewablesentailintermittencyandenergydensityissuesdiscussedelsewhere,butonpapertheirmineralneedswouldbelessofaconstraintthanfossilfuels…ifacountrycanproduceorbuythemonareliablebasis.However,thedistributionofmanymineralsisjustasgeographicallyconcentratedasitisforfossilfuels,andsomeregionsarenotwellendowedwiththem.Let’sstartwiththebasics:whatwillittaketobuildarenewablefuture?Alotofindustrialmaterials,foronething.Thenextchartlooksatthemassofconstructionmaterialsperterawatthourofelectricity.Concrete,steelandglassrequirementsperTWhforrenewablesaremuchlargerthanfornaturalgasornuclearpower.Therenewabletransitionalsorequiresalotofbasicandcriticalminerals.Thenextchartcomparesthemineralrequirementsofelectriccarstointernalcombustionengine(ICE)vehicles,andalsocomparesthemineralrequirementsofwindandsolartonuclear,coalandnaturalgaspoweredelectricitygeneration.ConcreteGlassSteelSteelOther01234567891011WindSolarPVNaturalgasNuclearConstructionmaterialsbygenerationsourceThousandtonnesperTWhofelectricitySource:ArgonneNationalLaboratory,Dept.ofEnergy,JPMAM.2022.Generationonly,excludingupstreamfuelextractionandtransmissionOtherincludes:aluminum,copper,iron,lead,plastic,silicon,andothermaterialsCuCuCuCuCuCuNiNiMnMnCrCrCrZnZnSi03,2006,4009,60012,80016,000NaturalgasCoalNuclearSolarPVOnshorewindOffshorewindCopperGraphiteNickelManganeseCobaltLithiumChromiumMolybdenumZincRareEarthsSiliconOthersRareearthsCuCuGraphiteNiMnMnCoLi04590135180225ICEvehicleElectricvehicleMineralsusedinwind/solar/EVsvslegacyenergysystemskilogramsofmineralspervehicleSource:IEA,JPMAM.2022.kilogramsofmineralspermegawattofelectricitygenerationcapacityIncaseyouwerewondering…Cementismadefromabundantlimestone,clayandgypsum,heatedto2,700⁰Fandgroundintoapowder.Theissuewithcementisnotscarcityofthemineralsbuttheenergyrequiredtoutilizethem.Concreteistheworld’smost-usedmaterialafterwater,andisacompositeofcement,water,sandandstoneaggregates.CriticalmineralsEYEONTHEMARKET•MICHAELCEMBALEST•J.P.MORGAN13thannualenergypaperMarch28,202325However,theissueathandisnottheabundanceoftransitionminerals.Asshowninthetable,provenreservesarehighrelativetocurrentproduction(>40yearsformostminerals),andglobalresourcesareevenhigher.Thechallenges:reliabilityofsupply,particularlywhenmineralsaresourcedfromcountrieswithhighergeopoliticalrisks;risingresourcenationalism;thecostassociatedwithincreasing(andarguablybelated)surveillanceofenvironmentalimpactsasinChile/Peru;andboththecostandtimerequiredforthesemineralstobeminedandprocessedelsewhere.Asshownontheright,Chinadominatesmanyrenewableenergyproductionandprocessingsupplychains.It’snotgoingtobecheaptoreshorethem:evenwithChinaastheworld’slow-costproducer,pricesforsolarmodulesandwindturbinesrosein2021forthefirsttimeinseveralyears,andbatterycostdeclinesslowed.Inflationhasaffectedotherprojectsaswell:developersoftheSaudiNeomgreenhydrogen18facilityannouncedthatitsoriginalbudgetof$5.0bnhadalreadyrisento$8.5bnduetocostincreasesforspareparts,landandinterest.We’vebeenacclimatedtosteadydeclinesinunitpricingduetoeconomiesofscale,butatsomepoint,pricedeclinesmayleveloutandintermittentlyrisewithdemandand/ormaterialsscarcity.Somegoodnewsonsolar:polysiliconpriceshavedeclinedby~50%sincetheirpeaklastyear.PVmodule,windturbineandEVbatterypricesasafunctionofselectinputcosts:18Inpolymerelectrolytefuelcells,hydrogenandoxygenareconvertedintoelectricityandwater.Platinumandpalladiumcatalystsaretypicallyusedgivenhowwelltheybindwithhydrogengastoproduceprotonsandelectronsviaoxidation.Asanexampleofstabilityrisksratherthanmineralabundancerisks,bothproductionandprovenreservesofplatinumgroupmineralsareconcentratedinSouthAfrica,ZimbabweandRussia.TransitionmineralsaregenerallyabundantfiguresinkilotonsGlobalproductionGlobalreservesGlobalresourcesLithium13026,00098,000Copper22,000890,0002,100,000Cobalt1908,30025,000Nickel3,300100,000300,000Manganese20,0001,700,000NAChromium41,000560,00012,000,000Zinc13,000210,0001,900,000Rareearths300130,000NAIronore1,600,00085,000,000230,000,000Platinumgrp0.4070100Graphite1,300330,000800,000Molybdenum25016,00025,400Thetableexcludessilicon,whichisthesecondmostabundantelementintheearth'scrust.Worldresourcesoflimestoneanddolomitearealsoplentiful.Ironoredatareferstoironcontentratherthancrudeore.Platinumgroupreferstopalladiumandplatinum.Source:USGS,JPMAM.2022020406080100120140160180200-40%-30%-20%-10%0%10%20%30%40%201720182019202020212022EAnnualchangeinmodulecostsSiliconmetalprices(rhs)SolarPVmodulesPercentIndex(100=2017)Source:IEA.2022.-100-50050100150200250300-40%-30%-20%-10%0%10%20%30%40%201720182019202020212022EAnnualchangeinturbinecostsSteelprices(rhs)WindturbinesPercentIndex(100=2017)Source:IEA.2022.-200-1000100200300400-40%-30%-20%-10%0%10%20%30%40%201720182019202020212022EAnnualchangeinbatterycostsLithiumprices(rhs)Lithium-ionbatteriesPercentIndex(100=2017)Source:IEA.2022.0%20%40%60%80%100%NickelproductionStrontiumproductionCobaltproductionManganeseproductionLithiumproductionGraphiteproductionRareearthproductionCopperrefiningCopperproductionEVcathodes/anodesEVmineralprocessingLiOnbatterymanuf.WindrawmaterialsWindturbineorderbookSolarwafersprod.Solarpolysiliconprod.Solarmoduleprod.Solarcellprod.ChinaUSEUManyrenewablesupplychainsgothroughChina,fornowSource:BenchmarkMineralIntelligence,BNEF,EC,IEA,S&P,USGS,JPMAM.2022.CriticalmineralsEYEONTHEMARKET•MICHAELCEMBALEST•J.P.MORGAN13thannualenergypaperMarch28,202326BatterysupplychainsBatterymineralslikelithium,nickelandcobaltareminedinseveralcountries.Chinadominatestheminingofgraphitewhichisusedinbatteryanodes,theproductionofcellcomponentslikecathodesandanodes,andtheprocessingofbatteryminerals.ChinahasnowmatchedGermany’spassengercarexportsat~2.6mmunits,enabledinpartbyitsEVsupplychainstrength,andappearspoisedtosurpassJapaninthenextfewyears.Theincreaseinbatterymineralprices(seep.13)mayreinforcetherecentshifttolithiumironphosphate(LFP)batteriesfromnickel-basedchemistry19.AlmosthalfofTesla’sproductionin2022usedLFPchemistry,whichisbeingincorporatedinfutureplantsintheUSandEurope.Onlithium:•TheIEAprojectslithiumneedsof320ktby2030,upfrom130ktin2022.Thatsoundslikealargeincrease,buttheworldhasplentyoflithium:from2018to2022,globallithiumreserveestimatesdoubledfrom13to26mmtonnes.Higherpricesaccelerateexploration:Iranannouncedwhatcouldbetheworld’ssecondlargestlithiumdepositat8.5mmtonnes,andIndiaannouncedapotential6mmtonnefindaswell•Chineselithiumcarbonatepriceshavedeclined~50%frompeak2022levels,butarestill~4x2020levels•Westernlithiumminescanrequirefrom7to19yearsfromfeasibilitystudytoactualproduction20•Givenlowmarginsfromrecyclingofironandphosphates,theIEAexpectsjust1%-3%ofbatterydemandin2030tobemetfromrecycledcobalt,nickelandlithiumOnepossibleoptionforbatteriesthatdon’trequirelithium:sodiumionbatteries(Na-Ion),madefromsodium,nitrogen,ironandcarbon.Theymayentailonlya20%energydensitydeficitvsLFPbatteries,andmightbewellsuitedforurbanEVs(shortertraveldistances)andgrid-scaleenergystorage.TheChinesebatterymanufacturerCATLintroduceditsfirstNa-Ionbatteryin2021.Buttobeclear,theybarelyregisterinthelightdutyEVfleettoday,andwillprobablyhavelessthana10%shareby2030givenproductionleadtimesrequired.Solidstatelithium-airbatteriescouldtheoreticallyentail2x-4xhigherenergydensitythancurrentbatteriesthatuseliquidelectrolytesolutions.AsperArgonneNationalLabs,liquidsolutionsyieldlithiumperoxideorsuperoxidewith1-2electronsperoxygenmolecule,whileasolidstateapproachcouldyieldlithiumoxidewith4electrons.Theytestedaprototypefor1,000cyclesatroomtemperature,butithasnotbeencommercializedyet.Therehasbeenanavalancheofnewbatteryideasoverthelastdecade;itgenerallypaystowaitforproofofconceptbasedonactualproductionandadoptionbeforemakinganyprojections.19Whilenickel-basedchemistriessuchasNMC(lithium,nickel,manganese)andNCA(lithium,nickel,cobalt,aluminum)dominatedtheEVmarketwith85%sharein2021,LFPbatteriesrapidlygainedsharedespitelowerenergydensity/range,mostlyduetoLFPbatteriesnotrequiringanycobaltornickel,lessriskofcatchingfireandlongeroperatinglives.China’sBYDhasimprovedLFPdensitybyreducingdeadweighthousingrequirements.20IEA,“GlobalSupplyChainsofEVBatteries”,July2022ChinaChinaJPNJPNKORCathodeAnodeCellcomponentsChinaOtherOtherOtherAustraliaDRCIndonesiaRU0%10%20%30%40%50%60%70%80%90%100%LithiumNickelCobaltGraphiteBatterysupplychains:mining,processingandcomponentsPercentMiningSource:IEA.2022.ChinaChinaChinaChinaEuropeUSOtherOtherOtherOtherLithiumNickelCobaltGraphiteMineralprocessingChileChileChileChileChileAUSAUSAUSAUSAUSARGARGARGARGARGOtherOtherOtherOther048121620242820182019202020212022USChinaGlobalreservesoflithiumbycountryMillionmetrictonsSource:USGS,JPMAM.2023.CriticalmineralsEYEONTHEMARKET•MICHAELCEMBALEST•J.P.MORGAN13thannualenergypaperMarch28,202327Whilebatterymineralsuppliesareacriticalissue,thesensitivityofbatterypricestochangingmineralpricesissometimesoverstated.Batterypricesincludecostsofproduction,shipping,laboretc.Onestudy21citedincreasesofjust2%-5%forLFPbatteriesand2%-10%forNMCbatteriesifoneoftheircomponentmineralpricesweretodouble(nextchart).Andwhenbatterypricesdorise,EVmakersmightstilldecidetocompeteonprice.That’swhatTesladidrecently,cuttingpricesonitsModelYby20%andModel3by14%,forcingFord22tocutpricesaswellby8%-19%.Tesla’spricecutsoriginatefromapositionofmuchhigherperunitmargins.TheUSbatterysupplychainbuild-outRivian’sCEOsaidlastyearthat90%-95%ofthebatterysupplychaindoesnotexist,andthatthebatteryshortagewillmakethesemiconductorshortagelooklikea“smallappetizer”.Thatsaid,substantialinvestmentshavebeenannouncedinUSbatterysupplychainassemblywhichisprojectedtorisefrom55GWhperyearofcapacityin2021to1,000GWhby203023.Keystates:Georgia,Tennessee,Kentucky,Michigan,Ohio,NorthCarolinaandNebraska(NewEnglandmayhavelostoutduetoitshigherindustrialelectricityprices;seepage23).Assuming50-70kWhpercarbattery,1,000GWhofbatterycapacitycouldsupplytheUSwithallthebatteriesitneedsforprojected2030EVpassengercarsalesof~8mmunits.TheUSisminimallyexposedtoChinaonproductionofEVcells,packsandvehicles.ThetableshowshowtheUSwasreliantonitselfanditsalliesin2021forthesematerials.However:whiletheUSisexpandingitsabilitytomanufacturecells,packsandvehicles,itwillprobablyremainhighlydependentontherestoftheworldforminingandprocessingofmineralsusedinthesebatteries,andcomponentslikecathodesandanodes.21“Monetizingenergystorage”,SchmidtandStaffell,ImperialCollegeofLondon,202322Fordannouncedanexpected$3bnlossinitsEVdivisionin2023,subsidizedbyprofitsintherestofitsbusiness23InvestmentsfromHyundai/SK,Honda/LG,Toyota,Panasonic,Redwood,LGChem.ManganeseGraphiteLithiumhydroxideAluminiumCopperCobaltNickelGraphiteLithiumhydroxideLithiumhexafluorophosphateAluminiumCopper0%2%4%6%8%10%Lithiumironphosphatebattery-LFPLithiumnickelmanganesebattery-NMCChangeinbatterypricesassuming100%increaseineachcomponentmineralprice,PercentSource:"MonetizingEnergyStorage",SchmidtandStaffell.2023.-$20-$15-$10-$5$0$5$10NioXPengBYDHyundaiGMFordToyotaVolkswagenTeslaNetprofitpervehicle,2022,excludingextraordinaryitemsUS$,thousands,allvehiclessoldSource:Bloomberg,JPMAM.Q32022.LossesatRivian,NikolaandLucidstartupsaretoolargetoplot01002003004005006007008009001,00020162018202020222024202620282030CanadaUSAnnouncedbatteryplantcapacityNetcapacity,GWhperyearSource:ArgonneNationalLaboratory.November2022.#numbersinthousands#Share#Share#ShareUS36257%40263%40664%Europe9615%10917%508%Japan/SouthKorea16226%11919%9214%Canada/Mexico00%00%6210%China122%41%41%Other00%00%213%Source:ANL,JPMAM.2022.CountryoforiginCellsPacksVehiclesCountryoforiginforlithiumioncells,batterypacksandelectricvehiclessoldintheUS,2021CriticalmineralsEYEONTHEMARKET•MICHAELCEMBALEST•J.P.MORGAN13thannualenergypaperMarch28,202328SolarpowersupplychainsChinadominatessolarsupplychainsafteradecadeofsupportforitssolarindustryintheformoflow-costloans,cheaplandandelectricity,andperhapsmostlyimportantlytheimpositionofimporttariffsin2013.Solarresourcenationalismisstillrising:since2011,thenumberofantidumping,countervailingandimportdutiesleviedagainstPVsupplychainsincreasedfrom1to16,with8moreunderconsideration.ChinaannouncedthatitsMinistriesofCommerce,ScienceandTechnologyareseekingpubliccommentonaddingadvancedsolaringotsandwaferstoitslistofprohibitedexports.IfChinadidso,itwouldmirrorUSrestrictionsonexportsofadvancedsemiconductorstoChina.OnsolarpowerandUSrelianceonAsia:•PVpanelsaremadebyextractinghigh-gradesiliconfromquartzandformingitintocylindricalingotswhichareslicedintothinwafersandchemicallytreatedtocreatecellscapableofconvertingsunlightintoenergy•Lastyear,mostUSpolysiliconfactorieswererepurposedtosupplythesemiconductorindustry.TheUShadnoactiveingot,waferorcellcapacity;thedozenUSfactoriesproducingthemasrecentlyas2014weregone.TheUSnowimportsenoughsolarpanelstomeet90%-95%ofitsannualdemand•TheUSDep’tofCommerceconcludedthatcertainChinesemanufacturersmovedoperationstoVietnam,Malaysia,CambodiaandThailandtocircumventtariffs,sotheywillnowbesubjecttotariffsaswell.AdecadeoftariffsonUSsolarimportswassupposedtojump-startUSdomesticproduction,buthaven’tdonemuch;tariffssimplyincreaseinstalledcostsofUSsolarpower(accordingtosolarprojectdevelopers)•TheUSenergybillhasjump-startednewUSsolarsupplychaincapacity(Hanwha,SPIEnergy,ConvaltEnergy,FirstSolar);itwillbeinterestingtoseetheall-incostperMWhofUSproductionChinaChinaChinaChina0%10%20%30%40%50%60%70%80%90%100%PolysiliconWafersCellsModulesOthersAsiaPacificIndiaEuropeNorthAmericaChinaSource:IEA.2022.SolarPVmanufacturingcapacitybycountryandregionPercent$0$10$20$30$40$50$60$70$80ChinaMalaysiaVietnamKoreaThailandCumulativePV-gradepolysilicon,wafer,cellandmoduletradebalances,2017-2021,US$,billionsSource:IEA.2022.0%10%20%30%40%50%60%70%80%90%100%200520072009201120132015201720192021MalaysiaMarketsharesinglobalpolysiliconproductionPercentSource:BernreuterResearch.2022.ChinaSouthKoreaEuropeUSJapanChinaimposestariffsonsolarimports$0$5$10$15$20$25$30$35$40$45$50'10'11'12'13'14'15'16'17'18'19'20'21'22EModulesCellsWafersPolysiliconSource:IEA.2022.PV-gradepolysilicon,wafer,cellandmoduletradevalue,2010-2022E,US$,billionsCriticalmineralsEYEONTHEMARKET•MICHAELCEMBALEST•J.P.MORGAN13thannualenergypaperMarch28,202329WindandmagnetsupplychainsThesechartscoversupplychainsforneodymiummagnets24andwindpower.Chinaistheonlycountrywithafullyintegratedpermanentmagnetsupplychain.Neodymiumisarareearthelement,whichwediscussnext.Therearefourmainwindturbinetechnologytypes,illustratedbelowontheright.Iknowthere’salotofjargonhere,butIincludeditsinceIwanttoillustratesomethingaboutoffshorewind.Inadditiontorequiringmorecopperthanonshorewind,offshorewindmostlyrelieson“directdrivepermanentmagnet”generatorswhichrequiremorerareearthmetalsaswell.Offshorewindturbinesaretaller,lighter,moreefficientandequippedwithlargerbladestogeneratehighercapacityfactors.Attheendof2022,therewere65-70GWofoffshorewindinstalledglobally,~7%ofglobalwindcapacity.24Neodymiummagnetsrequirealotofwork:mining,processingandrefiningofrareearths;alloyingtoenhancemagneticproperties;melting,strip-castingandrapidcooling;hydrogendecrepitationtodisintegratethemagnetmaterial;jetmillingtogrindneodymiummetalintopowder;highpressuremagnetization;coldisostaticpressingtoremoveairgaps;sinteringinfurnacesattemperaturesover1000⁰Ctoenhancemagneticproperties;allbeforethecutting,machining,grindingandelectroplatingtomakethefinalmagnetsthatareusedinEVs,windturbines,marinepropulsionsystems,cellphonesetc.ChinaChinaChinaChina0%10%20%30%40%50%60%70%80%90%100%MiningSeparationRefiningMagnetmanufacturingOthersJapanMalaysiaAustraliaBurmaUSChinaNeodymiumNIBmagnetsupplychainsPercentSource:USGS,DOE.2022.ChinaChinaChinaChina0%10%20%30%40%50%60%70%80%90%100%RawmaterialsProcessedmaterialsComponentsAssembliesOthersLatinAmericaAfricaRestofAsiaJapanEuropeUSChinaWindturbinesupplychainsPercentSource:EuropeanCommission.2020.CanadaMexicoBrazilIndiaMalaysiaChinaKoreaGermanyDenmarkSpainOthers$0.0B$0.5B$1.0B$1.5B$2.0BAmericasAsiaEuropeOtherUSwindcomponentimportsUS$,billionsSource:USDepartmentofEnergy.2021.Gearbox:DoublefedinductiongeneratorGearbox:PermanentmagnetsynchronousgeneratorDirectdrive:ElectricallyexcitedsynchronousgeneratorDirectdrive:Permanentmagnetsynchronousgenerator050100150200250300GB-DFIGGB-PMSGDD-EESGDD-PMSGNeodymiumPraseodymiumDysprosiumTerbium...whichismorereliantonrareearthsRareearthmetalsperMWofwind,kgSource:IEA,JPMAM.2022DD-PMSGDD-PMSGGB-PMSGGB-DFIG0%20%40%60%80%100%OnshoreOffshoreOffshorewindismorereliantondirectdrivepermanentmagnettechnology(DD-PMSG)...DD-EESGCriticalmineralsTheUSislessexposedtoChinaregardingwindsupplychainswhencomparedtosolarpower,rareearthsandEVbatterymineralsmining/processing.EYEONTHEMARKET•MICHAELCEMBALEST•J.P.MORGAN13thannualenergypaperMarch28,202330Thesupplyofrareearthelements(REE)isanotherkeyissueintherenewabletransition.•Despitethename,REEexistabundantlyintheEarth'scrust.However,theyarewidelydispersedandfoundinverylowconcentrations,makingthemhardertoexploiteconomically•REEsareusedinEVmotors(althoughtherearepotentialsubstitutes)andinsinteredmagnetsforwindturbines,aswellasforF-35LightningFighterjets,DDG-51Aegisdestroyerwarshipsandmobilephones25•Inadditiontoitsdominant60%shareofREEproduction,ChinaalsohasthelargestamountofREEreserves.Tobeclear,thegeographyofactualREEdepositsisnotentirelyknown.SwedenforexamplejustannouncedfindingthelargestREEdepositsinEuropeat1mmtonnes;theywilltake10-15yearstobringonline•Chinaisconsolidatingcontrolandoversightofitsdominantrareearthposition.InDecember2021,China’sState-OwnedAssetsSupervisionandAdministrationCommission(SASAC)createdtheChinaRareEarthGroup,amergerofthreeofitsrareearthstate-ownedenterprises.Theimpact:greaterpricingpowerandinfluenceoverworldsupply•China’sdominanceinREEsupplychainsmayactuallybeunderstated.Accordingtoa2022PetersenInstitutestudy26,Chinapartnersinprojectsinothercountriestosecurelongtermsupplies,andexertscontroloveritsownREEproduction.Incontrast,REEproductionintheUSiscontrolledbyinvestmentfirms;theFederalgovernmenthasnodirectcontrolovertheiroperationsunlessitinvokeslegislationsuchastheDefenseProductionActof1950•IfthedevelopedworldwantstoreshoreREEproduction,itwon’tbeeasy:itwillbecompetingwithChina’ssanctionedREEindustryandalsoChina’sunregulatedREEoperationswhichreportedlyaccountfor40%ormoreofChina’stotalREEoutput27.Thelattertypicallyhavelowerall-incostsgiventhefrequentlackofoperational,environmentalandlaborregulations•Toreiterate:theissuehereisnotREEscarcity,it’sthepriceatwhichothercountriescanmineandprocessthem,andhowlongitwouldtaketodoso25“WhatChina’sRareEarthsDominanceMeansfortheUS”,BakerInstitute,Foss&Koelsch,December18,202226“GreenEnergyDependsonCriticalMinerals.WhoControlstheSupplyChains?”,PIIE,August202227“China’spublicpoliciestowardrareearths,1975-2018”,YuzhouShenetalinMineralEconomics,2020,and“TheimpactofunregulatedionicclayrareearthmininginChina”,PackeyandKingsnorth,ResourcesPolicy,2016ChinaUSAustraliaBurmaOtherThailandRussia0255075100125150175200225Globalminedproductionofrareearths,bycountry,2022ThousandmetrictonsSource:USGS.2023.ChinaVietnamRussiaBrazilIndiaOtherAustraliaUS051015202530354045Globalreservesofrareearths,bycountry,2022MillionmetrictonsSource:USGS.2023.CriticalmineralsEYEONTHEMARKET•MICHAELCEMBALEST•J.P.MORGAN13thannualenergypaperMarch28,202331•TheUSreliesonChinafor~80%ofitsrareearthmetals.Currently,theonlyUSREEproducerisMPMaterialsinitsMountainPassfacilityinCalifornia,whichalsosends30,000tonnesoftheconcentrateitproducestoChinaforprocessing.Onmagnets,NoveonistheonlyoperationalUSpermanentmagnetmanufacturer•TheUSDep’tofDefenseprovided$30mmtoLynas,$45mmtoMPMaterialsand$30mmtoNoveon.TheCHIPs/energybillsalsoprovidetaxrefundsonproductioncosts,increasedfundingauthorityforR&DgrantsandDefenseProductionActfunding.Evenso,thisprocesswilltaketime,andbecontingentonpermitting•HowmighttheUScatchup?REEtendtobehighlydispersedwithinthesoil,soR&Dcouldlowermarginalcostsofproduction.Continuousionexchangeandothertechniquesbeyondtraditionalsolventextractioncouldimproveefficiencyandreducecost•Chinadoesn’tjustdominatetheproductionandprocessingofrareearthelements;Chinaisalsoalargeproducerofothermineralsaswell.ThetableshowsmineralsforwhichChinaisthelargestglobalproducer,alongwithestimatesofeachmineral’ssupplyriskandeconomicimportanceMaterialStageSupRiskEcoImpChinashareMaterialStageSupRiskEcoImpChinashareMaterialStageSupRiskEcoImpChinashareAntimonyE2.95.374%GalliumP1.83.980%PraseodymiumE7.94.886%BaryteE1.83.638%GermaniumP5.63.980%SamariumE8.78.186%BismuthP3.24.480%Ho,Tm,Lu,YbE8.83.786%ScandiumP4.44.966%CeriumE8.83.986%IndiumP2.63.648%SiliconmetalP1.74.766%CokingCoalE1.73.455%LanthanumE8.71.786%TerbiumE7.94.686%DysprosiumE8.98.086%MagnesiumP5.67.489%TitaniumP1.85.245%ErbiumE8.73.486%NaturalgraphiteE3.23.669%TungstenP2.39.069%EuropiumE5.23.686%NeodymiumE8.75.486%VanadiumE2.44.939%FluorsparE1.63.765%PhosphaterockE1.66.348%YttriumE6.03.986%GadoliniumE8.75.186%PhosphorusP5.25.974%Source:EuropeanCommission.2022.Note:E=Extractionstage,P=Processingstage.SupplyRiskrangesfrom0-10,with10=greatestriskofdisruptioninsupplyofaspecificmaterial.EconomicImportancerangesfrom0-10,with10=mostimportantforend-useapplications.HeavyRareEarthElementsLightRareEarthElementsCriticalmineralsEYEONTHEMARKET•MICHAELCEMBALEST•J.P.MORGAN13thannualenergypaperMarch28,202332Onelastmineralscomment:onuranium,nuclearpowerandsmallmodularreactorsAlmosthalfofworlduraniumproductioncomesfromKazakhstan.Theremainder:12%fromNamibiaand5%-10%eachfromCanada,Australia,Uzbekistan,RussiaandNiger.China’sshareisjust3.5%.WhiletheUSwasamajoruraniumproducerfrom1960-1985,itssharehasdwindledclosetozerodespiteamplereservesintheWesternUS.Asshownbelow,theaverageageofUSnuclearpowerplantsisover40years.Nuclearpowerroundup:•China,Korea,India,RussiaandTurkeyarebuilding34newnuclearplants,mostlypressurizedwaterreactors•IntheUSthereareonlytwobeingbuilt(inGeorgia),bothbillionsofdollarsoverbudgetandyearsbehindschedule;they’realsothefirstnuclearplantstobecompletedintheUSin30years•InEurope,France’snuclearoutputshouldrecoverin2023afterayearplaguedbyCOVID,corrosionshutdownsandlowwaterlevels;butthatincreasemaybeoffsetbyscheduleddecommissioninginBelgiumandGermany.WhileFranceannouncedplanstobuild14newreactorsby2050,let’sseehowthatgoes:itsFlamanvilleplanthasbeenaplanningandexecutionfiasco.Constructionbeganin2007;by2020itwasalready5xoveritsoriginalbudget;andtheprojectmanagershavehadtoaddressstructuralanomalies,faultycoolingweldsandafire/explosiononsite.Initialoperationisnowscheduledforearly2024afteradditionaldelaysandcostoverruns•Japanhas10reactorsinoperation,intendstorestartanother7in2023andanother10by2030(outof33reactorsintotal).Japanaimstogetbackto20%ofgenerationfromnuclearby2030(2021=7%)TheUSNuclearRegulatoryCommissionapprovedconstructionofdemonstrationsmallmodularreactors(SMR)inIdaho,a6-reactor460MWNuScaleprojectexpectedtobecompletedby2030.Thelatestcostestimates:$89perMWh(up50%fromanearlierestimateof$58)and$20,000perkW.That’smuchhigherthanthe$13,500perkWcostoftheGeorgianuclearplantsevenaftertheircostoverruns,and4xwhatNuScaleestimatedjust3yearsago($4,500perkW).Onnuclear,thecostoverrunsongremainsthesame.TherewasaverypublicdisputelastyearwhenaformerchairoftheUSNuclearRegulatoryCommissionco-authoredastudy28highlightingtheongoingnuclearwastechallenge,evenwithSMRs.TheauthorsconcludedthatSMRswouldproducemorechemically/physicallyreactivewastethanlightwaterreactors(LWRs),andthattheintrinsicallyhigherneutronleakageassociatedwithSMRssuggeststhatmostdesignscouldbeworsethanLWRswithrespecttogeneration,managementanddisposalofnuclearwaste.TheSMRindustrydisputedthisconclusion,arguingthatitslatestdesignswerenotbeingtakenintoaccount.NuScale’sco-founderandChiefTechnologyOfficerreportedlycounteredthatSMRwastestreamsaresimilartoLWRs29.Ok;butifthat’sthecase,SMRshavenotyetcrackedthecodeonthechallengeofnuclearwaste.28“Nuclearwastefromsmallmodularreactors”,Krall,MacfarlaneandEwing,EnvironmentalSciences,May202229Bloomberglaw.com,Environment&Energy,February25,20230510152025051015202530354045505560USEuropeEmergingeconomiesAgedistributionofexistingnuclearreactorsGWofcapacitySource:InternationalAtomicEnergyAgency,JPMAM.2022.Ageofpowerplant(years)CriticalmineralsTerraPowerupdate.ThecompletiondateforitsinauguralNatrium(sodium-cooled)reactorhasnowbeenpushedbacklaterthan2028sinceRussiaistheonlycurrentsourceofhigh-assay,low-enricheduranium(HALEU)theplantneeds.Ifcompleted,theNatriumplantwouldbenefitfrominfrastructureconnectedtoWyomingcoalplantsscheduledtoberetiredin2025.Congressionalbillspassedin2020and2022aimtosupportdomesticHALEUsupplychains,andTerraPowerannouncedthatitplanstobuildaNatrium(HALEU)FuelFacilityinNorthCarolina.SenatorsManchin(D-WV),Risch(R-ID)andBarrasso(R-WY)introducedthe“NuclearFuelSecurityAct”inFeb2023tofurtherthisagenda.Thiswillalltakemany,manyyears.EYEONTHEMARKET•MICHAELCEMBALEST•J.P.MORGAN13thannualenergypaperMarch28,202333[5]Energyin,mostoftheenergyout:theeconomicsbehindtheriseinco-locatedstorageandsolarpowerWhenlookingattheUSelectricityqueue,onethingstandsout:increasingnumbersofhybridprojectsinvolvingco-locationofsolarpower30withenergystorage.Ownersofstoragecanengageinelectricitypricearbitrage:buysolarpowergeneratedinthemiddleofthedaywhenelectricitypricesarelow,andsellitlaterinthedaywhenpricesarehigher.However,morethanpricearbitragealoneisoftenrequiredtojustifyinvestment.Therehavebeenlargedeclinesinchemicalbatterycosts,butstorageisstillrelativelyexpensivetobuildandoperate.Inmanyjurisdictions,storageprojectsneedtoderiveadditionalvaluefrom“capacitysubstitution”:theirabilitytostandinasanalternativetopowergeneratingcapacityortransmissiongridcapacityforwhichtheyarepaidafee,or“capacitypayment”.WeaskedJesseJenkinsandhiscolleaguesatDecisionSolveLLC,anenergyandenvironmentalconsultingfirm,tohelpmodeltheeconomicsofenergystorage.Therearealotoffactorsinvolved:intradayelectricitypricedifferentialsandvolatility;capitalandO&Mcostsforstorage,solar,invertersandsubstations;roundtripenergyefficiency31;storageduration;operatinglifeforstorageandgenerationassets;profileofexistingrenewablesonthegrid;electricitydemandandgenerationprofilesbysource;correlationofgenerationprofileswithdemand;production/investmenttaxcredits;andthecostofcapital.Seetableabovefordetails.30USsolarpowerisnotjustgrowinginutilityscaleapplications.AsperBNEF,33%ofexistingUSsolarcapacityof142GWwasinstalledonresidentialandcommercialbuildingsasof202231Roundtripefficiency:batteriesacceptanddischargeDCpower.So,forwindwhichgeneratesACpower:wind–>inverter(95%)–>batterycharge(97%)–>batterystorage–>batterydischarge(97%)–>inverter(95%)fortotalroundtripefficiencyof85%.ForsolarwhichgeneratesDCpower,thereisnoneedfortheinverterupfront,increasingroundtripefficiencyto89%.0100200300400500600700SolarStorageWindNaturalgasOtherHybridStandaloneElectricitygenerationcapacityinqueuesCapacity,GigawattsSource:LBNL.2022.05010015020025030035040045020142015201620172018201920202021HybridStandaloneStorageinterconnectionqueueGigawattsSource:LBNL.2022.Lithiumion,EVLithiumion,utilityBatterylearningcurvesUS$perkWhofcapacity,logbase2scaleSource:"Monetizingenergystorage",Schmidt&Staffell(OxfordPress).2023.0.11101001,000Totalinstalledcapacity,GWh,logscale$1,600$800$400$200$100Assumptionsforsolar+storagemodelW.AvgCostCapital5.5%StorageInverterCapitalcost$284perkWhCapitalcost$41perkWOperatinglife20yearsOperatinglife20yearsO&M$10perkWh-yrO&M$10perkW-yrInvestmenttaxcredit30%Efficiency95%Duration4hoursChargeefficiency97%Dischargeefficiency97%SolarSubstationCapitalcost$900perkWCapitalcost$77perkWOperatinglife20yearsOperatinglife20yearsO&M$20perkW-yrO&M$12perkW-yrProd.taxcredit2.75cperkWhSource:DecisionSolveLLC,JPMAM.2023.Co-locatedenergystorageEYEONTHEMARKET•MICHAELCEMBALEST•J.P.MORGAN13thannualenergypaperMarch28,202334Toillustratestorageeconomics,wemodeledtwocases:ArizonawithhighintradaypricearbitragepotentialandPJM(ISOformid-Atlanticstates)withlowintradayarbitragepotential.32Inthechartsbelow,theX-axisshowsstoragecostsasa%ofcurrentlevels(of~$280perkWh)andtheY-axisshowstheadditionalrevenueperkW-yearthatastorageprojectmustearntobeprofitableafterearningrevenuefrompricearbitrage.Whentherequiredpaymentispositive,storagewouldneedtoearnadditionalrevenuefromcapacitypayments,whicharecommonlypaidbygridoperatorsforhelpingmeetpeakelectricitydemandanddisplacingtheneedforpeakerplants(usuallynaturalgasturbinesusedinfrequentlywhendemandisgreatest).Whenrequiredpaymentsarenegative,modeledreturnstoinvestorswouldbesufficientfromenergyarbitragealone.Thefirstchartshowsstorageonastand-alonebasis,andthesecondchartshowsco-locatedstorage+solarinwhichcaseinverterandsubstationcostscanbeoptimizedtoreducecapitalcostscomparedtoastand-alonesolarproject.Inotherwords,storagecaneffectivelysmoothoutsolargenerationtoreduceinterconnectionfeesandmaximizeeconomicvalue.Results:inthelowarbitragelocation,capacitypaymentswouldbeneededforstand-alonestoragenomatterhowlowyourstoragecostassumptionis.Forcontext,PJMcapacitypaymentsperkW-yearrangefrom$18to$73,whichexplainswhysomestand-alonestorageisbuilteveninsuchlocations.Inthehigharbitragelocation,andinthelowarbitragelocationwhensolarandstoragearecombined,nocapacitypaymentsarerequiredaccordingtooursetofassumptions(seebelowonrisksofrelyingonarbitrageasthesolerevenuestream).Usinga7.0%costofcapitalinsteadof5.5%doesnotchangetheresultsverymuch.Tobeclear,therearetwoverybigrisksforstorageinvestors.Thefirst:otherstorageinvestorscouldcrowdintothesamemarket,reducingelectricityarbitragevaluesforeveryone(akintorisksincommercialrealestate).Thesecond:thesemodelsassume“perfectforesight”sincetheyuseelectricityprices,generationanddemandpatternsfromaspecificyearandassumeoptimaldecisionsaroundwhenstorageisfilledanddrawndown.Inreallifethisimpossible,sincestorageownersmustmakedecisionsregardingutilizationwithoutknowingthebesttimetodoso,inwhichcaseactualrevenueswouldbelowerthanwhatismodeled.Bottomline:whilesomelocationsgenerateenoughrevenuefrompricearbitragetojustifystorageinvestment,othersrequirestoragetobepaidforits“capacitysubstitution”value;i.e.,eliminatingtheneedforadditionalgridinvestmentorpeakerplants.Afewyearsago,largecapacitypaymentswouldhavebeenneededalmosteverywhere;fallingcostsofstoragehavenowchangedthoseeconomics.In2017,288MWofstoragewasdeployedintheUS;by2022thisfigureroseto4.8GW.WoodMackenzieestimatesthatbetween2023and2027another75GWwillbedeployed,mostofwhichwillbeco-locatedwithwindandsolargeneration.32AveragedailypricearbitrageperMWassumingperfectforesightand4hourstorage:Oregon$110,PJM$269,Nevada$316,Arizona$356andTexas$428-$50-$40-$30-$20-$10$0$10$20$30$40$5020%30%40%50%60%70%80%90%100%Storage:lowarbitragelocationsrequirepaymentsRevenuerequirement,US$perkW-yearSource:DecisionSolveLLC,JPMAM.2023.Storagepackcostasa%ofcurrentlevelsLowarbitrage(PJM)Higharbitrage(AZ)-$50-$40-$30-$20-$10$020%30%40%50%60%70%80%90%100%Solar+storage:paymentsnotrequiredineitherlocationRevenuerequirement,US$perkW-yearSource:DecisionSolveLLC,JPMAM.2023.Storagepackcostasa%ofcurrentlevelsLowarbitrage(PJM)Higharbitrage(AZ)Co-locatedenergystorageEYEONTHEMARKET•MICHAELCEMBALEST•J.P.MORGAN13thannualenergypaperMarch28,202335[6]Garbagein,EnergyOut:thebenefitsandlimitationsofmunicipalsolidwasteasasourceofenergy,andtheongoingdisputeoverforestbiomassinEuropeIt’simportanttounderstandthescopeofpotentialcontributionsfromdecarbonizationtechnologies,evenwhentheymakeeconomicsense.Agoodexample:conversionofmunicipalsolidwaste(MSW)intoenergy.MSWcanbeburnedtocreateheatorelectricityusingatraditionalincinerator->boiler->generator.MSWcanalsobeconvertedintohydrogenviagasification(seenextpage).Asanalternative,landfillgasfromMSWoccursnaturallyduetoanaerobicdecompositionandcanbecapturedthroughasystemofwellsandblowers/vacuums;~20%ofUSlandfillscapturegasforflaringorforenergyuseasrenewablenaturalgas.SeveralcountriesinEurope(Aus,Den,Fin,Ger,Ita,UK)usebiogasatamountsabove1GJpercapita.In2019,DenmarkandGermanybiogasusereached15%-20%oftheirnaturalgasconsumption.ConvertingMSWtoheat,electricityorfuelcanbeworthwhilesincetheenergyandcostrequiredtoaggregateithasalreadybeenexpended,andsincelandfillswouldotherwisereleasemethaneintotheatmosphereastheydecompose.Butitspotentialcontributionsaremodest,asweillustratewithtwoexaggeratedscenarios.Incinerationscenario.IfALLrecoverable(non-recycled)USsolidwastewereincineratedtomakeelectricity33,itcouldprovide~2.1%ofUSelectricity,0.8%ofprimaryenergyandreduceGHGemissionsby0%-3%,dependingontheassumptionusedfortonsofmethaneproducedbyeachtonofdecomposingMSW34,anddependingontheassumptionusedtoconvertmethaneintoCO2equivalents35.Ofcourse,actualMSWyieldsfromincinerationwouldbelowerthanthesefiguressincethisscenarioassumesthateverytonofnon-recycledMSWisconvertedtopowerwithnofrictionallosses,impedimentsorconstraints.That’sabraveassumptionwhenonly~10%ofUSMSWiscurrentlyincineratedforenergyrecovery.CountrieswithhigherMSWincinerationareoftendenserwithfewerlandfilloptions(Japan,Switzerland).Furthermore,CO2inMSWincinerationfluegasisdispersed,whichcanrequiremorethan50%ofthepowerproducedtocaptureif“green”electricityisthegoal.MSWincinerationalsoinvolvessubstantialhazardouswasteissues36.3364activeUSMSWincinerationplantsgenerateanaverageof486kWhpertonofMSW[Source:EIA,2021]34TheIEAestimates50to100kgofmethanepertonneofdecomposingMSW;70kgisthemedianassumption.EstimatesderivedfromEPAdataarelower,around27kgofmethanepertonneofMSW.Thesetwofiguresaccountfortheemissionsreductionrangecitedabove35Methane’shigherglobalwarmingpotentialthanCO2isaddressedbyapplyingamultipletomethaneemissionstoconvertthemintoCO2equivalents.Weuse25,themultiplecitedbytheEPAonmethane’shigherglobalwarmingpotentialover100years,andwhichiscitedbytheUNFrameworkConventiononClimateChange36Incinerationof1tonneofMSWproduces15-40kgofhazardouswastewhichrequirestreatment(dioxins,furans,cadmium,arsenic,mercury),andproducesbottomashaswell.Developedcountriescleanedupincinerationthrough“extendedproducerresponsibility”rulesonE-waste,butthathasresultedinincreasedexportofE-wastetothedevelopingworld[EnergySustainabilityandSociety,November2018]0501001502002503003501960197019801990200020052010201520172018USmunicipalsolidwastemanagementMilliontonsSource:EPA,JPMAM.2018.RecyclingLandfillCombustionw/energyrecoveryCompostingOtherfoodmanagmentScandinaviaJapanSwitzerlandUKFranceGermanyKoreaHungaryCzechRepublicUS0%10%20%30%40%50%60%70%80%Shareofmunicipalsolidwasteincineratedforenergyrecovery,PercentoftotalMSWSource:EIA.October31,2022.MunicipalwasteEYEONTHEMARKET•MICHAELCEMBALEST•J.P.MORGAN13thannualenergypaperMarch28,202336GasificationofMSW.Gasificationtechnologyhasbeenaroundforalongtime,buthasnotbeenappliedwidelytoMSW.MSWincinerationinvolveshigh-temperatureburning(rapidoxidation)ofhydrocarbons,whilegasificationharnesseshydrocarbonsusingheat,steamand/orcontrolledamountsofoxygen.Attemperaturesexceeding1000⁰Cinagasificationvessel,MSWcanbeconvertedintoasyngasrichinhydrocarbons.Thisgascanbefurtherprocessedtoboosthydrogenyield.Insomegasificationapproaches,metalsarenotoxidizedwhichmakesthemeasiertorecycle,whileinotherstheyareseparatedbeforethegasificationstep.Thereisno“magicCO2bullet”:gasificationproduceshydrogenbutalsoproducesthesameamountofcarbondioxidepertonasMSWincineration.Thedifference:carbonfromincinerationisacombustionby-product,whilegasificationproducesachemicalCO2thatisseparatedandcapturedwithintheprocess.Thiscansubstantiallylowerthecostandcomplexityofcarbonretrievalfromgasification.Tobeclear,hydrogenfromgasificationisonlygreenifcarbonbyproductsarethensequesteredorutilized.InthenextsectiononCCS,wediscusstheadvantagesofconcentratedandseparatedCO2streamsinfluegas.Gasificationscenario.IfALLrecoverableUSsolidwastewereconvertedintohydrogenusinggasification37,itcouldreplacethehydrogentheUScurrentlyobtainsviasteammethanereformationofnaturalgasandcoal,whichisequivalentto~1.2%ofUSprimaryenergy.Butthisisnotasensibleusecasetothinkabout:mosthydrogenproductionviaSMRisco-locatedwiththefacilitiesthatusehydrogenforoilrefining(desulfurizationofgasoline),orforammoniaproductionusedinfertilizer.HydrogenfromMSWlocationswouldhavetobetransportedlongdistancestotheseindustrialfacilities,whichisexpensive.Greenammonia/hydrogenforlonghaulshippinghasitschallengesaswell38.Asaresult,presumedusecasesforhydrogenviagasificationofMSWwouldhavetoincludearangeoflocaldemandclusters.Thiscouldincludelocaldemandforgreenureaforfertilizerproduction,greenammoniaormethanol,stationaryfuelcellsforfastchargingforEVs(thiswouldrequirebuildoutofhydrogendistributionnetworksthroughpipelinesortrucking)anddirectfuelingofhydrogenpoweredlonghaultrucks,iftheyevergetcommercialized.HydrogentruckmakerHyzonMotorsstoppedfilingfinancialstatementswiththeSECinQ12022(Ididn’tknowthatwasallowed)afterdelivering87unitsin2021,andtheformerCEOofNikolaMotorswasconvictedofsecuritiesfraudinOctober2022forstatementsmaderegardingNikola’shydrogentruckbusiness.Thereare50hydrogentrucksontheroadinSwitzerlandaspartofHyundai’spilot,andHyundaiplanstodeliveranother27toGermany.Bottomline:MSWenergyrecoverymakessenseandmeritsthesupportitgetsintheenergybill39.Whileitscontributiontogreenelectricity,heatorhydrogenislikelytobeverymodestatanationallevel,itcouldplayaroleinboostinglocalenergysecurityandreducestressonotherenergyinfrastructure.IncontrasttoenergyconversionfromMSW,solidbiomassenergyfromwoodpelletsiswaymorecontentiousandpossiblysuspectasapresumedsourceofrenewableenergy,asweexplainnext.37Assuming50-60kgofhydrogenpertonofMSWviagasificationonanetbasis(netofthehydrogenrequiredtopowersomeoftheintermediateprocesses)38Greenammonia:ammoniahasahydrogencontentof17%,anexistingdistributionnetwork,isliquefiedathighertemperatures(-33⁰C)thanhydrogen,hashighervolumetricenergydensityvsotheralternativesandlowerenergylosseswhentransportedoverlongdistances.That’sthegoodnews.Hydrogeninammoniacouldthenbereleasedthroughcatalyticdecomposition,orammoniacouldbeusedinafuelcelldesignedforit.However,alltheseconversionscarryenergypenalties:intransport,round-tripefficiencyofliquidammoniaproducedfromgreenhydrogenmaybejust11%-19%.39Biogas:investmenttaxcredits;renewablenaturalgas:alternativefuelcreditsMunicipalwasteEYEONTHEMARKET•MICHAELCEMBALEST•J.P.MORGAN13thannualenergypaperMarch28,202337Europe:notquiteasgreenasitlooksAsshowninthefirstpiechart,MSWisasmallportionofglobalbioenergyutilization.Thevastmajorityisstill“solidbiomass”,acategorywhichincludesforestresidue,woodchips,woodpellets,sawmillresidueandconstructionscrap.Theemissionsmitigationandbiodiversityimpactofsolidbiomassisahotlydebatedtopicamongclimatescientists.Ononeendofthespectrum40,there’ssomeagreementthatremovaloffinewoodydebrisfromdeciduousandconiferoustreesisa“good”sourceofsolidbiomass.Attheotherendofthespectrum,conversionofnaturallyregeneratingforeststomonocultureorpolycultureplantationsisconsideredavery“bad”source.Inbetween:stumpremoval,grasslandafforestationandafforestationofagriculturalland.Europeisdeployingalotofwindandsolarpower,butbiomassisstillamaterialpartofEurope’srenewableenergymix.ThenumbersaremurkysinceEU/IEAandBPdatadiffersubstantially.AccordingtotheEU/IEA41,63%oftheEU28renewableenergymixin2019camefrombioenergy,aroundtwothirdsofwhichwassolidbiomass(therestwasbiofuelsandMSW).UsingBPdata,thebioenergysharewas21%in2019and19%in2022.Eitherway,theEU28stillusesalotofsolidbiomassforelectricity,residentialandcommercialheatandindustryenergy.Europeproducesmorethanhalfoftheworld’swoodpellets,andimportsevenmore.Asexplainedabove,notallwoodpelletsareequalregardingclimateimpact;itdependsonthesource.WilliamSchlesingerofDukeUniversity’sNicholasSchoolcitesanexampleofthecontroversyonwoodpellets:a50-MWpowerplantburningwoodpelletswouldemit43,730tonsofCO2eachyear,whereasthesameplantburningcoalwouldemit39,200tonsperyear.Thedifferencestemsfromthelowerenergycontentofwood,soyouneedtoburnmoreofit.42Itwouldthentakemanyyearsfornewtreegrowthtorecapturethedifference.Thatmightbewhy500scientistswrotealettertotheEUCommissionin2021askingforanendtobiomasssubsidies43.Separately,theEuropeanAcademiesScienceAdvisoryCouncilbelievesthatreplacingcoalwithwoodpelletstogenerateelectricityincreases“atmosphericlevelsofcarbondioxideforsubstantialperiodsoftime”44,anda2018studyfromMIT’sJohnStermancametosimilarconclusions.Evenso,theEuropeanParliamentvotedlastSeptembertostilldefinewoodybiomassasrenewable.Asaresult,smokestackCO2emissionsfromburningwoodpelletsaretreatedintheEUasiftheysimplydidn’texist.40“TheuseofwoodybiomassforenergyproductionintheEU”,EuropeanCommission,2021.Seepage9ex.41“ImplementationofbioenergyintheEuropeanUnion,2021update”,IEATechnologyCollaborationProgram.Partofthereason:EC/IEAdatadoesnotusethermalconversionassumptionsforrenewablesandnuclear,asBPdoes.Butthere’salsoalargeamountofbiomassuseintheEUdatathatBPdoesnotinclude.42“Smoke,mirrorsandwoodpellets”,WilliamSchlesinger(Duke),February22,202243“Letterregardinguseofforestsforbioenergy”,February11,202144“EASACopenlettertoIEABioenergy”,EuropeanAcademiesScienceAdvisoryCouncil,May13,2020Biogas,2%Liquidbiofuels,7%Municipalwaste,3%Industrialwaste,2%Solidbiomass,86%Globalbioenergysupply,2020PercentSource:WorldBioenergyAssociation.2022.Europe,56%Asia,14%Oceania,0.4%Africa,0.2%Americas,30%Woodpelletproduction,2021PercentSource:WorldBioenergyAssociation.2022.MunicipalwasteEYEONTHEMARKET•MICHAELCEMBALEST•J.P.MORGAN13thannualenergypaperMarch28,202338[7]CCSproposalsin,mostlythrownout:thehitrateofplannedcarboncapture&sequestrationprojectshasbeenlow,butthatmaychange(alittle)withnewincentivesandeconomiesofscaleI’vewritteninthepastthatthehighestratiointhehistoryofscienceisthenumberofacademicpaperswrittenoncarbonsequestrationdividedbyactualcarbonsequestration.AccordingtoGlobalCCSInstitutedatacompiledinmid-2022,EuropeandtheUSwereontracktosequesterjust1.5%-2.0%oftheircurrentemissionsby2030,andthatincludesprojectsstillindevelopment.China’sCCStargetswereevenlower.Thetrackrecordofcarbonsequestrationhasbeenverymixed.A2022reportfromtheInstituteforEnergyEconomicsandFinancialAnalysis45covered13oftheworld’sbiggestprojects,accountingformorethanhalfofglobalcarboncapturecapacity.AccordingtoIEEFA,onlyhalftheprojectsmettheirsequestrationtargets.Similarly,a2020studyfoundthataroundhalfof39CCSprojectsattemptedintheUSfailedtomeettargets46.Someprojectsspentresourcesonfrontendengineeringanddesignbutwereterminatedbeforecompletion;othersfailedafterinceptionandwereabandonedorreconfiguredwithoutCCS;andothersareinoperationbutsequesterCO2belowtargets.Thesamestudyfoundthatonaglobalbasis,80%ofplannedCCSprojectswereneverbuilt.Asshownabove(right),onlygasprocessingCCSprojectshadahighcompletionrate.Largerprojectsfailedmoreoften,asdidfirst-of-a-kindCCSsystems.Asuccessfactorinthestudy:crediblerevenuesintheformofbilateralofftakeagreementsforCO2,usuallyforuseinEnhancedOilRecovery(EOR)47.AccordingtoGlobalData,74%ofactiveCCSfacilitiesareincentivizedbytheeconomicvaluegeneratedfromEOR.Andthenthere’stheforbiddingcarboninfrastructuremath:sequesteringjust15%ofcurrentUSCO2emissionswouldrequireCCSinfrastructurewhosethroughputvolumeisgreaterthanthevolumeofoilflowingthroughtheentireUSdistributionandrefiningsystem48,anetworkwhichtookover100yearstobuild.Withoutviableafter-marketsforCO2whichfaceverychallengingthermodynamicrealities(seepage39),theprocessingandpipelinerequirementsneededforCCStomakeadentarestaggering.45“TheCarbonCaptureCrux”,IEEFA,RobertsonandMousavian,Sept202246"ExplainingsuccessfulandfailedinvestmentsinU.S.carboncaptureandstorageusingempiricalandexpertassessments",Abdulla(Carleton)etal.,EnvironmentalResearchLetters,December29,202047Gasinjectionusingnaturalgas,nitrogenorCO2accountsfor60%ofEORintheUS,withthermal(steam)injectionaccountingfortheremainder.Only20%ofCO2usedforEORiscapturedfromprocessingplantsorpowerplants;themajorityofCO2usedforEORcomesfromnaturallyoccurringundergroundreservoirs4815%ofUSCO2emissions=0.75bntonnesofCO2byweight,and0.94bcmofCO2byvolumeassuming800kgofCO2perm3(supercriticaltreatment).That’smorevolumethan2021USdistributionandrefiningof0.71bntonnesofcrudeoil,whosevolumewouldbe0.82bcmassumingoildensityof870kg/m30.0%0.5%1.0%1.5%2.0%2.5%0255075100125150175200225250USEuropeChinaGlobalInconstructionordevelopment(lhs)Currentcapacity(lhs)Totalas%ofcurrentemissions(rhs)Currentvsplannedcarbonsequestrationby2030MilliontonnesperannumofCO2PercentSource:GlobalCCSInstitute,OWID,JPMAM.2022.0255075100PowerOtherindustrialGasprocessingPlannedbutneverbuiltSequestrationcapacitybuiltSource:"ExplainingsuccessfulandfailedinvestmentsinU.S.carboncaptureandstorageusingempiricalandexpertassessments",Abdullaetal.,2021.CCSambitionshavefallenwellshortofrealityGlobalCO2sequesteringcapacity,MilliontonnesperannumCarbonsequestrationEYEONTHEMARKET•MICHAELCEMBALEST•J.P.MORGAN13thannualenergypaperMarch28,202339SomeofmycolleaguesaremoreoptimisticonCCSnowthatlargeoil/industrialcompaniesareinvolved,buildingsequestrationprojectsasaservice.Around30USoil,gasandpetrochemicalprojectsannouncednewCCSadd-onsandgreenfieldprojectstotakeadvantageofthe$60-$85pertonnetaxcreditforsequesteredCO2intheenergybill.RystadEnergyprojects3xmoreglobalsequestrationvolumeby2030thantheCCSInstitute,althoughthatwouldstillbejust2%ofglobalCO2emissions,andtheyalreadyestimatethatonethirdoftheprojectswillbedelayed.RystadalsotrackspilotprojectsbasedonutilizationofCO2(forindustrialproducts,concrete,fuelandchemicals)ratherthanforsequestrationorEOR.Thisiscurrentlyaverysmallmarket,consuming~230milliontonnesperyearofCO2,or0.6%ofglobalemissions.Therearepossiblebreakthroughs:PacificNorthwestNationalLaboratoryannouncedatechniquetocapturefactoryemissionsat$39pertonnevs$55-$60usingcurrentstateofthearttechnology(therevisedapproachneeds2%waterratherthan70%,reducingcostsbyrequiringlessheattoboilasmalleramountofwater).Somethingtowatch:NetPowerplanstobuildnaturalgasplantswithCCStechnologytocapture97%ofCO2generated,usingsupercriticalCO2ratherthansteamtodrivetheturbine(itsfundersincludeOccidentalPetroleum,8RiversandConstellationEnergy).Someindustrialcompaniesalreadyknowhowtoseparatecarbonfromgasstreamssinceit’srequiredinureaplants,coal-to-chemicalsandgasprocessing.TheycurrentlyreleasetheCO2ratherthancapturingandstoringitpermanently.ButeveniftheyfinanceCCSwiththehelpoftaxcredits,itcantake5-6yearstogetClassVIpermitsforundergroundsequestrationfromtheEPA.Also:infrastructureandstoragecapacityrequiredisoftenmuchgreaterthantheneedsofanysingleemitter;CCShubswouldbeneededsothatemitterscouldsharethecostoftransportandstorage,andcreatingthemiscomplicated.Bottomline:CCSprojecthitratesmayrisebuttheiraggregatecontributionislikelytobesmallTherearethreecriticalvariablesinplay:•ProximitytogoodsequestrationlocationssuchastheUSGulfCoast(highstoragedensityduetoshallow,highporosityandhighpermeabilityaquifers),bringingdownpipelineandinjectioncosts•HighconcentrationandpressureofCO2influegasstreams,whichreducesCO2capturecosts•Theshareofeachsectorasa%oftotalindustrialemissions,asameasureofmaterialityAsshownonthefollowingpage,ethanolandgasprocessingplantshaveveryhighconcentrationsofCO2influegasstreamsbutrepresentsmallersharesofUSindustrialemissions.Theelephantsintheroomarepowerplantswhichaccountfor~70%ofindustrialemissions,butthey’vegotamongthelowestCO2concentrations.So,unlesstherearenewcommercializedtechnologiestocapturepowerplantemissionsprofitablywithasubsidyof$85pertonne,andunlesslargenumbersofthesepowerplantsarelocatednearviablesequestrationlocations,theUSmayremainontargettosequesterjust2%ofitsemissionsby2030.PetronasLakeCharlesMethanolG2LNGChevronAustraliaSinopecShellEquinorCameronLNGPetrobrasEniRioGrandeLNGOccidentalPetroleumTotalEnergiesIneosExxonMobil0510152025CurrentandprojectedCCScapacityMilliontonnesperannumSource:GlobalData,EnergyMonitor.AI.2020.CarbonsequestrationEYEONTHEMARKET•MICHAELCEMBALEST•J.P.MORGAN13thannualenergypaperMarch28,202340WhataboutsyntheticfuelsderivedfromCO2?There’salotofresearchonpossibleconversionmethods,butnomajorbreakthroughssofar.Thiswillbeatopicforanotheryear.Tosummarize:CO2isaninertlow-energymoleculethatrequiresalotofenergytobreakapart.ThiscausespooradsorptionofCO2onthesurfaceofacatalyst,whichiswhyit’sdifficulttoobtainfuelsfromchemicalconversionandwhenusingenzymesinbiologicalconversionaswell.Arecentpapersummarizedmanyideasbeinginvestigated49.Somearechemical(catalytichydrogenation,photocatalyticandelectrochemicalconversion)andsomearebiological(photosynthesis,non-photosynthesisandbio-hybridconversion).Thepaperconcludedthatthesearchforahighlyactive,stableandcost-effectivecatalystisaworkinprogress.Ifanythingeverchanges,wewillwriteaboutithere.CCSExhibitsGasandcoalpowerplantsaccountforthelargestshareofUSindustrialemissionsbuthaveamongthelowestCO2concentrations,resultinginhighercapturecostsperton.CapturingCO2fromflueswith15%concentrationscanbeimpairedbycontaminants(sulfur,mercury,flyash,etc)thatnegativelyaffectCO2capturecatalysts.IcanbeconvincedthatlearningcurveswillreducesomeCCScosts,andthattherecouldbebreakthroughsonsolidadsorbentsormembranesthatreactwithCO2.Buttoreiterate,theUSinfrastructuremathcitedearliersuggeststhattheoverallCCSimpactwillbeverymodest…andthenthere’sChina,whoseincreaseinannualcoal-firedpoweremissionssince2019islargerthanallnewUSandEuropeanannualsequestrationplannedfor2030.49“Conversionofcarbondioxideintofuels”,JournalofCO2utilization,Okoye-Chine(VCU)etal,August2022CoalpowerplantsNaturalgasCCGTpowerplantsRefineriesPulp&paperSteelblastfurnaceGasprocessingCementproductionHydrogenviaSMRAmmoniaEthanol0100200300400500600700800AnnualUSGHGemissionsfromindustrialsectorMilliontonnesofCO2equivalentSource:EnergyFuturesInitiative.February2023.AluminumproductionBioenergyFueloilpowerplantAmmoniafuelcombustionNaturalgaspowerplantOilrefineriesEthyleneplantCoalfiredplantIntegratedsteelmillsHydrogenproductionNon-ferrousmetals,pulp/paperCementplantGasificationbiofuelsNatgasprocessing,post-sep.AmmoniaprocessingEthanol,biomassfermentationEthyleneoxide0%10%20%30%40%50%60%70%80%90%100%CO2concentrationinfluegasstreamsPercentbyvolumeSource:IPCC,SwedishEnv.ResearchInstitute,PennState,JPMAM.2022.3.23.43.63.84.04.24.44.62016201720182019202020212022China:CO2emissionsfromcoalfiredelectricitygenerationGigatonnesperyear,rolling12monthsSource:Ember,JPMAM.December2022.GlobalCCSInstituteRystad0100200300400500600700IncreaseinannualChinacoal-firedpoweremissionssince2019PlannedincreaseinUSandEuropeanannualCCSby2030PlannedincreaseinUSandEuropeanannualCCSby2030US/EuropeanCCSambitionsvsChinacoalemissionsMegatonnesperyearSource:Ember,GlobalCCSInstitute,JPMAM.2022.CarbonsequestrationEYEONTHEMARKET•MICHAELCEMBALEST•J.P.MORGAN13thannualenergypaperMarch28,202341[8]CaliforniaDreaming:theimprobablereveriesofelectricplanes,nuclearfusion,space-basedsolarpower,directaircarboncaptureandfullyautonomouscarnetworksEachideabelowhasbeenshowntoworkinpreliminaryfieldtesting,inalabsettingorinaconceptualmodel.Mypurposehereisnottodisputetheirtechnicalfeasibility;itistoexplainwhynoneofthemshouldbeexpectedtomakeameaningfulcontributiontodecarbonizationinthenextdecadeormore.ElectricplanesOnceyoufactorinenergydensityandreserverequirements(theneedtocircleanairportinadelayorflytoanotherairport60milesawayinanemergency),electricplaneswith20-100seatswouldbeabletotravelforonly6-30miles50.InternationalCouncilofCleanTransportationanalystsfoundthatevenwithasubstantialimprovementinbatteryenergydensityfromtoday’slevels,suchafleetwouldoffsetlessthan~1%oftotalaviationemissions;theauthors“weresurprisedbyhowterribletherangeactuallywas”51.Otherstudieshavecometothesameconclusionregardingtheimpactofdecarbonizingshorttrips:whiletripslessthan200milesareplentifulbynumberofdepartures,theyrepresentlessthan5%ofaviationemissions52.Evenafteraccountingforthehigherefficiencyofelectricmotors,theeffectiveenergydensityoftraditionalplanesisstill22xhigherthanelectricplanes53.Safetyandcertificationissueswouldalsohavetobemet,anddelaysinEviationandNASAX-57prototypesareasignofhowhardthisistoachieve.In1909,theWrightbrothersdeliveredanairplanetotheUSgovernmentcapableofcarrying2peoplefor70miles;that’sthesamecapabilityofcertifiedbatterypoweredplanestoday(themodernversionsarestableinflightwithmoderncontrolsandsafetysystems,andareusedfortraining).OneanalysiscitedtheidealusecaseforsmallelectricplanesasremoteregionsinNorwayortheOrkneyIslandsinScotland,sincetherearenoland-basedalternatives.Prospects:groundeduntilfurthernotice.NuclearfusionADecember2022fusionexperimentgeneratedmoreenergythanitconsumed,with2MJofenergyinand3MJout.Butittook300MJofenergytopowerthelaserswhichproducedtheenergyinputs,andevenmoreenergytopowercoolingsystemsandcomputers.Also:theexperimentwasfiredonceatasingletarget,andcanonlydosoonceaday;itrequiredequipmenthousedinabuildingthat’sthesizeofafootballfield;anditgeneratedenoughenergytoboilateakettleorrunahairdryerfor15minutes.Otherproblems:releaseoffusionenergydestroyssurroundinginstrumentsandmirrors;commercializedfusionwouldrequiremultiplepulsespersecond(notjustoneperday)andwithoutallthedamage;fusionactuallydependsonfissionreactorsfortritiumfuel;andanyfusionenergybalancemustalsoaccountfortheenergyrequiredtobuilda400,000tonfacility,asinthecaseofITERinFrance.54USEnergySecretaryGranholmstatedagoalofcommercialfusioninthenextdecade.Idon’tthinktheBidenadministrationhasanybasisforthisprojection,otherthanhopiumrepeatedbyfusion’struebelieversandinvestors.Fusionasapracticalsourceoflimitlesselectricityisat“aboutthesamestageoftechnologyreadinessasin1978”55.Fusionappearstobedecadesaway,ifitcanbedoneatall.Prospects:notinmylifetime.50“Thisiswhatiswhat’skeepingelectricplanesfromtakingoff”,MITTechnologyReview,August202251“Performanceanalysisofregionalelectricaircraft”,MukhopadhayaandGraver,InternationalCouncilonCleanTransportation,July202252“Thepotentialoffull‑electricaircraftforciviltransportation”,Staacketal(LinkopingUniversity/Sweden),CEASAeronauticsJournal,2021,seeFigure453Assumptions:electricmotorefficiency90%vsjetcombustionefficiency33%;jetfuelenergydensity43MJ/kgvslithiumionenergydensityof0.97MJ/kgplus150%improvement;emptyplanewt=54%oftake-offwt;cargo+passengers=21%oftake-offwt;electricplaneusefulloadis70%ofjetduetolackoffuelshedding54“TheQuestforFusionEnergy”,DanielJassby(PrincetonPlasmaPhysicsLaboratory,retired),May2022InferenceQuarterlyScienceReview55“FusionMania”,JohnDeutch(MIT,USEnergyAdvisoryBoard),Joule,April2023forthcomingCaliforniaDreamingEYEONTHEMARKET•MICHAELCEMBALEST•J.P.MORGAN13thannualenergypaperMarch28,202342SpacebasedsolarpowerIt’salwayssunnyinspace,with3x-50xmoresolarenergythanonearth.Buttoharnessthatsolarpower:robotswouldhavetoassemblesolarpanelsinouterspace;multiplecostlylauncheswouldbeneededforeachspacestation,leavingeachprojectwithalargeemissionsdeficitupfront;spacedebriscoulddamagepanelsrequiringspace-basedrepair;panelswouldbeexposedtoconstantradiation,affectinglifespanandperformanceinunknownways;spacesolarpowerwouldhavetobeconvertedtomicrowavesandbackatjust40%efficiency;heatsheddingisneeded,whichisdifficultinspace;allresultinginefficienciesofjust25%-35%.Accordingtoonetreatiseonspacesolar,itscostcouldbethreeordersofmagnitudehigherthanterrestrialequivalents56.Chinaaimstohaveasystemoperatingby2035,althoughIthinkit’sfairtowonderifit’sanenergysystemoraweaponssystem.TheUKaimsfor2040:a2,000poundsatellitetakingupanentiresquaremileinspace,andaterrestrialantennathatrequiresapieceoflandthatis4milesby8miles.Antennacostalone:$1billionfor5GW.TheEuropeanSpaceAgencyandNASAareworkingonthisaswell,buteachsatellitewouldbe10xheavierthantheInternationalSpaceStation,whichweighs450metrictonsandwhichtookthreedecadestobuildinlowEarthorbit.ApaperfromtheColoradoSchoolofMinesestimatedthatcostswouldhavetodeclineby94%fromanoriginal2012estimatetomakesense.SpacesolarisnotinfeasiblelikethefictionaltransportersystemontheUSSEnterprise,justreally,reallyexpensive.Prospects:cloudywithachanceoffailure.Directaircarboncapture(DACC)Twoyearsago,IcitedaDACCpaperconcludingthatitwas“anenergeticallyandfinanciallycostlydistractionineffectivemitigationofclimatechangesatameaningfulscale”57.Theauthors’conclusionwasbasedontheenergyrequiredtoproducetheaqueoushydroxidesolutionthatreactswithCO2andtheenergyneededtoregenerateit,plusenergyrequiredtocompressCO2andstoreitunderground.TherearenewUSDACCsubsidiesof$180pertonandlotsofstartups,butI’mnotsuremuchhaschangedyet.CO2onlymakesup0.04%oftheatmosphere,requiringmoreenergytocapturethanCO2fromfluegas.IfestimatesfromtheWorldResourcesInstituteareright,DACCrequires~2,200kWhpertonofCO2…sotocapture10%ofUSemissions,itwouldtake1.2trillionkWh,or~30%ofUSelectricitygeneration.A2022updatefromUCRiverside58foundthatCO2captureusingliquidsolventsrequires1-13tonsofwaterpertonofCO2,andestimatedDACCcostsat$250-$1,000perton.Thehighervaluesreflectuseofrenewablepowerratherthanfossilfuelstosourcetheenergy.HowardHerzog(MIT,authorofCarbonCapture)highlightedlastyearthatevenamodestlysizedUSDACCindustrywouldeffectivelyconsumealmostallexistingcapacityofzerocarbonenergy.MassproductionmaybringsomeDACCcostsdown.Occidentalisbuildingoneoftheworld’slargestDACCplantsinthePermianBasintocapture1mmtonsperyear,andplanstobuild100by2035(100mtpa=0.27%ofglobalemissions).RoughlyfourDACC1mmtonplantswouldhavethesameannualCO2benefitasTesla’s2022productioncomparedtoICEcars59.ButOccidentalisstillbuildingtheirfirstplant,andtheproject’soriginalbudgethasalreadybeenrevisedupby15%.Let’swaitandseehowthisgoesbeforeextrapolatingtoomuch.AcynicwouldsaythatDACCisawayforcompanieswithverysmallCO2footprintstopayhugepremiumstooffsetthem60,generatingtaxpayer-fundedwindfallsforDACCcompanieswhosecontributionstoemissionsreductionswillendupbeingnegligible.Prospects:irrelevantwithoutasea-changeintechnology.56“Spacebasedsolarisnotathing”,CaseyHandmer(Caltech),August2019.Caseyisapolymathwhoprovidedvaluableguidance,insightsanddataforthissectionandothersinthisyear’spaper57“Unrealisticenergyandmaterialsrequirementfordirectaircaptureindeepmitigationpathways”,ChatterjeeandHuang,NatureCommunications,202058“Currentstatusandpillarsofdirectaircapturetechnologies”,Ozkanetal,iScience,April202259Assuming3.0-3.5tonnesofCO2savingspervehicleperyearvsanICEcar,and1.3mmunitssoldbyTeslain2022.Sources:EuropeanFederationforTransport&Environment,USEPA60ClimeworksdoesnotdisclosewhatitchargesMicrosoft,StripeandShopifypertonofCO2viaDACC;publishedreportsindicateatleast$600perton,withthecompanyaimingtoreduceitto$500by2025CaliforniaDreamingEYEONTHEMARKET•MICHAELCEMBALEST•J.P.MORGAN13thannualenergypaperMarch28,202343FullyautonomouspassengercarnetworksreducingemissionsAccordingtotheMIT-IBMWatsonAILab,self-drivingcarscouldreducefuelconsumptionby18%andreduceCO2emissionsby25%61.Thebenefitswouldallegedlyresultfromanoptimizednetworkthatavoidsstop-and-gotraffic.Intelfamouslyprojecteda$7trillionautonomouscarmarketopportunityin2017,GMprojectedmassproductionoffullyautonomousvehiclesby2019,Lyftsaidin2016thathalfitsrideswouldbeself-drivingby2021andFordalsomentioned2021asamassproductiondate.So,wherearealltheself-drivingcars?After$100billionspentaccordingtoMcKinsey,there’slittleprogresssofar.Someautomakershavescaledbacktheirambitions,whileFordandVWpulledtheplugontheirself-drivingcareffortscompletely.Waymonowsaysitwilltakedecadesbeforeautonomousvehiclesarewidelyused,andabasketofLiDARscanningstockshascollapsedby80%sinceitspeak.Yearsoftestingrevealstherearestilltoomanyunpredictable“edgecases”forautonomouscarstofigureout.Today,self-drivingcarsaremostlyconfinedtoplacesintheSunBeltsincetheystillcan’thandleadverseweatherverywell,andstrugglewithconstruction,animals,trafficcones,crossingguardsand“unprotectedleftturns”involvingoncomingtraffic.OnevideoshowsaWaymocarsoconfusedbyatrafficconethatitdrivesawayfromthetechniciansenttorescueit.Oneoftheindustry’searliestadvocatesscaleddownhisambitionstofocusonautonomoustrucksforindustrialsites,sincethat’swhatthetechnologycannowhandlebest.Foralltheirfaults,humansareprettygooddrivers:onetrafficdeathper100millionmilesdrivenasperNHTSAdata(busdriversareevenbetteratonefatalcrashper500millionmiles).It’salsounnervingthatsomeautonomouscarcompaniesreportedlyrunsimulationsinsidedatacentersandcounttheresultsas“roadmilesdriven”.Thehypeonthisideagotaheadofitself;vehicleautonomyonecanfindtodayismostlyconfinedtoLevel2featuressuchasemergencybraking,trafficwarningsandsteeringassistance(vsLevel5fullautonomy).WhataboutTesla?400,000TeslacustomerspayextraforsomethingTeslacalls“FullSelfDriving”features.TheCaliforniaDMVsuedTeslaformisleadingadvertising,claimingthatTeslafeaturesarereallyjustLevel2featuressuchassteering,lanefollowingandbreak/accelerationsupport.Whatevertheirlevel,thesefeaturesapparentlyworkwell.AccordingtoTesla’sself-reporteddatashownbelow,itsautopilottechnologyavoidsalotofaccidentsandappearswayaheadoftheclosestcompetitor.Thatsaid,Teslahasissuestoo:inFullSelfDrivingmode,oneofitscarsencounteredapersonholdingupastopsigninthemiddleofaroad.Thecarfailedtorecognizetheperson(partlyobscuredbythestopsign)andthestopsign(outofitsusualcontextonthesideofaroad);thehumandriverhadtotakeoversincetheexperiencewasoutsideofthetrainingdataset62.Prospects:optimizedlarge-scaletrafficnetworksgovernedbyself-drivingvehiclesworkgreatinDisney’sWall-EandtheJetsons,butarenotinournear-termfuture.61“Ontheroadtocleaner,greener,andfasterdriving”,MITNews,May202262“AIPlatformslikeChatGPTAreEasytoUsebutAlsoPotentiallyDangerous”,ScientificAmerican,Dec202201002003004005006007002020202120222023LiDARstockbasketIndex(100=December2019)Source:Bloomberg,JPMAM.March20,2023.Companies:Aeva,Cepton,Innoviz,Luminar,Microvision,Ouster,VelodyneLidar0123456Tesladriversusingautopilot(2021-2022)Tesladriversnotusingautopilot(2021-2022)USaverage(2021)MillionmilesdrivenbeforeacaraccidentSource:Tesla,DepartmentofTransportation,JPMAM.Q42022.CaliforniaDreamingEYEONTHEMARKET•MICHAELCEMBALEST•J.P.MORGAN13thannualenergypaperMarch28,202344Epilogue:HowEuropesurvivedthewinterof2022andwhatcomesnextforRussia/ChinaAfewmonthsago,someprojectionsforEuropeweredire:apossible€2trillionenergycosthittoEUconsumers.Thenetcostnowlookslike€0.5trillioninstead.Inthissectionwelookatthedetails,implicationsforcoal,whereRussia/Chinagofromhereandtheissueofenergysubsidies.PrimaryEuropeansurvivalfactors:•Stimulus.Fiscalstimulus,windfallprofitstaxes,naturalgaspricecapsandsubsidies(seepage44)•Weather.OneofthewarmestwintersintheNorthernHemisphereinthepast50years•Massivedemanddestruction,whicharethelargestbarsinbothchartsbelow.Isdemanddestructionsustainable?Alotofarticleshavebeenwrittenon“Europeandeindustrialization”sincelastfall.That’sthekindofthingthatcanonlybemeasuredoverlongperiodsoftime,butitwillbesomethingtowatch•Morerenewables,increaseduseofcoalanddrawingdowngasstorage.China’sCOVIDlockdownreduceditsLNGdemand,whichallowedEuropetoenterthewinterwithnaturalgasstorageover90%+.Germanyendedthewinterwith70%gasstorageinsteadofits30%average•Electricitypricingpolicychanges.Europealteredapricingmechanisminwhichwind,solar,hydro,coalandnuclearpowerproducerswerepaidthesamepriceforelectricityaspowerproducersusingnaturalgas.Whythechange?FossilfuelproducerssetmarginalpricesmostofthetimeinEurope(seetable),andwhennaturalgasinputpricessoar,themarginalpriceforelectricitywaspaidtoallpowerproducers.Europeancountrieshavenowimplementedelectricitypricecapsthateffectivelyreducewindfallprofitsofnon-gaselectricityproducerswhengaspricesspikeNuclearHydroOilBiomassOtherOffshorewindGasHard/blackcoal,anthraciteLignite/browncoalOnshorewindSolarNetimports-200-180-160-140-120-100-80-60-40-200IncreaseinTWhDecreaseinTWhChangeinEUelectricitygeneration:2021vs2022TerawatthoursSource:ICIS.2022.Demandreduction-118-64-4-2-12410152532993RussiapipelineNetstoragesDomesticproductionAlgeriapipelineAlgeriaLNGLibyapipelineNigeriaLNGQatarLNGAzerbaijanpipelineRussiaLNGOtherNorwaypipelineOtherLNGUKpipelineimportsUSLNG-1,750-1,500-1,250-1,000-750-500-2500IncreaseinTWhDecreaseinTWhChangeinEUnaturalgassupplymix:2021vs2022TerawatthoursSource:ICIS.2022.DemandReduction-839-595-76-28-18-6-6352957828691224375589HowmarginalelectricitypricesaresetinEurope%ofallhoursCountryFossilfuelNon-fossilImportsGermany91%7%2%Denmark25%13%62%Spain89%6%5%France7%93%0%Ireland61%1%38%Italy86%11%3%Greece77%0%23%Portugal87%13%0%UK84%1%15%Source:"EnergyTransitionsinEurope-RoleofNaturalGasinElectricityPrices",Zakerietal.July23,2022.6,0006,2506,5006,7507,0007,2507,5007,7508,0008,250197419801986199219982004201020162022HistoricalheatingdegreedaysinwinterfortheNorthernHemisphere,Population-weighteddays,Dec-FebSource:J.P.MorganGlobalCommoditiesResearch.February16,2023.Europe,Russia,ChinaEYEONTHEMARKET•MICHAELCEMBALEST•J.P.MORGAN13thannualenergypaperMarch28,202345WhiletheworstisprobablyoverforEurope’senergycrisis,theregionwillstillemergeashavingveryhighimportdependency,highercostsofenergythantheUSandimpedimentstoindustrialactivity.CompaniessuchasBASF,Dow,Trinseo,Lanxessand~50%ofallchemicalcompaniesstillintendtocutjobsandinvestmentinGermanygivenhigherenergycosts,withsomeplanningamovetotheUS.Anotherexample:Europeanaluminumsmeltercurtailmentspeakedinlate2022at30%ofproduction,andlessthan5%havecomebackonlinesincedespitefallinggasprices.Globalcoalconsumptionisnotfallingbutit’salsonotsoaringSomeanalystscitea~6%increaseinEuropeancoalusefollowingitsboycottofRussianpipelinegas,andnewall-timehighlevelsofglobalcoaluse.Technically,that'strue:globalcoalusein2022rosetoanall-timehigh.However,thisall-timehighwasonly1.2%higherthanin2021,andonly1%higherthanthepriorall-timehighin2013.Coalisnolongerindecline(althoughitstillisintheUS),buttheimpactofRussia’sinvasiononEuropeancoaluseissometimesexaggerated.TheIEAexpectsglobalcoalusetobemostlyunchangedby2025,withChinaandIndiaincreasesoffsettingdeclinesintheUSandEurope.0%10%20%30%40%50%60%70%80%90%100%0306090120150180210240270300330360NorthwesternEuropenaturalgasstoragePercentfullSource:Bloomberg,AGSI,JPMAM.March19,2023.2023202220215yearavgDayssincestartofyear01234567892010201220142016201820202022ChinaliquefiednaturalgasimportsTonnes,millionsSource:Bloomberg,JPMAM.February2023.01,0002,0003,0004,0005,0006,0007,0008,0009,000200020042008201220162020GlobalcoalconsumptionMilliontonnesSource:IEA.2022.ChinaRestofWorldEUUSOtherAsiaIndia1%EUUSRestofWorldChinaIndiaOtherAsia7,4007,5007,6007,7007,8007,9008,0008,1002020202120222025TotalGlobalcoaluseandprojectionsto2025MilliontonnesSource:IEA.2022.Europe,Russia,ChinaEYEONTHEMARKET•MICHAELCEMBALEST•J.P.MORGAN13thannualenergypaperMarch28,202346ConsumersubsidiesprovidedinEuropearepartofabroaderdiscussiononfossilfuelsubsidiesthatareoftenmisunderstoodormisinterpreted.Whenpeoplereadheadlinessuchas“Fossilfuelsubsidieshit$1trillionrecord”,theymightnotknowwhoisprovidingthosesubsidies,andtowhom.So,Iwilldothathere.The$1trillionsubsidyfigurefor2022referstoIEAestimatesofenergyconsumptionsubsidiesprovidedalmostexclusivelybydevelopingcountriestoshieldcitizensfromoil,gas,coalandelectricitypricehikes.Thefirstchartshowsthehistoryofthesesubsidiessince2010,whilethesecondchartshowsthelargestsubsidyprovidersin2021.TheIEA’smethodology:comparepricesoninternationalmarketstolocalpriceskeptartificiallylowviadirectpriceregulation,pricingformulas,bordercontrolsorsupplymandates.Someemergencyspendingin2022wasnotcapturedinthefirstchartincountrieswhereconsumerpriceswereclosetomarketprices.TheIEAestimatedthese“otherconsumermeasures”at~$500billionin2022,$350billionofwhichwasspentinEuropewhoseconsumersfeltalotofpainanyway.Doconsumersubsidiesshieldenergyconsumersindevelopinganddevelopedcountriesfromitstrueeconomiccost?Yes.Wouldremovingthesesubsidiesacceleratetherenewabletransitioninastableandpredictableway?Unclear,andtheIEAitselfstatesthat“fossilfuelpricesarenotthebestwaytodrivecleanenergytransitions…Imbalancedorpoorlysequencedapproachestotransitions,inwhichfuelsupplyiscutaheadofdemand,createclearrisksoffurtherpricespikesandthereisnoguaranteethatsuchepisodesareunambiguouslygoodfortransitions”63.63“Fossilfuelconsumptionsubsidies2022”,IEA,February2023$0.0$0.2$0.4$0.6$0.8$1.0$1.22010201220142016201820202022eCoalElectricityNaturalgasOilFossilfuelconsumptionsubsidiesbytype,2010-2022US$,trillionsSource:IEA.2023.UkraineIraqKazakhstanUzbekistanArgentinaUAEVenezuelaAlgeriaIndonesiaEgyptSaudiArabiaIndiaChinaIranRussia$0$20$40$60$80Fossilfuelconsumptionsubsidiesbyprovider,2021US$,billionsSource:IEA.2023.$0$50$100$150$200$250$300$350$400EuropeanUnionRestofadvancedeconomiesEmergingmarketsanddevelopingeconomiesOthergovernmentconsumermeasurestoreduceenergybillsduringthe2022energycrisis,US$,billionsSource:IEA.2023.$13$106$0$50$100$150$200$250$300$350$400$450$500$0$10$20$30$40$50$60$70$80$90201520162017201820192020202120222023EUgasandelectricitypricesUS$perMMBTUUS$perMWh,14dayaverageSource:Bloomberg,JPMAM.March20,2023.Electricity(Germany,Spain&Franceavg,rhs)EuropeanNaturalgas(TTF,lhs)Europe,Russia,ChinaEYEONTHEMARKET•MICHAELCEMBALEST•J.P.MORGAN13thannualenergypaperMarch28,202347ARussia-Chinapartnership“withoutlimits”includesalotofenergyRussiaandChinaannounceda“no-limits”partnershipbeforetheinvasionofUkraine.Bilateralenergyandcapitalflowsareshownbelow.Othernotabletrends:aspikeinChineseexportsofarms,ammunition,firearmpartsandaircraftpartstoRussiaalongsideacollapseinChineseexportsofarmsandammunitiontoUkraine.FactsandfiguresonRussia,Chinaandenergy:Naturalgas(bcm=billioncubicmeters)•In2020,Russiasold175bcmofgastoEuropeandjust4bcmtoChinaviathePowerofSiberiapipeline,whichbegandeliveriesin2019;finalphasesetfor2025•ChinagasimportsfromRussiaarestillsmallerthanfromTurkmenistanbutareexpectedtorise.Inthefirsthalfof2022,Chinaimportswere7.5bcmwitha2025targetof48bcmanda2030targetof88bcm.Partoftheprojectedlong-termincrease:PowerofSiberia2,a50bcmgasprojectfromRussiatoChinathroughMongolia•Chineseentitiesparticipatedasinvestors,lenders,off-takersandcontractorsforRussia’sYamalLNGproject,allowingRussiatodiversifyitsgasexportsNuclearandcoal•Russiaisparticipatinginconstructionof2nuclearplantsinChina,andisalsoChina’ssecondlargestcoalsupplier(15%ofChinaimports)afterIndonesiaOil(bpd=barrelsperday)•Russiaexported0.8mmbpdofoiltoChinain2021and1.0mmbpdin2022,andisChina’ssecondlargestoilsupplierafterSaudiArabia.In2022,Rosneftagreedtosellanadditional0.2mmbpdviatheKazakhstan-Chinapipeline.ChinaandIndiaarepartofashrinkingpoolofRussianoilbuyers;inJanuary2023,RussianUralsoilwastradingatamassive50%discounttoBrentChinesepurchasesofRussianenergyEuropeanpurchasesofRussianoilandgas0.20.30.40.50.60.70.80.9$1$2$3$4$5$6$7$820192020202120222023ChinesevsEuropeanpurchasesofRussianenergyUS$,billionsMilliontonnesofoilequivalent/daySource:CREA,EIA,GACC,Bloomberg,JPMAM.March2023.RussiainvadesUkraine$0$5$10$15$20$25$30$35$40$45$50$552010201220142016201820202022ChinaFranceItalyGermanyJapanGreatBritainUSCross-bordersyndicatedloanstoRussiaUS$,billionsSource:BIS.Q32022.RussiainvadesCrimeaEurope,Russia,ChinaEYEONTHEMARKET•MICHAELCEMBALEST•J.P.MORGAN13thannualenergypaperMarch28,202348Appendix:USmethaneupdateasmorestudiesshowhigherleakageratesthanreportedEPAdataIfyouacceptEPAdataatfacevalue,methaneleakagefromUSnaturalgasoperationsfellto~1%in2020,downfrom2.3%in1990.Theseratesreportedlyincludeleakagefromexploration,production,gathering,processing,transmission,storageanddistribution.However,EPAemissionsdataisusuallyprovidedbytheoil&gasindustryandmaynotreflectactualoperatingperformance.Asaresult,climatescientistsconducttheirownmethaneleakagemeasurements.Theiraerial,satelliteandothersurveillancemethodssuggestthatEPAdataunderestimatesmethaneleakageratessubstantially,withthelatestStanfordstudyshowingPermianmethaneleakageratesthatareseveraltimeshigherthanEPAestimates(seetable).InaDecember2022DallasFedsurvey,while~60%oflargefirmshadplanstoreducemethaneemissionsandflaring,only~40%ofsmallerfirmsdid.TheIEAbelievesthatemissionreductionsof~75%arefeasiblewithexistingtechnology,andelevatednaturalgaspricesmakemethaneabatementmoreeconomicallyattractive.A2023studyinIOPScienceconcludedthatfornearlyhalfofalloperators,emissionsintensityinthePermiandidimproveby>50%from2019to2021.Whythisissoimportant:a2022studyinSciencefoundthatonly91%ofmethaneisdestroyedbyflaringratherthantheEPA-assumed98%(afivefolddifference).IaskedBenRatnerinJPMorgan’sSustainabilitygroupforhisthoughtsonthisissue.Ben’scomments:•Reducingmethaneemissionsisthemostimmediateandcost-effectivewayoilandgascompaniescancutgreenhousegasfootprintsinthisdecade,butprogresshasbeenunevenandthere’slowhangingfruit•Industryleadershavebeguntoshiftfromdesktopestimationtomoreaccuratemeasurement(i.e.,usingsensorsonplanes/drones),committedtoeliminategasflaringby2025andhaveengagedwithregulators•TheUSnowdirectlyregulatesmethaneasapollutantundertheCleanAirActandlegislatesamethanefee,althoughflaringstandardsarebelowwhatsomeadvocatesseek.StateslikeCO,NMandPAinstitutedtighterrequirementsforleakdetection/repair,flaringminimizationandotherbestpractices•TheOilandGasMethanePartnership(OGMP)isacollaborationofUSandEuropeanindustryleadersworkingwithcivilrepresentatives.UnderOGMP’srecentlydefined“2.0”protocols,companiesagreetosetamethanetarget,increasemethanemeasurementandreportprogressannually•Eliminatingnaturalgasflaringisacommon-sensemoveforcompaniesthatwanttosupportenergysecurityandsensiblyreducetheircarbonfootprint,whilebringingmoreproducttomarket.Ina2019DallasFedsurvey,70%ofrespondentscitedlackofpipelinecapacityasthereasonforPermianBasinflaringThegasflaringspikein2019-2020appearstobeaby-productofanoildrillingboominregionswithoutadequategaspipelinecapacity,andthefrequentpracticeofgrantingflaringpermitstoanydeveloperrequestingthem.Since2020,morepipelinecapacityhasbeenaddedandindustryoperatorshavebeenmorefocusedoncullingunprofitableoperations.01020304050601.0%1.2%1.4%1.6%1.8%2.0%2.2%2.4%1990199520002005201020152020ThousandsMethaneemissionsandnaturalgasflaringMethaneemissions/productionBillioncubicfeetpermonthSource:EPA,EIA,JPMAM.December2021.MethaneemissionsNaturalgasflaringMethaneemissionsMethanestudies(publication,year,leadauthor)IOPscience2023HmielStanford2022ChenIEA2022N/AScience2022PlantACP2021BarkleyScience2018AlvarezScience2020ZhangSource:JPMAM.2023.Supplychainemissionsare~60%higherthanEPAestimatesPermianBasinmethaneemissionsareovertwotimeshigherthaninventory-basedestimatesHalfofE&PoperatorsinPermianBasinshow>50%gaininmethaneemissionsintensityfrom2019to2021Methaneemissionsfromtheenergysectorare70%higherthantheamountsreportedbynationalgovernmentsFlaringdestroys~91%ofmethanenot98%,a5-folddifferenceOil/gasmethaneemissions48%-76%largerthanEPAestimatesPermianemissionsseveraltimeshigherthanEPAestimatesEYEONTHEMARKET•MICHAELCEMBALEST•J.P.MORGAN13thannualenergypaperMarch28,202349OurlastchartoftheyearshowsGHGemissionsbycountryandsector,sizingeachbaraccordingly.ThedarkbluefugitiveemissionsbarfortheUSisoneofthelargeronesonthepage.TotheextentthatthesefugitiveemissionsarebasedonEPA-reportedmethanedataandnotonhigher-frequencyempiricalmeasurementscitedonthepriorpage,theUSfugitiveemissionsbarmaybesubstantiallyunderstated.Whatarefugitiveemissionsasdefinedinthechart?•CO2fromflaring•CH4fromcoalmining•CH4fromnaturalgasandoilsystems(production,flaring/ventingandtransmission/distribution)•CH4andN2Ofromsolidfuels,oilandnaturalgas,incinerationandopenburningofwaste0%20%40%60%80%100%WorldOtherFugitiveemissionsResidential/commercialbuildingfuelcombustionAgriculture&landuseTransportIndustry/constructionElectricityandcentralizedheatingSource:CAITClimateData,OWID,JPMAM.2019.GlobalGHGemissions:76%carbondioxide,16%methane,nitrousoxide6%.Greenhousegasemissionsbysector&country,%oftotalChinaUSEU27IndiaRusIndoBrJpIranCanTop10emitterssizedproportionately,=65%ofWorldGHGMethaneemissionsEYEONTHEMARKET•MICHAELCEMBALEST•J.P.MORGAN13thannualenergypaperMarch28,202350IMPORTANTINFORMATIONThisreportusesrigoroussecurityprotocolsforselecteddatasourcedfromChasecreditanddebitcardtransactionstoensureallinformationiskeptconfidentialandsecure.Allselecteddataishighlyaggregatedandalluniqueidentifiableinformation,includingnames,accountnumbers,addresses,datesofbirth,andSocialSecurityNumbers,isremovedfromthedatabeforethereport’sauthorreceivesit.ThedatainthisreportisnotrepresentativeofChase’soverallcreditanddebitcardholderpopulation.Theviews,opinionsandestimatesexpressedhereinconstituteMichaelCembalest’sjudgmentbasedoncurrentmarketconditionsandaresubjecttochangewithoutnotice.InformationhereinmaydifferfromthoseexpressedbyotherareasofJ.P.Morgan.ThisinformationinnowayconstitutesJ.P.MorganResearchandshouldnotbetreatedassuch.Theviewscontainedhereinarenottobetakenasadviceorarecommendationtobuyorsellanyinvestmentinanyjurisdiction,norisitacommitmentfromJ.P.Morganoranyofitssubsidiariestoparticipateinanyofthetransactionsmentionedherein.Anyforecasts,figures,opinionsorinvestmenttechniquesandstrategiessetoutareforinformationpurposesonly,basedoncertainassumptionsandcurrentmarketconditionsandaresubjecttochangewithoutpriornotice.Allinformationpresentedhereinisconsideredtobeaccurateatthetimeofproduction.Thismaterialdoesnotcontainsufficientinformationtosupportaninvestmentdecisionanditshouldnotberelieduponbyyouinevaluatingthemeritsofinvestinginanysecuritiesorproducts.Inaddition,usersshouldmakeanindependentassessmentofthelegal,regulatory,tax,creditandaccountingimplicationsanddetermine,togetherwiththeirownprofessionaladvisers,ifanyinvestmentmentionedhereinisbelievedtobesuitabletotheirpersonalgoals.Investorsshouldensurethattheyobtainallavailablerelevantinformationbeforemakinganyinvestment.Itshouldbenotedthatinvestmentinvolvesrisks,thevalueofinvestmentsandtheincomefromthemmayfluctuateinaccordancewithmarketconditionsandtaxationagreementsandinvestorsmaynotgetbackthefullamountinvested.Bothpastperformanceandyieldsarenotreliableindicatorsofcurrentandfutureresults.Non-affiliatedentitiesmentionedareforinformationalpurposesonlyandshouldnotbeconstruedasanendorsementorsponsorshipofJ.P.MorganChase&Co.oritsaffiliates.ForJ.P.MorganAssetManagementClients:J.P.MorganAssetManagementisthebrandfortheassetmanagementbusinessofJPMorganChase&Co.anditsaffiliatesworldwide.Totheextentpermittedbyapplicablelaw,wemayrecordtelephonecallsandmonitorelectroniccommunicationstocomplywithourlegalandregulatoryobligationsandinternalpolicies.Personaldatawillbecollected,storedandprocessedbyJ.P.MorganAssetManagementinaccordancewithourprivacypoliciesathttps://am.jpmorgan.com/global/privacy.ACCESSIBILITYForU.S.only:Ifyouareapersonwithadisabilityandneedadditionalsupportinviewingthematerial,pleasecallusat1-800-343-1113forassistance.Thiscommunicationisissuedbythefollowingentities:IntheUnitedStates,byJ.P.MorganInvestmentManagementInc.orJ.P.MorganAlternativeAssetManagement,Inc.,bothregulatedbytheSecuritiesandExchangeCommission;inLatinAmerica,forintendedrecipients’useonly,bylocalJ.P.Morganentities,asthecasemaybe.;inCanada,forinstitutionalclients’useonly,byJPMorganAssetManagement(Canada)Inc.,whichisaregisteredPortfolioManagerandExemptMarketDealerinallCanadianprovincesandterritoriesexcepttheYukonandisalsoregisteredasanInvestmentFundManagerinBritishColumbia,Ontario,QuebecandNewfoundlandandLabrador.IntheUnitedKingdom,byJPMorganAssetManagement(UK)Limited,whichisauthorizedandregulatedbytheFinancialConductAuthority;inotherEuropeanjurisdictions,byJPMorganAssetManagement(Europe)S.àr.l.InAsiaPacific(“APAC”),bythefollowingissuingentitiesandintherespectivejurisdictionsinwhichtheyareprimarilyregulated:JPMorganAssetManagement(AsiaPacific)Limited,orJPMorganFunds(Asia)Limited,orJPMorganAssetManagementRealAssets(Asia)Limited,eachofwhichisregulatedbytheSecuritiesandFuturesCommissionofHongKong;JPMorganAssetManagement(Singapore)Limited(Co.Reg.No.197601586K),whichthisadvertisementorpublicationhasnotbeenreviewedbytheMonetaryAuthorityofSingapore;JPMorganAssetManagement(Taiwan)Limited;JPMorganAssetManagement(Japan)Limited,whichisamemberoftheInvestmentTrustsAssociation,Japan,theJapanInvestmentAdvisersAssociation,TypeIIFinancialInstrumentsFirmsAssociationandtheJapanSecuritiesDealersAssociationandisregulatedbytheFinancialServicesAgency(registrationnumber“KantoLocalFinanceBureau(FinancialInstrumentsFirm)No.330”);inAustralia,towholesaleclientsonlyasdefinedinsection761Aand761GoftheCorporationsAct2001(Commonwealth),byJPMorganAssetManagement(Australia)Limited(ABN55143832080)(AFSL376919).ForallothermarketsinAPAC,tointendedrecipientsonly.ForJ.P.MorganPrivateBankClients:ACCESSIBILITYJ.P.Morganiscommittedtomakingourproductsandservicesaccessibletomeetthefinancialservicesneedsofallourclients.PleasedirectanyaccessibilityissuestothePrivateBankClientServiceCenterat1-866-265-1727.LEGALENTITY,BRAND®ULATORYINFORMATIONIntheUnitedStates,bankdepositaccountsandrelatedservices,suchaschecking,savingsandbanklending,areofferedbyJPMorganChaseBank,N.A.MemberFDIC.JPMorganChaseBank,N.A.anditsaffiliates(collectively“JPMCB”)offerinvestmentproducts,whichmayincludebank-managedinvestmentaccountsandcustody,aspartofitstrustandfiduciaryservices.Otherinvestmentproductsandservices,suchasbrokerageandadvisoryaccounts,areofferedthroughJ.P.MorganSecuritiesLLC(“JPMS”),amemberofFINRAandSIPC.AnnuitiesaremadeavailablethroughChaseInsuranceAgency,Inc.(CIA),alicensedinsuranceagency,doingbusinessasChaseInsuranceAgencyServices,Inc.inFlorida.JPMCB,JPMSandCIAareaffiliatedcompaniesunderthecommoncontrolofJPM.Productsnotavailableinallstates.InGermany,thismaterialisissuedbyJ.P.MorganSE,withitsregisteredofficeatTaunustor1(TaunusTurm),60310FrankfurtamMain,Germany,authorizedbytheBundesanstaltfürFinanzdienstleistungsaufsicht(BaFin)andjointlysupervisedbytheBaFin,theGermanCentralBank(DeutscheBundesbank)andtheEuropeanCentralBank(ECB).InLuxembourg,thismaterialisissuedbyJ.P.MorganSE–LuxembourgBranch,withregisteredofficeatEuropeanBankandBusinessCentre,6routedeTreves,L-2633,Senningerberg,Luxembourg,authorizedbytheBundesanstaltfürFinanzdienstleistungsaufsicht(BaFin)andjointlysupervisedbytheBaFin,theGermanCentralBank(DeutscheBundesbank)andtheEuropeanCentralBank(ECB);J.P.MorganSE–LuxembourgBranchisalsosupervisedbytheCommissiondeSurveillanceduSecteurFinancier(CSSF);registeredunderR.C.SLuxembourgB255938.IntheUnitedKingdom,thismaterialisissuedbyJ.P.MorganSE–LondonBranch,registeredofficeat25BankStreet,CanaryWharf,LondonE145JP,authorizedbytheBundesanstaltfürFinanzdienstleistungsaufsicht(BaFin)andjointlysupervisedbytheBaFin,theGermanCentralBank(DeutscheBundesbank)andtheEuropeanCentralBank(ECB);J.P.MorganSE–LondonBranchisalsosupervisedbytheFinancialConductAuthorityandPrudentialRegulationAuthority.InSpain,thismaterialisEYEONTHEMARKET•MICHAELCEMBALEST•J.P.MORGAN13thannualenergypaperMarch28,202351distributedbyJ.P.MorganSE,SucursalenEspaña,withregisteredofficeatPaseodelaCastellana,31,28046Madrid,Spain,authorizedbytheBundesanstaltfürFinanzdienstleistungsaufsicht(BaFin)andjointlysupervisedbytheBaFin,theGermanCentralBank(DeutscheBundesbank)andtheEuropeanCentralBank(ECB);J.P.MorganSE,SucursalenEspañaisalsosupervisedbytheSpanishSecuritiesMarketCommission(CNMV);registeredwithBankofSpainasabranchofJ.P.MorganSEundercode1567.InItaly,thismaterialisdistributedbyJ.P.MorganSE–MilanBranch,withitsregisteredofficeatViaCordusio,n.3,Milan20123,Italy,authorizedbytheBundesanstaltfürFinanzdienstleistungsaufsicht(BaFin)andjointlysupervisedbytheBaFin,theGermanCentralBank(DeutscheBundesbank)andtheEuropeanCentralBank(ECB);J.P.MorganSE–MilanBranchisalsosupervisedbyBankofItalyandtheCommissioneNazionaleperleSocietàelaBorsa(CONSOB);registeredwithBankofItalyasabranchofJ.P.MorganSEundercode8076;MilanChamberofCommerceRegisteredNumber:REAMI2536325.IntheNetherlands,thismaterialisdistributedbyJ.P.MorganSE–AmsterdamBranch,withregisteredofficeatWorldTradeCentre,TowerB,Strawinskylaan1135,1077XX,Amsterdam,TheNetherlands,authorizedbytheBundesanstaltfürFinanzdienstleistungsaufsicht(BaFin)andjointlysupervisedbytheBaFin,theGermanCentralBank(DeutscheBundesbank)andtheEuropeanCentralBank(ECB);J.P.MorganSE–AmsterdamBranchisalsosupervisedbyDeNederlandscheBank(DNB)andtheAutoriteitFinanciëleMarkten(AFM)intheNetherlands.RegisteredwiththeKamervanKoophandelasabranchofJ.P.MorganSEunderregistrationnumber72610220.InDenmark,thismaterialisdistributedbyJ.P.MorganSE–CopenhagenBranch,filialafJ.P.MorganSE,Tyskland,withregisteredofficeatKalvebodBrygge39-41,1560KøbenhavnV,Denmark,authorizedbytheBundesanstaltfürFinanzdienstleistungsaufsicht(BaFin)andjointlysupervisedbytheBaFin,theGermanCentralBank(DeutscheBundesbank)andtheEuropeanCentralBank(ECB);J.P.MorganSE–CopenhagenBranch,filialafJ.P.MorganSE,TysklandisalsosupervisedbyFinanstilsynet(DanishFSA)andisregisteredwithFinanstilsynetasabranchofJ.P.MorganSEundercode29010.InSweden,thismaterialisdistributedbyJ.P.MorganSE–StockholmBankfilial,withregisteredofficeatHamngatan15,Stockholm,11147,Sweden,authorizedbytheBundesanstaltfürFinanzdienstleistungsaufsicht(BaFin)andjointlysupervisedbytheBaFin,theGermanCentralBank(DeutscheBundesbank)andtheEuropeanCentralBank(ECB);J.P.MorganSE–StockholmBankfilialisalsosupervisedbyFinansinspektionen(SwedishFSA);registeredwithFinansinspektionenasabranchofJ.P.MorganSE.InFrance,thismaterialisdistributedbyJPMCB,Parisbranch,whichisregulatedbytheFrenchbankingauthoritiesAutoritédeContrôlePrudentieletdeRésolutionandAutoritédesMarchésFinanciers.InSwitzerland,thismaterialisdistributedbyJ.P.Morgan(Suisse)SA,withregisteredaddressatruedelaConfédération,8,1211,Geneva,Switzerland,whichisauthorisedandsupervisedbytheSwissFinancialMarketSupervisoryAuthority(FINMA),asabankandasecuritiesdealerinSwitzerland.PleaseconsultthefollowinglinktoobtaininformationregardingJ.P.Morgan’sEMEAdataprotectionpolicy:https://www.jpmorgan.com/privacy.InHongKong,thismaterialisdistributedbyJPMCB,HongKongbranch.JPMCB,HongKongbranchisregulatedbytheHongKongMonetaryAuthorityandtheSecuritiesandFuturesCommissionofHongKong.InHongKong,wewillceasetouseyourpersonaldataforourmarketingpurposeswithoutchargeifyousorequest.InSingapore,thismaterialisdistributedbyJPMCB,Singaporebranch.JPMCB,SingaporebranchisregulatedbytheMonetaryAuthorityofSingapore.DealingandadvisoryservicesanddiscretionaryinvestmentmanagementservicesareprovidedtoyoubyJPMCB,HongKong/Singaporebranch(asnotifiedtoyou).BankingandcustodyservicesareprovidedtoyoubyJPMCBSingaporeBranch.ThecontentsofthisdocumenthavenotbeenreviewedbyanyregulatoryauthorityinHongKong,Singaporeoranyotherjurisdictions.Youareadvisedtoexercisecautioninrelationtothisdocument.Ifyouareinanydoubtaboutanyofthecontentsofthisdocument,youshouldobtainindependentprofessionaladvice.FormaterialswhichconstituteproductadvertisementundertheSecuritiesandFuturesActandtheFinancialAdvisersAct,thisadvertisementhasnotbeenreviewedbytheMonetaryAuthorityofSingapore.JPMorganChaseBank,N.A.isanationalbankingassociationcharteredunderthelawsoftheUnitedStates,andasabodycorporate,itsshareholder’sliabilityislimited.WithrespecttocountriesinLatinAmerica,thedistributionofthismaterialmayberestrictedincertainjurisdictions.Wemayofferand/orselltoyousecuritiesorotherfinancialinstrumentswhichmaynotberegisteredunder,andarenotthesubjectofapublicofferingunder,thesecuritiesorotherfinancialregulatorylawsofyourhomecountry.Suchsecuritiesorinstrumentsareofferedand/orsoldtoyouonaprivatebasisonly.Anycommunicationbyustoyouregardingsuchsecuritiesorinstruments,includingwithoutlimitationthedeliveryofaprospectus,termsheetorotherofferingdocument,isnotintendedbyusasanoffertosellorasolicitationofanoffertobuyanysecuritiesorinstrumentsinanyjurisdictioninwhichsuchanofferorasolicitationisunlawful.Furthermore,suchsecuritiesorinstrumentsmaybesubjecttocertainregulatoryand/orcontractualrestrictionsonsubsequenttransferbyyou,andyouaresolelyresponsibleforascertainingandcomplyingwithsuchrestrictions.Totheextentthiscontentmakesreferencetoafund,theFundmaynotbepubliclyofferedinanyLatinAmericancountry,withoutpreviousregistrationofsuchfund’ssecuritiesincompliancewiththelawsofthecorrespondingjurisdiction.Publicofferingofanysecurity,includingthesharesoftheFund,withoutpreviousregistrationatBrazilianSecuritiesandExchangeCommission—CVMiscompletelyprohibited.SomeproductsorservicescontainedinthematerialsmightnotbecurrentlyprovidedbytheBrazilianandMexicanplatforms.JPMorganChaseBank,N.A.(JPMCBNA)(ABN43074112011/AFSLicenceNo:238367)isregulatedbytheAustralianSecuritiesandInvestmentCommissionandtheAustralianPrudentialRegulationAuthority.MaterialprovidedbyJPMCBNAinAustraliaisto“wholesaleclients”only.Forthepurposesofthisparagraphtheterm“wholesaleclient”hasthemeaninggiveninsection761GoftheCorporationsAct2001(Cth).PleaseinformusifyouarenotaWholesaleClientnoworifyouceasetobeaWholesaleClientatanytimeinthefuture.JPMorganChaseBank,N.A.(JPMCBNA)(ABN43074112011/AFSLicenceNo:238367)isregulatedbytheAustralianSecuritiesandInvestmentCommissionandtheAustralianPrudentialRegulationAuthority.MaterialprovidedbyJPMCBNAinAustraliaisto“wholesaleclients”only.Forthepurposesofthisparagraphtheterm“wholesaleclient”hasthemeaninggiveninsection761GoftheCorporationsAct2001(Cth).PleaseinformusifyouarenotaWholesaleClientnoworifyouceasetobeaWholesaleClientatanytimeinthefuture.JPMSisaregisteredforeigncompany(overseas)(ARBN109293610)incorporatedinDelaware,U.S.A.UnderAustralianfinancialserviceslicensingrequirements,carryingonafinancialservicesbusinessinAustraliarequiresafinancialserviceprovider,suchasJ.P.MorganSecuritiesLLC(JPMS),toholdanAustralianFinancialServicesLicence(AFSL),unlessanexemptionapplies.JPMSisexemptfromtherequirementtoholdanAFSLundertheCorporationsAct2001(Cth)(Act)inrespectoffinancialservicesitprovidestoyou,andisregulatedbytheSEC,FINRAandCFTCunderU.S.laws,whichdifferfromAustralianlaws.MaterialprovidedbyJPMSinAustraliaisto“wholesaleclients”only.Theinformationprovidedinthismaterialisnotintendedtobe,andmustnotbe,distributedorpassedon,directlyorindirectly,toanyotherclassofpersonsinAustralia.Forthepurposesofthisparagraphtheterm“wholesaleclient”hasthemeaninggiveninsection761GoftheAct.PleaseinformusimmediatelyifyouarenotaWholesaleClientnoworifyouceasetobeaWholesaleClientatanytimeinthefuture.ThismaterialhasnotbeenpreparedspecificallyforAustralianinvestors.It:•MaycontainreferencestodollaramountswhicharenotAustraliandollars;•MaycontainfinancialinformationwhichisnotpreparedinaccordancewithAustralianlaworpractices;•Maynotaddressrisksassociatedwithinvestmentinforeigncurrencydenominatedinvestments;and•DoesnotaddressAustraliantaxissues.EYEONTHEMARKET•MICHAELCEMBALEST•J.P.MORGAN13thannualenergypaperMarch28,2023MICHAELCEMBALESTistheChairmanofMarketandInvestmentStrategyforJ.P.MorganAsset&WealthManagement,agloballeaderininvestmentmanagementandprivatebankingwith$2.8trillionofclientassetsundermanagementworldwideasofDecember31,2022.Heisresponsibleforleadingthestrategicmarketandinvestmentinsightsacrossthefirm’sInstitutional,FundsandPrivateBankingbusinesses.Mr.CembalestisalsoamemberoftheJ.P.MorganAsset&WealthManagementInvestmentCommitteeandpreviouslyservedontheInvestmentCommitteefortheJ.P.MorganRetirementPlanforthefirm’smorethan256,000employees.Mr.CembalestwasmostrecentlyChiefInvestmentOfficerforthefirm’sGlobalPrivateBank,aroleheheldforeightyears.HewaspreviouslyheadofafixedincomedivisionofInvestmentManagement,withresponsibilityforhighgrade,highyield,emergingmarketsandmunicipalbonds.BeforejoiningAssetManagement,Mr.CembalestservedasheadstrategistforEmergingMarketsFixedIncomeatJ.P.MorganSecurities.Mr.CembalestjoinedJ.P.Morganin1987asamemberofthefirm’sCorporateFinancedivision.Mr.CembalestearnedanM.A.fromtheColumbiaSchoolofInternationalandPublicAffairsin1986andaB.A.fromTuftsUniversityin1984.


 VIP
VIP VIP
VIP VIP
VIP VIP
VIP VIP
VIP VIP
VIP VIP
VIP VIP
VIP VIP
VIP VIP
VIP