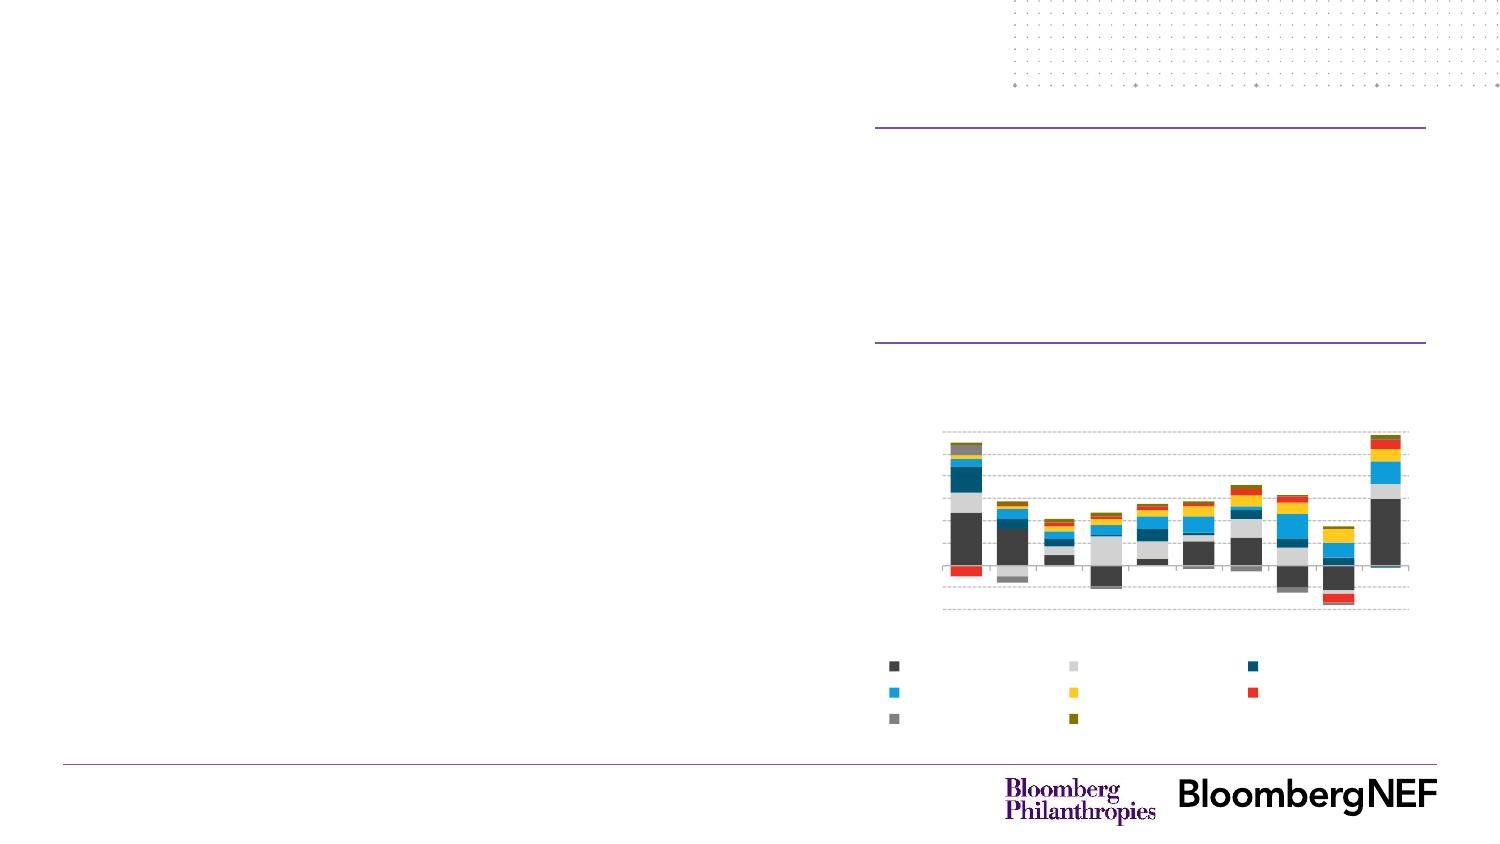
PowerTransitionTrends2022Coalpowerspikes,butprogressonrenewablesbringshopeSofiaMaiaLuizaDemôroSeptember21,20221September21,2022Theworldrecordedanunprecedentedspikeincoalgenerationin2021ascountriesturnedtoexistingfleetsoffossil-fueledpowerplantstomeetfast-growingpowerdemandandkeepthelightsonamiddroughtsandhighernaturalgasprices.However,renewabletechnologiesalsohadabanneryear,bothintermsofcontributionstoglobalgenerationandnewcapacityadded.Whatoccursoverthebalanceofthisdecadestandstobedecisiveindeterminingwhethertheworldachievesanet-zeroemissionspathandpolicymechanismstoaddresstoday’senergychallengeswillinfluencehowthatfutureunfolds.Thisannualreportexaminestrendsinglobalgeneration,capacityandemissions.Itaimstoillustratetopolicymakers,investorsandotherkeystakeholders,aheadofCOP27,thestateofthepowersectorgloballythroughyear-end2021.ItisbasedondatacollectedbyBloombergNEFanalystsonsixcontinentsfromprimarysourcesin136countriesandmarkets,alongwithaggregateddatafromtherestoftheworld.Keyfindingsinclude:●Theworldsawanunprecedentedspikeinglobalcoalgeneration2020-2021,withan8.5%jumpinpowerproductionfromthetechnology.GreatercoaluseboostedpowersectorCO2emissions7%in2021fromtheyearprior.●Threefactorscontributedtothecoalsurge:reboundingtop-lineelectricitydemandthankstoeconomicrecovery,lowerhydrogenerationduetodroughtsaroundtheworldandhighernaturalgasprices.HalfofthecountriesthatpledgedattheCOP26talkstophaseoutcoalrecordedgrowthincoalgenerationin2021.Executivesummary5.6%Growthinglobalpowerproductionin2020-20218.5%Spikeincoalgenerationin2020-202175%Windandsolar’sshareof2021capacityadditionsSource:BloombergNEFGlobalannualgenerationchangebytechnology585409-237271316-256-273750-500-25002505007501,0001,2501,5002012201320142015201620172018201920202021TWhCoalNaturalGasHydroWindSolarNuclearOther-fossilOtherrenewables2September21,2022Executivesummary(2)●LedbyAsia,totalglobalpowerproductionjumped5.6%in2021aseconomiesbouncedbackfromtheimpactsofCovid-19.Powergenerationspikedto27,300TWhfrom25,800TWhtosetanewhighfollowingthreeyearsofstableelectricitydemand.●Solarachievedanewmilestonein2021,clearing1,000TWhofgenerationforthefirsttime,whilewindneared2,000TWh.Together,thetechnologiesaccountedfor10.5%ofallpowerproducedworldwide.Inall,zero-carbongenerationtotaledover10,000TWhtomeetnearly40%ofglobalpowerdemand.●Windandsolaraccountedforthreequartersofthe364GWofnewcapacityinstalledin2021.Solaralonewashalfofallcapacityaddedandsolarannualbuildwas25%higherin2021thanin2020.Meanwhile,netgrowthincoalcapacitywasatitslowestinatleast15years.Inall,fossilfuelsaccountedforonly14%oftotalcapacityaddedintheyear.●Morecountriesthaneverareoptingtobuildrenewableenergy.In2021,overthreequartersoftheworld’snationssurveyedinstalledmorecleanpower(includinghydro)onacapacitybasisthananyothertechnology.Solarwasthetechnologyofchoiceinnearlyhalfoftheworld’snations.Hydrofollowedwith15%,downfrom20%adecadeearlier.●Solarisalsoquicklyspreadingtonewmarketsthoughdeploymentatscaleremainssomewhatconcentrated.In2021,thenumberofcountriesthatinstalledatleast1MWofsolarcapacityreachedanewhighof112markets–7.5timesthenumberofmarketsthataddedcoal.Thisisupfrom101marketsin2020andjust55in2012.●53economiesaddedsomewindcapacityin2021,upfrom44in2020.Still,cleanenergydeploymentatscaleremainsconcentrated.Tenmarketsaccountedfor85%ofsolarcapacityadded.Aseparate10werewhere89%of2021windgotbuilt.●Totalglobalpower-generatingcapacityhasnearlydoubledover15yearsandreachedanewhighat7.9TWin2021.TheAsia-Pacificregionhasledthecapacityboomwith191%growth2006-2021.Coalcontinuestoaccountforoveraquarteroftheglobalinstalledcapacity.3September21,2022Source:BloombergNEFGlobalannualgenerationbytechnologyTotalglobalpowerproductionjumped5.6%in2021aseconomiesreboundedfromtheworstoftheCovid-19pandemic.Generationspikedfrom25,800terawatt-hours(TWh)in2020to27,300TWhin2021.Thismarkedanewhighandcameontheheelsofthreeyearsofflatelectricitydemand.Coalledthegrowthwithan8.5%jumpfrom2020-2021.Totalglobalcoalgenerationreacheditshighestleveleverin2021at9,600TWh.Overtwothirdsofmarketswithsomecoalcapacityinstalled(52aroundtheworld)sawcoalgenerationgrow2020-2021.Bycomparison,from2019-2020coalusageroseinjust27markets.Globalsolargenerationreached1,000TWhforthefirsttime,whilewindneared2,000TWh.Allzero-carbonsourcesofgeneration(renewables,hydroandnuclear)totaledover10,000TWh,ornearly40%ofglobalpowerproduction.Generationfromnaturalgasandnuclearrose3%and4%,respectively,whilehydropower’scontributionslidby0.7%.Globalpowergenerationreboundedin20218.58.99.08.78.89.19.49.18.99.65.25.05.15.55.75.75.96.16.16.23.63.73.83.94.04.04.14.24.34.32.42.42.52.52.62.62.72.72.62.71.01.11.21.41.61.91.021.822.322.823.223.924.525.425.825.827.30510152025302012201320142015201620172018201920202021'000TWhCoalNaturalGasHydroNuclearWindSolarOil&DieselBiomass&WasteGeothermalOther-fossil4September21,2022Source:BloombergNEFGlobalannualgenerationbyregionorcountryTheAsia-Pacificregionledthespikeinglobalelectricityproductionwitha9%2020-21jump.Thankstoastrongeconomicrebound,Chinasawgenerationrise10.5%to8,200TWh.Thismarkeditslargestsingleyear-on-yearjumpinadecade.PowerproductioninAsia-Pacificmarkets(excludingChina)isnowgreaterthaninEuropeorNorthAmerica&Caribbean.Theseeconomiesaccountforthelargestgrowthinpowerproductionover10yearsandjumped6%2020-2021to5,500TWh.TheuptakewasledmainlybyIndia,SouthKorea,Malaysia,JapanandIndonesia,whichtogetherrepresented73%ofAsia’sex-Chinatotalgenerationgrowth.Central&SouthAmericaandEuropesawgenerationgrow5.6%and4.3%,respectively.MeanwhileinNorthAmerica&CaribbeanandAfrica,powerdemandhasremainedroughlyflat.Asiadrovethegenerationgrowth13.74.95.35.65.65.96.36.77.27.48.24.34.44.64.64.95.05.25.35.25.55.05.04.95.05.05.15.15.04.95.14.84.84.95.05.05.05.25.25.15.121.822.322.823.223.924.525.425.825.827.30510152025302012201320142015201620172018201920202021'000TWhChinaAsia-Pacific(excl.China)EuropeNorthAmerica&CaribbeanMiddleEastCentral&SouthAmericaAfrica5September21,2022Source:BloombergNEFShareofannualgenerationbyregionorcountryDemandforelectricityfromtheAsia-Pacificregionhasrisenswiftlyoverthepastdecadeandthecontinentnowaccountsforhalfofglobalgeneration.Chinaaloneaccountsfor30%oftheglobalpowergeneration.DemandinNorthAmericaandEuropehasdeclinedoveradecadeandtouchednewlowsin2021.NorthAmericaandEuropeaccountedfor19%eachoftheworld’selectricityproductionin2021,downfrom23%and22%,respectivelyin2020.TheMiddleEast,Central&SouthAmericaandAfricahavebroadlyheldtheirsharesofglobalgeneration,astherateofgrowthindemandinthesenationshasgenerallymatchedtheglobalgrowthrate.TheMideastandCentral&SouthAmericaaccountfor5%ofglobalelectricitygenerationeach,whileAfricarepresents3%.Asiaaccountsforhalfofglobalelectricitydemand50%23%24%24%24%25%26%27%28%29%30%20%20%20%20%20%20%21%20%20%20%23%22%22%21%21%21%20%19%19%19%22%22%21%21%21%20%21%20%20%19%4%4%5%5%5%5%5%5%5%5%5%5%5%5%5%5%5%5%5%5%2012201320142015201620172018201920202021ChinaAsia-Pacific(excl.China)EuropeNorthAmerica&CaribbeanMiddleEastCentral&SouthAmericaAfrica6September21,2022Source:BloombergNEFGlobalannualgenerationchangeForthefirsttimesince2013,coal-firedpowerplantswerethetopcontributortotop-linepowergenerationgrowth.Followingtwoyearsofdecline,coalgenerationjumped750TWhin2021andaccountedforoverhalfofallnetadditionalpowergeneration.Threefactorsexplainedthesurge:fast-growingpost-pandemicelectricitydemandoverall,depressedhydrogenerationduetodroughtsandhighernaturalgasprices.Anothercoalgenerationspikeispossiblein2022asEuropeannationsseekshort-termsolutionstocompensatefordroughtsandextremelyhighgasprices.Germanyhasthisyearreactivated4.8GWoffossilfuelpowerplants,including3.2GWofcoal-firedcapacity.Another5.5GWofcoalisexpectedonlinebyyear-end,alongwith4GWofnuclearcapacity.OtherEuropeancountriesareexpectedtofollowsimilarpaths.Coalaccountedforthemajorityofadditionalgenerationin2021585409109-237271316-256-27375029711613910410189226-11996326198205201158-124-94911057111813717727017026178118137126148143-50005001,0001,5002012201320142015201620172018201920202021TWhBiomass&WasteCoalGeothermalHydroNaturalGasNuclearOil&DieselOther-fossilWindSolar7September21,2022Source:BloombergNEFAnnualcoalgenerationchangeintopmarketsforcoalelectricitygrowthChina,IndiaandtheUSledthespikeincoalpowerproduction.Thesemarketssawcoalgenerationjump9%,16%and14%,respectively2020-2021.Coal’sreboundin2021cameaftermuch-celebrateddeclinesinpreviousyears.TheUS,Germany,NetherlandsandItalyareamongcountrieswherecoalelectricityhasbeentrendingdownsinceatleast2017.HalfofthecountriesthatpledgedtophaseoutcoalatCOP26recordedgrowthincoalgenerationin2021.InNovember2021,over40countriescommittedtoretirecoalcapacityandnearlyallworldnationspledgedtophasedownunabatedcoalplants.Still,manycountriestrendedintheoppositedirectionin2021.China,IndiaandtheUSledthecoalgenerationspike+395TWh+153TWh+110TWh+30TWh+29TWh+9TWh+7TWh+6TWh+5TWh+6TWh2020-2021coalgenerationchange-400-200020040060080020172018201920202021TWhChinaIndiaUSGermanyPolandIndonesiaAustraliaBrazilNetherlandsPhilippines8September21,2022Source:BloombergNEFTopcountriesforcoalgenerationTencountriesaccountedfor87%ofthetotalcoalpowerproducedgloballyin2021.Thiswasvirtuallyunchangedfrom2020.China,IndiaandtheUSaccountedtogetherfor63%.JapanandSouthKoreacompletedthetopfive,with3%and2%ofthetotal,respectively.Chinahasbeenthetopcoalgeneratorforatleastthelast15yearsandin2021wasresponsiblefor52%ofcoalgeneration,upfrom44%in2012.Itscoalpowerproductionhasconsistentlyincreasedsince2015andrecordeda9%jump2020-2021.Indiawasthesecondbiggestcoalgeneratorandwasresponsiblefor11%ofthetotal,or1,100TWhwiththeUSrightafterwith9%,or904TWh.Unlikeallothersinthetop10,theUShascutitscoalgenerationsharesincethebeginningofthedecade.In2012,theUSwas15%ofcoalgeneration;in2021,itwas9%.Over85%ofcoalgenerationoccursinjust10countries44%45%45%45%45%46%48%50%52%52%8%8%9%10%11%11%11%11%11%11%15%15%15%13%13%12%12%10%9%9%16%15%15%15%15%14%14%14%13%13%2012201320142015201620172018201920202021OthercountriesAustraliaRussiaGermanySouthAfricaIndonesiaSouthKoreaJapanUSIndiaChina9September21,2022Source:BloombergNEFLeadingnations’coalpenetrationratesTencountriesrelyoncoaltomeetat60%oftheirpowerdemand.Mongolialeads,withover90%ofitselectricitycomingfromcoal,followedbySouthAfricawith86%.Inbothnations,growthinwindandsolarusehasslowlyhelpedreducecoal’sshare.Kazakhstan,IndiaandPolandfollowwith79%,74%and73%,respectively.ThePhilippinesandIndonesiahasseentheirrelianceoncoalrisemostoverthepastdecade.Inbothnations,coalhasbeennearlytheonlysourcemeetingfast-growingdemand.Renewableshaveseenlimitedprogressbycomparison.Philippines’coalreliancespikedfrom39%in2012to59%in2021.InIndonesia,itjumped49%to61%overthesameperiod.Manymarketscontinuetorelyheavilyoncoal30%40%50%60%70%80%90%100%2012201320142015201620172018201920202021MongoliaSouthAfricaKazakhstanIndiaPolandMoroccoSerbiaIndonesiaChinaPhilippines10September21,2022PowersectorCO2emissionsrose7%in2021fromtheyearpriortosetanewrecord.Thiswasmainlyduetothejumpinyear-on-yearcoalgeneration.Emissionsfromcoal-firedpowerplantsrose8%in2021fromtheprioryear.Naturalgasemissionsalsoincreased4%comparedto2020.Thismarkedthebiggestyear-on-yearriseingas-relatedemissionssince2014-2015.Duetohighcoalgeneration,China,theUSandIndiaareresponsiblefor57%ofglobalpowersectoremissions.RussiaandJapanfollowfarbehindwith5%and3%,respectively.Whileemissionsremainedflatorslidslightly2019-2020inabsolutetermsinmostnations,inChinatheyrose1%in2020and9%in2021.Since2015,thecountryhasconsistentlyraiseditsshareoftotalglobalpowersectoremissions.Insixyears,China’spower-sectoremissionshavesoared28%overthelastsixyears.GlobalpowersectoremissionsbytechnologyGlobalpowersectoremissionsbycountryHighercoalgenerationboostedpowersectoremissions7%Source:BloombergNEFandNEO202002,0004,0006,0008,00010,00012,00014,00016,0002012201320142015201620172018201920202021MtCO2eCoalNaturalGasOil&Diesel30%31%31%31%31%32%33%34%36%36%15%15%15%14%14%13%13%13%12%12%6%6%7%7%8%8%8%8%8%8%6%6%6%6%6%6%6%6%5%5%5%5%5%4%4%4%4%4%4%3%38%37%37%37%38%37%36%36%36%35%2012201320142015201620172018201920202021ChinaUnitedStatesIndiaRussiaJapanOthercountries11September21,2022Source:BloombergNEFShareofglobalgenerationbytechnologyWithnearly3,000TWhofpowerproducedin2021,windandsolaraccountedforacombined10.5%of2021generation.Wind’scontributionroseto6.8%,upfromjust0.7%adecadeago,whilesolarreached3.7%upfromvirtuallynothingin2012.Non-hydrorenewables(wind,solar,geothermalandbiomass)reached13%oftotalgeneration,comparedto5%atthebeginningofthisdecade.Zero-carbontechnologiesaccountedfor39%oftotalgenerationin2021.Hydroandnuclearwere16%and10%respectivelyin2021,buttheparticipationofthesetechnologiesingridshasjustfluctuatedoverthedecade.Fossilfuelsremaintheworld’smainpowersourceandaccountedfor61%of2021globalgeneration.Coalremainedthetoptechnologyin2021at35%.Naturalgasfollowedwitha23%contribution.Windandsolarsurpassed10%ofglobalgenerationforthefirsttime39%40%39%38%37%37%37%35%34%35%24%23%23%24%24%23%23%24%24%23%17%17%17%17%17%16%16%16%17%16%11%11%11%11%11%11%10%11%10%10%4%4%5%5%6%6%7%3%3%4%2012201320142015201620172018201920202021CoalNaturalGasHydroNuclearWindSolarOil&DieselBiomass&WasteGeothermalOther-fossil12September21,2022Source:BloombergNEFLeadingnations’sharesofglobalsolargenerationWhilesolargenerationremainsconcentratedinarelativelysmallgroupofcountries,newleadershaveemergedoverthedecade.In2012,mostsolarpowerproductionwasconcentratedindevelopednations,butoverthedecadeithasgainedmomentuminagrowinganddiversenumberofnations.In2012,only33countrieshadsolargenerationabove20GWh.By2021,thishadmorethantripledto118countries.AthirdofglobalsolargenerationoccurredinChinain2021.TheUS,JapanandIndiafollowedwith11%,9%and7%,respectively.Vietnam,MexicoandBrazilareotheremergingmarketsthathaveseensolargenerationgrowoverpastfewyears.Together,theyaccountedfor6%of2021globalsolargeneration.Solarisconcentratedinasmallnumberofmarkets,butothersaregrowing27%23%19%15%12%9%8%7%6%5%19%16%12%9%7%6%4%3%2%3%12%9%7%5%4%3%3%7%11%13%14%14%13%11%10%10%9%9%12%15%15%17%17%17%15%15%11%5%4%3%3%3%4%6%13%16%20%26%30%32%30%33%3%3%3%3%4%6%6%7%7%7%9%10%10%12%12%11%11%13%14%14%2012201320142015201620172018201920202021OthercountriesUKTurkeyBrazilVietnamMexicoSouthKoreaIndiaAustraliaChinaFranceUSJapanSpainItalyGermany13September21,2022Source:BloombergNEFGlobalinstalledcapacitybytechnologyGlobalinstalledpower-generatingcapacityreachedanewhighin2021of7.9TW,nearlydoublethe4TWinstalled15yearsago.From2020to2021,capacitygrew4.8%,thebiggestincreasesince2015-2016.Windandsolargrewfastest.SolarPVcapacityjumped23%2020-2021to973GWin2021.Thatismorethanninetimesthe103GWthatwasonlinein2012and139timesthe7GWthatwasinstalledin2006.Globalwindcapacityjumped12%2020-2021to833GW.Totalwindcapacityinstalledhasnearlytripledinadecade.Weexpectwindandsolartoaccountforoveraquarterglobalcapacitybytheendof2022.Together,thesetechnologieswere23%ofglobalcapacityasofyear-end2021.Zero-carbontechnologiesreached45%ofglobalcapacity,upfromjust11%in2012.Coalstillaccountsforthelargestindividualshareofglobalcapacity.Coalcapacityonlinecontinuestoriseevenasitsshareonpercentagebasisdeclines.Totalinstalledcapacityhasnearlydoubledin15years1.21.31.41.41.51.61.71.71.81.91.92.02.02.12.12.11.11.21.21.31.31.41.41.51.51.61.61.71.71.81.81.80.80.80.80.90.90.91.01.01.01.11.11.11.11.21.21.20.40.40.50.50.60.60.70.80.30.40.50.70.81.04.04.24.34.54.85.05.35.55.86.06.46.66.97.27.57.90123456782006200720082009201020112012201320142015201620172018201920202021TWCoalNaturalGasHydroOther-fossilWindSolarNuclearOil&DieselBiomass&WasteGeothermal14September21,2022Source:BloombergNEFGlobalinstalledcapacitybyregionTheAsia-Pacific’spower-generatingcapacityhasnearlytripledinadecadeandahalf.Inabsolutenumbers,APAC’stotalinstalledcapacityjumpedfrom1.3TWin2006to3.8TWin2021.Laos,CambodiaandVietnamallrecordedimpressiveexpansionsoftheirpowermatrices,withgrowthratesrangingfrom528%toover1,100%since2006.Africafollowedwitha123%jumpovertheperiod.In2021,thecontinentreached249GWofcapacity,upfrom111GWin2006,Angola,EthiopiaandRwandaareamongtheAfricannationsthatsawtheirinstalledcapacitygrowmostovertheperiod.EuropeandNorthAmericaweretheregionsthathavegrownleastsince2006.Theseregionssawtheirpowermatrixesgrowbyjust40%and44%,respectively.AsiaandAfrica’scapacityhasgrownfastestinthepast15years+191%2006-2021growth:+44%+40%+123%+117%+90%1.31.41.51.71.81.92.02.22.42.62.83.03.13.33.63.81.11.11.11.21.21.21.21.31.31.31.41.41.41.51.51.61.11.11.21.21.31.31.31.41.41.41.41.41.41.51.51.60.40.30.24.04.24.34.54.85.05.35.55.86.06.46.66.97.27.57.90123456782006200720082009201020112012201320142015201620172018201920202021TWAfricaMiddleEastCentral&SouthAmericaEuropeNorthAmerica&CaribbeanAsia-Pacific15September21,2022Source:BloombergNEFShareofglobalinstalledcapacitybyregionorcountry2021reaffirmedtheAsia-Pacificregion’sroleintheglobalpowermixandtheregionnowishometo49%ofglobalinstalledcapacity.Asofyear-end2021,APACtotaled3.8TWinstalled,withChinaaccountingalonefor30%ofthetotalglobal.Thecountry’scapacityhasmorethandoubledoveradecade,from1.1TWin2012to2.3TWin2021.ApartfromAsia,allotherregionsbroadlyheldtheirshares2020-2021withEuropeandNorthAmericaremainingthesecondlargestregionsforinstalledcapacity,accountingfor20%each.However,thesewerealsotheonlytworegionstoseetheirsharesofcapacitydropsharplysince2006,wheneachaccountedfor27%ofglobalcapacity.Despitebeinghometo16%oftheworld’spopulation,Africahasjust3%ofinstalledglobalcapacity.Thissharehasremainedstableoverthepast15years.Asiaishometonearlyhalfofglobalinstalledcapacity49%15%16%18%19%20%21%22%22%24%25%25%26%27%28%29%30%18%18%18%17%17%17%17%18%18%18%18%18%18%19%19%19%28%27%27%26%26%26%25%25%24%23%22%21%21%21%20%20%27%27%26%25%24%24%23%23%22%22%21%21%21%20%20%20%5%5%5%5%5%5%5%5%5%5%5%5%5%5%5%5%4%4%4%4%5%5%5%5%5%5%5%5%5%5%4%4%2006200720082009201020112012201320142015201620172018201920202021ChinaAsia-Pacific(excl.China)EuropeNorthAmerica&CaribbeanCentral&SouthAmericaMiddleEast16September21,2022FossilfuelsdominateAfrica’spowermatrixwithnaturalgasaccountingfor41%capacityinstalled,followedbycoalwith22%.Renewables(includinglargehydro)haveconsistentlygrownoverthedecadeandnowaccountfor23%ofthecontinent’stotalcapacity.Solarjumpedfromjust0.3GWin2012to14GWin2021,whilewindgrewfrom1.2GWto8GWovertheperiod.Africa’stotalinstalledcapacityisheavilyconcentratedinfivecountries,whicharealsohometofiveofthesixhighestelectrificationratesonthecontinent.SouthAfrica,Egypt,Algeria,NigeriaandMoroccoaccountfor69%oftheregion’spowermatrixat172GW.SolarhasthepotentialtocloseAfrica’selectrificationrategapasaroundthreequartersoftheSub-SaharanAfrica(SSA)populationstilllacksaccesstoreliableelectricity.BNEF’s2020NewEnergyOutlookprojectsthatsolarinSSAcouldreach55GWin2030andover400GWin2050.However,toallowPVtoflourish,financialandregulatorybarriersmustbeaddressed.AfricainstalledcapacitybytechnologyAfricainstalledcapacitybymarketFossilfuelspredominateinAfricabutareconcentratedinfivecountriesSource:BloombergNEF475154626977939810010244444546474952535455262727303031323235363032323133353031302910141531611671791912062232332422490501001502002503002012201320142015201620172018201920202021GWNaturalGasCoalHydroOil&DieselOther-fossilSolarWindNuclearBiomass&WasteGeothermal4646474952555759626329313236404655595960131516171919212222241212131314141414485053576064666974771531611671791912062232332422490501001502002503002012201320142015201620172018201920202021GWSouthAfricaEgyptAlgeriaNigeriaMoroccoOthercountries17September21,2022Source:BloombergNEF.Note:Shareofglobalcapacityadditionsexcludingretirements.ShareofglobalcapacityadditionsbytechnologyNewpower-generatingcapacityaddedgloballysetanewrecordin2021at364GW.Thiswasup7%from339GWin2020,andup41%from257GWaddedin2012.Solarwas50%ofallcapacityadded,followedbywindat25%.PVadditionsin2021were25.5%largerthanthosein2020.Windsawa7.5%declinecomparedtotheyearprior.Renewables(includinghydro)comprised85%oftotalcapacityadditions.Thiswasupfromjust46%in2012.Coal’scontributiontoyear-on-yeargrowthwaslowestat4%.Naturalgasaccountedfor11%ofnewcapacityin2021,upfrom8%in2020.Solarwashalfofallcapacityinstalledin202146%36%30%29%35%32%22%25%25%27%17%10%18%9%4%21%21%28%31%15%20%22%21%16%13%18%23%12%8%11%14%17%13%10%13%13%20%13%11%11%6%6%8%7%10%16%19%15%17%18%14%18%22%17%19%17%22%29%25%4%4%7%12%12%17%17%20%25%36%36%41%43%50%200720082009201020112012201320142015201620172018201920202021CoalNaturalGasHydroWindSolarNuclearOil&DieselBiomass&WasteOther-fossilGeothermal18September21,2022Together,windandsolaraccountedfor75%ofcapacityaddedgloballyin2021.Netadditionsofthesetechnologiestotaled272GW,upfrom77GWin2012whentheywere30%ofthetotal.Steepdropsincostshavespurredthemassivegrowthofthesetechnologies.Windandsolararenowthecheapestsourcesofnewbulkpowergenerationincountriesthatmakeuptwo-thirdsofworldpopulationandthree-quartersofglobalGDP.Fossilfuels’netcapacityadditionsasashareofallnewbuildslumpedtotheirlowestleveleverin2021at14%.Coalledthedecline.Itslidto13GWaddedcomparedto82GWin2012and52MWin2019.Naturalgaswasthetopfossilfueladdedin2021,accountingfor11%oftotalbuild,up41%from2020.GlobalshareofnetcapacityadditionsGlobalyear-on-yearcapacitychangeWindandsolarwerethreequartersofallcapacityaddedgloballyin2021Source:BloombergNEFAllrenewablesWind&solarFossilfuels75%14%86%0%20%40%60%80%100%20122013201420152016201720182019202020218355677082482952315255564639506834273934493631342727453349635352506297903242465675101107119145182-27-20801802803802012201320142015201620172018201920202021GWCoalNaturalGasHydroWindSolarNuclearOil&DieselBiomass&WasteOther-fossilGeothermal19September21,2022Developedcountriesshuttered21GWofcoalcapacityin2021,themosteverinasingleyear.Fossilfuels’netadditionsindevelopedcountriescollapsedin2021,totalingjust3%ofnewbuildcomparedto30%asrecentlyas2017.Naturalgasaccountedforjust3GW,comparedto12GWin2020.Developednationscouldseecoalretirementsslowin2022.AsEuropeannationshavestruggledwithdroughtsandgassupplycutsfromRussia,coalhasbecomeashort-termcrutchtomeetenergyneeds.Asresult,manynationshavedelayedcoalphase-outplansandevenrestartedcapacitythathadbeenmothballed.Acrossalltechnologies,arecord86GWofnewcapacitywasaddedinwealthynationsin2021.Windaccountedforthesecondmostaddedtechnologyat32GW.Renewables,includinghydro,totaled106GW.Developedmarkets’shareofnetcapacityadditionsDevelopedmarkets’year-on-yearcapacitychange2021wasarecordforcoalretirementsindevelopedmarketsSource:BloombergNEFWind&solarFossilfuels94%30%3%97%0%20%40%60%80%100%2012201320142015201620172018201920202021Allrenewables-11-9-8-11-2123201618101221211012-92514182419241924313225242630302733445871-29-40-200204060801001202012201320142015201620172018201920202021GWBiomass&WasteCoalGeothermalHydroNaturalGasOil&DieselOther-fossilWindSolarNuclear20September21,2022Developingmarketsadded70GWoffossilfuelcapacitytotheirgridsin2021.At34GW,coaladditionsdroppedtotheirlowestlevelever,butremainedsignificant.Netadditionsfromnaturalgasbouncedbackto36GWin2021,upfrom15GWtheyearprior.Withsolarandwindtakingthelead,developingmarketshaveaddedmorecapacitythanever.Thesenationssawa13%growthinnetadditionsinoneyearto278GWin2021.Solarsetanewrecordat111GW,27%morethanin2020.Windfollowedwith57GWaddedin2021.Developingmarkets’shareofnetcapacityadditionsDevelopingmarkets’year-on-yearcapacitychangeCoalandgaswereaquarterofcapacityadditionsindevelopingmarketsSource:BloombergNEFWind&solarAllrenewables62%26%74%0%20%40%60%80%100%2012201320142015201620172018201920202021Fossilfuels86667174875338614334323838362728462415364834293017172523202031383328303866571920264574747587111-2030801301802302802012201320142015201620172018201920202021GWCoalNaturalGasHydroWindSolarOil&DieselBiomass&WasteNuclearOther-fossilGeothermal21September21,2022Tencountrieswereresponsiblefor85%ofallsolarcapacityaddedin2021and80%ofallcapacityaddedover2012-2021.China,theUSandIndialedbothin2021andoverthepastdecade.Thethreenationsalonewere57%ofglobalcapacityadded2012-2021.Newsolarmarketsareemergingquicklyasenablingpolicyframeworksimprove.BrazilandVietnamaredevelopingnationswheresolarhasboomedinrecentyears.Brazil’snetmeteringpolicybrought10GWofdistributedPVcapacityonlinefrom2019through2021.Vietnam’sfeed-intariffledtonearly20GWofnewutility-scaleandsmall-scalesolar.Top10countriesforsolarcapacityadditions,2021Top10marketsforsolarcapacityadditions,2012-2021SolargrowthisconcentratedinalimitednumberofmarketsSource:BloombergNEF.Note:Graphsshownetcapacityadditions.68.624.512.47.26.45.95.14.64.43.9ChinaUSIndiaBrazilJapanGermanyAustraliaSpainSouthKoreaPolandGW3311157360352221201917ChinaUSJapanIndiaGermanyAustraliaSouthKoreaVietnamBrazilSpainGW22September21,2022Windinstallationsareconcentratedinarelativelysmallnumberofnations,withthetoptencountriesaccountingfor89%oftheglobalcapacityadditionsin2021.Chinaalonerepresented47%ofallwindbuildin2021and40%ofglobalcumulativewindinstalledcapacityasyear-end2021.TheUS,thesecondbiggestmarketforwind,accountedfor17%ofthetotaladdedin2021.Itinstalled15GWlastyear,8%lessthanin2020.Vietnamfollowedwith3.5GWin2021,representing4%ofallwindcapacityaddedintheyear.Top10countriesforwindcapacityadditions,2021Top10marketsforwindcapacityadditions,2012-202189%ofwindcapacityislocatedin10countriesSource:BloombergNEF.Note:Graphsshownetcapacityadditions.42.215.13.52.52.42.31.81.81.81.5ChinaUSVietnamSwedenGermanyBrazilTurkeyNetherlandsAustraliaIndiaGW27092352418171110109ChinaUSGermanyIndiaUKBrazilFranceSwedenTurkeyCanadaGW23September21,2022ChinaandIndiacontinuetoleadinthebuildingofnewcoal-firedpowergeneratingcapacity.Thetwocountriesaccountedfor83%ofnewcoaladditionsin2021.Chinaaloneadded414GWofcoal2012-2021,or62%ofthetotalglobal,whileIndiainstalled107GWoverthesameperiod.Despitethehighnumbers,bothnationsareslowingtheircoalbuild.China’s2021additionsrepresentedlessthanhalfofwhatthecountryinstalledatthebeginningofthedecadeanddropped18%fromwhatitinstalledin2020.SixotherAsianmarketsareamongtop10countriesforcoaladditionsin2021,representing14%ofthetotal.Vietnam,Philippines,Uzbekistan,Pakistan,IndonesiaandJapanaddedtogether5.7GWlastyear.Top10countriesforcoalcapacityadditions,2021Top10countriesforcoalcapacityadditions,2012-2021AsiamarketsdominatecoaladditionsSource:BloombergNEF.Note:Graphsshownetcapacityadditions.29.13.73.10.80.70.70.70.40.20.1ChinaIndiaVietnamSouthAfricaPhilippinesUzbekistanPakistanIndonesiaBulgariaJapanGW41410721211388766ChinaIndiaVietnamIndonesiaSouthKoreaTurkeySouthAfricaPhilippinesUkraineJapanGW24September21,2022Source:BloombergNEFCountrieswith>1MWinstalledperyear,2012-2021In2021,112countriesinstalledatleast1MWofsolarcapacity–anewhigh.Thatisup11%fromthe101nationsin2020andmorethandoublethe55countriesin2012.ThemodularnatureofPV,alongwithsteepequipmentpricedeclinesoveradecadeexplainthetechnology’sproliferation.Windalsoestablishedanewrecordandisnowthesecondmostpopulartechnology.53marketsaddedsomecapacityofthetechnologyin2021,upfrom44in2020.Morecountriesaddedoil,gasandcoalcapacityin2021thanin2020.Gaswasthefossilfueltechnologyinstalledinthegreatestnumberofcountries(42),followedbyoil(24)andcoal(15).Solarisquicklyspreadingtonewmarkets5548626968241125342473015020406080100120SolarWindGasHydroOilCoalNumberofmarkets25September21,2022Source:BloombergNEF.Note:Mapcoloredbywhichtechnologywasmostinstalledin2021alone.DepictsthepercentageofnationsthatinstalledthemostMWofeachtechnology.Itisbasedoncountry-leveldatafor136countriesbutexcludescountriesthathavenotrecordedanycapacityadditions.Solarincludessmall-scalePV.Mostpopularnewpower-generatingtechnologyinstalled,2021Renewableswerethetopchoiceinthreequartersoftheworld’smarketsSolarWindHydroGeothermalBiomassCoalGasOilNuclearNoadditionsavailable2012202124%20%16%14%13%8%4%Morecountriesthaneveraremakingrenewableenergytechnologiestheirtopchoice.In2021,78%oftheworld’snationsinstalledmorecleanpower(includinghydro)thanfossil-fueledpower.Thatisupfrom50%in2012.Solarwasthetechnologyofchoiceinnearlyhalftheworld’snations.In2021,48%ofcountriessurveyedmadesolartheirtopchoice.Hydrofollowedwith15%,downfrom20%adecadeearlier.In2012,49%oftheworld’snationsaddedmorefossilfueltechnologiesthananyotherpowersource.By2021,thathadfallento21%.Onlyonecountrymadecoalitstopchoicein2021:thePhilippines.48%15%13%13%8%26September21,2022Copyright©BloombergFinanceL.P.2022.ThispublicationisthecopyrightofBloombergFinanceL.P.inconnectionwithBloombergNEF.Noportionofthisdocumentmaybephotocopied,reproduced,scannedintoanelectronicsystemortransmitted,forwardedordistributedinanywaywithoutpriorconsentofBloombergNEF.DisclaimerTheBloombergNEF("BNEF"),service/informationisderivedfromselectedpublicsources.BloombergFinanceL.P.anditsaffiliates,inprovidingtheservice/information,believethattheinformationitusescomesfromreliablesources,butdonotguaranteetheaccuracyorcompletenessofthisinformation,whichissubjecttochangewithoutnotice,andnothinginthisdocumentshallbeconstruedassuchaguarantee.Thestatementsinthisservice/documentreflectthecurrentjudgmentoftheauthorsoftherelevantarticlesorfeatures,anddonotnecessarilyreflecttheopinionofBloombergFinanceL.P.,BloombergL.P.oranyoftheiraffiliates(“Bloomberg”).Bloombergdisclaimsanyliabilityarisingfromuseofthisdocument,itscontentsand/orthisservice.NothinghereinshallconstituteorbeconstruedasanofferingoffinancialinstrumentsorasinvestmentadviceorrecommendationsbyBloombergofaninvestmentorotherstrategy(e.g.,whetherornotto“buy”,“sell”,or“hold”aninvestment).Theinformationavailablethroughthisserviceisnotbasedonconsiderationofasubscriber’sindividualcircumstancesandshouldnotbeconsideredasinformationsufficientuponwhichtobaseaninvestmentdecision.Youshoulddetermineonyourownwhetheryouagreewiththecontent.Thisserviceshouldnotbeconstruedastaxoraccountingadviceorasaservicedesignedtofacilitateanysubscriber’scompliancewithitstax,accountingorotherlegalobligations.Employeesinvolvedinthisservicemayholdpositionsinthecompaniesmentionedintheservices/information.Thedataincludedinthesematerialsareforillustrativepurposesonly.TheBLOOMBERGTERMINALserviceandBloombergdataproducts(the“Services”)areownedanddistributedbyBloombergFinanceL.P.(“BFLP”)except(i)inArgentina,AustraliaandcertainjurisdictionsinthePacificislands,Bermuda,China,India,Japan,KoreaandNewZealand,whereBloombergL.P.anditssubsidiaries(“BLP”)distributetheseproducts,and(ii)inSingaporeandthejurisdictionsservicedbyBloomberg’sSingaporeoffice,whereasubsidiaryofBFLPdistributestheseproducts.BLPprovidesBFLPanditssubsidiarieswithglobalmarketingandoperationalsupportandservice.Certainfeatures,functions,productsandservicesareavailableonlytosophisticatedinvestorsandonlywherepermitted.BFLP,BLPandtheiraffiliatesdonotguaranteetheaccuracyofpricesorotherinformationintheServices.NothingintheServicesshallconstituteorbeconstruedasanofferingoffinancialinstrumentsbyBFLP,BLPortheiraffiliates,orasinvestmentadviceorrecommendationsbyBFLP,BLPortheiraffiliatesofaninvestmentstrategyorwhetherornotto“buy”,“sell”or“hold”aninvestment.InformationavailableviatheServicesshouldnotbeconsideredasinformationsufficientuponwhichtobaseaninvestmentdecision.ThefollowingaretrademarksandservicemarksofBFLP,aDelawarelimitedpartnership,oritssubsidiaries:BLOOMBERG,BLOOMBERGANYWHERE,BLOOMBERGMARKETS,BLOOMBERGNEWS,BLOOMBERGPROFESSIONAL,BLOOMBERGTERMINALandBLOOMBERG.COM.AbsenceofanytrademarkorservicemarkfromthislistdoesnotwaiveBloomberg’sintellectualpropertyrightsinthatname,markorlogo.Allrightsreserved.©2022Bloomberg.CopyrightanddisclaimerBloombergNEF(BNEF)isastrategicresearchprovidercoveringglobalcommoditymarketsandthedisruptivetechnologiesdrivingthetransitiontoalow-carboneconomy.Ourexpertcoverageassessespathwaysforthepower,transport,industry,buildingsandagriculturesectorstoadapttotheenergytransition.Wehelpcommoditytrading,corporatestrategy,financeandpolicyprofessionalsnavigatechangeandgenerateopportunities.Clientenquiries:BloombergTerminal:press<Help>keytwiceEmail:support.bnef@bloomberg.netLearnmore:about.bnef.com@BloombergNEFSofiaMaiaLuizaDemôro


 VIP
VIP VIP
VIP VIP
VIP VIP
VIP VIP
VIP VIP
VIP VIP
VIP VIP
VIP VIP
VIP VIP
VIP