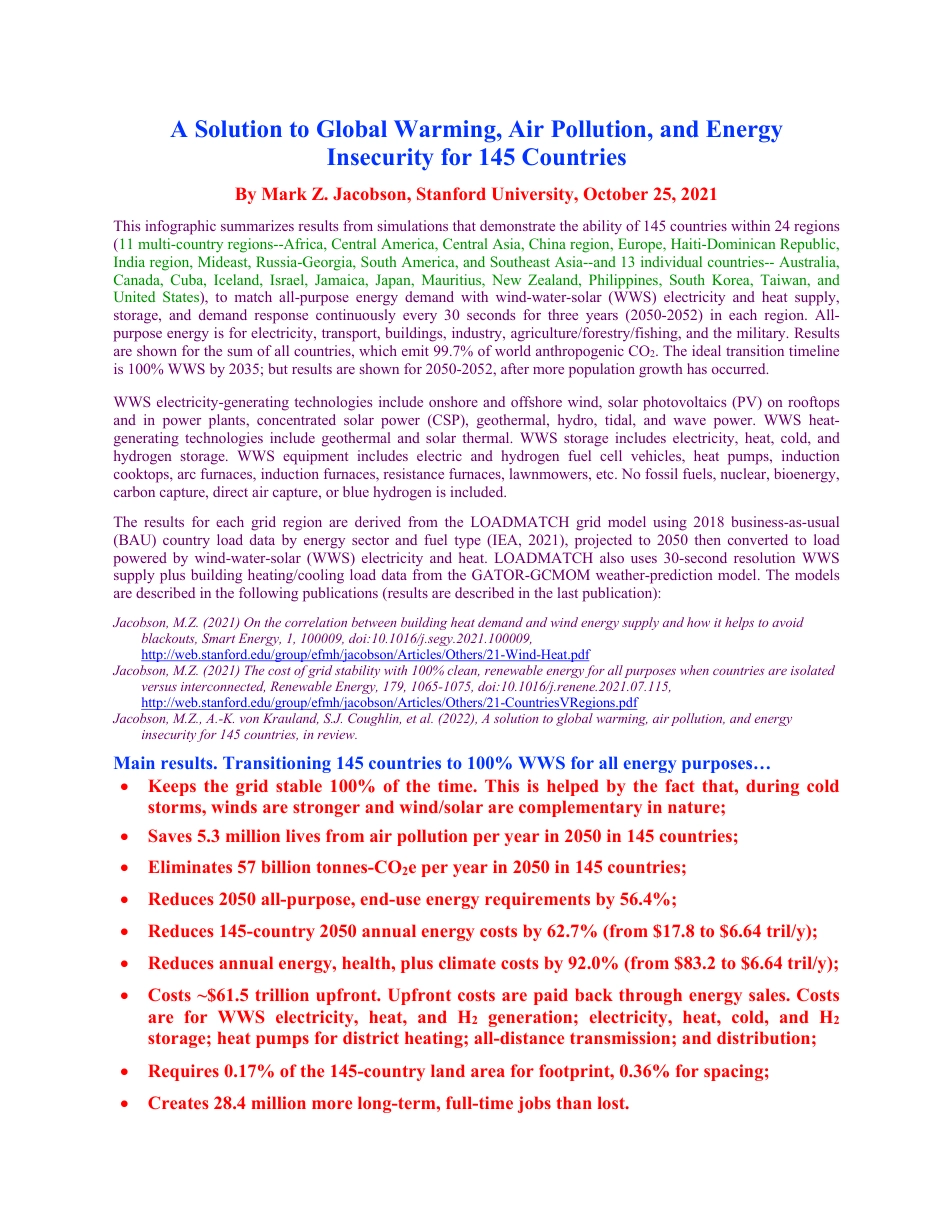
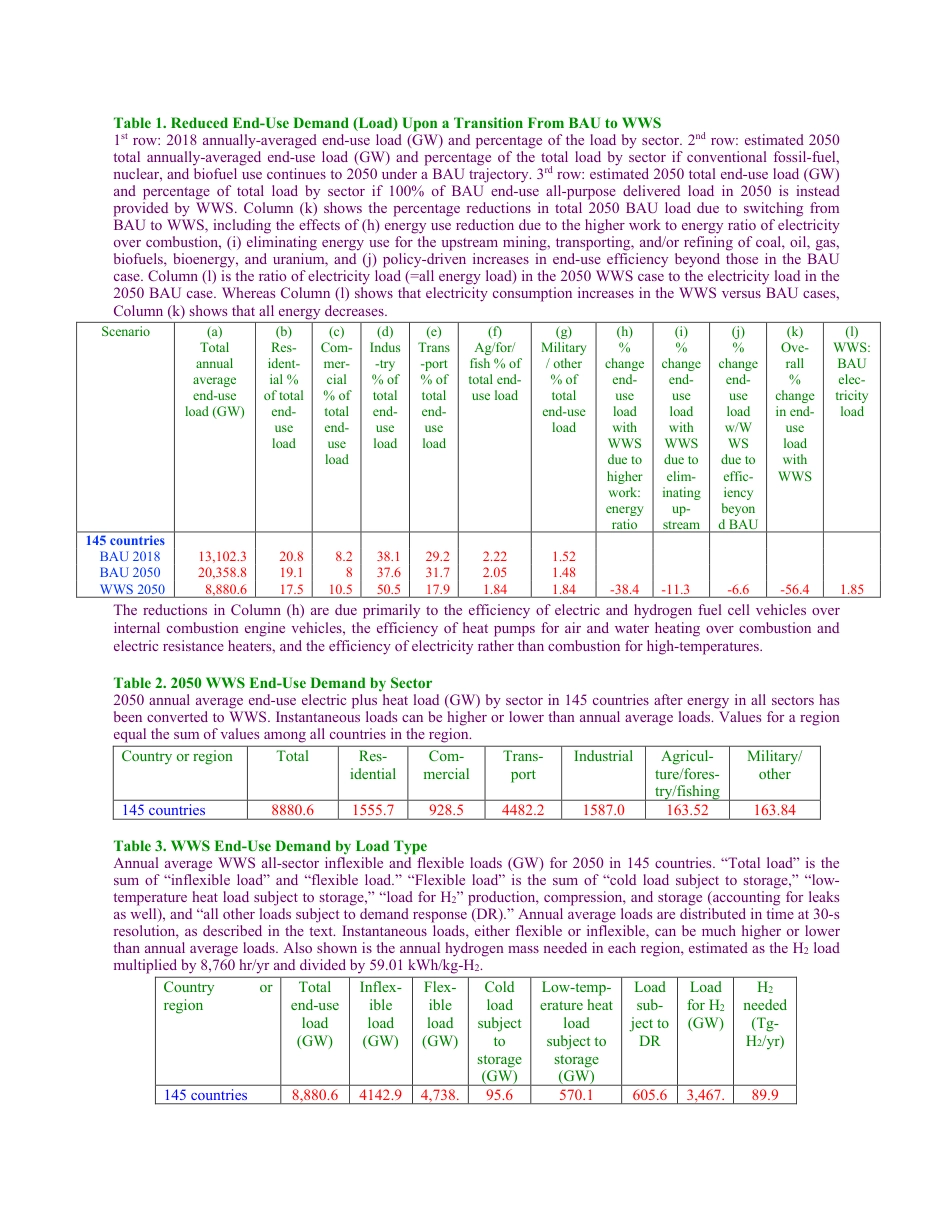
ASolutiontoGlobalWarming,AirPollution,andEnergyInsecurityfor145CountriesByMarkZ.Jacobson,StanfordUniversity,October25,2021Thisinfographicsummarizesresultsfromsimulationsthatdemonstratetheabilityof145countrieswithin24regions(11multi-countryregions--Africa,CentralAmerica,CentralAsia,Chinaregion,Europe,Haiti-DominicanRepublic,Indiaregion,Mideast,Russia-Georgia,SouthAmerica,andSoutheastAsia--and13individualcountries--Australia,Canada,Cuba,Iceland,Israel,Jamaica,Japan,Mauritius,NewZealand,Philippines,SouthKorea,Taiwan,andUnitedStates),tomatchall-purposeenergydemandwithwind-water-solar(WWS)electricityandheatsupply,storage,anddemandresponsecontinuouslyevery30secondsforthreeyears(2050-2052)ineachregion.All-purposeenergyisforelectricity,transport,buildings,industry,agriculture/forestry/fishing,andthemilitary.Resultsareshownforthesumofallcountries,whichemit99.7%ofworldanthropogenicCO2.Theidealtransitiontimelineis100%WWSby2035;butresultsareshownfor2050-2052,aftermorepopulationgrowthhasoccurred.WWSelectricity-generatingtechnologiesincludeonshoreandoffshorewind,solarphotovoltaics(PV)onrooftopsandinpowerplants,concentratedsolarpower(CSP),geothermal,hydro,tidal,andwavepower.WWSheat-generatingtechnologiesincludegeothermalandsolarthermal.WWSstorageincludeselectricity,heat,cold,andhydrogenstorage.WWSequipmentincludeselectricandhydrogenfuelcellvehicles,heatpumps,inductioncooktops,arcfurnaces,inductionfurnaces,resistancefurnaces,lawnmowers,etc.Nofossilfuels,nuclear,bioenergy,carboncapture,directaircapture,orbluehydrogenisincluded.TheresultsforeachgridregionarederivedfromtheLOADMATCHgridmodelusing2018business-as-usual(BAU)countryloaddatabyenergysectorandfueltype(IEA,2021),projectedto2050thenconvertedtoloadpoweredbywind-water-solar(WWS)electricityandheat.LOADMATCHalsouses30-secondresolutionWWSsupplyplusbuildingheating/coolingloaddatafromtheGATOR-GCMOMweather-predictionmodel.Themodelsaredescribedinthefollowingpublications(resultsaredescribedinthelastpublication):Jacobson,M.Z.(2021)Onthecorrelationbetweenbuildingheatdemandandwindenergysupplyandhowithelpstoavoidblackouts,SmartEnergy,1,100009,doi:10.1016/j.segy.2021.100009,http://web.stanford.edu/group/efmh/jacobson/Articles/Others/21-Wind-Heat.pdfJacobson,M.Z.(2021)Thecostofgridstabilitywith100%clean,renewableenergyforallpurposeswhencountriesareisolatedversusinterconnected,RenewableEnergy,179,1065-1075,doi:10.1016/j.renene.2021.07.115,http://web.stanford.edu/group/efmh/jacobson/Articles/Others/21-CountriesVRegions.pdfJacobson,M.Z.,A.-K.vonKrauland,S.J.Coughlin,etal.(2022),Asolutiontoglobalwarming,airpollution,andenergyinsecurityfor145countries,inreview.Mainresults.Transitioning145countriesto100%WWSforallenergypurposes…•Keepsthegridstable100%ofthetime.Thisishelpedbythefactthat,duringcoldstorms,windsarestrongerandwind/solararecomplementaryinnature;•Saves5.3millionlivesfromairpollutionperyearin2050in145countries;•Eliminates57billiontonnes-CO2eperyearin2050in145countries;•Reduces2050all-purpose,end-useenergyrequirementsby56.4%;•Reduces145-country2050annualenergycostsby62.7%(from$17.8to$6.64tril/y);•Reducesannualenergy,health,plusclimatecostsby92.0%(from$83.2to$6.64tril/y);•Costs~$61.5trillionupfront.Upfrontcostsarepaidbackthroughenergysales.CostsareforWWSelectricity,heat,andH2generation;electricity,heat,cold,andH2storage;heatpumpsfordistrictheating;all-distancetransmission;anddistribution;•Requires0.17%ofthe145-countrylandareaforfootprint,0.36%forspacing;•Creates28.4millionmorelong-term,full-timejobsthanlost.TableofContentsTable1.ReducedEnd-UseDemandUponaTransitionFromBAUtoWWSTable2.2050WWSEnd-UseDemandbySectorTable3.WWSEnd-UseDemandbyLoadTypeTable4.NameplateCapacitiesNeededby2050andInstalledasof2020Table5.CapacityFactorsofWWSGeneratorsTable6.PercentofLoadMetbyDifferentWWSGeneratorsTable7.CharacteristicsofStorageResultinginMatchingDemandWith100%WWSSupplyTable8.SummaryofEnergyBudgetResultinginGridStabilityTable9.DetailsofEnergyBudgetResultinginGridStabilityTable10.BreakdownofEnergyCostsRequiredtoKeepGridStableTable11.Energy,Health,andClimateCostsofWWSVersusBAUTable12.AirPollutionMortalities,CarbonDioxideEmissions,andAssociatedCostsTable13.LandAreasNeededTable14.ChangesinEmploymentReferences.Table1.ReducedEnd-UseDemand(Load)UponaTransitionFromBAUtoWWS1strow:2018annually-averagedend-useload(GW)andpercentageoftheloadbysector.2ndrow:estimated2050totalannually-averagedend-useload(GW)andpercentageofthetotalloadbysectorifconventionalfossil-fuel,nuclear,andbiofuelusecontinuesto2050underaBAUtrajectory.3rdrow:estimated2050totalend-useload(GW)andpercentageoftotalloadbysectorif100%ofBAUend-useall-purposedeliveredloadin2050isinsteadprovidedbyWWS.Column(k)showsthepercentagereductionsintotal2050BAUloadduetoswitchingfromBAUtoWWS,includingtheeffectsof(h)energyusereductionduetothehigherworktoenergyratioofelectricityovercombustion,(i)eliminatingenergyusefortheupstreammining,transporting,and/orrefiningofcoal,oil,gas,biofuels,bioenergy,anduranium,and(j)policy-drivenincreasesinend-useefficiencybeyondthoseintheBAUcase.Column(l)istheratioofelectricityload(=allenergyload)inthe2050WWScasetotheelectricityloadinthe2050BAUcase.WhereasColumn(l)showsthatelectricityconsumptionincreasesintheWWSversusBAUcases,Column(k)showsthatallenergydecreases.Scenario(a)Totalannualaverageend-useload(GW)(b)Res-ident-ial%oftotalend-useload(c)Com-mer-cial%oftotalend-useload(d)Indus-try%oftotalend-useload(e)Trans-port%oftotalend-useload(f)Ag/for/fish%oftotalend-useload(g)Military/other%oftotalend-useload(h)%changeend-useloadwithWWSduetohigherwork:energyratio(i)%changeend-useloadwithWWSduetoelim-inatingup-stream(j)%changeend-useloadw/WWSduetoeffic-iencybeyondBAU(k)Ove-rall%changeinend-useloadwithWWS(l)WWS:BAUelec-tricityload145countriesBAU201813,102.320.88.238.129.22.221.52BAU205020,358.819.1837.631.72.051.48WWS20508,880.617.510.550.517.91.841.84-38.4-11.3-6.6-56.41.85ThereductionsinColumn(h)aredueprimarilytotheefficiencyofelectricandhydrogenfuelcellvehiclesoverinternalcombustionenginevehicles,theefficiencyofheatpumpsforairandwaterheatingovercombustionandelectricresistanceheaters,andtheefficiencyofelectricityratherthancombustionforhigh-temperatures.Table2.2050WWSEnd-UseDemandbySector2050annualaverageend-useelectricplusheatload(GW)bysectorin145countriesafterenergyinallsectorshasbeenconvertedtoWWS.Instantaneousloadscanbehigherorlowerthanannualaverageloads.Valuesforaregionequalthesumofvaluesamongallcountriesintheregion.CountryorregionTotalRes-identialCom-mercialTrans-portIndustrialAgricul-ture/fores-try/fishingMilitary/other145countries8880.61555.7928.54482.21587.0163.52163.84Table3.WWSEnd-UseDemandbyLoadTypeAnnualaverageWWSall-sectorinflexibleandflexibleloads(GW)for2050in145countries.“Totalload”isthesumof“inflexibleload”and“flexibleload.”“Flexibleload”isthesumof“coldloadsubjecttostorage,”“low-temperatureheatloadsubjecttostorage,”“loadforH2”production,compression,andstorage(accountingforleaksaswell),and“allotherloadssubjecttodemandresponse(DR).”Annualaverageloadsaredistributedintimeat30-sresolution,asdescribedinthetext.Instantaneousloads,eitherflexibleorinflexible,canbemuchhigherorlowerthanannualaverageloads.Alsoshownistheannualhydrogenmassneededineachregion,estimatedastheH2loadmultipliedby8,760hr/yranddividedby59.01kWh/kg-H2.CountryorregionTotalend-useload(GW)Inflex-ibleload(GW)Flex-ibleload(GW)Coldloadsubjecttostorage(GW)Low-temp-eratureheatloadsubjecttostorage(GW)Loadsub-jecttoDRLoadforH2(GW)H2needed(Tg-H2/yr)145countries8,880.64142.94,738.95.6570.1605.63,467.89.9Table4.NameplateCapacitiesNeededby2050andInstalledasof2020Final(fromLOADMATCH)2050total(existingplusnew)nameplatecapacity(GW)ofWWSgeneratorsneededtomatchpowerdemandwithsupply,storage,anddemandresponsecontinuouslyduring2050-2052in145countries.Alsogivenarenameplatecapacitiesalreadyinstalledasof2020end.Nameplatecapacityequalsthemaximumpossibleinstantaneousdischargerate.YearOnshorewindOff-shorewindResi-dentialroof-topPVComm/govtrooftopPVUtilityPVCSPwithstor-ageGeothermal-elec-tricityHydropowerWaveTidalSolarthermalGeothermalheat2020712.735.50141.2141.2423.66.4714.011,164.00060.53456.4107.720509,4304,4213,4225,91216,247419.797.31,16450.319.2456.4107.7Table5.CapacityFactorsofWWSGeneratorsSimulation-averaged2050-2052capacityfactors(percentofnameplatecapacityproducedaselectricitybeforetransmission,distributionormaintenancelosses)in145countries.Themeancapacityfactorsinthistableequalthesimulation-averagedpowersuppliedbyeachgeneratorineachregion(Table6)dividedbythenameplatecapacityofeachgeneratorineachregion(Table4).CountryorregionOn-shorewindOff-shorewindRooftopPVUtilityPVCSPwithstorageGeo-thermalelec-tricityHydropowerWaveTidalSolarthermalGeo-thermalheat145countries0.4010.3430.1960.2180.770.8870.4990.1820.2390.1080.54Capacityfactorsofoffshoreandonshorewindturbinesaccountforarraylosses(extractionofkineticenergybyturbines).Thesymbol“--“indicatesnoinstallationofthetechnology.RooftopPVpanelsarefixed-tiltattheoptimaltiltangleofthecountrytheyresidein;utilityPVpanelsarehalffixedoptimaltiltandhalfsingle-axishorizontaltracking.Table6.PercentofLoadMetbyDifferentWWSGeneratorsProjectedsimulation-averaged2050-2052all-sectorWWSenergysupplybeforetransmissionanddistributionlosses,storagelosses,orsheddinglosses,in145countries,andpercentofsupplymetbyeachgenerator,basedonLOADMATCHsimulations.Simulation-averagepowersupply(GW)equalsthesimulationtotalenergysupply(GWh/yr)dividedbythenumberofhoursofsimulation.Thepercentagesforeachregionaddto100%.Multiplyeachpercentagebythe2050totalsupplytoobtaintheGWsupplybyeachgenerator.DividetheGWsupplyfromeachgeneratorbyitscapacityfactor(Table5)toobtainthe2050nameplatecapacityofeachgeneratorneededtomeetthesupply(Table4).CountryorregionTotalWWSsupply(GW)On-shorewind(%)Off-shorewind(%)RoofPV(%)UtilityPV(%)CSPwithstor-age(%)Geothermalelec-tricity(%)Hydropower(%)Wave(%)Tidal(%)Solarther-malheat(%)Geo-ther-malheat(%)145countries11,77832.1012.8915.5630.032.730.734.930.0780.0390.4190.494Table7.CharacteristicsofStorageResultinginMatchingDemandWith100%WWSSupplyMaximumchargerates,dischargerate,storagecapacity,andhoursofstorageatthemaximumdischargerateofallelectricity,coldandheatstorageneededforsupplyplusstoragetomatchdemandin145countries.StoragetypeMaxchargerate(GW)Maxdischargerate(GW)Maxstoragecapacity(TWh)Maxstoragetimeatmaxdischargerate(hr)PHS1,0501,05014.7014CSP-elec.420420----CSP-PCM677--9.4722.6Batteries21,12921,12984.514Hydropower5211,1644,5673,925CW-STES38.338.30.53614ICE57.457.40.80314HW-STES2,0462,04614.437.1UTES-heat5622,049781.94382UTES-elec.2,178------PHS=pumpedhydropowerstorage;PCM=Phase-changematerials;CSP=concentratedsolarpower;CW-STES=Chilled-watersensibleheatthermalenergystorage;HW-STES=Hotwatersensibleheatthermalenergystorage;andUTES=Undergroundthermalenergystorage(eitherboreholes,waterpits,oraquifers).Thepeakenergystoragecapacityequalsthemaximumdischargeratemultipliedbythemaximumnumberofhoursofstorageatthemaximumdischargerate.Pumpedhydrostoragefor2050inacountryorregionisestimatedastheexisting(in2020)nameplatecapacityinthecountryorregionmultipliedbytheratioofexistingpluspendingcapacitytoexistingcapacityfor145countries(fromFERC,2021).Ifacountryhasnoexistinghydro,aminimumisimposedtoaccountfortheadditionofpumpedhydrobetween2021and2050.HeatcapturedinaworkingfluidbyaCSPsolarcollectorcaneitherbeusedimmediatelytoproduceelectricitybyevaporatingwaterandrunningitthroughasteamturbineconnectedtoagenerator,storedinaphase-changematerial,orboth.ThemaximumdirectCSPelectricityproductionrate(CSP-elec)equalsthemaximumelectricitydischargerate,whichequalsthenameplatecapacityofthegenerator.ThemaximumchargerateofCSPphase-changematerialstorage(CSP-PCM)issetto1.612multipliedbythemaximumelectricitydischargerate,whichallowsmoreenergytobecollectedthandischargeddirectlyaselectricity.Thus,sincethehigh-temperatureworkingfluidintheCSPplantcanbeusedtoproduceelectricityandchargestorageatthesametime,themaximumoverallelectricityproductionplusstoragechargerateofenergyis2.612multipliedbythemaximumdischargerate.Thisratioisalsotheratioofthemirrorsizewithstorageversuswithoutstorage.Thisratiocanbeupto3.2inexistingCSPplants.Themaximumenergystoragecapacityequalsthemaximumelectricitydischargeratemultipliedbythemaximumnumberofhoursofstorageatfulldischarge,setto22.6hours,or1.612multipliedbythe14hoursrequiredforCSPstoragetochargewhenchargingatitsmaximumrate.Hydropower’smaximumdischargeratein2050isits2020nameplatecapacity.Hydropowercanberechargedonlynaturallybyrainfallandrunoff,anditsannual-averagerechargerateapproximatelyequalsits2020annualenergyoutput(TWh/yr)dividedbythenumberofhoursperyear.Hydroisrechargedeachtimestepatthisrechargerate.Themaximumhydropowerenergystoragecapacityavailableinallreservoirsisalsoassumedtoequalhydro’s2020annualenergyoutput.Whereasthepresenttablegiveshydro’smaximumstoragecapacity,itsoutputfromstorageduringagiventimestepislimitedbythesmallestamongthreefactors:thecurrentenergyavailableinthereservoir,thepeakhydrodischargeratemultipliedbythetimestep,andtheenergyrequired.TheCW-STESpeakdischargerateissetequalto40%oftheannualaveragecoldload(forairconditioningandrefrigeration)subjecttostorage.TheICEstoragedischargerateissetto60%ofthesameannualaveragecoldloadsubjecttostorage.Thepeakchargerateissetequaltothepeakdischargerate.TheHW-STESpeakdischargerateissetequaltothemaximuminstantaneousheatloadsubjecttostorageduringany30-secondperiodofthetwo-yearsimulation.Thevalueshavebeenconvertedtoelectricityassumingtheelectricityproducesheatforheatpumpswithacoefficientofperformanceof4.Becausetheyarebasedonmaximumratherthantheannualaverageloads,theyarehigherthantheannual-averagelow-temperatureheatloadssubjecttostorageinTable3.Thepeakchargerateissetequaltothepeakdischargerate.UTESheatstoredinundergroundsoil(boreholestorage)orwater(waterpitoraquiferstorage)canbechargedwitheithersolarorgeothermalheatorexcesselectricity(assumingtheelectricityproducesheatwithanelectricheatpumpatacoefficientofperformanceof4).Themaximumchargerateofheat(convertedtoequivalentelectricity)toUTESstorage(UTES-heat)issettothenameplatecapacityofsolarthermalcollectorsdividedbythecoefficientofperformanceofaheatpump=4).Whennosolarthermalcollectorsareused,suchasinallsimulationshere,themaximumchargerateforUTES-heatiszero,andUTESischargedonlywithexcessgridelectricityrunningheatpumps.ThemaximumchargerateofUTESstorageusingexcessgridelectricity(UTES-elec.)issetequaltothemaximuminstantaneousheatloadsubjecttostorageduringany30-secondperiodofthetwo-yearsimulation.ThemaximumUTESheatdischargerateissetequaltothemaximuminstantaneousheatloadsubjecttostorage.Themaximumchargerate,dischargerate,andcapacityofUTESstorageareallinunitsofequivalentelectricitythatwouldgiveheatatacoefficientofperformanceof4.Table8.SummaryofEnergyBudgetResultinginGridStabilityBudgetofsimulation-averagedend-usepowerdemandmet,energylost,WWSenergysupplied,andchangesinstorage,summedoverthethree-year(26,291.4875hour)simulationsforall24worldregions(145countries).AllunitsareGWaveragedoverthesimulationsandarederivedfromthedatainTable9bydividingvaluesfromthetableinunitsofTWhpersimulationbythenumberofhoursofsimulation.TD&Mlossesaretransmission,distribution,andmaintenancelosses.Windturbinearraylossesarealreadyaccountedforinthe“WWSsupplybeforelosses”numbers,”sincewindsupplyvaluescomefromGATOR-GCMOM,whichaccountsforsuchlosses.Countryorregion(a)Annualaverageend-useload(GW)(b)TD&Mlosses(GW)(c)Storagelosses(GW)(d)Sheddinglosses(GW)(e)End-useload+losses=a+b+c+d(GW)(f)WWSsupplybeforelosses(GW)(g)Changesinstorage(GW)(h)Supply+changesinstorage=f+g(GW)145countries8,880.5771.2279.41,861.411,79311,778.414.111,793Table9.DetailsofEnergyBudgetResultinginGridStabilityBudgetoftotalend-useenergydemandmet,energylost,WWSenergysupplied,andchangesinstorage,summedoverthethree-year(26,291.4875hour)simulationsforall24gridregions(encompassing145countries).AllunitsareTWhoverthesimulation.Dividebythenumberofhoursofsimulationtoobtainsimulation-averagedpowervalues,whichareprovidedinTable8forkeyparameters.145countriesA1.Totalendusedemand233,482Electricityforelectricityinflexibledemand111,161Electricityforelectricity,heat,coldstorage+DR106,399ElectricityforH2directuse+H2storage15,921A2.Totalendusedemand233,482Electricityfordirectuse,electricitystorage,+H2218,616Low-Theatloadmetbyheatstorage14,397Coldloadmetbycoldstorage469A3.Totalendusedemand233,482Electricityfordirectuse,electricitystorage,DR200,059ElectricityforH2directuse+H2storage15,921Electricity+heatforheatsubjecttostorage14,988Electricityforcoldloadsubjecttostorage2,513B.Totallosses76,560Transmission,distribution,downtimelosses20,276LossesCSPstorage50LossesPHSstorage54Lossesbatterystorage2,835LossesCW-STES+ICEstorage85LossesHW-STESstorage1,852LossesUTESstorage2,471Lossesfromshedding48,938Netend-usedemandpluslosses(A1+B)310,042C.TotalWWSsupplybeforeT&Dlosses309,672Onshore+offshorewindelectricity139,318Rooftop+utilityPV+CSPelectricity149,616Hydropowerelectricity15,278Waveelectricity241Geothermalelectricity2,269Tidalelectricity121Solarheat1,298Geothermalheat1,531D.Nettakenfrom(+)oraddedto(-)storage370CSPstorage3.4819PHSstorage-0.9768Batterystorage7.9036CW-STES+ICEstorage0.1640HW-STESstorage8.1379UTESstorage288.0287H2storage63.2392Energysuppliedplustakenfromstorage(C+D)310,042End-usedemandsinA1,A2,A3shouldbeidentical.Generatedelectricityisshedwhenitexceedsthesumofelectricitydemand,coldstoragecapacity,heatstoragecapacity,andH2storagecapacity.OnshoreandoffshorewindturbinesinGATOR-GCMOM,usedtocalculatewindpoweroutputforuseinLOADMATCH,areassumedtobeSenvion(formerlyRepower)5MWturbineswith126-mdiameterblades,100mhubheights,acut-inwindspeedof3.5m/s,andacut-outwindspeedof30m/s.RooftopPVpanelsinGATOR-GCMOMweremodeledasfixed-tiltpanelsattheoptimaltiltangleofthecountrytheyresidedin;utilityPVpanelsweremodeledashalffixedoptimaltiltandhalfsingle-axishorizontaltracking.Allpanelswereassumedtohaveanameplatecapacityof390Wandapanelareaof1.629668m2,whichgivesa2050panelefficiency(WattsofpoweroutputperWattofsolarradiationincidentonthepanel)of23.9%,whichisanincreasefromthe2015valueof20.1%.EachCSPplantbeforestorageisassumedtohavethemirrorandlandcharacteristicsoftheIvanpahsolarplant,whichhas646,457m2ofmirrorsand2.17km2oflandper100MWnameplatecapacityandaCSPefficiency(fractionofincidentsolarradiationthatisconvertedtoelectricity)of15.796%,calculatedastheproductofthereflectionefficiencyof55%andthesteamplantefficiencyof28.72%.TheefficiencyoftheCSPhotfluidcollection(energyinfluiddividedbyincidentradiation)is34%.Table10.BreakdownofEnergyCostsRequiredtoKeepGridStableSummaryof2050WWSmeancapitalcostsofnewelectricityplusheatgenerators;electricity,heat,cold,andhydrogenstorage(includingheatpumpstosupplydistrictheatingandcooling),andall-distancetransmission/distribution($trillionin2020USD)andmeanlevelizedprivatecostsofenergy(LCOE)(USD¢/kWh-all-energyor¢/kWh-electricity-replacing-BAU-electricity)summedoraveragedoverthesimulationsforall24worldregions(encompassing145countries).Alsoshownistheenergyconsumedperyearineachcaseandtheresultingaggregateannualenergycost.145countriesCapitalcostnewgeneratorsonly($trillion)45.697Capcostnewgenerators+storage($trillion)61.470ComponentsoftotalLCOE(¢/kWh-all-energy)Short-dist.transmission1.050Long-distancetransmission0.172Distribution2.375Electricitygeneration3.799Additionalhydroturbines0Geothermal+solarthermalheatgeneration0.079LIbatterystorage0.554CSP-PCM+PHSstorage0.027CW-STES+ICEstorage0.002HW-STESstorage0.013UTESstorage0.092Heatpumpsforfillingdistrictheating/cooling0.066H2production/compression/storage0.310TotalLCOE(¢/kWh-all-energy)8.538LCOE(¢/kWh-replacingBAUelectricity)8.046GWannualavg.end-usedemand(Table1)8,880.6TWh/yend-usedemand(GWx8,760h/y)77,794Annualenergycost($billion/yr)6,642.0TheLCOEsarederivedfromcapitalcosts,annualO&M,andend-of-lifedecommissioningcoststhatvarybytechnology(andthatareafunctionoflifetimeandasocialdiscountrateforanintergenerationalprojectof2.0(1-3)%,alldividedbythetotalannualizedend-usedemandmet,giveninthepresenttable.Capitalcostofgenerators-storage-H2-HVDC($trillion)isthecapitalcostofnewelectricityandheatgenerators;electricity,heat,cold,andhydrogenstorage;hydrogenelectrolyzersandcompressors;andlong-distance(HVDC)transmission.Sincethetotalend-useloadincludesheat,cold,hydrogen,andelectricityloads(allenergy),the“electricitygenerator”cost,forexample,isacostperunitallenergyratherthanperunitelectricityalone.The‘TotalLCOE’givestheoverallcostofenergy,andthe‘ElectricityLCOE’givesthecostofenergyfortheelectricityportionofloadreplacingBAUelectricityenduse.ItisthetotalLCOElessthecostsforUTESandHW-STESstorage,H2,andlesstheportionoflong-distancetransmissionassociatedwithH2.Short-distancetransmissioncostsare$0.0105(0.01-0.011)/kWh.Distributioncostsare$0.02375(0.023-0.0245)/kWh.Long-distancetransmissioncostsare$0.0089(0.0042-0.010)/kWh(inUSD2020),whichassumes1,500to2,000kmHVDClines,acapacityfactorusageofthelinesof~50%andacapitalcostof~$400(300-460)/MWtr-km.Table11.Energy,Health,andClimateCostsofWWSVersusBAU2050145countriesannual-averageend-use(a)BAUloadand(b)WWSload;(c)percentdifferencebetweenWWSandBAUload;(d)presentvalueofthemeantotalcapitalcostfornewWWSelectricity,heat,cold,andhydrogengenerationandstorageandall-distancetransmissionanddistribution;meanlevelizedprivatecostsofall(e)BAUand(f)WWSenergy(¢/kWh-all-energy-sectors,averagedbetweentodayand2050);(g)meanWWSprivate(equalssocial)energycostperyear,(h)meanBAUprivateenergycostperyear,(i)meanBAUhealthcostperyear,(j)meanBAUclimatecostperyear,(k)BAUtotalsocialcostperyear;(l)percentdifferencebetweenWWSandBAUprivateenergycost;and(m)percentdifferencebetweenWWSandBAUsocialenergycost.Allcostsarein2020USD.H=8,760hoursperyear.Countryorregion(a)12050BAUAnnualavg.end-useload(GW)(b)12050WWSAnnualavg.end-useload(GW)(c)2050WWSminusBAUload=(b-a)/a(%)(d)2WWSmeantotalcap-italcost($tril2020)(e)3BAUmeanprivateenergycost¢/kWh-allenergy(f)4WWSmeanprivateenergycost¢/kWh-allenergy(g)5WWSmeanannualall-energyprivateandsocialcost=bfH$bil/(h)5BAUmeanannualall-energyprivatecost=aeH$bil/y(i)6BAUmeanannualBAUhealthcost$bil/y(j)7BAUmeanannualclimatecost($bil/y)(k)BAUmeanannualBAUtotalsocialcost=h+i+j$bil/y(l)WWSminusBAUprivateenergycost=(g-h)/h(%)(m)WWSminusBAUsocialenergycost=(g-k)/k(%)145countries20,3598,880.6-56.461.59.988.546,642.017,80533,60131,75783,163-62.7-92.01FromTable1.2Capitalcostofgenerators-storage-H2-HVDC($trillion)isthecapitalcostofnewelectricityandheatgenerators;electricity,heat,cold,andhydrogenstorage;hydrogenelectrolyzersandcompressors;andlong-distance(HVDC)transmission.3ThisistheBAUelectricity-sectorcostofenergyperunitenergy.ItisassumedtoequaltheBAUall-energycostofenergyperunitenergy.4TheWWScostperunitenergyisforallenergy,whichisalmostallelectricity(plusasmallamountofdirectheat)5TheannualprivatecostofWWSorBAUenergyequalsthecostperunitenergyfromColumn(f)or(g),respectively,multipliedbytheenergyconsumedperyear,whichequalstheend-useloadfromColumn(b)or(a),respectively,multipliedby8,760hoursperyear.6The2050annualBAUhealthcostequalsthenumberoftotalairpollutionmortalitiesperyearin2050fromTable12,Column(a),multipliedby90%(theestimatedpercentoftotalairpollutionmortalitiesthatareduetoenergy)andbyastatisticalcostoflifeof$11.56($7.21-$17.03)million/mortality(2020USD)andamultiplierof1.15formorbidityandanothermultiplierof1.1fornon-healthimpacts(Jacobsonetal.,2019).7The2050annualBAUclimatecostequalsthe2050CO2eemissionsfromTable12,Column(b),multipliedbythesocialcostofcarbonin2050of$548($315-$1,188)/metrictonne-CO2(in2020USD),whichisupdatedfromvaluesinJacobsonetal.(2019),whichwerein2013USD.Table12.AirPollutionMortalities,CarbonDioxideEmissions,andAssociatedCosts145countries(a)estimatedairpollutionmortalitiesperyearin2050-2052duetoanthropogenicsources(90%ofwhichareenergy);(b)carbon-equivalentemissions(CO2e)intheBAUcase;(c)costpertonne-CO2eofeliminatingCO2ewithWWS;(d)BAUenergycostpertonne-CO2eemitted;(e)BAUhealthcostpertonne-CO2eemitted;(f)BAUclimatecostpertonne-CO2eemitted;(g)BAUtotalsocialcostpertonne-CO2eemitted;(h)BAUhealthcostperunitall-BAU-energyproduced;and(i)BAUclimatecostperunit-all-BAU-energyproduced.Countryorregion(a)12050BAUairpollutionmortalities(Deaths/y)(b)22050BAUCO2e(Mtonne/y)(c)32050WWS($/tonne-CO2e-elim-inated)(d)42050BAUenergycost($/tonne-CO2e-emitted)(e)42050BAUhealthcost($/tonne-CO2e-emitted)(f)42050BAUclimatecost($/tonne-CO2e-emitted)(g)42050BAUsocialcost=d+e+f($/tonne-CO2e-emitted)(h)52050BAUhealthcost(¢/kWh)(i)52050BAUclimatecost(¢/kWh)145countries5,292,57656,873116.793135915581,46218.817.812050countryBAUmortalitiesduetoairpollutionareextrapolatedfrom2016valuesfromWHO(2017)usingthemethoddescribedinJacobsonetal.(2019).2CO2e=CO2-equivalentemissions.ThisaccountsfortheemissionsofCO2plustheemissionsofothergreenhousegasesmultipliedbytheirglobalwarmingpotentials.3CalculatedastheWWSprivateenergyandtotalsocialcostfromTable11,Column(g)dividedbytheCO2eemissionsfromColumn(b)ofthepresenttable.4Columns(d)-(g)arecalculatedastheBAUprivateenergy,health,climate,andtotalsocialcostsfromTable11,Columns(h)-(k),respectively,eachdividedbytheCO2eemissionsfromColumn(b)ofthepresenttable.5Columns(h)-(i)arecalculatedastheBAUhealthandclimatecostsfromTable11,Columns(i)-(j),respectively,eachdividedbytheBAUannualaverageend-useloadfromTable11,Column(a)andby8,760hoursperyear.Table13.LandAreasNeededFootprintareasfornewutilityPVfarms,CSPplants,solarthermalplantsforheat,geothermalplantsforelectricityandheat,andhydropowerplantsandspacingareasfornewonshorewindturbines.CountryorregionCountryorregionlandarea(km2)FootprintArea(km2)Spacingarea(km2)Footprintareaaspercentageofthecountryorregionlandarea(%)Spacingareaasapercentageofthecountryorregionlandarea(%)145countries121,464,428205,758440,1990.170.36Spacingareasareareasbetweenwindturbinesneededtoavoidinterferenceofthewakeofoneturbinewiththenext.Suchspacingareacanbeusedformultiplepurposes,includingfarmland,rangeland,openspace,orutilityPV.Footprintareasarethephysicallandareas,watersurfaceareas,orseafloorsurfaceareasremovedfromuseforanyotherpurposebyanenergytechnology.RooftopPVisnotincludedinthefootprintcalculationbecauseitdoesnottakeupnewland.Conventionalhydronewfootprintiszerobecausenonewdamsareproposedaspartoftheseroadmaps.Offshorewind,wave,andtidalarenotincludedbecausetheydon’ttakeupnewland.Areasaregivenbothasanabsoluteareaandasapercentageofthecountryorregionallandarea,whichexcludesinlandorcoastalwaterbodies.Forcomparison,thetotalareaandlandareaofEarthare510.1and144.6millionkm2,respectively.Table14.ChangesintheEmploymentEstimatedlong-term,full-timejobscreatedandlostduetotransitioningfromBAUenergyto100%WWSacrossallenergysectorsin145countries.Thejobcreationaccountsfornewjobsintheelectricity,heat,cold,andhydrogengeneration,storage,andtransmission(includingHVDCtransmission)industries.Italsoaccountsforthebuildingofheatpumpstosupplydistrictheatingandcooling.Howeveritdoesnotaccountforchangesinjobsintheproductionofelectricappliances,vehicles,andmachinesorinincreasingbuildingenergyefficiency.ConstructionjobsarefornewWWSdevicesonly.Operationjobsarefornewandexistingdevices.Thelossesareduetoeliminatingjobsformining,transporting,processing,andusingfossilfuels,biofuels,anduranium.Fossil-fueljobsduetonon-energyusesofpetroleum,suchaslubricants,asphalt,petrochemicalfeedstock,andpetroleumcoke,areretained.Fortransportationsectors,thejobslostarethoseduetotransportingfossilfuels(e.g.,throughtruck,train,barge,ship,orpipeline);thejobsnotlostarethosefortransportingothergoods.Thetabledoesnotaccountforjobslostinthemanufactureofcombustionappliances,includingautomobiles,ships,orindustrialmachines.CountryorregionConstructionjobsproducedOperationjobsproducedTotaljobsproducedJobslostNetchangeinjobs145countries25,374,57530,185,55855,560,13427,190,15928,369,975References.FERC(FederalRegulatoryEnergyCommission)(2021).Pumpedstorageprojects.https://www.ferc.gov/industries-data/hydropower/licensing/pumped-storage-projects.IEA(InternationalEnergyAgency)(2021),DataandStatisticsfor2018,OECDPublishing,Paris.RetrievedOctober5,2021fromhttps://www.iea.org/data-and-statisticsJacobson,M.Z.,Delucchi,M.A.,Cameron,M.A.,Coughlin,S.J.,Hay,C.,Manogaran,I.P.,Shu,Y.andvonKrauland,A.-K.(2019).ImpactsofGreenNewDealenergyplansongridstability,costs,jobs,health,andclimatein143countries.OneEarth1,449-463.WHO(WorldHealthOrganization)(2017).Globalhealthobservatorydata.RetrievedAugust10,2021,from,https://www.who.int/gho/phe/outdoor_air_pollution/en