VM0022-通过降低氮肥施用量量化农作物中N2O排放量的减少学VIP专享VIP免费

Quantifying N2O Emissions Reductions in Agricultural Crops through Nitrogen Fertilizer Rate Reduction
Approved VCS Methodology
VM0022
Version 1.1, 30 September 2013
Sectoral Scope 14
Quantifying N2O Emissions
Reductions in Agricultural Crops
through Nitrogen Fertilizer Rate
Reduction
©2013 Michigan State University
VM0022, Version 1.1
Sectoral Scope 14
Copyright @2013 Michigan State University 2
Methodology prepared by:
Acknowledgements
The VCS Methodology VM0022, Quantifying N2O Emissions Reductions in Agricultural Crops through Nitrogen Fertilizer Rate
Reduction, was developed by Michigan State University (MSU) with support from the Electric Power Research Institute
(EPRI).
Principal authors are Neville Millar, G. Philip Robertson, and Adam Diamant with collaborators Ronald J. Gehl, Peter R.
Grace, and John P. Hoben.
The authors thank Suzanne Sippel and Iurii Shcherbak for help with specific analyses, and many reviewers both public and
anonymous for helpful suggestions for improvement. Financial support was provided by EPRI, the US National Science
Foundation’s Longterm Ecological Research Program, and MSU AgBioResearch.
Limitation of Liability
The methodology is licensed as is.” The methodology developer disclaims any and all responsibilities or warranties of any kind
or nature, whether express or implied, in relation to merchantability or fitness for a particular purpose by any other person or
entity of the methodology or any derivative works.
Project proponents, end users and any other relevant persons or entities assume the entire risk and responsibility for the safety,
efficacy, performance, design, marketability, title and quality of the methodology or any derivative works prepared by or used
by them.
The methodology developer assumes no liability in respect of any infringement of any rights of third parties due to the
activities of project proponent, end user or any other person or entity, under the methodology or any derivative works. In no
event shall methodology developer or its affiliates, including its trustees, directors, officers, faculty, staff, students, employees,
consultants and agents, be responsible or liable for any direct, indirect, special, punitive, incidental or consequential damages
or lost profits arising out of project proponent, end user or any other person or entity’s use of the methodology.
None of the methodology developer, any of its affiliates, or any of its respective agents shall have any liability or responsibility
whatsoever to project proponent, end user or any other person or entity for or on account of (and project proponent agrees
and covenants, and agrees to cause each of its affiliate, end user or any other person or entity to agree and covenant, not to
sue the methodology developer, any of its affiliates, or any of its respective agents in connection with) any injury, loss, or
damage of any kind or nature, sustained by, or any damage assessed or asserted against, or any other liability incurred by or
imposed upon, project proponents, end users or any other person or entity, whether direct, indirect, special, punitive,
incidental, consequential or otherwise arising under any legal theory (and further without limitation any existing or anticipated
profits or opportunities for profits lost by project proponents, end users or any other person or entity), arising out of or in
connection with or resulting from (i) the reproduction, use, display, performance, license or sale of the methodology or
derivative works by project proponents, end users or any other person or entity, (ii) the use of any copyrights by project
proponent, end user or any other person or entity, (iii) any advertising or other promotional activities with respect to either of
the foregoing, or (iv) the production, use or sale of any product identified, characterized or otherwise developed by project
proponent, end user or any other person or entity with the aid of the copyrights.
VM0022, Version 1.1
Sectoral Scope 14
Copyright @2013 Michigan State University 3
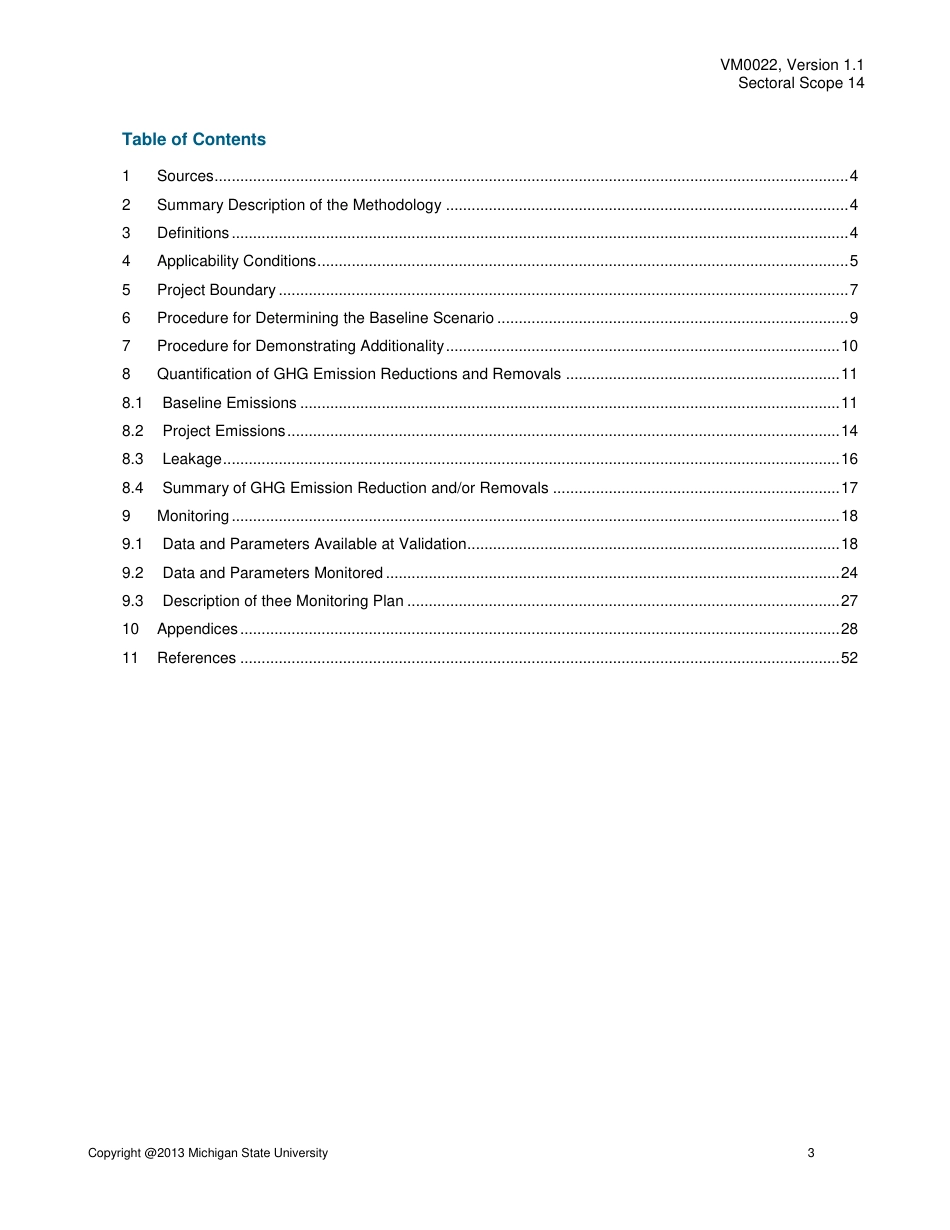
Table of Contents
1 Sources .................................................................................................................................................... 4
2 Summary Description of the Methodology .............................................................................................. 4
3 Definitions ................................................................................................................................................ 4
4 Applicability Conditions ............................................................................................................................ 5
5 Project Boundary ..................................................................................................................................... 7
6 Procedure for Determining the Baseline Scenario .................................................................................. 9
7 Procedure for Demonstrating Additionality ............................................................................................ 10
8 Quantification of GHG Emission Reductions and Removals ................................................................ 11
8.1 Baseline Emissions .............................................................................................................................. 11
8.2 Project Emissions ................................................................................................................................. 14
8.3 Leakage ................................................................................................................................................ 16
8.4 Summary of GHG Emission Reduction and/or Removals ................................................................... 17
9 Monitoring .............................................................................................................................................. 18
9.1 Data and Parameters Available at Validation....................................................................................... 18
9.2 Data and Parameters Monitored .......................................................................................................... 24
9.3 Description of thee Monitoring Plan ..................................................................................................... 27
10 Appendices ............................................................................................................................................ 28
11 References ............................................................................................................................................ 52
QuantifyingN2OEmissionsReductionsinAgriculturalCropsthroughNitrogenFertilizerRateReductionApprovedVCSMethodologyVM0022Version1.1,30September2013SectoralScope14QuantifyingN2OEmissionsReductionsinAgriculturalCropsthroughNitrogenFertilizerRateReduction©2013MichiganStateUniversityVM0022,Version1.1SectoralScope14Copyright@2013MichiganStateUniversity2Methodologypreparedby:AcknowledgementsTheVCSMethodologyVM0022,QuantifyingN2OEmissionsReductionsinAgriculturalCropsthroughNitrogenFertilizerRateReduction,wasdevelopedbyMichiganStateUniversity(MSU)withsupportfromtheElectricPowerResearchInstitute(EPRI).PrincipalauthorsareNevilleMillar,G.PhilipRobertson,andAdamDiamantwithcollaboratorsRonaldJ.Gehl,PeterR.Grace,andJohnP.Hoben.TheauthorsthankSuzanneSippelandIuriiShcherbakforhelpwithspecificanalyses,andmanyreviewersbothpublicandanonymousforhelpfulsuggestionsforimprovement.FinancialsupportwasprovidedbyEPRI,theUSNationalScienceFoundation’sLongtermEcologicalResearchProgram,andMSUAgBioResearch.LimitationofLiabilityThemethodologyislicensed“asis.”Themethodologydeveloperdisclaimsanyandallresponsibilitiesorwarrantiesofanykindornature,whetherexpressorimplied,inrelationtomerchantabilityorfitnessforaparticularpurposebyanyotherpersonorentityofthemethodologyoranyderivativeworks.Projectproponents,endusersandanyotherrelevantpersonsorentitiesassumetheentireriskandresponsibilityforthesafety,efficacy,performance,design,marketability,titleandqualityofthemethodologyoranyderivativeworkspreparedbyorusedbythem.Themethodologydeveloperassumesnoliabilityinrespectofanyinfringementofanyrightsofthirdpartiesduetotheactivitiesofprojectproponent,enduseroranyotherpersonorentity,underthemethodologyoranyderivativeworks.Innoeventshallmethodologydeveloperoritsaffiliates,includingitstrustees,directors,officers,faculty,staff,students,employees,consultantsandagents,beresponsibleorliableforanydirect,indirect,special,punitive,incidentalorconsequentialdamagesorlostprofitsarisingoutofprojectproponent,enduseroranyotherpersonorentity’suseofthemethodology.Noneofthemethodologydeveloper,anyofitsaffiliates,oranyofitsrespectiveagentsshallhaveanyliabilityorresponsibilitywhatsoevertoprojectproponent,enduseroranyotherpersonorentityfororonaccountof(andprojectproponentagreesandcovenants,andagreestocauseeachofitsaffiliate,enduseroranyotherpersonorentitytoagreeandcovenant,nottosuethemethodologydeveloper,anyofitsaffiliates,oranyofitsrespectiveagentsinconnectionwith)anyinjury,loss,ordamageofanykindornature,sustainedby,oranydamageassessedorassertedagainst,oranyotherliabilityincurredbyorimposedupon,projectproponents,endusersoranyotherpersonorentity,whetherdirect,indirect,special,punitive,incidental,consequentialorotherwisearisingunderanylegaltheory(andfurtherwithoutlimitationanyexistingoranticipatedprofitsoropportunitiesforprofitslostbyprojectproponents,endusersoranyotherpersonorentity),arisingoutoforinconnectionwithorresultingfrom(i)thereproduction,use,display,performance,licenseorsaleofthemethodologyorderivativeworksbyprojectproponents,endusersoranyotherpersonorentity,(ii)theuseofanycopyrightsbyprojectproponent,enduseroranyotherpersonorentity,(iii)anyadvertisingorotherpromotionalactivitieswithrespecttoeitheroftheforegoing,or(iv)theproduction,useorsaleofanyproductidentified,characterizedorotherwisedevelopedbyprojectproponent,enduseroranyotherpersonorentitywiththeaidofthecopyrights.VM0022,Version1.1SectoralScope14Copyright@2013MichiganStateUniversity3TableofContents1Sources....................................................................................................................................................42SummaryDescriptionoftheMethodology..............................................................................................43Definitions................................................................................................................................................44ApplicabilityConditions............................................................................................................................55ProjectBoundary.....................................................................................................................................76ProcedureforDeterminingtheBaselineScenario..................................................................................97ProcedureforDemonstratingAdditionality............................................................................................108QuantificationofGHGEmissionReductionsandRemovals................................................................118.1BaselineEmissions..............................................................................................................................118.2ProjectEmissions.................................................................................................................................148.3Leakage................................................................................................................................................168.4SummaryofGHGEmissionReductionand/orRemovals...................................................................179Monitoring..............................................................................................................................................189.1DataandParametersAvailableatValidation.......................................................................................189.2DataandParametersMonitored..........................................................................................................249.3DescriptionoftheeMonitoringPlan.....................................................................................................2710Appendices............................................................................................................................................2811References............................................................................................................................................52VM0022,Version1.1SectoralScope14Copyright@2013MichiganStateUniversity41SOURCESVCSStandardv3.3VCSAFOLURequirementsv3.3VCSProgramGuidev3.42006IPCCGuidelinesforNationalGreenhouseGasInventories2SUMMARYDESCRIPTIONOFTHEMETHODOLOGYThismethodologyquantifiesemissionsreductionsofnitrousoxide(N2O)fromagricultureintheUnitedStates(US),asbroughtaboutbyreductionsintherateofnitrogen(N)fertilizer(syntheticandorganic)appliedtocropland.ThemethodologyencouragestheapplicationofeconomicallyoptimumNfertilizerratesthatdonotharmproductivity,andrequirestheuseofverifiablebestmanagementpracticesforNtiming,placement,andtype.DependingontheUSstatewhereaprojectisimplemented,themethodologyuseseitheragenerallyacceptedIPCCTier1emissionfactororanempiricallyderivedTier2regionalemissionfactor(applicableinthe12stateNorthCentralRegion)toaidincalculatingN2Oemissionsreductions.TheapproachisstraightforwardandtransparentandisapracticalsolutiontohelpreduceN2OemissionsandotherreactiveNpollutantsfromagriculture.Thefieldresearchthatunderpinsthemethodologyispubliclyavailableinthepeer-reviewedliterature.NitrousoxideproductioninagriculturalsoiloccurspredominantlythroughthemicrobialtransformationsofinorganicN(RobertsonandGroffman2007).ThepotentialtoproduceandemitN2OincreaseswiththeincreasingavailabilityofN(Bouwmanetal.1993).DuetothestronginfluenceofavailablesoilNonN2Oemissions,someemissionsofN2Oareanunavoidableconsequenceofmaintaininghighlyproductivecropland(Mosier2002).However,anyactivityorprocessthatactstokeepavailablesoilNlowwillleadtolowerN2Oemissions.AnthropogenicactivitiesthatlowertheinputofNintocroplandagriculturehelptoreduceemissionsofN2O(RobertsonandVitousek2009).TodatethevastmajorityofevidencesupportsNinputasthemostrobustandreliabledefaultproxyforcalculatingN2Oemissions.ItisconsistentandstraightforwardtoquantifyasametricanditsuseissubstantiatedbytheIPCC,whichusesannualNrateasthedefaultmethodforcalculatingN2Oemissionsfrommanagedlandinnationalgreenhousegasinventories.Moreover,itsalterationisreadilyaccessibletomanagementintervention.Table1:AdditionalityandCreditingBaselineMethodsAdditionalityPerformanceMethodCreditingBaselinePerformanceMethod3DEFINITIONSSyntheticnitrogenfertilizer:Anysyntheticfertilizer(solid,liquid,gaseous)containingnitrogen(N).Thismaybeasinglenutrientfertilizerproduct(onlyincludingN),oranyothersyntheticfertilizercontainingN,suchasmulti–nutrientfertilizers(e.g.,N–P–Kfertilizers)and‘enhanced–efficiency’Nfertilizers(e.g.,slowrelease,controlledreleaseandstabilizedNfertilizers).VM0022,Version1.1SectoralScope14Copyright@2013MichiganStateUniversity5Organicnitrogenfertilizer:AnyorganicmaterialcontainingN,includinganimalmanure,compostandsewagesludge.DirectN2Oemissions:ThoseemitteddirectlyfromthesitetowhichfertilizerNhasbeenapplied.IndirectN2Oemissions:ThoseemittedbeyondthesitetowhichfertilizerNhasbeenapplied,butasaresultofthefertilizerNappliedatthesiteNorthCentralRegion:TheNorthCentralRegion(NCR)oftheUSAencompassesthe12MidwesternstatesofIllinois,Indiana,Iowa,Kansas,Michigan,Minnesota,Missouri,Nebraska,NorthDakota,Ohio,SouthDakotaandWisconsin.4APPLICABILITYCONDITIONS4.1ThemethodologyappliestoAgriculturalLandManagement(ALM)projectactivities)thatreducenetnitrousoxide(N2O)emissionsfromagriculturalcroppingsystemsbyreducingthenitrogen(N)fertilizerapplicationratecomparedtothebusinessasusual(BAU)scenario.4.2Implementationofprojectactivitiesunderthismethodologymustnotleadtoviolationofanyapplicablelawevenifthelawisnotenforced.4.3Projectsmustnotbeatsitesthathavenotbeclearedofnativeecosystemsandwhereeligiblecroppingsystemshavebeengrownforatleasttenyearspriortoprojectimplementation.Eligiblecroppingsystemsaredefinedintheapplicabilitycondition4.8.4.4Thefollowingconditionswithrespecttofertilizernitrogensourcesmustbemet:SourcesoffertilizerNeligibleunderthismethodologymustbeasub–setofthosedetailedinthe2006IPCCGuidelinesforNationalGreenhouseGasInventoriesandcaninclude:SyntheticNfertilizers;andOrganicNfertilizers.AllotherNinputsources(e.g.,cropresidueN,atmosphericNdeposition(otherthanasanindirectN2Oemissionspathway)andsoilNmineralizationassociatedwithsoilmanagementpracticesdonotqualifyforconsideration.AlleligibleNinputsonamassbasisareconsideredequalirrespectiveoftheirsource.VM0022,Version1.1SectoralScope14Copyright@2013MichiganStateUniversity64.5Thefollowingconditionswithrespecttofertilizernitrogenmanagementmustbemet:FertilizerNadditionstothesoilduringawholecropcycleareeligiblefordeterminationoftheyearlyfertilizerNrateirrespectiveofwhenNisappliedduringthecalendaryearorwhetherNapplicationissplitbetweencalendaryearsforasinglecrop.Duringtheprojectcreditingperiod,adherenceto‘BestManagementPractices’(BMPs)astheyrelatetotheapplicationofsyntheticandorganicNfertilizerattheprojectsiteisrequired.TheseBMPsarerelatedtoNfertilizerformulation(orNcontentoforganicadditions)anddatesandmethodsofapplication.DetailsoffertilizerBMPsarereadilyavailableforeachUSstateviastatedepartmentsofagricultureandfromfederalagenciessuchastheNaturalResourcesConservationService(NRCS)andtheUSDAFarmServiceAgency.MoregenerallytheseBMPsaredescribedintheGlobal4RNutrient(Fertilizer)StewardshipFramework(RightSource–Rate–Time–Place),publishedbytheInternationalPlantNutritionInstitute(IPNI).TheprojectproponentmustdemonstratethatduringeachcroppingseasonincludedintheprojectcreditingperiodthetotalNratetobeappliedtotheprojectareaissufficienttogenerateexpectedannualyieldsimilartotheaverageannualyieldofthesamecrop(s)grownduringthebaselineperiod.DocumentationrequiredtodemonstratethatthisapplicabilityconditionhasbeenmetisdescribedinSection9.2.4.6BothdirectandindirectpathwaysofN2Oemissionsasoutlinedbythe2006IPCCGuidelinesforNationalGreenhouseGasInventoriesareeligibleunderthismethodology.IndirectN2OemissionscanoccurinthefollowingscenariosFollowingthevolatilizationofthegasesNH3andNOxproducedasaresultoftheNinputtotheprojectsiteandthesubsequentre–depositionofthesegasesandtheirproductsNH4+andNO3-tosoilsandwatersbeyondtheprojectsite;AfterleachingandrunoffofN(mainlyasNO3-)appliedtotheprojectsiteentersreceivingwatersorsoilsbeyondtheprojectsite(onlyapplicabletoregionswhereleachingandrunoffisconsideredtooccur–seeAppendixA).4.7ProjectsmustbeimplementedintheUSonly.4.8Thefollowingconditionswithrespecttocroppingsystemsmustbemet:ProjectslocatedintheUSincludingallfertilizedagriculturalcropswheretheproductisharvestedforfood,livestockfodderorforanothereconomicpurposemustuseMethod1(describedinsection8)tocalculatedirectN2Oemissions.ProjectslocatedintheNCRoftheUSthatinvolvecorninrow–cropsystemssuchascontinuouscornandrotationsofcorn–soybeanorcorn-soybean-wheatmustuseMethod2(describedinsection8)tocalculatedirectN2Oemissions.ProjectslocatedintheNCRthatinvolvecropsotherthancornincludingcropsinrotationwithcornmustuseMethod1tocalculatedirectN2Oemissions.VM0022,Version1.1SectoralScope14Copyright@2013MichiganStateUniversity7Projectsmustalsostateandjustifyex-anteintheProjectDocumentwhethertheywillapplyMethod1orMethod2asdeterminedbytheirgeographiclocationandcroppingsystem.ThesamemethodmustbeappliedtothecalculationofdirectN2Oemissionsinthebaselineandprojectcaseandusedforthedemonstrationofadditionality.4.9Theprojectcropareamustbethesameasorlessthanthebaselinecropareainordertoensurethatthesamelandareaisusedinemissionreductioncalculations.4.10Projectsmustnotbeonsiteswith‘organic’soilsorHistosols,asdefinedbytheUSSoilTaxonomy.TheuniquepropertiesofHistosolsareaveryhighcontentoforganicmatter(OM)intheupper80cm(32in)ofthesoilsandnopermafrost.Theamountoforganicmatterisatleast20to30percentbymass(200-300gOMkgdrysoil-1)inmorethanhalfofthisthickness,orthehorizonthatisrichinorganicmatterrestsonrockorrockrubble.MostHistosolsarepeatsormucks,whichconsistofmoreorlessdecomposedplantremainsthataccumulatedinwater,butsomeformedfromforestlitterormoss,orboth,andarefreelydrained.USDANRCSsoilsmapsforindividualfieldscanbeusedtodeterminewhetherafieldisunderlainbyasoilseriesintheHistosolOrder.5PROJECTBOUNDARYSpatialboundaryThespatialboundaryoftheprojectencompassesbothdirectandindirectemissionsofN2O,andincludestheprojectsitewherefertilizerNisdirectlyappliedaswellasanyadditionalsoilsandwaterswherebyproductsofthefertilizerNinput(suchasthegasesNH3andNOx,andtheirproductsNH4+andNO3-)arere-deposited.TheprojectproponentmustdefinetheprojectsitewherefertilizerNisdirectlyappliedintheProjectDocument,butisnotrequiredtodefinethespecificareaswherebyproductsmaybere-depositedbeyondtheprojectsite.TemporalboundaryTheprojectcreditingperiodmustfollowtherequirementsforALMprojectsfocusingexclusivelyonemissionsreductionsofN2OassetoutinthemostrecentversionoftheVCSStandard.GreenhousegasesTable1summarizesthegreenhousegasesaccountedforinthecalculationsofbaselineemissionsandprojectemissions.Table1.GreenhousegasesandtheirsourcesSourceGasIncluded?Justification/ExplanationBaselineDirectemissionssyntheticfertilizerCO2NoNotsignificant-deminimisCH4NoNotsignificant-deminimisN2OYesN2OisthemajoremissionssourcefromNfertilizerCO2NoNotsignificant-deminimisVM0022,Version1.1SectoralScope14Copyright@2013MichiganStateUniversity8SourceGasIncluded?Justification/ExplanationIndirectemissionssyntheticfertilizerCH4NoNotsignificant-deminimisN2OYesN2OisthemajoremissionssourcefromNfertilizerDirectemissionsorganicfertilizerCO2NoNotsignificant-deminimisCH4NoNotsignificant-deminimisN2OYesN2OisthemajoremissionssourcefromfertilizerNadditionIndirectemissionsorganicfertilizerCO2NoNotsignificant-deminimisCH4NoNotsignificant-deminimisN2OYesN2OisthemajoremissionssourcefromNfertilizerProjectDirectemissionssyntheticfertilizerCO2NoNotsignificant-deminimisCH4NoNotsignificant-deminimisN2OYesN2OisthemajoremissionssourcefromNfertilizerIndirectemissionssyntheticfertilizerCO2NoNotsignificant-deminimisCH4NoNotsignificant-deminimisN2OYesN2OisthemajoremissionssourcefromNfertilizerDirectemissionsorganicfertilizerCO2NoNotsignificant-deminimisCH4NoNotsignificant-deminimisN2OYesN2OisthemajoremissionssourcefromNfertilizerIndirectemissionsorganicfertilizerCO2NoNotsignificant-deminimisCH4NoNotsignificant-deminimisN2OYesN2OisthemajoremissionssourcefromNfertilizerCarbonpoolsTable2summarizesthecarbonpoolsincludedinprojectsusingthismethodology.SoilcarbonistheprimarypoolofconcernforALMmethodologies.InaccordancewithVCSAFOLUrequirementsv3.3,methodologiestargetingN2OemissionreductionsneedtoaccountforanysignificantreductionsinsoilCstocks.InthismethodologyreductionsinNfertilizerrateresultingfromprojectimplementationwillnotresultinsignificant(>5%ofthetotalCO2ebenefitsfromreductioninN2Oemissions)decreasesinsoilCstock.EvidencepresentedinAppendixBintheformofpeerreviewedliteraturedetailshowthesoilCpoolisdeemeddeminimis.AppendixBcanbeusedforprojectsusingthismethodologyasacriteriontoexcludethesoilCpool.Table2.CarbonpoolsconsideredinthemethodologyCarbonPoolIncluded?Justification/ExplanationAbovegroundwoodybiomassNoNotrelevantorsubjecttosignificantchange–deminimisVM0022,Version1.1SectoralScope14Copyright@2013MichiganStateUniversity9CarbonPoolIncluded?Justification/ExplanationAbovegroundnonwoodybiomassNoNotrelevantorsubjecttosignificantchange–deminimisBelowgroundbiomassNoNotrelevantorsubjecttosignificantchange–deminimisLitterNoNotrelevantorsubjecttosignificantchange–deminimisDeadwoodNoNotrelevantorsubjecttosignificantchange–deminimisSoilYesChangeisnilorpositiveor(reductionisdeminimis)WoodproductsNoNotrelevantorsubjecttosignificantchange–deminimis6PROCEDUREFORDETERMININGTHEBASELINESCENARIOThebaselinescenarioisthecontinuationofthehistoricalcroppingpracticeswhere,intheabsenceoftheprojectactivity,Nfertilizerrateisappliedinabusinessasusual(BAU)manner,resultinginhigheremissionsofN2OfromthesoilwhencomparedtoasituationwheretheprojectisimplementedandtheapplicationoflowerNfertilizerrateresultsinloweremissionsofN2O.ThebaselineemissionsaretheamountofN2OthatwouldhavebeenemittedtotheatmosphereduringtheprojectcreditingperiodundertheNratepracticethatwouldhavebeeninplacehadtheprojectnotbeenimplemented.ThedeterminationofbaselineN2OemissionsiscarriedoutusingoneoftwoApproaches.BothApproachesuseayield-goalcalculationmethodtogenerateabaselinefertilizerNapplicationrate,fromwhichemissionsofN2Oarecalculated.Approach1derivesthebaselineNratefromproducer-specificNfertilizermanagementrecords,andApproach2derivesthebaselineNratefromcounty-levelrecordsaggregatedbytheUSDANationalAgriculturalStatisticsService:USDAcropyielddatainconjunctionwithstandardstate-specificUniversity-recommendedyield-goalbasedequationsforcalculatingNratesfromtheseyieldsfortheperiodinquestion.Duetoitsfinerspatialresolution(sitespecificity),projectproponentsmustuseApproach1ifdataisavailable.Approach2(countyscaledata)canbeusedifrelevantsite-specificrecordsarenotavailableorverifiableforApproach1.ThesameApproachmustbeappliedtosyntheticNfertilizerandorganicNfertilizerifbothkindsoffertilizershavebeenappliedduringthebaselineperiod.Approach1ThebaselineNfertilizerrateisdeterminedfromtheprojectproponents’managementrecordsforatleastthepreviousfiveyears(monoculture)orsixyears(e.g.,threecyclesofatwocroprotation,ortwocyclesofathreecroprotation)priortotheproposedprojectimplementationyear.VM0022,Version1.1SectoralScope14Copyright@2013MichiganStateUniversity10ManagementrecordsfromwhichbaselinefertilizerNratecanbedirectlydeterminedisrequiredunderthisApproach.Examplesoftheseincludesyntheticfertilizerpurchaseandapplicationraterecords,aswellasmanureapplicationrateandmanureNcontentdata.DeterminationofthebaselineN2OemissionsmustbebasedonanaverageofthepreviousNrateapplicationsforthespecificcrop(s).AworkedexampleofabaselineNratecalculationusingApproach1isgiveninAppendixC.Approach2IfthebaselinefertilizerNrateforthespecificcrop(s)cannotbeestablishedfromprojectproponentrecords(Approach1),thenApproach2canbeused.WithApproach2,thebaselinefertilizerNrateiscalculatedfromcropyielddataatthecountylevel(availablefromtheUnitedStatesDepartmentofAgriculture–NationalAgriculturalStatisticsService(USDA–NASS))andequationsfordeterminingfertilizerNraterecommendationsbasedonyieldgoalestimates(foundine.g.,statedepartmentofagricultureanduniversityagriculturalextensiondocuments).7PROCEDUREFORDEMONSTRATINGADDITIONALITYAdditionalityisassessedthroughtheperformancemethod.Theperformancemethodrequiresprojectstomeetwithrequirementsonregulatorysurplusandexceedtheperformancebenchmarkspecifiedbelow.RegulatorySurplusProjectproponentsmeettherequirementsforregulatorysurplusif:Thereisnomandatorylaw,statuteorotherregulatoryframeworkinplaceatthelocal,state,orfederallevel,requiringproducerstoreducefertilizerNinputratebelowthatofaBAUscenario.AppendixDprovidesmoreinformationandpresentsalistofregulationsatFederalandStatelevelthatdealwithpracticesrelatingtosyntheticandorganicNfertilizermanagementintheagriculturalsector.Projectdevelopersmustconsiderandevaluatetheapplicabilityofallsuchregulationsinthecontextoftheproposedprojectinordertosatisfytheregulatorysurplusrequirements.PerformanceBenchmarkProjectsproponentsmustexceedaperformancebenchmarkthresholdthatrepresentsBAU.TheBAUvalueisidenticaltothebaselinevalueforNfertilizerapplicationrate.ThebaselinevalueforNfertilizerrateisequivalenttothewidespreadandgeneralpracticeofproducerstoapplyNfertilizerratesbaseduponrecommendationsderivedfromyieldgoalcalculationsknowntooverestimatecropneeds.ReductionsinNfertilizerrateandthereforeN2OemissionsbelowtheBAUsitespecificvalue(Approach1)orbelowtheBAUvalueinthecountywheretheprojectistobeconducted(Approach2)willresultinaprojectexceedingtheperformancebenchmark.ThebenchmarkisdefinedintermsofN2Oemissions(MgCO2eha-1).DetailedexamplesusingApproach1andApproach2todeterminethebenchmarkareshowninAppendixC.Evidenceforthewide-scale,historic,andcontinuedadoptionoftheyield-goalapproach,VM0022,Version1.1SectoralScope14Copyright@2013MichiganStateUniversity11andthereforeitslegitimacyasaperformancebenchmarkfordemonstratingadditionalityinUScrop-basedagricultureisgiveninAppendixE.FurtherdiscussiononwhyApproach2isconservativeandthetrade-offsbetweenfalsepositives(thecreditingofactivitiesthatarenotadditional)andfalsenegatives(theexclusionofactivitiesthatareadditional)isalsopresentedinAppendixE.TheproceduresdescribedbelowaretherequirementsfordeterminingthebenchmarkforacropgrowninasingleprojectsiteusingApproach2.IdentifyprojectsiteIdentifyprojectcropIdentifyyearsinwhichcrophasbeenharvestedinprojectsite.GatherdataoncropyieldfromtheseyearsinrelevantUScountyfromUSDA-NASSUseequationC2(AppendixC)orotherrelevantequationtocalculatepredictedcropyield(YGt)IncorporateYGtintorelevant‘yieldgoal’equationforcalculatingNrate(e.g.,equationC1inAppendixC)CalculateannualNratesbaseduponfieldrotationandmanagement(e.g.,incorporatingNcredits)CalculateaverageannualNrate(i.e.,baselineNrate)fromallannualNratesReduceNratebelowthebaselineNrateduringprojectcreditingperiodRecordandmaintainprojectNraterecords8QUANTIFICATIONOFGHGEMISSIONREDUCTIONSANDREMOVALSAllemissionsofN2O(baselineandproject,directandindirect)arereportedinunitsofMegagramofcarbondioxideequivalents(MgCO2e).One(1)Mgisequivalentto1×106gorone(1)metricTonorone(1)tonne.Emissionsforbaselineandprojectperiodarecalculatedonaperhectare(ha)oflandbasis.Inthecalculationsbelow,yeartisthe12-monthperiodfollowingthefirstinputofNfertilizerdedicatedtoaparticularcrop,ortheperiodoftimefollowingthisinputpriortoanNinputdedicatedtoaseparateandsubsequentcropatthesameprojectsite,ThesubscriptsB(e.g.,FBSN,t)andP(e.g.,FPSN,t)areaddedtodistinguishthetermsforbaselineandprojectemissionfactors,respectively.Allotherfactorswithoutthesesubscriptswillbeapplicableforuseinbothprojectandbaselineemissioncalculations.IncalculatingdirectandindirectemissionsofN2O,themethodologyutilizesterminologyandscientificrationalepresentedinthemostrecent2006IPCCGuidelinesforNationalGreenhouseGasInventories.8.1BaselineEmissionsBaselineemissionscanbecalculatedbythefollowingequation:N2OBtotal,t=N2OBdirect,t+N2OBindirect,t(1)Where:N2OBtotal,tTotalbaselineN2Oemissions,MgCO2eha-1inyeart;VM0022,Version1.1SectoralScope14Copyright@2013MichiganStateUniversity12N2OBdirect,tDirectbaselineN2Oemissionsfromtheprojectsite,MgCO2eha-1inyeart;N2OBindirect,tIndirectbaselineN2Oemissionsbeyondtheprojectsite,MgCO2eha-1inyeart.DirectemissionsMethod1ThedirectbaselinenitrousoxideemissionsfromnitrogenfertilizationforMethod1canbecalculatedusingthefollowingequations:N2OBdirect,t=(FBSN,t+FBON,t)EFBDM1N2OMWN2OGWP(2)FBSN,t=MBSF,tNCBSF(3)FBON,t=MBOF,tNCBOF(4)Where:FBSN,tBaselinesyntheticNfertilizerapplied,MgNha-1inyeart;FBON,tBaselineorganicNfertilizerapplied,MgNha-1inyeart;MBSF,tMassofbaselineNcontainingsyntheticfertilizerapplied,Mgha-1inyeart;MBOF,tMassofbaselineNcontainingorganicfertilizerapplied,Mgha-1inyeart;NCBSFNcontentofbaselinesyntheticfertilizerapplied,gN(100gfertilizer)-1;NCBOFNcontentofbaselineorganicfertilizerappliedgN(100gfertilizer)-1;EFBDM1EmissionfactorforbaselinedirectN2OemissionsfromNinputsMgN2O–N(MgNinput)-1(IPCCdefaultTier1=0.01.SeeAppendixF);N2OMWRatioofmolecularweightsofN2OtoN(44/28),MgN2O(MgN)-1;N2OGWPGlobalWarmingPotentialforN2O,MgCO2e(MgN2O)-1(IPCCdefault=310.SeeAppendixF).Method2DirectemissionsofN2OwillbecalculatedusingaNCRderived(IPCCTier2)equationforbaselineandprojectemissions.SeeAppendixG.ThedirectbaselinenitrousoxideemissionsfromnitrogenfertilizationforMethod2canbecalculatedusingthefollowingequations:N2OBdirect,t=(FBSN,t+FBON,t)EFBDM2N2OMWN2OGWP(5)FBSN,t=MBSF,tNCBSF(3)FBON,t=MBOF,tNCBOF(4)EFBDM2=6.710-4(exp(6.7[FBSN,t+FBON,t])–1)/(FBSN,t+FBON,t)(6)Where:VM0022,Version1.1SectoralScope14Copyright@2013MichiganStateUniversity13EFBDM2EmissionfactorforbaselinedirectN2OemissionsfromNinputsMgN2O–N(MgNinput)-1.SeeAppendixGfordetailsofemissionfactorcalculation.AllothertermsareasforMethod1.ForMethod1andMethod2,theamountsofappliedmineralnitrogenfertilizers(FBSN,t)andofappliedorganicnitrogenfertilizers(FBON,t)arenotadjustedfortheamountsofNH3andNOxvolatilizationafterapplicationtosoil.Reasonsfortheremovalaregivenin2006IPCCGuidelinesforNationalGreenhouseGasInventories(Volume4,Chapter11,Note11).ThebaselinefertilizerNratevaluecalculatedusingApproach2representstheproductofthemassandtheNcontentofthesyntheticNcontainingfertilizer,i.e.,MBSF,tNCBSF,andassuchcanbeuseddirectlyasthevalueofFBSN,t.Approach2isnotapplicableforthecalculationofthebaselineorganicfertilizerNrate,thereforethevalueofFBON,t=0.IndirectemissionsTheindirectbaselinenitrousoxideemissionsfromnitrogenfertilizationcanbecalculatedusingthefollowingequations:N2OBindirect,t=N2OBvolat,t+N2OBleach,t(7)N2OBvolat,t=[(FBSN,tFracGASF)+(FBON,tFracGASM)]EFBIVN2OMWN2OGWP(8)N2OBleach,t=(FBSN,t+FBON,t)FracLEACHEFBILN2OMWN2OGWP(9)Where:N2OBindirect,tIndirectbaselineN2Oemissionsbeyondtheprojectsite,MgCO2eha-1inyeart;N2OBvolat,tIndirectbaselineN2OemissionsproducedfromatmosphericdepositionofNvolatilizedasaresultofNapplicationattheprojectsite,MgCO2eha-1inyeart;N2OBleach,tIndirectbaselineN2OemissionsproducedfromleachingandrunoffofNinregionswhereleachingandrunoffoccurs,asaresultofNapplicationattheprojectsite,MgCO2eha-1inyeart;FBSN,tBaselinesyntheticNfertilizerapplied,MgNha-1inyeart;FBON,tBaselineorganicNfertilizerapplied,MgNha-1inyeart;FracGASFFractionofallsyntheticNaddedtobaselinesoilsthatvolatilizesasNH3andNOx,dimensionless(IPCCdefaultTier1=0.10.SeeAppendixF);FracGASMFractionofallorganicNaddedtobaselinesoilsthatvolatilizesasNH3andNOx,dimensionless(IPCCdefaultTier1=0.20.SeeAppendixF);FracLEACHFractionofNadded(syntheticororganic)tobaselinesoilsthatislostthroughleachingandrunoff,inregionswhereleachingandrunoffoccurs,dimensionless(IPCCdefaultTier1=0.30.SeeAppendixAandF);VM0022,Version1.1SectoralScope14Copyright@2013MichiganStateUniversity14EFBIVEmissionfactorforbaselineN2OemissionsfromatmosphericdepositionofNonsoilsandwatersurfaces,[MgN2O–N(MgNH3–N+NOx–Nvolatilized)-1](IPCCdefaultTier1=0.01.SeeAppendixF);EFBILEmissionfactorforbaselineN2OemissionsfromNleachingandrunoff,MgN2O–N(MgNleachedandrunoff)-1(IPCCdefaultTier1=0.0075.SeeAppendixF);N2OMWRatioofmolecularweightsofN2OtoN(44/28),MgN2O(MgN)-1;N2OGWPGlobalWarmingPotentialforN2O,MgCO2e(MgN2O)-1(IPCCdefault=310.SeeAppendixF).Atprojectsiteswhereleachingandrunoffdonotoccur(seeAppendixA),indirectN2OemissionsarecalculatedbyremovingthefactorN2OBleach,tfromequation7.8.2ProjectEmissionsProjectemissionscanbecalculatedbythefollowingequation:N2OPtotal,t=N2OPdirect,t+N2OPindirect,t(10)Where:N2OPtotal,tTotalprojectN2Oemissions,MgCO2eha-1inyeart;N2OPdirect,tDirectprojectN2Oemissionsfromtheprojectsite,MgCO2eha-1inyeart;N2OPindirect,tIndirectprojectN2Oemissionsbeyondtheprojectsite,MgCO2eha-1inyeart.DirectemissionsMethod1Theprojectdirectnitrousoxideemissionsfromnitrogenfertilizationcanbecalculatedusingequationsasfollows:N2OPdirect,t=(FPSN,t+FPON,t)EFPDM1N2OMWN2OGWP(11)FPSN,t=MPSF,tNCPSF(12)FPON,t=MPOF,tNCPOF(13)Where:FPSN,tProjectsyntheticNfertilizerapplied,MgNha-1inyeart;FPON,tProjectorganicNfertilizerapplied,MgNha-1inyeart;MPSF,tMassofprojectNcontainingsyntheticfertilizerapplied,Mgha-1inyeart;MPOF,tMassofprojectNcontainingorganicfertilizerapplied,Mgha-1inyeart;NCPSFNcontentofprojectsyntheticfertilizerappliedgN(100gfertilizer)-1;NCPOFNcontentofprojectorganicfertilizerappliedgN(100gfertilizer)-1;VM0022,Version1.1SectoralScope14Copyright@2013MichiganStateUniversity15EFPDM1EmissionfactorforprojectN2OemissionsfromNinputs,MgN2O–N(MgNinput)-1(IPCCdefault=0.01.SeeAppendixF);N2OMWRatioofmolecularweightsofN2OtoN(44/28),MgN2O(MgN)-1;N2OGWPGlobalWarmingPotentialforN2O,MgCO2e(MgN2O)-1(IPCCdefault=310.SeeAppendixF).Method2ThedirectprojectnitrousoxideemissionsfromnitrogenfertilizationforMethod2canbecalculatedusingthefollowingequations:N2OPdirect,t=(FPSN,t+FPON,t)EFPDM2N2OMWN2OGWP(14)FPSN,t=MPSF,tNCPSF(12)FPON,t=MPOF,tNCPOF(13)EFPDM2=6.710-4(exp(6.7[FPSN,t+FPON,t])–1)/(FPSN,t+FPON,t)(15)Where:EFPDM2EmissionfactorforprojectdirectN2OemissionsfromNinputsMgN2O–N(MgNinput)-1.SeeAppendixGfordetailsofemissionfactorcalculation.AllothertermsareasforMethod1.ForMethod1andMethod2,theamountsofappliedmineralnitrogenfertilizers(FBSN,t)andofappliedorganicnitrogenfertilizers(FBON,t)arenotadjustedfortheamountsofNH3andNOxvolatilizationafterapplicationtosoil.Reasonsfortheremovalaregivenin2006IPCCGuidelinesforNationalGreenhouseGasInventories(Volume4,Chapter11,Note11).IndirectemissionsTheindirectprojectnitrousoxideemissionsfromnitrogenfertilizationcanbecalculatedusingthefollowingequations:N2OPindirect,t=N2OPvolat,t+N2OPleach,t(16)N2OPvolat,t=[(FPSN,tFracGASF)+(FPON,tFracGASM)]EFPIVN2OMWN2OGWP(17)N2OPleach,t=(FPSN,t+FPON,t)FracLEACHEFPILN2OMWN2OGWP(18)Where:N2OPindirect,tIndirectprojectN2Oemissionsbeyondtheprojectsite,MgCO2eha-1inyeart;N2OPvolat,tIndirectprojectN2OemissionsproducedfromatmosphericdepositionofNvolatilizedasaresultofNapplicationattheprojectsite,MgCO2eha-1inyeart;VM0022,Version1.1SectoralScope14Copyright@2013MichiganStateUniversity16N2OPleach,tIndirectprojectN2OemissionsproducedfromleachingandrunoffofNinregionswhereleachingandrunoffoccurs,asaresultofNapplicationattheprojectsite,MgCO2eha-1inyeart;FPSN,tProjectsyntheticNfertilizerappliedadjustedforvolatilizationasNH3andNOx,andleachingandrunoffwhereapplicable,MgNha-1inyeart;FPON,tProjectorganicNfertilizerappliedadjustedforvolatilizationasNH3andNOx,andleachingandrunoffwhereapplicable,MgNha-1inyeart;FracGASFFractionofallsyntheticNaddedtoprojectsoilsthatvolatilizesasNH3andNOx,dimensionless(IPCCdefaultTier1=0.10.SeeAppendixF);FracGASMFractionofallorganicNaddedtoprojectsoilsthatvolatilizesasNH3andNOx,dimensionless(IPCCdefaultTier1=0.20.SeeAppendixF);FracLEACHFractionofNadded(syntheticororganic)toprojectsoilsthatislostthroughleachingandrunoff,inregionswhereleachingandrunoffoccurs,dimensionless(IPCCdefaultTier1=0.30.SeeAppendixAandF);EFPIVEmissionfactorforprojectN2OemissionsfromatmosphericdepositionofNonsoilsandwatersurfaces,[MgN2O–N(MgNH3–N+NOx–Nvolatilized)-1](IPCCdefaultTier1=0.01.SeeAppendixF);EFPILEmissionfactorforprojectN2OemissionsfromNleachingandrunoff,MgN2O–N(MgNleachedandrunoff)-1(IPCCdefaultTier1=0.0075.SeeAppendixF);N2OMWRatioofmolecularweightsofN2OtoN(44/28),MgN2O(MgN)-1;N2OGWPGlobalWarmingPotentialforN2O,MgCO2e(MgN2O)-1(IPCCdefault=310.SeeAppendixF).Atprojectsiteswhereleachingandrunoffdonotoccur(seeAppendixA),projectindirectN2OemissionsarecalculatedbyremovingthefactorN2OPleach,tfromequation16.8.3LeakageLeakagerisksfromincreasedN2Oemissionsandothergreenhousegasemissions,anddecreasedCpoolsoutsidetheALMprojectboundaryarenotrelevantandarenotincludedinemissionscalculationsduetothereasonsdescribedbelow:LeakagerisksarenegligibleforALMprojectsinvolvingcroplandmanagementactivitiesbecausethelandintheprojectscenarioremainsmaintainedforcommodityproduction.Therefore,noproductionactivitiesoutsidetheprojectboundaryarerequiredtocompensateforaproductivitydecline.Cropproducersarehighlyriskaverseandwillnotintentionallysufferreducedcropyields.ReducingNratesandtheadoptionofNratesbasedoneconomicoptimizationwillnotresultinareductionincropyield.ExtensivehistoricalandcurrentdatafromMidwesternstatesattypicalcrop-to-fertilizerpriceratiosindicatethattherewillbenosignificantchangeincropyieldasaresultofloweringNfertilizerratefromcurrentratestotheeconomicoptimum(ISU2004,Sawyeretal.2006,Hobenetal.2011).Consequently,withnoreductioninproductivityattheprojectsitetherewillbenoassociatedincentiveforashiftofactivityorincreasedproductionoutsideoftheprojectsite,whichmightinturnresultinincreasedNVM0022,Version1.1SectoralScope14Copyright@2013MichiganStateUniversity17fertilizeruseandN2Oemissions.WithnoyieldreductiontherewillalsobenodecreaseinsoilCinputandthereforenochangeinsoilCsequestrationduetoprojectactivities(seesection5andAppendixB).Theleakagepotentialisthereforenegligible.Moreover,althoughaccountingfor‘positiveleakage’isnoteligible,lessavailableNinthesoilwillresultinareductioninothergaseousandhydrologicNpollutants(e.g.,NH3,NOx,andNO3-).8.4SummaryofGHGEmissionReductionand/orRemovalsTheuncertaintyassociatedwithareductioninN2OemissionsbroughtaboutbyareductioninNratebetweenthebaselineperiodandtheprojectperiodiscalculatedas:N2OEmissions(REDUNC)[1–{0.63exp(-40[NProj]2)}]100(19)Where:N2OEmissions(REDUNC)UncertaintyinN2OemissionsreductionsassociatedwithareductioninNrate,%;NProj=FPSN,t+FPON,tprojectNinput,MgNha-1yr-1.Equation(19)isapplicabletoprojectsthatdeterminetheirbaselineNrate(andthereforebaselineN2Oemissions)usingeitherApproach1orApproach2(section6).FurtherdetailsofhowemissionsuncertaintyisderivedaregiveninAppendixG.Projectproponentswilluseequation(19)tocalculateemissionsreductionsuncertainties(%)foraproject.ConfidencedeductionsasaresultofuncertaintywillbeappliedusingtheconservativefactorsspecifiedintheCDMMethPanelguidanceonaddressinguncertaintyinitsThirtySecondMeetingReport,Appendix14(Table3below).Table3:Conservativenessfactorsforemissionsreductionsbaseduponuncertaintyat95%confidencelevel.Uncertaintyrangeat95%confidencelevelofprojectemissionsreductions§ConservativenessfactorUncertaintydeduction<±15%1.0000.000>±15%≤±30%0.9430.057>±30%≤±50%0.8930.107>±50%≤±100%0.8360.164§Uncertaintyinemissionsreductionsdoesnotexceed100%(seeAppendixG).Whereuncertaintyinemissionsreductionsis<±15%,nodeductionswillbeapplied.Uncertaintydeduction(UNC)=(1–Conservativenessfactor).Seeequation(20).EmissionsreductionsandcalculationsofVCUsEquation(20)calculatestheN2Oemissionreductionsbroughtaboutbyprojectimplementation:N2OPR,t=[(N2OBtotal,t-N2OPtotal,t)AP](1-LK)(1-UNC)(20)VM0022,Version1.1SectoralScope14Copyright@2013MichiganStateUniversity18Where:N2OPR,tReductionintotalN2Oemissionsbroughtaboutbyprojectimplementation,MgCO2einyeart;N2OBtotal,tTotalbaselineN2OemissionswithintheprojectspatialboundaryasaresultofNapplicationattheprojectsite,MgCO2eha-1inyeart;N2OPtotal,tTotalprojectN2OemissionswithintheprojectspatialboundaryasaresultofNapplicationattheprojectsite,MgCO2eha-1inyeart;APProjectarea,ha;LKLeakagededuction(setas0inthismethodology,asdescribedinsection8.3);UNCUncertaintydeduction(setasinTable3[thissection]inthismethodology).Equation(21)calculatestheamountofVCUsissued:VCUt=N2OPR,t(1-BUF)(21)Where:VCUtVerifiedCarbonUnits(VCUs)attimet,MgCO2e;BUFBufferdeduction(setas0inthismethodology).9MONITORING9.1DataandParametersAvailableatValidationDataUnit/Parameter:MBSF,tDataunit:Mgha-1yr-1Description:BaselinesyntheticNcontainingfertilizerappliedSourceofdata:Projectproponentrecords(Approach1)Justificationofchoiceofdataordescriptionofmeasurementmethodsandproceduresapplied:Anycomment:Approach2calculatesbaselinefertilizerNrate=(MBSF,tNCBSF),andissubstitutedintoequation3tocalculateFBSN,t.DataUnit/Parameter:MBOF,tDataunit:Mgha-1yr-1VM0022,Version1.1SectoralScope14Copyright@2013MichiganStateUniversity19Description:BaselineorganicNcontainingfertilizerappliedSourceofdata:Projectproponentrecords(Approach1)Justificationofchoiceofdataordescriptionofmeasurementmethodsandproceduresapplied:Anycomment:Approach2isnotapplicableforthecalculationofMBOF,t.DataUnit/Parameter:NCBSFDataunit:gN(100gfertilizer)-1Description:NitrogencontentofbaselinesyntheticfertilizerappliedSourceofdata:Projectproponentrecords(Approach1)Justificationofchoiceofdataordescriptionofmeasurementmethodsandproceduresapplied:Anycomment:Approach2calculatesbaselinefertilizerNrate=(MBSF,tNCBSF),andissubstitutedintoequation3tocalculateFBSN,t.DataUnit/Parameter:NCBOFDataunit:gN(100gfertilizer)-1Description:NitrogencontentofbaselineorganicfertilizerappliedSourceofdata:Projectproponentrecords(Approach1)Justificationofchoiceofdataordescriptionofmeasurementmethodsandproceduresapplied:Anycomment:Approach2isnotapplicableforthecalculationofNCBOF.DataUnit/Parameter:BaselineCropyieldDataunit:Mgha-1yr-1VM0022,Version1.1SectoralScope14Copyright@2013MichiganStateUniversity20Description:Cropyield(standardreportingmethodforparticularcrop,e.g.,drygrainyield)Sourceofdata:Projectproponentrecords(Approach1)orcountyleveldata(Approach2)Justificationofchoiceofdataordescriptionofmeasurementmethodsandproceduresapplied:Anycomment:DataUnit/Parameter:BaselineCropareaDataunit:Hectare(ha)Description:Areaofcrop(s)planted,fromwhichbaselinefertilizerNratedeterminedSourceofdata:Projectproponentrecords(Approach1and2)Justificationofchoiceofdataordescriptionofmeasurementmethodsandproceduresapplied:Anycomment:Thebaselinecropareamustencompasstheprojectcropareainordertoensurethatthesamelandareaisusedinemissionreductioncalculations.DataUnit/Parameter:FracGASFDataunit:DimensionlessDescription:FractionofallsyntheticNaddedtoprojectsoilsthatvolatilizesasNH3andNOxSourceofdata:2006IPCCGuidelinesforNationalGreenhouseGasInventories(defaultTier1=0.10)Justificationofchoiceofdataordescriptionofmeasurementmethodsandproceduresapplied:Anycomment:DataUnit/Parameter:FracGASMDataunit:DimensionlessVM0022,Version1.1SectoralScope14Copyright@2013MichiganStateUniversity21Description:FractionofallorganicNaddedtoprojectsoilsthatvolatilizesasNH3andNOx,Sourceofdata:2006IPCCGuidelinesforNationalGreenhouseGasInventories(defaultTier1=0.20)Justificationofchoiceofdataordescriptionofmeasurementmethodsandproceduresapplied:Anycomment:DataUnit/Parameter:FracLEACHDataunit:DimensionlessDescription:FractionofNadded(syntheticororganic)toprojectsoilsthatislostthroughleachingandrunoff,inregionswhereleachingandrunoffoccursSourceofdata:2006IPCCGuidelinesforNationalGreenhouseGasInventories(defaultTier1=0.30)Justificationofchoiceofdataordescriptionofmeasurementmethodsandproceduresapplied:Anycomment:DataUnit/Parameter:EFBDM1Dataunit:MgN2O–N(MgNinput)-1Description:EmissionfactorforbaselinedirectN2OemissionsfromNinputs(Method1)Sourceofdata:2006IPCCGuidelinesforNationalGreenhouseGasInventories(defaultTier1=0.01)Justificationofchoiceofdataordescriptionofmeasurementmethodsandproceduresapplied:Anycomment:DataUnit/Parameter:EFBDM2Dataunit:MgN2O–N(MgNinput)-1VM0022,Version1.1SectoralScope14Copyright@2013MichiganStateUniversity22Description:EmissionfactorforbaselinedirectN2OemissionsfromNinputs(Method2)Sourceofdata:EmpiricalresearchonproducerfieldsthroughoutMichiganJustificationofchoiceofdataordescriptionofmeasurementmethodsandproceduresapplied:Anycomment:ParameteronlyvalidinNorthCentralRegionoftheUS(AppendixG;Hobenetal.2011).DataUnit/Parameter:EFBIVDataunit:MgN2O–N(MgNH3–N+NOx–Nvolatilized)-1Description:EmissionfactorforbaselineN2OemissionsfromatmosphericdepositionofNonsoilsandwatersurfacesSourceofdata:2006IPCCGuidelinesforNationalGreenhouseGasInventories(defaultTier1=0.01)Justificationofchoiceofdataordescriptionofmeasurementmethodsandproceduresapplied:Anycomment:DataUnit/Parameter:EFBILDataunit:MgN2O–N(MgNleachedandrunoff)-1Description:EmissionfactorforbaselineN2OemissionsfromNleachingandrunoff,Sourceofdata:2006IPCCGuidelinesforNationalGreenhouseGasInventories(defaultTier1=0.0075)Justificationofchoiceofdataordescriptionofmeasurementmethodsandproceduresapplied:Anycomment:DataUnit/Parameter:EFPDM1Dataunit:MgN2O–N(MgNinput)-1VM0022,Version1.1SectoralScope14Copyright@2013MichiganStateUniversity23Description:EmissionfactorforprojectdirectN2OemissionsfromNinputs(Method1)Sourceofdata:2006IPCCGuidelinesforNationalGreenhouseGasInventories(defaultTier1=0.01)Justificationofchoiceofdataordescriptionofmeasurementmethodsandproceduresapplied:Anycomment:DataUnit/Parameter:EFPDM2Dataunit:MgN2O–N(MgNinput)-1Description:EmissionfactorforprojectdirectN2OemissionsfromNinputs(Method2)Sourceofdata:EmpiricalresearchonproducerfieldsthroughoutMichiganJustificationofchoiceofdataordescriptionofmeasurementmethodsandproceduresapplied:Anycomment:DataUnit/Parameter:EFPIVDataunit:MgN2O–N(MgNH3–N+NOx–Nvolatilized)-1Description:EmissionfactorforprojectN2OemissionsfromatmosphericdepositionofNonsoilsandwatersurfacesSourceofdata:2006IPCCGuidelinesforNationalGreenhouseGasInventories(defaultTier1=0.01)Justificationofchoiceofdataordescriptionofmeasurementmethodsandproceduresapplied:Anycomment:DataUnit/Parameter:EFPILDataunit:MgN2O–N(MgNleachedandrunoff)-1VM0022,Version1.1SectoralScope14Copyright@2013MichiganStateUniversity24Description:EmissionfactorforprojectN2OemissionsfromNleachingandrunoff,Sourceofdata:2006IPCCGuidelinesforNationalGreenhouseGasInventories(defaultTier1=0.0075)Justificationofchoiceofdataordescriptionofmeasurementmethodsandproceduresapplied:Anycomment:9.2DataandParametersMonitoredDataUnit/Parameter:MPSF,tDataunit:MgNyr-1Description:MassofprojectsyntheticNcontainingfertilizerappliedSourceofdata:ProjectproponentrecordsDescriptionofmeasurementmethodsandprocedurestobeapplied:GenerallyacceptedfieldapplicationmethodsusingcalibratedapplicatorsofknowncapacityforfertilizermassorvolumedeterminationFrequencyofmonitoring/recording:AnnualQA/QCprocedurestobeapplied:VerifycalibrationandcapacityofapplicatorsAnycomment:DataUnit/Parameter:MPOF,tDataunit:MgNyr-1Description:MassofprojectorganicNcontainingfertilizerappliedSourceofdata:ProjectproponentrecordsDescriptionofmeasurementmethodsandprocedurestobeapplied:Generallyacceptedmethodsusingcalibratedapplicatorsofknownweight/volumeforliquidandsolidorganicmaterialapplicationFrequencyofmonitoring/recording:AnnualQA/QCprocedurestobeapplied:VerifycalibrationandcapacityofapplicatorsandnumberofloadsappliedVM0022,Version1.1SectoralScope14Copyright@2013MichiganStateUniversity25Anycomment:DataUnit/Parameter:NCPSFDataunit:gN(100gfertilizer)-1Description:NitrogencontentofprojectsyntheticfertilizerappliedSourceofdata:ProjectproponentrecordsDescriptionofmeasurementmethodsandprocedurestobeapplied:Generallyacceptedproceduresforsampling,handlingandanalysisofbulkfertilizerFrequencyofmonitoring/recording:AnnualQA/QCprocedurestobeapplied:VerifyfertilizerisfromaccreditedsourceAnycomment:DataUnit/Parameter:NCPOFDataunit:gN(100gfertilizer)-1Description:NitrogencontentofprojectorganicfertilizerappliedSourceofdata:ProjectproponentrecordsDescriptionofmeasurementmethodsandprocedurestobeapplied:Generallyacceptedsamplingandhandlingproceduresfororganicmaterials.LaboratoryanalysisfortotalNusingtotalKjeldahlNitrogen[TKN]ortotalNbycombustion)Frequencyofmonitoring/recording:AnnualQA/QCprocedurestobeapplied:VerifyNcontentfromlaboratoryanalysisdocumentationAnycomment:DataUnit/Parameter:ProjectCropareaDataunit:Hectare(ha)Description:Areaofcrop(s)planted,fromwhichprojectfertilizerNratedeterminedSourceofdata:ProjectproponentrecordsVM0022,Version1.1SectoralScope14Copyright@2013MichiganStateUniversity26Descriptionofmeasurementmethodsandprocedurestobeapplied:AsperrequirementsofVCSversion3“ProjectlocationforAFOLUprojectsmustbespecifiedusinggeodeticpolygonstodelineatethegeographicareaofeachAFOLUprojectactivityandprovidedinaKMLfile.Frequencyofmonitoring/recording:EachprojectcreditingperiodQA/QCprocedurestobeapplied:Verifyfile(s)coincidewithprojectfield(s)geographicboundaryAnycomment:TheformulationofthesyntheticNcontainingfertilizermustalsobeverified.FromthistheNcontent(%ofmass)canbedetermined.Farmers’recordsmustbecross-checkedwithrecordsfromsyntheticandorganicNfertilizersuppliers.IncaseofdiscrepanciesbetweentherecordsofthefarmersandthosefromsuppliersofsyntheticandorganicNcontainingfertilizers,themostconservativevalue(s)mustbetaken.TodemonstratethetotalamountofNtobeappliedtotheprojectareaduringacroppingseasonissufficienttogenerateexpectedannualyieldsimilartotheaverageannualyieldofthesamecrop(s)duringthebaselineperiodasrequiredinSection4(FertilizerNitrogenManagement),theprojectproponentisrequiredtoprovideoneofthefollowingtwoformsofevidence(1or2below).1.DemonstrateconsistencywiththemostrecentstateorregionalNraterecommendationsprovidedbytheUniversityAgricultureExtensionService,statedepartmentofagriculture,orafederalagencysuchastheUSDANaturalResourcesConservationService(NRCS)orFarmServiceAgency(FSA).Inthiscontext,“consistency”meansthatthetotalamountofNtobeappliedtotheprojectareaduringacroppingseasonmustbeequaltoorgreaterthan80%ofthelowestestimateofNraterangerecommendedfortherelevantcrop(s)intheregioninwhichtheyaregrown.Thiscanbedemonstratedusingoneofthetwoapproachesbelow(aorbbelow):a.ConsistentwiththetotalNraterecommendedinofficialpublicationsfromtheseorganizations,suchasextensionbulletinsorsoiltestlabreports.b.ConsistentwithdataoutputfromapprovedNratecalculators.ExamplesofapprovedNratecalculatorsincludetheIowaStateUniversitycornnitrogenratecalculator(http://extension.agron.iastate.edu/soilfertility/nrate.aspx)formultipleMidweststates,andtheUniversityofWisconsincornNratecalculator(http://ipcm.wisc.edu/iPhone/tabid/120/Default.aspx)forWisconsin,bothofwhichcalculatetheprofitableNraterangeforcornaroundthemaximumreturntonitrogen(MRTN)rate.OtherNratecalculatorscanbeusedprovidedtheyhavebeenmadeavailabletothepublicbyaUniversityAgricultureExtensionService,statedepartmentofagriculture,orafederalagency,suchastheUSDANRCSorFSA.AworkedexampledemonstratingtheuseoftheIowaStateUniversitycornnitrogencalculatorisshowninAppendixH.2.Writtencertificationprovidedbyaprofessionalcropadvisor(seebelow)statingthattotalamountofNtobeappliedtotheprojectareaduringacroppingseasonissufficienttogenerateexpectedannualyieldsimilartotheaverageannualyieldofthesamecrop(s)grownduringthebaselineperiod.Theprofessionalcropadvisormustbe:(a)aCertifiedCropAdvisor(CCA)certifiedbytheAmericanSocietyofAgronomy(ASA);(b)aCertifiedProfessionalCropConsultant(CPCC)certifiedbytheSoilandVM0022,Version1.1SectoralScope14Copyright@2013MichiganStateUniversity27WaterConservationSociety(SWCS);(c)aprofessionalstaffmemberofaUniversityAgriculturalExtensionService;(c)aprofessionalstaffmemberoftheUSDANRCSorFSA;(d)aprofessionalstaffmemberofastateagricultureagencyinthestateinwhichtheprojectislocated;or(e)anequivalentprofessionalcropadvisorasdemonstratedbysimilarprofessionalqualifications.9.3DescriptionoftheMonitoringPlanThedataandparametersrequiredforbaselinevalidationandduringtheprojectperiodaredetailedinsections9.1and9.2,respectively.Informationonacceptedmethodsforsamplingandhandling,andmeasuringmassandNcontentoffertilizercanbefoundinstateuniversityagriculturalextensiondocuments.Dataformonitoredparametersarederivedfromfarmerrecordsthatareusedforcompliancewithamyriadoffarm-relatedprograms,includingstateandfederalBMPs.Thesefarmerrecordsalsoareconsistentwithprojectdocumentsrequiredforverificationduringtheprojectperiod.VM0022,Version1.1SectoralScope14Copyright@2013MichiganStateUniversity2810APPENDICESAPPENDIXA-EquationsfordeterminingifleachingandrunoffoccuratprojectsiteTheapproachpresentedhereusesdefault(Tier1)valuesforleachingandrun-offfromthe2006IPCCGuidelinesforNationalGreenhouseGasInventories,andtheratioofgrowingseasonvaluesofprecipitationtopotentialevapotranspiration.AprojectsiteisconsideredtohaveaFracLEACHdefaultvalueof0.30kgN(kgNadditions)-1)when:PrecipGS/PETGS≥1.00(A1)AprojectsiteisconsideredtohaveaFracLEACHdefaultvalueof0.00kgN(kgNadditions)-1)when:PrecipGS/PETGS<1.00(A2)Where:PrecipGS=Precipitationduringthegrowingseason,mm;PETGS=Potentialevapotranspirationduringthegrowingseason,mm.ThegrowingseasonisconsideredtooccurfromMay–Septemberinclusive,unlessotherwiseverifiable.PlantingandharvestingorfrostrecordscanbeusedtoverifythatthegrowingseasonisotherthanMay–September.WhilethisperiodisappropriateforcornovermostoftheNCR,insouthernpartsoftheUScorncanbeplantedanumberofweekspriortothebeginningofMay.Also,forexample,ifwinterannualcropssuchaswinterwheatandfallcanolaaregrown,theappropriategrowingseasonmaybeOctober–July.Wherecropirrigationisemployed,irrigationwaterisconsideredequivalenttorainfall,andassuch,projectproponentswilladdirrigationwaterinputtoprecipitationdatatocalculatetotalprecipitationduringthegrowingseasonorannuallyasrequired.Waterfromdripirrigationisexcluded.AveragevaluesforprecipitationandirrigationwaterandpotentialevapotranspirationforbaselinedeterminationarecalculatedfromthesametimeperiodusedtodeterminebaselinefertilizerNrate,i.e.,consistentwithprojectproponents’records(Approach1)orcountyleveldata(Approach2).InformationsourcesfordeterminingifleachingandrunoffoccuratprojectsiteIfsitespecificdataforprecipitationandpotentialevapotranspirationarenotreadilyavailable,datafromlocalmeteorologicalstationscanbeused.AcentralizedinformationsourcetoidentifythesestationsintheUScanbefoundattheNationalOceanicandAtmosphericAdministration's(NOAA)NationalWeatherService(NWS)stationinformationwebpage:http://www.weather.gov/tg/siteloc.shtml.ArchiveddataforallUSmeteorologicalsitescanbefoundattheNationalClimaticDataCenter(NCDC):http://lwf.ncdc.noaa.gov/oa/climate/stationlocator.html.IndividualUSstatesmayalsohavemeteorologicaldataavailablethroughacademicorotherinstitutions.InMichiganforexample,annualprecipitationandpotentialevapotranspirationdatacanbeobtainedfromtheMichiganAutomatedWeatherNetwork(MAWN):http://www.agweather.geo.msu.edu/mawn.PotentialEvapotranspiration(PET)atprojectsitesmayalsobecalculatedusingtheFAOPenman–Monteithequation.MoreinformationcanbefoundinAllenetal.(1998).VM0022,Version1.1SectoralScope14Copyright@2013MichiganStateUniversity29APPENDIXB-EvidencerelatingtoexclusionofsoilCinmethodologyaccountingAppendixBcanbeusedforprojectsusingthismethodologyasacriteriontoexcludethesoilCpool.SoilcarbonistheprimarypoolofconcernforALMmethodologies.InaccordancewithVCSAFOLUrequirementsv3.0,methodologiestargetingN2OemissionreductionsneedtoaccountforanysignificantreductionsinsoilCstocks.InthismethodologyreductionsinNfertilizerrateresultingfromprojectimplementationwillnotresultinsignificant(>5%ofthetotalCO2ebenefitsfromreductioninN2Oemissions)decreasesinsoilCstock.PeerreviewedliteraturedetailshowthesoilCpoolisdeemeddeminimis.NfertilizercanincreasesoilCstocksbyincreasingcropgrowthandassociatedratesofcropresidueproduction.Becausethismethodologywillnotresultinsignificantcropgrowth(yield)declinesandthereforenodeclinesinresidueinputs,therecanbenoassociateddeclineinsoilCstocks.InfactavailableevidencesuggeststhatexcessNcanspeeddecomposition(Partonetal.2007)andtherebylower(Khanetal.2007)ormaintain(Russelletal.2009)Cstocksthatmightotherwiseincrease,suggestingthatthismethodologymay,ifanything,promotesoilCsequestration.Weneverthelessmakenosuchclaim.Therefore,thesoilCpoolisdeemeddeminimisandisexcludedfrommethodologyaccounting.VM0022,Version1.1SectoralScope14Copyright@2013MichiganStateUniversity30APPENDIXC–CalculatingbaselineNfertilizerrateApproach1ThebaselinefertilizerNrateisdeterminedfromtheprojectproponentsmanagementrecordsforatleastthepreviousfiveyears(monoculture)orsixyears(e.g.,threecyclesofatwocroprotation,ortwocyclesofathreecroprotation)priortotheproposedprojectimplementationyear.ManagementrecordsfromwhichbaselinefertilizerNratecanbedirectlydeterminedarerequired.Examplesoftheseincludesyntheticfertilizerpurchaseandapplicationraterecords,aswellasmanureapplicationrateandmanureNcontenthistory.DeterminationofthebaselineN2OemissionsarebasedonanaverageofthepreviousNrateapplicationsforthespecificcrop(s).Workedexample-CalculatingbaselinefertilizerNrateforcorninacorn–soybeanrotationForaproposedprojectbeginningin2011,aproducer(projectproponent)hasappliedthefollowingfertilizerNratestoacorn–soybeanrotationintheprevious6years(3rotations,TableC1).TableC1.FertilizerNratesappliedtoacorn–soybeanrotation(2005–2010).YearCrop/RotationSyntheticFertilizerNrate(kgNha-1yr-1)OrganicFertilizerNrate(kgNha-1yr-1)TotalFertilizerNrate(kgNha-1yr-1)2005Corn180202002006Soybean010102007Corn160301902008Soybean200202009Corn190202102010Soybean0002005–2010AverageSoybean=(0+20+0)/3=6.7=(10+0+0)/3=3.3=(10+20+0)/3=102005–2010AverageCorn=(180+160+190)/3≈177=(20+30+20)/3≈23=(200+190+210)/3=2002005–2010AverageCorn–Soybean=(180+0+160+20+190+0)/6≈92=(20+10+30+0+20+0)/6≈13=(200+10+190+20+210+0)/6=105ThebaselinefertilizerNrateforacorncropintheproposedprojecttobeplantedin2011iscalculatedfromtheaverageofthetotalfertilizerNrateappliedtotheprevious3corncropsduringtheprevious6VM0022,Version1.1SectoralScope14Copyright@2013MichiganStateUniversity31years,i.e.,=(200+190+210)/3=200kgNha-1yr-1.Reductionsfromthisbaseline‘commonpractice’rateareconsideredadditionalandarecredited.N.B.ThebaselinesyntheticandorganicfertilizerNrate(TableC1)ineachyear(t),arecalculatedfrom:(MBSF,tNCBSF)and(MBOF,tNCBOF),respectively,Where:MBSF,tBaselineNcontainingsyntheticfertilizerapplied,Mgha-1inyeart;MBOF,tBaselineNcontainingorganicfertilizerapplied,Mgha-1inyeart;NCBSFNitrogencontentofbaselinesyntheticfertilizerappliedgN(100gfertilizer)-1;NCBOFNitrogencontentofbaselineorganicfertilizerappliedgN(100gfertilizer)-1;Approach2IfthebaselinefertilizerNratecannotbedeterminedfromprojectproponentrecords(Approach1),thenApproach2isused.WithApproach2,thebaselinefertilizerNrateiscalculatedfromcropyielddataatthecountylevel(availablefromtheUnitedStatesDepartmentofAgriculture–NationalAgriculturalStatisticsService(USDA–NASS))andequationsfordeterminingfertilizerNraterecommendationsbasedonyieldgoalestimates(foundine.g.,statedepartmentofagricultureanduniversityagriculturalextensiondocuments).ThebaselinefertilizerNratevaluecalculatedusingApproach2representstheproductofthemassandtheNcontentofthesyntheticNcontainingfertilizer,i.e.,MBSF,tNCBSF.Approach2isnotapplicableforthecalculationofthebaselineorganicfertilizerNrate,thereforethevalueofFBON,t=0.Workedexample-CalculatingbaselinefertilizerNrateforcorninacorn–soybeanrotationinTuscolaCounty,MichiganFromthemethodology“Duringtheprojectcreditingperiod,adherenceto‘BestManagementPractices’(BMPs)forthemanagementofsyntheticandorganicNfertilizerattheprojectsiteisrequired.ForaprojectdeveloperbasedinMichigan,theMichiganDepartmentofAgriculturepublicationGenerallyAcceptedAgriculturalManagementPractices(GAAMP)forNutrientUtilization,(2013,ormostrecentversion)isconsulted(MichiganDepartmentofAgriculture2013).ThispublicationrecommendstheMichiganStateUniversity(MSU)ExtensionBulletinE–2904–NutrientRecommendationsforFieldCropsinMichigan(Warnckeetal.2004),forselectingtheappropriaterateofNfertilizerforcorn.FromExtensionBulletinE–2904theequationforcalculatingtheNrate(lbNacre-1)recommendationforacorn(grain)cropplantedinrotationwithsoybeaninmineralsoilisgivenby:Nrate=(1.36YGt)-27-NC(C1)Where:YGtYieldgoalofcropinyeart,towhichrecommendedNratewillbeapplied,bushelacre-1;NCNitrogencreditfromprevioussoybeancrop,lbNacre-1.VM0022,Version1.1SectoralScope14Copyright@2013MichiganStateUniversity32InExtensionBulletinE–2904soybeanisgivenanNcreditof30lbNacre-1.Tocalculatethepredictedfuturecornyieldthefollowingequationisused:YGt=1.05[(Yt-2+Yt-4+Yt-6)/3](C2)Where:Yt=Projectstartdate(year)Yt-n=Averagecountyyieldofcropinyears2,4,and6priortoprojectadoption.Theapproachoftakingpreviousyear’syielddataandmultiplyingby105%(1.05)inordertocalculatetheyieldgoalfortheforthcomingcropisacommonandconservativepracticeforproducers.Theapproachisconsistentwithtypicalrecommendationsfromuniversityextensionandagronomicorganizations.DocumentationoutliningthisapproachisfoundforexampleinFertilizerSuggestionsforCorn–G174,UniversityofNebraska,Lincoln(Shapiroetal.2003),andTheIllinoisCouncilonBestManagementPractices(2001).ForApproach2,thepreviousyearsyielddataisdeterminedfrominterrogationoftheUSDA–NASSwebpages(FiguresC1andC2,http://www.nass.usda.gov).12VM0022,Version1.1SectoralScope14Copyright@2013MichiganStateUniversity33FigureC1.USDA–NASSscreenshotshowingselectionmenusforState(1),andCounty(2)leveldatainquiry.FigureC2.USDA–NASSscreenshotshowingselectionmenusforcrop(3),practice(4),years(5)andCounty(6).Dataisdownloadedas.csvfilesfromwhichaverageyielddatacanbecalculated(TableC2).TableC2.Areaplanted,areaharvested,yielddataandtotalcountyproductionforcorn(grain)inTuscolacountyMichigan,foryears2005through2010.200520062007200820092010Yield(bushelacre-1)148154134174164148TheuseofcropyielddatafromUSDA–NASSmustbeconsistentwiththecroprotationhistoryoftheproposedprojectsite(s).Inthisexampleaprojectfieldhashadcorngrowninrotationwithsoybeanforatleastthelastsixyears(2005–2010,startingwithcorn).ThecalculationthereforemustuseUSDA–NASSdataforcornyieldfrom2005,2007and2009foraprojectstartdateof2011.UsingequationC2,wecancalculatetheyieldgoalforcornin2011(yeart)asfollows:3456VM0022,Version1.1SectoralScope14Copyright@2013MichiganStateUniversity34YGt=1.05[(148+134+164)/(3)]=156.1bushelacre-1FromequationC1thefertilizerNraterecommendationforcorn(grain)inMichigan:=(1.36156.1)-27-30=155.3lbNacre-1ForconversionfromnonSI(lbNacre-1)toSI(kgNha-1)units,thevalueismultipliedby1.12(aconversionfactoracceptedbytheAmericanSocietyofAgronomy(ASA),theCropScienceSocietyofAmerica(CSSA),andtheSoilScienceSocietyofAmerica(SSSA).http://www.soils.org/files/publications/journals-sitable-coversions.pdf.ThefertilizerNraterecommendationforcorn(grain)isthen:=174.0kgNha-1ThisvalueisconsideredthebaselinefertilizerNrateforcorn(grain)inacorn–soybeanrotationforanyproposedprojectsitesituatedinthecountyofTuscola,Michiganthathadaprojectstartdatein2011.Dependingontheproposedprojectdetails,similarequationsforcropsinotherstatescanbeutilized.Note,aswithApproach1theBAUbaselineNfertilizerrateinitiallycalculatedremainsfixedforthecreditingperiod.InformationontheuseofnitrogencreditsfromorganicNfertilizer(manure)whenApproach2isusedisgiveninAppendixE.VM0022,Version1.1SectoralScope14Copyright@2013MichiganStateUniversity35APPENDIXD–RegulatorySurplusTodemonstrateadditionalityaprojectwillneedtopassaregulatorysurplustest.Projectdeveloperswillpassthistestif‘thereisnomandatorylaw,statuteorotherregulatoryframeworkinplaceatthelocal,state,orfederallevel,requiringproducerstoreducefertilizerNinputratebelowthatofabusiness–as–usual,i.e.,common–practicescenario.’Thefollowingparagraphspresentsomeinformationandexamplesofregulationsthatdealwithfertilizersandtheirapplication.Thefollowingisnotmeanttobeanexhaustivelistofregulations.Projectdevelopersmustconductacompleteevaluationoffederal,stateandlocalregulationsapplicabletofertilizeruseintheselectedprojectlocationaspartoftheadditionalityassessment.ThereisnoFederalfertilizerstatuteandfertilizersareregulatedundertheindividualStates'authority.TheFederalgovernmentdoesnotregulatefertilizerdirectlyhowever,thereareregulationsconcerningtheproduction,useanddisposalofhazardousmaterials,drinkingandsurfacewatercontaminationandairpollutionthatareindirectlyrelevanttotheuseofhazardousmaterialsinfertilizersandtheapplicationoffertilizerstoland.BelowisalistofregulationsattheFederalandState(Michigan)levelthatdealinsomepartwithpracticesrelatingtosyntheticandorganicNfertilizermanagementintheagriculturalsector.FederalRegulationsTheFood,Conservation,andEnergyAct(2008)TheMilitaryMunitionsRule(1997)TheWaterQualityAmendmentAct(1987)TheSuperfundAmendmentsandReauthorizationAct(SARA)(1986)ResourceConservationandRecoveryActof1976(RCRA)Statute-SolidWasteDisposal,Title42,Chap.82,SubchapterIII-HazardousWasteManagementTheFederalWaterPollutionControlAct(1972)HazardousWasteRegulation,40CFR,Part503,StandardsfortheUseorDisposalofSewageSludgeTheOccupationalSafetyandHealthAdministration(OSHA)HazardCommunicationStandard(29CFR1910.1200)StateRegulationsEachstateintheUShasitsownfertilizerregulatoryprogram.StateregulationsforfertilizersaregenerallydevelopedandadministeredbyStateagriculturedepartments.Suchregulationsprimarilyaddressefficacyclaimsandcompositionstatementsoftheactiveingredientsdisplayedonfertilizerlabels.MostStateshavefertilizerregulationssimilartothatoftheAssociationofAmericanPlantFoodControlOfficials(AAPFCO)modelUniformStateFertilizerBill.TheUniformStateFertilizerBillisamodelbillprovidingthelegalauthoritytoregulatetheregistration,packaging,labeling,sale,storage,distribution,useandapplicationoffertilizerandfertilizermaterials.Therearespecificrequirementsfortheaccurateandmeaningfullabelingoffertilizers,includingtermsanddefinitions,andregulationsforthestoragerequirementsforbulkfluidanddryfertilizers.VM0022,Version1.1SectoralScope14Copyright@2013MichiganStateUniversity36OtherAAPFCOUniformBillswhichmayrelatetofertilizerNapplicationincludetheUniformSoilAmendmentBill,theModelAgriculturalLimingMaterialsBill,theModelChemigationBillandtheUniformStateAmmoniaBill.Example:MichiganStateRegulationsBelowarestatelevelregulationsindirectlyrelatingtofertilizerNmanagementasoutlinedintheMichiganDepartmentofAgricultureGenerallyAcceptedAgriculturalandManagementPractices(GAAMP)forNutrientUtilizationpublication(MichiganDepartmentofAgriculture,2013).Theseregulationsapplyto‘apersonapplying,distributing,andstoringfertilizerororganicmaterialsinMichigan’who‘mustcomplywiththerelevantstateandfederallawsandregulationspromulgatedunderthesestatutes,includingbutnotlimitedto’:PublicAct451:NaturalResourcesandEnvironmentalProtectionActof1994PublicAct346:CommercialDrivers'LicenseLawof1988PublicAct368:MichiganPublicHealthCodeof1978PublicAct399:StateofMichiganSafeDrinkingWaterActof1976PublicAct154:MichiganOccupationalSafetyandHealthAct(MIOSHA)of1974PublicAct162:MichiganLimingMaterialsLawof1955FurtherusefulinformationregardingfertilizerregulationscanbefoundattheSafeFertilizerInformationInstitute(http://saffii.com/uslaw.aspx).METHODOLOGY:VCSVersion3Copyright@2013MichiganStateUniversity37APPENDIXE–BusinessasUsual(BAU)practiceforNfertilizerapplicationandjustificationforApproach2Inusingthismethodology,projectproponentsmustexceedaperformancebenchmark.ProjectproponentsexceedtheperformancebenchmarkbyreducingtheirNfertilizerratebelowtheBAUrate,whichisalsothebaselinevalueforNfertilizerratefortheproposedproject.ThisbaselinescenarioequatestheNfertilizerapplicationwiththewidespreadandgeneralpracticeofproducerstoapplyNfertilizerratesbaseduponrecommendationsderivedfromyieldgoalestimates.ReductionsinNfertilizerratebelowthebaselinesitespecificvalue(Approach1)orbelowthebaselinevalueinthecountywheretheprojectistobeconducted(Approach2)willresultinaprojectexceedingtheperformancebenchmark.BothApproach1and2,usedtoestablishtheprojectbaseline,operateontheprinciplethatareductioninNfertilizerratebelowthebaselineresultsinapredictable,concomitantreductioninN2Oemissions.ProjectadditionalityisachievedthroughareductioninNratebelowthebaselinescenario,suchthat‘new’N2Oemissionsarepreventedfromenteringtheatmosphere.Theseavoidedemissionsoccurimmediately,areirreversible,andarepermanent.Evidenceforthewide-scalehistoric,continued,andextensiveuseoftheyieldgoalapproachasthebaseline(BAU)scenario,andthereforeitslegitimacyasaperformancebenchmarkfortestingadditionalityincrop-basedagriculture,isgivenbelow.JustificationoftheyieldgoalapproachasaBAUbaselinescenarioSincethe1970sithasbeencommonpracticethroughouttheNCRandtheconterminousUSingeneralforproducerstoapplyratesofNfertilizerbasedonrecommendationsderivedfromyieldgoalestimates(e.g.,Fixen,2006;Shapiroetal.2003;Warnckeetal.2004).Theagriculturaldepartmentsoflandgrantuniversities,stateandfederalagriculturalorganizationscontinuetoendorseyield-goalNfertilizerraterecommendations(e.g.,MichiganDepartmentofAgriculture,2013,USDA–NRCS,2011;2012).Forexample,therecentlyupdated(July2012)USDA–NRCSConservationEffectsAssessmentProject(CEAP)states:“Nutrientmanagementsystemshavefourbasiccriteriaforapplicationofcommercialfertilizersandmanure.1.Applynutrientsattheappropriateratebasedonsoilandplanttissueanalysesandrealisticyieldgoals.”Alltheseorganizationsrepresentacommonsourceofexternalinformationthatprovidesadvicedirectlyorindirectlytoproducers.ThisnetworkservesasthefoundationforproducerBAUpracticeintheNCRandbeyond,constitutingasector-wideapproachforcalculatingbaselineNfertilizerratesand,byextension,emissionsofN2O.Despitethis,veryfewstudieshavequantitativelyexaminedthenumerousfactorsandtheircomplexinteractionsandimpactonafarmers’decisionofhowmuchNfertilizertoapplytoacrop.Thosethathavedonesoindicatethatthemajorityoffarmersrelyheavilyontheirownexperience,aswellasonadvicefromfertilizerdealers.Forexample,usingUSDAdataRibaudoetal.(2011)foundthat72%ofgrowersbasetheirNfertilizerapplicationdecisionon‘routinepractice’,andfromarecentsurveysentto1000farmersinSWMichigan,Stuartetal.(2012)foundthatalmostallrespondentsreceiveinformationfromfertilizerandseeddealersonhowtodeterminetheirNfertilizerapplicationrates;for55%thisrepresentsthemostimportantsourceofinformation;only18%useduniversityrecommendationsastheirmostimportantsource.Importantthoughthesedataare,theydonotreportthedealers’rationaleorcalculationsfortheadvicegiven.Thisdataisscarce.However,universityrecommendationsarebasedonyieldgoalcalculations,andintheMIsurvey,Stuartetal.(2012)foundthat72%ofcommercialcornfarmersuseasimpleyield-METHODOLOGY:VCSVersion3Copyright@2013MichiganStateUniversity38goalcalculationtoderivetheirNrate.ThisvalueisidenticaltothepercentageofgrowerswhobasetheirNfertilizerapplicationdecisiononroutinepractice(Ribaudoetal.2011).Theremaining28%appeartousesomecombinationofotherfarmers,privateconsultants,magazinearticles,andotherinformalsourcesunlikelytobeasconservative(Stuartetal.2012).FromtheMIsurvey,ofthefarmerswhofertilizedusingsimpleN-to-yield-goalratios(lbsNperbushelofcorn)thepercentageswhoreportedaparticularratiowere5(>1.3),21(1.1to1.3),55(0.8to1),and19(<0.8).IfweusethefiveyearaveragecorngrainyieldforMIbetween2007and2011of143bushelsperacre,wecanestimateNrateapplications(kgNha-1)forthesegroupsas>208,176to208,128to160,and<128,respectively.Extrapolatingthesetrendsnationallywhereaveragecorngrainyieldbetween2007and2011was154bushelsperacre,weget>224,190to224,138to172,and<138,respectively.ItisnotknownwhetherrespondentstotheMIsurveytookintoaccountNcontributions(Ncredits)fromothersourcessuchaspriorleguminouscropsormanure.Ifnot(asislikely),thenonaveragetherewouldbeanincreasedpercentageofrespondentsplacedinthehigherratios(1.1to1.3,and>1.3).Inthesurvey,nearlyhalfoftherespondentsusedbothcommercialsyntheticNfertilizersandmanureontheircrops(noneusedmanureNonly–consistentwithnationaldata,e.g.,Ribaudoetal.2011).However,nearly60%nevertestedtheirmanureforNcontentand64%neverkeptanyrecordsiftheydid.ThissuggeststhattheNrateswereunder-reported,andthereforetherespondent’sN-to-yield-goalratiounderestimated.Under-reportingofNrateapplicationhasbeenreportedelsewhere.Forexample,datafromCaliforniaacrossawiderangeofcropsindicatethatonaverageproducersapplyapproximately38lbsNperacre(~42kgNperhectare)morethantheyreport(Rosenstocketal.2013).DatafromRibaudoetal.(2011)indicatesthatwhenfarmersusebothmanureandcommercialfertilizer,theyapplyonaverage28%higherNratestotheircrops,whencomparedtofarmerswhoapplyonlysyntheticNfertilizers.ThisisdespitetherecommendationtofarmerswhousebothNsourcestoapply10%lessNthantothosewhouseonlysyntheticN.Despitedecades-oldconcernsandquantitativeevidencethatyieldgoal-basedrecommendationsareinaccurate(e.g.,LoryandScharf2003)andtooliberalforrecommendingNfertilizerrate,thepracticeisstillwidelyrecommendedandfollowed.ThisinevitablyleadstoapplicationsofNfertilizerinexcessofcroprequirements,principallyasaresultofunrealisticyieldgoalestimates(e.g.,VanottiandBundy1994).Furthermore,tomaintainviableoperations,farmersmaymanagetemporalvariabilityinweatherandsoilNbyover-applyingNtoprotectagainstdownsiderisk(i.e.,usean‘insurance’Napplicationrate)(Sheriff,2005;Babcock,1992;BabcockandBlackmer,1992).Additionally,farmersmaytakea‘safetynet’approachtomaximizeeconomicreturnsbysettinganoptimisticyieldgoalforagivenfieldbasedonanoptimumweatheryeartoensurethattheneededamountofNformaximumyieldsisavailable(Schepersetal.,1986;BockandHergert,1991).Thus,duringtheyearsinwhichweatherisnotoptimalformaximizingyields,Nwillbeover-appliedfromanagronomicstandpoint.Bydefinition,optimalconditionsareinfrequent,sofarmersover-fertilizecropsinmostyears.ItisthereforesafetoconcludethatreductionsinNratebelowthosedeterminedbyyield-goalbasedcalculations(i.e.,theBAUbaselinescenario)canbeimplementedtoreducetheamountofexcessNincroplandagriculture,therebydecreasingitsN2Oburdenwithoutreducingcropproductivity.AregionalapproachtooptimizecropyieldhasrecentlybeendevelopedthatutilizeshistoricalandcurrentNfertilizerrateresearchdatafromfieldtrialstodetermineeconomicallyprofitableNinputs,expressedasarangeofNratesaroundamaximumreturntoN(MRTN)atdifferentNfertilizerandcropprices(IowaStateUniversityAgronomyExtension2004).TheUSMidweststatescurrentlyprovidingdataforthisapproachareIowa,Illinois,Indiana,Michigan,Minnesota,Ohio,andWisconsin.Producerswithrelevantcroppingsystemsinthesestates(andotherstatesthatmaysubsequentlybecomeinvolved)maywishtoMETHODOLOGY:VCSVersion3Copyright@2013MichiganStateUniversity39adoptaNfertilizerratefortheprojectwithintheeconomicallyprofitableNraterangecalculated,usingthisapproach(Millaretal.2010).UseofMRTNtoreduceNrateuseisnotrequired,however–othermethodsmaybeusedtoreduceratestobettermatchcropneeds,includingtheuseofimprovedfertilizerapplicationtiming,fertilizerformulations,cover-cropNcapture,oranyofanumberofotherpracticesknowntobettermatchNfertilizerinputtocropNneedsthanBAUapproaches(RobertsonandVitousek2009).JustificationforApproach2fordeterminingthebaselinescenarioIfthebaselinefertilizerNrateforaspecificcropcannotbeestablishedfromprojectproponentrecords(Approach1),thenApproach2canbeused.WithApproach2,baselineNfertilizerrateiscalculatedfromcropyielddataatthecountylevel,availablefromUnitedStatesDepartmentofAgriculture–NationalAgriculturalStatisticsService(USDA–NASS),andequationsfordeterminingNfertilizerraterecommendationsbasedonyieldgoalestimates(e.g.,foundinstatedepartmentofagricultureandlandgrantuniversityagriculturedepartmentdocuments).TheuseofcropyielddatafromUSDA–NASSmustbeconsistentwiththecroprotationhistoryoftheproposedprojectsite.Forexample,aprojectfieldinwhichcornhasbeengrowninalternateyearswithsoybeanforthelastsixyears(2006–2011;startingwithcorn)mustuseUSDA–NASSdataforcornyieldfortherelevantcountyfrom2006,2008and2010foraprojectstartdateof2012.Thisrequirementreducestheuncertaintyinbaselinecalculation,ascountycropyieldrecordsforanindividualyearreflecttheprevailingenvironmentalandeconomicconditionsatthattime.Thisrequirementalsoreducesthepotentialfor‘gaming’asprojectproponentscannotselecthistoricaldatathatmighthavetheeffectofartificiallyincreasingthebaseline.TherationaleforwhyApproach2isconservative,anddiscussiononthetrade-offsbetweenfalsepositives(thecreditingofactivitiesthatarenotadditional)andfalsenegatives(theexclusionofactivitiesthatareadditional)inrelationtoApproach2calculationsarepresentedbelow.TheuseofApproach2willtypicallyunderestimatebaselineNinputsduetotwomajorfactors:1.theuseofcountylevelcropyielddatasetsthatincludenon-commercialandsmall-scalefarmingoperationsthattendtohavelowerproductivitythanlargescaleoperations;and,2.thecompulsoryinclusionofNcreditsfromorganicfertilizer(manure)applicationsinyieldgoalequationsasanartificialmeanstolowerbaselineNraterecommendations,andthereforebaselineN2Oemissions.Overall,thisunderestimationwillbiastheawardofoffsetcreditstowardsafalsenegativeoutcome(theexclusionofactivitiesthatareadditional).TheuseofcountylevelcropyielddataThecountylevelcropyielddatafromUSDA–NASSrequiredtoback-calculatebaselineNfertilizerratesusingApproach2includesdatacollectedthroughtheannualCountyAgriculturalProductionSurvey(CAPS)andtheCensusofAgriculture(COA)conductedeveryfiveyears.TheCAPSprovidesdataneededtoestimateproductionofcropsatthecountylevelforstateandfederalprograms,andisconductedin44stateswithallcountiesinthesestatesrepresentedinthesampling.Thetargetpopulationisallfarmsandranchesineachstate,witheachstatedevelopingitsowndatacollectionstrategy,typicallyamailsurveywithsecondmailingsoratelephonefollow-uptoensureadequatecoverageforeachcounty.Theaverage,annualcountyyielddatathereforeinherentlycoverscropstowhichonlysyntheticNfertilizerandbothsyntheticandorganicNfertilizershavebeenapplied.METHODOLOGY:VCSVersion3Copyright@2013MichiganStateUniversity40AsdefinedbytheCAPSandCOA,afarmisanyplacefromwhich$1,000ormoreofagriculturalproductsarenormallyproducedandsoldduringthesurveyedyear.Between2002and2007(latestavailable)theCOAfoundthatthenumberoffarmswithsalesoflessthan$1,000increasedby118,000,withmostofthegrowthinUSfarmnumberscomingfromsmalloperations.In2007,60%oftotalUSagriculturalsalescamefromfarmswhereannualsaleswerelessthan$10,000.Smallfarmsaccountfor91%ofallfarmsintheUSwithalargepercentageofthesefarmsspecializingingrainproduction.Datalinkingfarmsizetocropyieldsislimited,butaspeciallyconductedUSDAARMSsurveyonthecostofproductionofcornin1996foundthatpart-timefarmersandsmallfarmoperationstendedtohavelowerproductionefficiency,highercornproductioncostsperbushelandlowerthanaverageyields(Foreman,2001).Thereforethelinkbetweenloweryieldsandsmallfarmsizeandthecontinuingtrendforincreasingnumbersofpart-timefarmersandsmallfarmoperationsintheUSprovidesevidencethattheaveragecountyyieldreportedwilltendtounderestimatetheyieldsobtainablefromlarger,moreefficientoperatorswhowillmostlikelyconstitutethemajorityofprojectdevelopers,atleastintheshort-term.Thiswillresultinlowercounty-levelyields’biasingthefertilizerNestimateforthelargergrowerstowardslowerNapplicationrates(alowercounty-levelyieldwillresultinalowerpredictedbaselineNrateforthosefarmerswithhigheryields).ThecompulsoryinclusionofNcreditsfrommanureapplicationsThemostcommonformoforganicNappliedtocroplandintheUSisanimalmanure.MostoftheUScropland(~70%)receivingmanureisusedtogrowcorn(Ribaudoetal.2011).Nationwide,about14%ofallNfertilizedcornacres(~10%forallcrops)aretreatedwithbothcommercialsyntheticNandmanureN.Nationally,thisamountstoapproximately13millionacresofcornbasedupon2012plantingdata(USDA–NASS).USDAARMSdataprovidesevidencethatwhenused;manureisassociatedwithoverapplicationofN.Forexample,withfarmerswhousedasoilortissuetestasameanstoestimatetheirNneed,theaverageNapplicationratebythosewhousedbothsyntheticandmanureNwas175lbsNperacre,comparedto136lbsNperacreforgrowerswhousedsyntheticNonly.Asnotedearlier,thiswasdespitea10%lowerrecommendationforfieldsreceivingbothNsourcescomparedtothosereceivingonlyacommercialsyntheticNsource(Ribaudoetal.2011).WhenusingApproach2,projectproponentswillincludeanitrogencreditfromorganicNfertilizer(manure).TheinclusionofanNcreditfororganicNfertilizerinsomeorallofthebaselineyearsforwhichanestimateoftheNfertilizerrateisrequiredwill,ineffect,acttoreducethecalculatedaveragebaselineNrateandthereforebaselineN2Oemissions.IrrespectiveoftheactualuseoforganicNfertilizersduringthebaselineperiod,andwhetherthisisverifiableinpartornot,thisprocedurewillacttolowerthebaselineN2OemissionsoftheprojectfieldwhencomparedtoascenariowhennoNcreditfororganicNfertilizerisapplied.Thisapproachisconservative.Sevenhypotheticalscenarios(somemorelikelythanothers)relatingtodocumentanddataavailabilityarepresentedbelow,alongwiththerationalefortherequiredNcreditassociatedwiththem:1.Norecordsareavailabletoverifythetiming(i.e.,theyearorgrowingseason),amount,orNcontentoftheorganicNfertilizer;2.Recordsareavailablethatverifythetiming,butnottheamountorNcontentoftheorganicNfertilizer3.Recordsareavailablethatverifythetiming,andamount,butnottheNcontentoftheorganicNfertilizerMETHODOLOGY:VCSVersion3Copyright@2013MichiganStateUniversity414.Recordsareavailablethatverifytheamount,butnotthetimingandNcontentoftheorganicNfertilizer5.Recordsareavailablethatverifytheamountandtiming,butnottheNcontentoftheorganicNfertilizer.6.RecordsareavailablethatverifytheNcontent,butnottheamountortimingoftheorganicNfertilizer7.RecordsareavailablethatverifytheamountandNcontent,butnotthetimingoftheorganicNfertilizerInsixofthesesevencases,atleastoneofthethreerequirementsisavailabletodeterminetheorganicNfertilizerappliedduringtheentirebaselineperiod.Inthreeofthesecases,twoofthethreerequirementsareavailable.IfallthreerequirementsregardingdataweremetthentheprojectwoulduseApproach1forcalculationofthebaselineNratefororganicfertilizer.TherationalebehindtheapproachmatchesanincreasedavailabilityofrecordswithadecreasedNcreditfororganicNfertilizer,andthereforeanincreasedbaselineNrate,andbaselineN2Oemissions.Ineffecttheapproach‘rewards’morecomprehensiverecordkeeping,asanincreasedbaselineNratewillpotentiallyallowforlargerdecreasesinNrateduringtheprojectperiodandthereforegreaterfinancialpaybackthroughtheawardofoffsetcredits.Notethatallindividualrequirementsareweightedequally.Thereisthereforenoincentive(financialorotherwise)todeliberatelywithholddocumentaryevidenceestablishingtheapplicationoforganic(orindeedsynthetic)Nfertilizerduringthebaselineperiod.DoingsowouldacttoartificiallyreducethevalueofthebaselineNrate(andthereforebaselineN2Oemissions),therebyreducing:1)thelikelihoodthatanNratereductioncouldtakeplaceatall;and2)themagnitudeofthatreduction,withoutaproducer’sincurringayieldpenaltyorsubstantiallyincreasingtheriskofdoingso.Notethatifrecordsofthetimingoforganicfertilizerapplication(i.e.,theyearorgrowingseason[butnotnecessarilytheexactdate])areabsent,buttheamountand/orNcontentareavailablethenitwillbeassumedthatorganicfertilizerhasbeenappliedinallrelevantcroppingcyclesprevioustotheprojectcropintheprojectfieldduringthebaselineperiod.ScenariocreditingThequantitativebasisforapplyingthespecificNcreditfororganicfertilizer(manure)isderivedfromtherecentUSDAERSreport“NitrogeninAgriculturalSystems:ImplicationsforConservationPolicy”(Ribaudoetal.2011).UsingnationalAgriculturalResourceManagementSurvey(ARMS)data,thereportfoundthatfarmerswhousedbothsyntheticfertilizerandmanure(allsources),appliedonaverage90lbsNperacrefromthemanure.So:Forscenario1wherenoneofthethreedatarequirementsareavailable,thenitrogencreditfromorganicfertilizerwillbe:901.5=145lbsNperacre=162kgNha-1METHODOLOGY:VCSVersion3Copyright@2013MichiganStateUniversity42Forscenarioswhereoneofthethreerequirementsisavailable(scenarios2,4,and6),thenitrogencreditfromorganicfertilizerwillbe:901.2=108lbsNperacre=121kgNha-1Forscenarioswheretwoofthethreerequirementsareavailable(scenarios3,5,and7,thenitrogencreditfromorganicfertilizerwillbe:901.0=90lbsNperacre=101kgNha-1UsingtheworkedexamplegivenforApproach2inAppendixC,wheretheNrate(lbNacre-1)iscalculatedas:Nrate=(1.36YGt)-27-NC(E1)Where:YGt=156.1bushelacre-1Ifweassumethattwoofthethreedatarequirementsareavailablefromrecords,theNcreditequalsthesumoftheNcreditfromtheprevioussoybeancrop(30lbsNperacre)andthepreviousmanureapplications(90lbsNperacre).Therefore:Nrate=(1.36156.1)-27-(30+90)=65lbNacre-1=73kgNha-1METHODOLOGY:VCSVersion3Copyright@2013MichiganStateUniversity43APPENDIXF-DefaultfactorsThedefault(Tier1)valuesusedinthemethodologyforcalculatingdirectandindirectemissionsofN2Ofromthebaselineandprojectscenariosaretakenfromthe2006IPCCGuidelinesforNationalGreenhouseGasInventories(Volume4,Chapter11).TheterminologyofthefactorsusedinthismethodologydiffersfromthatusedintheIPCCguidelines,butthefactorsareequivalentinvalueandusage.TheIPCCuncertaintyrangesforeachfactororfractioncanbeconsideredconservativewithrespecttotheirapplicationtoagriculturalsoils,astheiruseinIPCCGuidelinesisapplicabletoawiderenvironmentalcoverage,i.e.,managedsoils,includingforestsandgrasslandsaswellasagriculture.TableF1.DefaultfactorsusedtoestimatedirectandindirectemissionsofN2Ointhemethodology.N2OEmissionsMethodologyfactorIPCCfactorDefaultvalueUncertaintyrangeDirectEFBDM1,EFPDM1EF10.0100.003-0.03IndirectEFBIV,EFPIVEF40.0100.002-0.05IndirectEFBIL,EFPILEF50.00750.0005-.025Direct/IndirectFracGASFFracGASF0.100.03-0.3Direct/IndirectFracGASMFracGASM0.200.05-0.5Direct/IndirectFracLEACHFracLEACH0.300.1-0.8ConversionofN2O–NtoN2OConversionofN2O–N(themassofthenitrogencomponentofthenitrousoxidemoleculeemitted)toN2OforreportingemissionreductionsinunitsofCO2eisperformedbymultiplicationoftheratioofthemolecularweightofN2OtotheatomicweightofthetwoNatomsintheN2Omolecule:N2O=N2O–N44/28GlobalWarmingPotentialofN2OTheGWPvalueof310forN2Ousedinthemethodologyisthe100-yearvalueproposedintheIntergovernmentalPanelonClimateChangeSecondAssessmentReport(SAR).Thevalueof310isthedirectGWPforonemoleculeofN2Oonamassbasisfora100yeartimehorizon,relativetoonemoleculeofCO2,whichisascribedavalueof1byconvention.ThismeansthatamoleculeofcontemporaryN2Oreleasedtotheatmospherewillhave310timestheradiativeimpactofamoleculeofCO2releasedatthesametime.Theconversioncanberepresentedas:N2OGWP=310,MgCO2e(MgN2O)-1METHODOLOGY:VCSVersion3Copyright@2013MichiganStateUniversity44APPENDIXG–BackgroundresearchonMethod2forestimatingemissionsIntheNorthCentralRegion(NCR),directemissionsofN2Oforbaselineandprojectscenariosincorn-based,row-croprotationscanbecalculatedusingMethod2.Method2usesanemissionsfactordeterminedfrommulti–yearfieldstudiesconductedinMichigan.ThisemissionsfactorisconsistentwithIPCCTier2methodologicalguidelinesandinthismethodologyassignedthetermsEFBDM2andEFPDM2forbaselineandprojectemissioncalculations,respectively.Fulldetailsofstudysites,sampling,dataanalysis,results,andotherinformationareinHobenetal.(2011),andathttp://onlinelibrary.wiley.com/doi/10.1111/j.1365-2486.2010.02349.x/suppinfo.Theuncertaintyassessmentforemissionsreductions,includingthederivationoftheTier2emissionsfactoraredetailedbelow.OverviewPreviousresearchconductedbyMcSwineyandRobertson(2005),andmorerecentlybyHobenetal.(2011)andMillaretal.(2013)showthatN2OemissionscanincreaseexponentiallywithincreasingNfertilizerrate,particularlyathighratesthatexceedthecropNuptakecapacity.TheseuniquefieldstudiesintheNorthCentralRegion(NCR)specificallyinvestigatedlong–termN2OemissionresponsestoalargenumberofNfertilizerratetreatmentsinrow–cropagriculture.ThelargenumberofNratesandthesmallincrementsbetweenthemallowbetterresolutionoftheshapeoftherelationshipbetweenNrateandN2Oemissions.TheproducersitesusedinthedevelopmentoftheTier2approach(Hobenetal.2011)encompassedawiderangeofsoiltype,texture,andgrainyieldthatwerecomparableandbroadlyrepresentativeofcommercialcorncroprotationsandconditionsthroughouttheNCR.Duringthestudyyears,thesitesexperiencedawiderangeofenvironmentalconditionsthroughoutthegrowingseason.Inyearswithnormalprecipitation,cropyieldsatthesesitesaretypicaloftheNCRasawhole(Smithetal.2007).TheNratesemployedinHobenetal.(2011)alsoarewithintherangecommonlyrequiredforoptimumcorn-grainproductionandrecommendedfortheUSMidwest(Sawyeretal.,2006;Vitoshetal.,1995).Thenon–linearityofN2OemissionshassignificantconsequenceswhencomparingN2OemissionsreductionswiththeIPCCTier1approach.AnidenticalNfertilizerratereductionwillresultinasignificantlysmallerreductioninN2OemissionswhentheTier1emissionfactorisusedincalculations,whencomparedtotheTier2emissionfactor.TheincreasingdivergenceofN2OemissionsbetweenTier1andTier2approaches,particularlyathigherNrates,helpsincentivizethereductioninNrate.Millaretal(2010)showanexampleofthis.UncertaintyassessmentMethodologiesandproceduresadoptedtocalculateemissionsofN2Ohavebeenrefinedovermanyyears,andareconservativeinnature.Hereweoutlineassumptions,parametersandproceduresthatrelatetouncertaintyinN2Oemissionsinthemethodology.WefocusonthederivationoftheregionalNCRemissionsfactorusedinequation(6)and(15)insections8.1and8.2,respectively.Moredetailedinformationonfield-samplingandlaboratoryanalyticaltechniquesisgiveninHobenetal.(2011).AppendixF(TableFI)providesinformationonuncertaintyrangesforIPCCTier1emissionsfactorsfordirectandindirectN2Oemissionsandotherfactorsusedinthemethodology.UseoftheseIPCCemissionsfactorsisuniversallyacceptedasamechanismforcalculatingN2Oemissions–theyaresciencedrivenandusedinmanycurrentlyacceptedAFOLUmethodologiesforcalculatingN2Oemissions.Furtherdetailsonthesefactors,theirderivationandtheirrobustnessforuseinN2OemissionscalculationscanalsobeMETHODOLOGY:VCSVersion3Copyright@2013MichiganStateUniversity45foundinthe2006IPCCGuidelinesforNationalGreenhouseGasInventories,RevisionNov.2008-Chapter11:N2OEmissionsfromManagedSoils,andCO2EmissionsfromLimeandUreaApplication.ApplicationofNfertilizerThemethodologymonitorsfiveparametersduringtheprojectperiod.FouroftheserelatedirectlytothecalculationofNrateappliedattheprojectsite.ThesearedetailedalongwiththeirmeasurementandQA/QCprocedures,insection9.2ofthemethodology.Alloftheseparametersareassumedtohavenegligibleuncertainty.Derivationofregional(NCR)emissionsfactorDailyN2OemissionsValuesfordailyN2Oemissionshavenegligibleuncertainty;fieldandlaboratorysamplingandanalyticaltechniqueshavebeenrefinedovermanyyearstostandardizemethodologiesandminimizeanalyticaluncertainty.WeusedstandardmethodstomeasuredailyemissionsasdescribedinHobenetal.(2011).AnnualN2OemissionsWedeterminedtotalannualemissionsbyinterpolatingdailyemissionsbetweensamplingdays.Thiswascarriedoutusinglinearinterpolation–abroadlyacceptedmechanisminthescientificpeerreviewedliterature.Inbrief,thesumoftherateofN2Oemissionsontwosuccessivesamplingdayswasdividedbytwo(averaged),andthisaverageratewasmultipliedbytheperiod(indays)betweenthetwomeasurements,thenaddedtothepreviouscumulativeemissionstotal.Thiscanberepresentedby:CB=CA+[(DA+DB)/2](B-A)(G1)Where:CB=CumulativeN2OemissionasofdayB(gN2O-Nha-1);CA=CumulativeN2OemissionasofdayA(gN2O-Nha-1);DA=DailygasfluxondayA(gN2O-Nha-1d-1);DB=DailygasfluxondayB(gN2O-Nha-1d-1);B=Dayoflatestemissionsmeasurement(dayofyear);A=Dayofpreviousemissionsmeasurement(dayofyear).Annualemissions(gN2O-Nha-1yr-1)ofN2OforeachfieldreplicatewerecalculatedfromdailyN2Oemissions(gN2O-Nha-1d-1)measuredineachblock(4)ateachNrate(6,includingzero)ateachsiteduringtheyearforallsiteyears(8),togiveatotalof192cumulativeannualN2Oemissionsdatapoints(486).Theseindividualcumulativeannualemissions,calculateddirectlyfromdailyN2Oemissionswithnegligibleuncertainty,arealsoassumedtohavenegligibleuncertainty.Thebest-fitlinethatdefinesthemathematicalrelationshipbetweenNrate(kgNha-1yr-1)andN2Oemissions(gN2O-Nha-1yr-1)forall192datapointsis:N2Oemissions=670exp(0.0067Nrate)(G2)Where,NrateistheequivalentofFBSN,t+FBON,tforbaselineNinput(equation[2])andFPSN,t+FPON,tforprojectNinput(equation[11]).Thestandarderror(SE)associatedwithN2Oemissions,is:METHODOLOGY:VCSVersion3Copyright@2013MichiganStateUniversity46N2Oemissions(SE)=58exp(0.010Nrate)(G3)FigureG1showsthisrelationship.FigureG1.RelationshipbetweenN2Oemissions(gN2O-Nha-1yr-1)andNfertilizerrate(kgNha-1yr-1)forbaselineandprojectNfertilizerrates(blackline).Standarderrors(±58exp[0.010Nrate])arealsoshown(greenlines).CalculatedusingMathematica(v.8,WolframResearchInc.,2011).N2OemissionsreductionsRawN2OemissionsreductionvalueswereobtainedbysubtractingcumulativeannualemissionsoflowerNapplicationratesfromcumulativeannualemissionsofhigherNapplicationrates(i.e.,0,45,90,135,180,and225kgNha-1yr-1)withinthesameblock,site,andyear.ThisemissionsdifferencewasthendividedbythedifferenceinratebetweentheNratepairs.Thus,weobtained32values(4blocks8siteyears)fortheemissionreductionsforeachofthe15pairs(e.g.,45→0,90→0,90→45,etc.).Tobestdefinetheinterpolationoftheempiricaldataforemissionsreductions-N2Oemissions(RED)-manytypesoffunctionweretested,includinglinearandexponentialfunctionswithvariousparametercombinations.Thefunctionbelow(Equation[G4])derivedfromequation[G2]above)wasalsotested.N2Oemissions(RED)=0.67{exp(6.7NBase)-exp(6.7NProj)}/(NBase-NProj)(G4)Where:N2Oemissions(RED)=N2Oemissionsreductions,gN2O-Nha-1yr-1;NBase=FBSN,t+FBON,tbaselineNinput,MgNha-1yr-1;NProj=FPSN,t+FPON,tprojectNinput,MgNha-1yr-1.Equation(G4)outperformedalllinearfunctionsandworksaseffectivelyasmorecomplexexponentialfunctions.Emissionsfactors5010015020010001500200025003000N2Oemissions(gN2O-Nha-1yr-1)Fertilizerrate(kgNha-1yr-1)N2Oemissions=670exp(0.0067Nrate)5010015020010001500200025003000N2Oemissions(gN2O-Nha-1yr-1)Fertilizerrate(kgNha-1yr-1)5010015020010001500200025003000N2Oemissions(gN2O-Nha-1yr-1)Fertilizerrate(kgNha-1yr-1)N2Oemissions=670exp(0.0067Nrate)METHODOLOGY:VCSVersion3Copyright@2013MichiganStateUniversity47TheemissionsfactorforN2OisdefinedasthefractionofNappliedthatisreleasedasnitrogeninN2O(N2O-N)atanon-zeroNrateminustheN2O-NemittedatzeroNrate.Theemissionsfactorsforbaselineandprojectcalculationswereobtainedbydividingthereductionfunction(equationG4)by1106(toconvertgN2O-N/MgNratetoMgN2O-N/MgNrate).WethenformattedtheequationtocomparebaselineandprojectNratestozeroNrate.Thereforewehave:EFBase=6.710-4(exp[6.7NBase]–1)/NBase(G5)EFProj=6.710-4(exp[6.7NProj]–1)/NProj(G6)Where:EFBaseandEFProjareequivalenttoEFBDM2(Equation[6])andEFPDM2(equation[15]),respectively.EmissionsreductionuncertaintyThestandarderrorequation(G3)isusefulfordescribinguncertaintyinannualemissionsbutcannotbeusedtoaccuratelydescribeuncertaintyforemissionsreductionsintherangeofsmallerNratereductions(10–20kgNha-1yr-1).Insteadthe32values(4blocks8siteyears)fortheemissionreductionsforeachofthe15pairs(e.g.,45→0,90→0,90→45,etc.)wereusedtoobtainvariabilityofthemeanusingtheBootstrapmethod(MonteCarloalgorithmwithcasere-sampling,Mathematica–v.8,WolframResearchInc.,2011).ForeachpairofNfertilizerratereductionsarandomsampleof32baselinevalueswastakenandreplacedwitharandomsampleof32projectvaluestocomputeameanreduction.Thisprocesswasrepeated100,000timesandtheoverallstandarderrorofthemeanswerecalculated.Thestandarderrorofthemeanswasthenmultipliedby1.645(thecriticalvalueofnormalone-sidedtestat95%confidence)anddividedbytheaverageemissionsreductiontogivethefractionoftheaveragethatiswithinthe95%confidenceinterval.ThesevaluesplottedagainstNratearerepresentedbyEquation(G7),whichcalculatestheuncertaintyassociatedwithareductioninNrateduringtheprojectperiod:N2OEmissions(REDUNC)[1–{0.63exp(-40[NProj]2)}]100(G7)Where:N2OEmissions(REDUNC)UncertaintyinN2OemissionsreductionsassociatedwithareductioninNrate,%;NProj=FPSN,t+FPON,tprojectNinput,MgNha-1yr-1.Equation(G7)isidenticaltoequation19insection8.4ofthismethodology.WithintheempiricalNratedatarange(0–225kgNha-1yr-1)thehighestuncertaintywas~90%.ThereisnoevidencetosuggestthathigherNrateswouldgenerateuncertaintiesabove100%,thereforetheGaussianfunctionwasusedtoconstrainuncertaintybelow100%.Projectproponentswilluseequation(G7)tocalculateemissionsreductionsuncertainties(%)foraproject.ConfidencedeductionsasaresultofuncertaintywillbeappliedusingtheconservativefactorsspecifiedintheCDMMethPanelguidanceonaddressinguncertaintyinitsThirtySecondMeetingReport,Appendix14(TableG1).METHODOLOGY:VCSVersion3Copyright@2013MichiganStateUniversity48TableG1:Conservativenessfactorsforemissionsreductionsbaseduponuncertaintyat95%confidencelevel.Uncertaintyrangeat95%confidencelevelofprojectemissionsreductions§ConservativenessfactorUncertaintydeduction<±15%1.0000.000>±15%≤±30%0.9430.057>±30%≤±50%0.8930.107>±50%≤±100%0.8360.164§Uncertaintyinemissionsreductionsdoesnotexceed100%.Whereuncertaintyinemissionsreductionsis<±15%,nodeductionswillbeapplied.Uncertaintydeduction(UNC)=(1–Conservativenessfactor).METHODOLOGY:VCSVersion3Copyright@2013MichiganStateUniversity49APPENDIXH–CalculationstodeterminesufficiencyofprojectNrateusingNratecalculatorBelowisaworkedexampledemonstratinghowtheproposedNrateforaprojectareacanbeshowntobeconsistentwithdataoutputfromanapprovedNratecalculator.InthisexampletheIowaStateUniversitycornnitrogencalculatorisused(http://extension.agron.iastate.edu/soilfertility/nrate.aspx).TheIowaStateUniversitycornnitrogencalculatorcalculatestheprofitableNraterangearoundthemaximumreturntonitrogen(MRTN)rateincontinuouscornandcorn-soybeanrotationsinsevenstatesintheU.S.Midwest.Toshowconsistency,thetotalamountofNtobeappliedtotheprojectareaduringacorncroppingseasonmustbeequaltoorgreaterthan80%ofthelowestestimateoftheNraterangerecommendedforcornintheregioninwhichitisgrown.WorkedexampleforaproposedprojectinMichiganinacorn-soybeanrotationCalculatingbaselinefertilizerNrateforcorninacorn–soybeanrotationIntheprojectareawherecornwillbegrown,thefarmerhaspreviouslyappliedNfertilizertocorninrotationwithsoybeanduring3oftheprevious6years(TableH1).InthisexamplethesourceoftheNfertilizerissyntheticNbutitcouldalsohavebeenorganicNsuchasmanure–thecalculationwouldbethesame.TableH1.Nfertilizerratesappliedtocorninacorn–soybeanrotation(2006–2011)YearCropFertilizerNrate(kgNha-1yr-1)2006Corn1402007Soybean02008Corn1602009Soybean02010Corn1502011Soybean02006–2011AverageCorn=(140+160+150)/3=150ThebaselinefertilizerNrateforthecorncropintheproposedprojecttobeplantedin2012iscalculatedfromtheaverageofthetotalNfertilizerappliedtotheprevious3corncropsduringtheprevious6years,i.e.150kgNha-1yr-1.Reductionsfromthisbaselinerateareconsideredadditionalandarecredited.TheproposedprojectNrateforthecorncroptobeplantedin2012is125kgNha-1.DemonstratingconsistencywithIowaStateUniversitycornnitrogencalculatorMETHODOLOGY:VCSVersion3Copyright@2013MichiganStateUniversity50FigureH1.ScreenshotofIowaStateUniversitycornnitrogencalculator,showingselectionmenusfor1)rotation,2)state,3)Nfertilizertype,and4)Nfertilizerandcornprice.FigureH2.ScreenshotofIowaStateUniversitycornnitrogencalculator,showing1)maximumreturntonitrogen(MRTN)rate,and2)profitableNraterange(blueshadedcolumn;within$1.00peracreofMRTN)fortheprojectareaspecifications.Fortheprojectconditions,theMRTNrateis130lbNacre-1,withaprofitableNraterangeof121to142lbNacre-1.Forconversionfromimperialunits(lbNacre-1)tometric(kgNha-1),theimperialvalueismultipliedby1.12(aconversionfactoracceptedbytheAmericanSocietyofAgronomyat1.Chooserotation2.Choosestate3.Choosefertilizertype4.Setfertilizerandcornprice5.Hitcalculate1.MRTNrate2.ProfitableNraterangeMETHODOLOGY:VCSVersion3Copyright@2013MichiganStateUniversity51http://www.soils.org/files/publications/journals-sitable-coversions.pdf).Therefore,inmetricunitstheMRTNrateis146kgNha-1,withaprofitableNraterangeof136to159kgNha-1.80%ofthelowestrecommendedNrateis109kgNha-1(0.8x136=109);theproposedprojectNrateof125kgNha-1ishigherthanthissoisconsistentandeligibleforuseintheprojectarea.METHODOLOGY:VCSVersion3Copyright@2013MichiganStateUniversity5211REFERENCESAllen,R.G.,Pereira,L.S.,Raes,D.,andSmith,M.(1998).Cropevapotranspiration–Guidelinesforcomputingcropwaterrequirements-FAOIrrigationanddrainagepaper56.FoodandAgricultureOrganizationoftheUnitedNations,Rome.http://www.fao.org/docrep/X0490E/X0490E00.HTM.Babcock,B.A.(1992).TheEffectsofUncertaintyonOptimalNitrogenApplications.ReviewofAgriculturalEconomics14:271-80.Babcock,B.A.andBlackmer,A.M.(1994).TheExPostRelationshipbetweenGrowingConditionsandOptimalFertilizerLevels.ReviewofAgriculturalEconomics16:353-362.Bock,B.R.,andHergert,W.(1991).FertilizerNitrogenManagement,Pages140-164inR.F.Follett,D.M.Keeney,andR.M.Cruse(editors)ManagingNitrogenforGroundwaterQualityandFarmProfitability,SoilScienceSocietyofAmerica,Madison,WI,USA.Bouwman,A.F.,Fung,I.,Matthews,E.,andJohn,J.(1993).GlobalanalysisofthepotentialforN2Oproductioninnaturalsoils.GlobalBiogeochemicalCycles7:557–597.Fixen,P.E.(2006).UseofyieldgoalsforprovidingNratesuggestions:Generalconcept.NorthCentralExtension-IndustrySoilFertilityConference2006.Vol.22:57–66.DesMoines,IA.Potash&PhosphateInstitute,Brookings,SD,USA.Foreman,L.F.(2001).CharacteristicsandProductionCostsofU.S.CornFarms.UnitedStatesDepartmentofAgricultureEconomicResearchService(USDAERS).StatisticalBulletinNumber974August2001.Hoben,J.P.,Gehl,R.J.,Millar,N.,Grace,P.R.,andRobertson,G.P.(2011).Non-linearnitrousoxide(N2O)responsetonitrogenfertilizerinon-farmcorncropsoftheUSMidwest.GlobalChangeBiology17:1140–1152.IllinoisCouncilonBestManagementPractices(C–BMP)(2001).http://www.cbmp.uiuc.edu/IPCC.2006.2006IPCCGuidelinesforNationalGreenhouseGasInventories,RevisionNov.2008,PreparedbytheNationalGreenhouseGasInventoriesProgramme,EgglestonH.S.,BuendiaL.,MiwaK.,NgaraT.andTanabeK.(eds).Published:IGES,Japan.IPCCFourthAssessmentReport(2007).Forster,P.,V.Ramaswamy,P.Artaxo,T.Berntsen,R.Betts,D.W.Fahey,J.Haywood,J.Lean,D.C.Lowe,G.Myhre,J.Nganga,R.Prinn,G.Raga,M.SchulzandR.VanDorland,2007:ChangesinAtmosphericConstituentsandinRadiativeForcing.In:ClimateChange2007:ThePhysicalScienceBasis.ContributionofWorkingGroupItotheFourthAssessmentReportoftheIntergovernmentalPanelonClimateChange[Solomon,S.,D.Qin,M.Manning,Z.Chen,M.Marquis,K.B.Averyt,M.TignorandH.L.Miller(eds.)].CambridgeUniversityPress,Cambridge,UnitedKingdomandNewYork,NY,USA.IowaStateUniversityAgronomyExtension(2004).CornNitrogenRateCalculator:ARegional(CornBelt)ApproachtoNitrogenRateGuidelines.http://extension.agron.iastate.edu/soilfertility/nrate.aspxKhan,S.A.,Mulvaney,R.L.,Ellsworth,T.R.andBoast,C.W.(2007).Themythofnitrogenfertilizationforsoilcarbonsequestration.JournalofEnvironmentalQuality36:1821-1832.Lory,J.A.andScharf,P.C.(2003).YieldGoalversusDeltaYieldforPredictingFertilizerNitrogenNeedinCorn.AgronomyJournal95:994-999.McSwiney,C.P.,andRobertson,G.P.(2005).NonlinearresponseofN2Ofluxtoincrementalfertilizeradditioninacontinuousmaize(ZeamaysL.)croppingsystem.GlobalChangeBiology11:1712–1719.METHODOLOGY:VCSVersion3Copyright@2013MichiganStateUniversity53MichiganDepartmentofAgriculture.(2013).GenerallyAcceptedAgriculturalandManagementPracticesforNutrientUtilization,MichiganDepartmentofAgriculture,Lansing,Michigan.Millar,N.,Robertson,G.P.,Grace,P.R.,Gehl,R.J.,andRowlings,D.(2013).Non-linearN2OResponsetoNitrogenFertilizerinWinterWheat.PlantandSoil.Submitted.Millar,N.,Robertson,G.P.,Grace,P.R.,Gehl,R.J.,andHoben,J.P.(2010).NitrogenFertilizerManagementforNitrousOxide(N2O)MitigationinIntensiveCorn(Maize)Production:AnEmissionsReductionProtocolforUSMidwestAgriculture.MitigationandAdaptationStrategiesforGlobalChange15:185–204.MosierA.R.(2002).Environmentalchallengesassociatedwithneededincreasesinglobalnitrogenfixation.NutrientCyclinginAgroecosystems63:101–116.Parton,W.J.,Gutmann,M.P.,andOjima,D.(2007).Long-termtrendsinpopulation,farmincome,andcropproductionintheGreatPlains.Bioscience57:737-747.Ribaudo,M.,Delgado,J.,Hansen,L.,Livingston,M.,Mosheim,R.,andWilliamson,J..NitrogenInAgriculturalSystems:ImplicationsForConservationPolicy.ERR-127.UnitedStatesDepartmentofAgriculture,EconomicResearchService.89pages.September2011.Robertson,G.P.andGroffman,P.(2007).Nitrogentransformations.Pages341-364inE.A.Paul(editor).SoilMicrobiology,Ecology,andBiochemistry.ElsevierAcademicPress,Oxford,UK.RobertsonG.P.andVitousekP.M.(2009).Nitrogeninagriculture:balancinganessentialresource.AnnualReviewofEnergyandtheEnvironment34:97–135Rosenstock,T.S.,Liptzin,D.,Six,J.,Tomich,T.P.(2013).NitrogenfertilizeruseinCalifornia:Assessingthedata,trendsandawayforward.CaliforniaAgriculture.67:68–79..Russell,A.E.,Cambardella,C.A.,Laird,D.A.,Jaynes,D.B.,andMeek,D.W.(2009).NitrogenfertilizereffectsonsoilcarbonbalancesinMidwesternUSagriculturalsystems.EcologicalApplications19:1102–1113.Sawyer,J.,Nafziger,E.,Randall,G.,Bundy,L.,Rehm,G.,andJoern,B.(2006).Conceptsandrationaleforregionalnitrogenrateguidelinesforcorn.PM2015.IowaStateUniversity,Ames,IA.Schepers,J.S.,Frank,K.D.,andBourg,C.(1986).EffectofYieldGoalandResidualSoilNitrogenConsiderationsonNitrogenFertilizerRecommendationsforIrrigatedMaizeinNebraska.JournalofFertilizerIssues3:133-139.Shapiro,C.A.,Ferguson,R.B.,Hergert,G.W.,Dobermann,A.R.,andWortmann,C.S.(2003).FertilizerSuggestionsforCorn–G174,UniversityofNebraska,Lincoln.Sheriff,G.(2005).EfficientWaste?WhyFarmersOver-ApplyNutrientsandtheImplicationsforPolicyDesign,ReviewofAgriculturalEconomics27:542-557.Smith,R.G.,Menalled,F.D.,andRobertson,G.P.(2007).Temporalyieldvariabilityunderconventionalandalternativemanagementsystems.AgronomyJournal99:1629-1634.StehfestE.andBouwman,L.(2006).N2OandNOemissionfromagriculturalfieldsandsoilsundernaturalvegetation:summarizingavailablemeasurementdataandmodelingofglobalannualemissions.NutrientCyclinginAgroecosystems74:207–228.Stuart,D.,Schewe,R.L.,McDermott,M.(2012).RespondingtoClimateChange:BarrierstoReflexiveModernizationinUSAgriculture.Organization&Environment25:308-327.USDA–NASS.UnitedStatesDepartmentofAgriculture–NationalAgriculturalStatisticsService.Availableat:http://www.nass.usda.gov.METHODOLOGY:VCSVersion3Copyright@2013MichiganStateUniversity54USDA–NRCS.(2011).UnitedStatesDepartmentofAgriculture–NaturalResourcesConservationService.ConservationPracticeStandard,Code590.NutrientManagement.December2011.USDA–NRCS.(2012).UnitedStatesDepartmentofAgriculture–NaturalResourcesConservationService.ConservationEffectsAssessmentProject(CEAP).AssessmentoftheEffectsofConservationPracticesonCultivatedCroplandintheUpperMississippiRiverBasin.189pages.July2012.Vanotti,M.B.,Bundy,L.G.(1994).Analternativerationaleforcornnitrogen–fertilizerrecommendations.JournalofProductionAgriculture79:243–249.Vitosh,M.L.,Johnson,J.W.,Mengel,andD.B.(1995)Tri-stateFertilizerRecommendationsforCorn,Soybeans,WheatandAlfalfa.MichiganStateUniversity,TheOhioStateUniversityandPurdueUniversity.ExtensionBulletinE-2567,July1995.MichiganStateUniversity,Lansing,Michigan.Warncke,D.,Dahl,J.,Jacobs,L.andLaboski,C.(2004).NutrientRecommendationsforFieldCropsinMichigan.Ext.Bull.E-2904,Mich.StateUniversity,EastLansing,MI.METHODOLOGY:VCSVersion3Copyright@2013MichiganStateUniversity55DOCUMENTHISTORYVersionDateCommentv1.05Mar2013Initialversionreleasedv1.130September2013Errorsinequations6and15andequationsG5andG6inAppendixGequationshavebeencorrected.

1、当您付费下载文档后,您只拥有了使用权限,并不意味着购买了版权,文档只能用于自身使用,不得用于其他商业用途(如 [转卖]进行直接盈利或[编辑后售卖]进行间接盈利)。
2、本站所有内容均由合作方或网友上传,本站不对文档的完整性、权威性及其观点立场正确性做任何保证或承诺!文档内容仅供研究参考,付费前请自行鉴别。
3、如文档内容存在违规,或者侵犯商业秘密、侵犯著作权等,请点击“违规举报”。

碎片内容

碳中和
已认证
内容提供者

碳中和

确认删除?
回到顶部
微信客服
  • 管理员微信
QQ客服
  • QQ客服点击这里给我发消息
客服邮箱