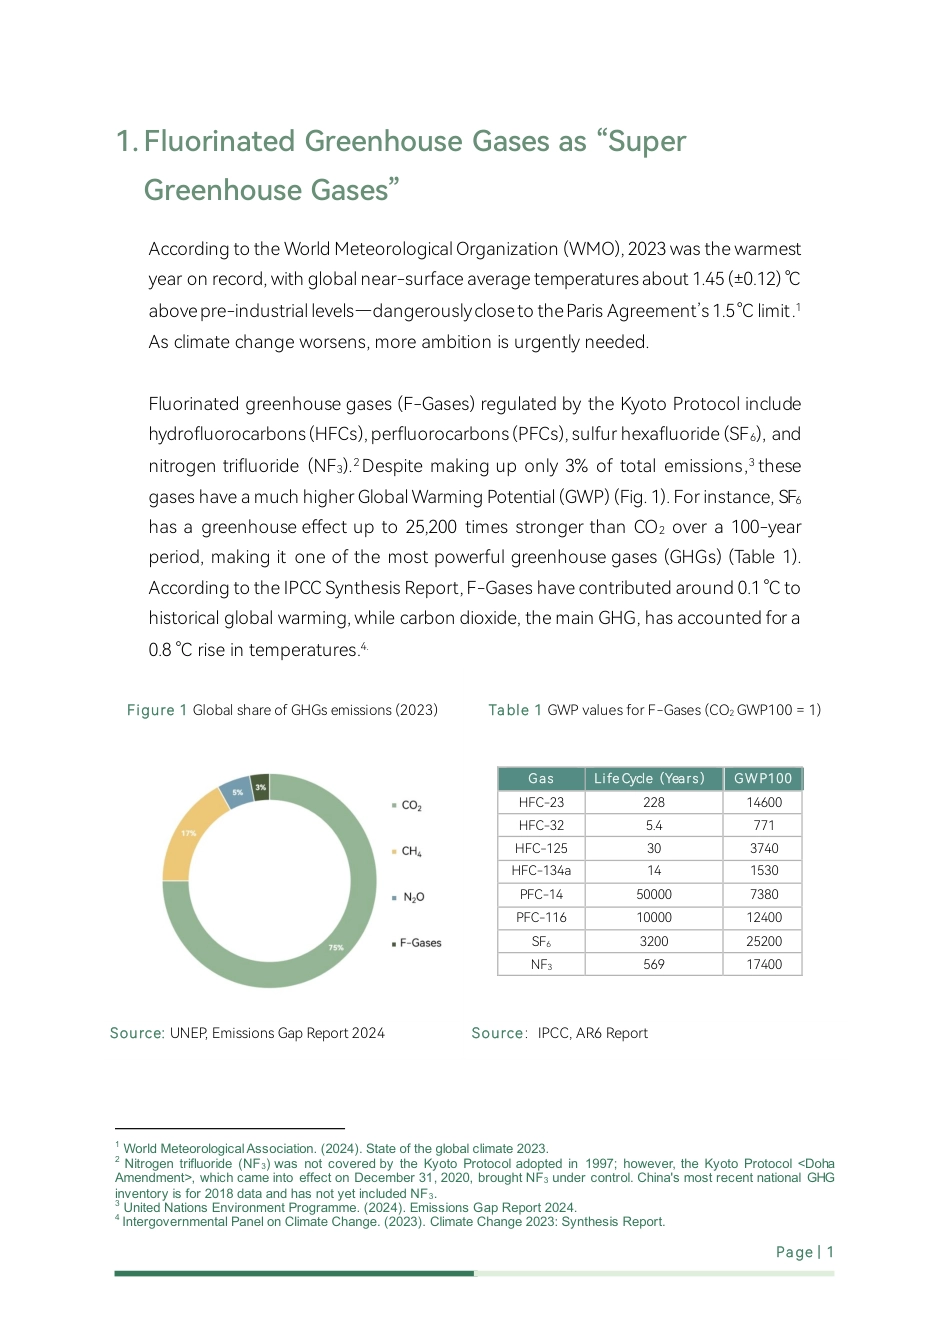
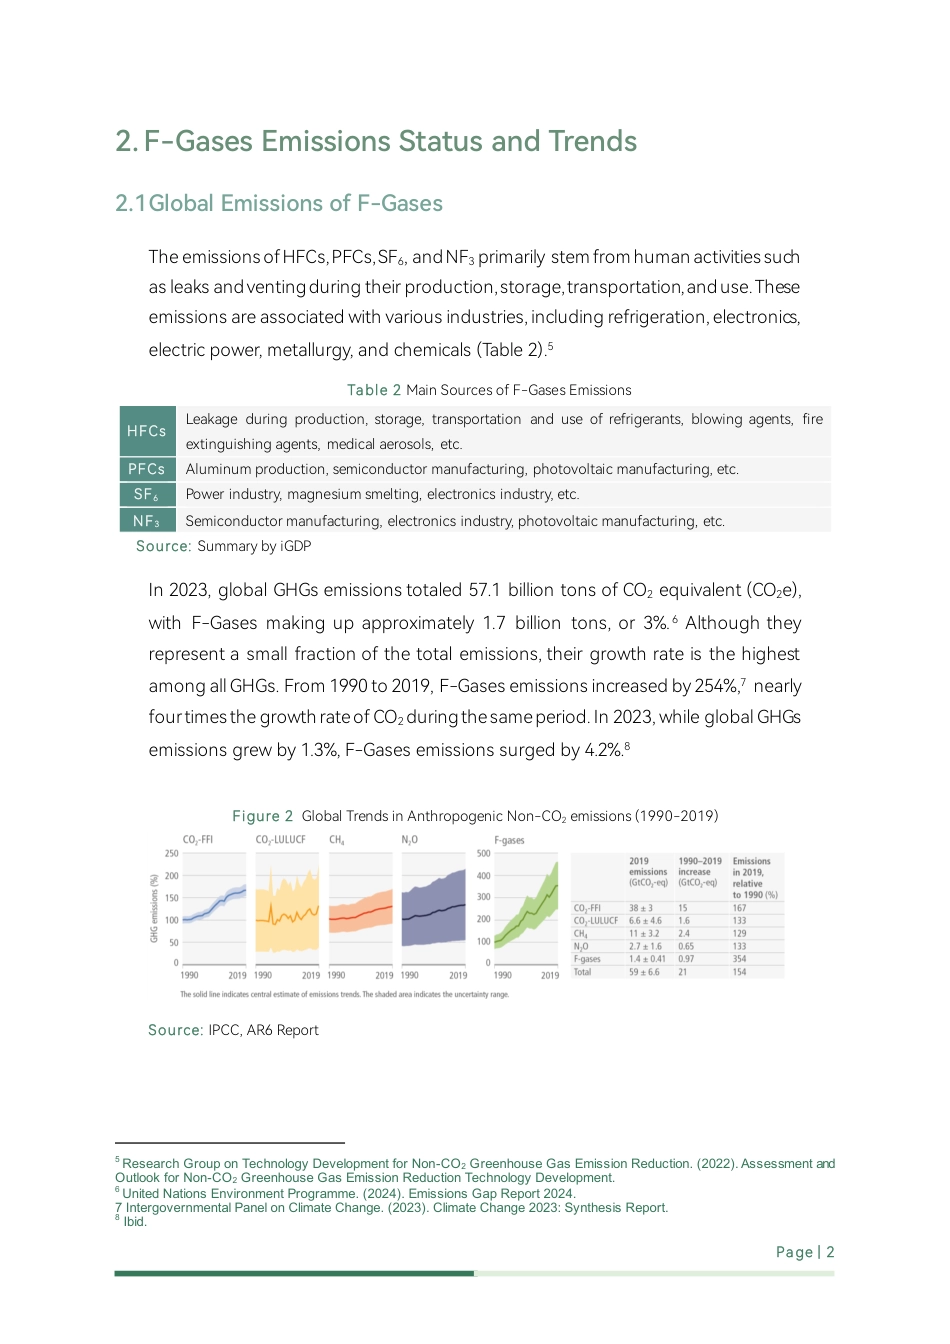
1Page|11.FluorinatedGreenhouseGasesas“SuperGreenhouseGases”AccordingtotheWorldMeteorologicalOrganization(WMO),2023wasthewarmestyearonrecord,withglobalnear-surfaceaveragetemperaturesabout1.45(±0.12)°Cabovepre-industriallevels—dangerouslyclosetotheParisAgreement’s1.5°Climit.1Asclimatechangeworsens,moreambitionisurgentlyneeded.Fluorinatedgreenhousegases(F-Gases)regulatedbytheKyotoProtocolincludehydrofluorocarbons(HFCs),perfluorocarbons(PFCs),sulfurhexafluoride(SF6),andnitrogentrifluoride(NF3).2Despitemakinguponly3%oftotalemissions,3thesegaseshaveamuchhigherGlobalWarmingPotential(GWP)(Fig.1).Forinstance,SF6hasagreenhouseeffectupto25,200timesstrongerthanCO2overa100-yearperiod,makingitoneofthemostpowerfulgreenhousegases(GHGs)(Table1).AccordingtotheIPCCSynthesisReport,F-Gaseshavecontributedaround0.1°Ctohistoricalglobalwarming,whilecarbondioxide,themainGHG,hasaccountedfora0.8°Criseintemperatures.4.Figure1GlobalshareofGHGsemissions(2023)Table1GWPvaluesforF-Gases(CO2GWP100=1)GasLifeCycle(Years)GWP100HFC-2322814600HFC-325.4771HFC-125303740HFC-134a141530PFC-14500007380PFC-1161000012400SF6320025200NF356917400Source:UNEP,EmissionsGapReport2024Source:IPCC,AR6Report1WorldMeteorologicalAssociation.(2024).Stateoftheglobalclimate2023.2Nitrogentrifluoride(NF3)wasnotcoveredbytheKyotoProtocoladoptedin1997;however,theKyotoProtocol<DohaAmendment>,whichcameintoeffectonDecember31,2020,broughtNF3undercontrol.China'smostrecentnationalGHGinventoryisfor2018dataandhasnotyetincludedNF3.3UnitedNationsEnvironmentProgramme.(2024).EmissionsGapReport2024.4IntergovernmentalPanelonClimateChange.(2023).ClimateChange2023:SynthesisReport.Page|22.F-GasesEmissionsStatusandTrends2.1GlobalEmissionsofF-GasesTheemissionsofHFCs,PFCs,SF6,andNF3primarilystemfromhumanactivitiessuchasleaksandventingduringtheirproduction,storage,transportation,anduse.Theseemissionsareassociatedwithvariousindustries,includingrefrigeration,electronics,electricpower,metallurgy,andchemicals(Table2).5Source:SummarybyiGDPIn2023,globalGHGsemissionstotaled57.1billiontonsofCO2equivalent(CO2e),withF-Gasesmakingupapproximately1.7billiontons,or3%.6Althoughtheyrepresentasmallfractionofthetotalemissions,theirgrowthrateisthehighestamongallGHGs.From1990to2019,F-Gasesemissionsincreasedby254%,7nearlyfourtimesthegrowthrateofCO2duringthesameperiod.In2023,whileglobalGHGsemissionsgrewby1.3%,F-Gasesemissionssurgedby4.2%.8Source:IPCC,AR6Report5ResearchGrouponTechnologyDevelopmentforNon-CO2GreenhouseGasEmissionReduction.(2022).AssessmentandOutlookforNon-CO2GreenhouseGasEmissionReductionTechnologyDevelopment.6UnitedNationsEnvironmentProgramme.(2024).EmissionsGapReport2024.7IntergovernmentalPanelonClimateChange.(2023).ClimateChange2023:SynthesisReport.8Ibid.HFCsLeakageduringproduction,storage,transportationanduseofrefrigerants,blowingagents,fireextinguishingagents,medicalaerosols,etc.PFCsAluminumproduction,semiconductormanufacturing,photovoltaicmanufacturing,etc.SF6Powerindustry,magnesiumsmelting,electronicsindustry,etc.NF3Semiconductormanufacturing,electronicsindustry,photovoltaicmanufacturing,etc.Figure2GlobalTrendsinAnthropogenicNon-CO2emissions(1990-2019)Table2MainSourcesofF-GasesEmissionsPage|32.2F-GasesEmissionsinChinaIn2018,Chinaemitted284milliontonsofCO2efromF-Gases(excludingNF3),whichrepresentedaboutaquarterofglobalF-Gasesemissionsand2.2%oftheco...


 VIP
VIP VIP
VIP VIP
VIP VIP
VIP VIP
VIP VIP
VIP VIP
VIP VIP
VIP VIP
VIP VIP
VIP