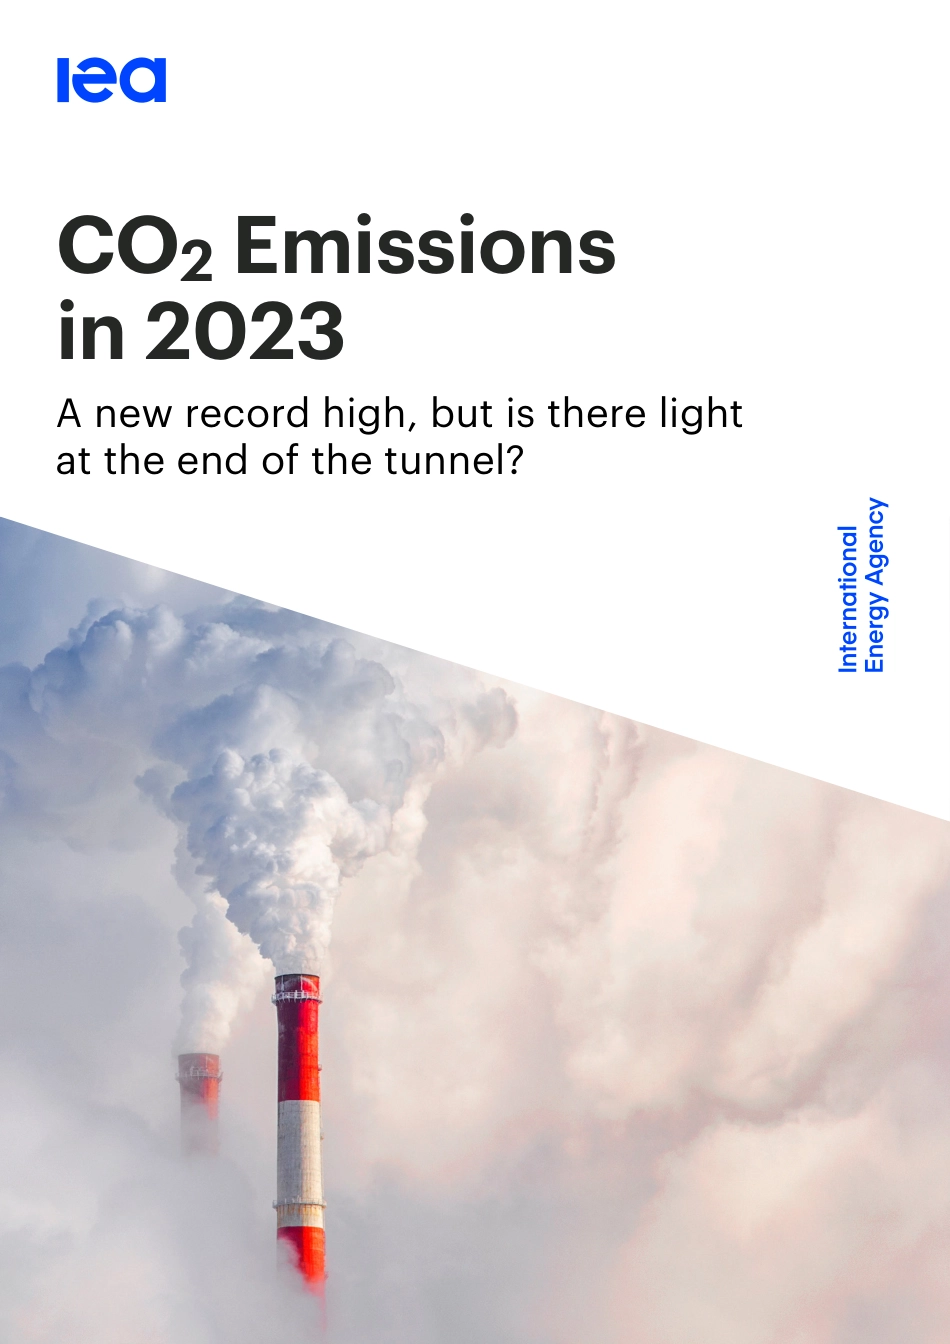
CO2Emissionsin2023Anewrecordhigh,butistherelightattheendofthetunnel?TheIEAexaminesthefullspectrumofenergyissuesincludingoil,gasandcoalsupplyanddemand,renewableenergytechnologies,electricitymarkets,energyefficiency,accesstoenergy,demandsidemanagementandmuchmore.Throughitswork,theIEAadvocatespoliciesthatwillenhancethereliability,affordabilityandsustainabilityofenergyinits31membercountries,13associationcountriesandbeyond.Thispublicationandanymapincludedhereinarewithoutprejudicetothestatusoforsovereigntyoveranyterritory,tothedelimitationofinternationalfrontiersandboundariesandtothenameofanyterritory,cityorarea.Source:IEA.InternationalEnergyAgencyWebsite:www.iea.orgIEAmembercountries:AustraliaAustriaBelgiumCanadaCzechRepublicDenmarkEstoniaFinlandFranceGermanyGreeceHungaryIrelandItalyJapanKoreaLithuaniaLuxembourgMexicoNetherlandsNewZealandNorwayPolandPortugalSlovakRepublicSpainSwedenSwitzerlandRepublicofTürkiyeUnitedKingdomUnitedStatesTheEuropeanCommissionalsoparticipatesintheworkoftheIEAIEAassociationcountries:ArgentinaBrazilChinaEgyptIndiaIndonesiaKenyaMoroccoSenegalSingaporeSouthAfricaThailandUkraineINTERNATIONALENERGYAGENCYCO2Emissionsin2023PAGE|3IEA.CCBY4.0.ExecutiveSummary•Globalenergy-relatedCO2emissionsgrewby1.1%in2023,increasing410milliontonnes(Mt)toreachanewrecordhighof37.4billiontonnes(Gt).Thiscompareswithanincreaseof490Mtin2022(1.3%).Emissionsfromcoalaccountedformorethan65%oftheincreasein2023.•Theglobalshortfallinhydropowergenerationduetodroughtsdroveupemissionsbyaround170Mt.Withoutthiseffect,emissionsfromtheglobalelectricitysectorwouldhavefallenin2023.•Between2019and2023,totalenergy-relatedemissionsincreasedaround900Mt.Withoutthegrowingdeploymentoffivekeycleanenergytechnologiessince2019-solarPV,wind,nuclear,heatpumps,andelectriccars-theemissionsgrowthwouldhavebeenthreetimeslarger.•Thankstogrowingcleanenergydeployment,emissionsareseeingastructuralslowdown.Inthedecadeto2023,globalemissionsgrewslightlymorethan0.5%peryear,theslowestratesincetheGreatDepression.•AdvancedeconomyGDPgrew1.7%butemissionsfell4.5%,arecorddeclineoutsideofarecessionaryperiod.Havingfallenby520Mtin2023,emissionsarenowbacktotheirleveloffiftyyearsago.Advancedeconomycoaldemand,drivenbyevolutionsintheG7,isbacktothelevelofaround1900.The2023declineinadvancedeconomyemissionswascausedbyacombinationofstructuralandcyclicalfactors,includingstrongrenewablesdeployment,coal-to-gasswitchingintheUS,butalsoweakerindustrialproductioninsomecountries,andmilderweather.•EmissionsinChinagrewaround565Mtin2023,byfarthelargestincreasegloballyandacontinuationofChina’semissions-intensiveeconomicgrowthinthepost-pandemicperiod.However,Chinacontinuedtodominateglobalcleanenergyadditions.Cyclicaleffects,notablyahistoricallybadhydroyear,contributedaboutone-thirdofitsemissionsgrowthin2023.PercapitaemissionsinChinaarenow15%higherthaninadvancedeconomies.•InIndia,strongGDPgrowthdroveupemissionsbyaround190Mt.Butaweakmonsoonincreaseddemandforelectricityandcuthydroproduction,contributingaroundone-quarteroftheincreaseinitstotalemissionsin2023.PercapitaemissionsinIndiaremainfarbelowtheworldaverage.CO2Emissionsin2023PAGE|4IEA.CCBY4.0.Emissionsgrewin2023,butcleanenergyislimitingthegrowthEmissionsincreasedin2023Totalenergy-relatedCO2emissionsincreasedby1.1%in2023.Farfromfallingrapidly-asisrequiredtomeettheglobalclimategoalssetoutin...


 VIP
VIP VIP
VIP VIP
VIP VIP
VIP VIP
VIP VIP
VIP VIP
VIP VIP
VIP VIP
VIP VIP
VIP