CONTENTSDEMANDELECTRICITYRENEWABLESFOSSILFUELSFINANCEPOLICYEMISSIONSREGIONSAPPENDIXENERGYTRANSITIONOUTLOOK2023Aglobalandregionalforecastto2050CONTENTSDEMANDELECTRICITYRENEWABLESFOSSILFUELSFINANCEPOLICYEMISSIONSREGIONSAPPENDIXDNVEnergyTransitionOutlook2023FOREWORDspaceofasinglegeneration.Weforecasta13-fold2increaseinsolarandwindelectricityproductionbyIf'energytransition'meanscleanenergyreplacesfossilenergyinabsoluteterms,thenthemid-century.Electrificationwillmorethandoubletransitionhasnottrulystarted.Thetransitionhashappenedinsomeregionsandformanybetweennowand2050,bringingefficienciestothecommunitiesandindividuals,butglobally,recordemissionsfromfossilenergyareoncourseenergysystem,which,aswedetailinthisreport,tomoveevenhighernextyear.Uptothepresent,renewableshavemetsome,butnotall,ofbringsdownthecostperunitofenergyforconsumerstheworld’sadditionalenergydemand.Optically,thetransitionseemstobeinstallmode,withinthelongerrun.However,inthecomingtenyears,ahighoilandgaspricesfuellinganexplorationsurgewhilemanyrenewableprojectsarecriticalissueishowquicklythatcanhappenwithalackexperiencinganincreaseincostduetoinflationaryandsupply-chainpressures.ofelectricgridsandrenewablesupply-chaincapacityemergingascriticalbottleneckstoafastertransition.So,whenwilltherealglobaltransitionbegin?OurseenincreasedattentiontorenewableprojectsinAndafastertransitionismostdefinitelyneededpredictionisthatemissionsfromoilusewillpeakinmostplaces,asdomestically-sourcedenergyisharderbecauseour‘mostlikely’forecastforourenergyfuture2025andthosefromnaturalgasin2027.EVuptakeandtodisruptandmanygovernmentsarelookingatthroughto2050translatesintoglobalwarmingofsolarPVinstallations,bothofwhicharenowatrecordnuclearwithrenewedinterest.2.2°Cbytheendofthiscentury.levels,aresettocontinuestrongly.Moreover,theFitfor55andRePowerEUpoliciesintheEUandtheInflationLocalsourcingofbothenergyandenergyinfra-Achievinganet-zeroenergysystemby2050tosecureReductionActintheUSarealreadydemonstratingstructureisemergingasaprominentnationala1.5°Cwarmingfutureismoredifficultthanever.powerfullythatdecarbonizationpoliciescanworkobjective.Thisyear,ourresearchteamhasrevisedourThatdoesnotmeanweshouldnotbeaimingforonagrandscale.Inourforecast,non-fossilsourcespowersectorforecasttobetterreflecttheexistingthattarget.Withmoreexpansivepoliciespromotingconstitute52%oftheenergymixin2050,asharpandfuturewillingnessofcountriestopayapremiumrenewableelectricityandotherzero-carbonsolutions,increasefromthe20%theyrepresenttoday.forlocally-sourcedenergy—andthathasnotablynotjustinthehigh-incomeworld,butglobally,weimpactedourresults.Forexample,fortheIndianhavethemeanstokeeptheworldontracktobeat,WehavefrequentlyusednumberstoplaceaSubcontinentwenowforecastaslowertransitionorverynear,netzerobymid-century.dimensionontwocornersoftheenergytrilemma:withmorecoalintheenergymix,andinEuropetheaffordability(suchaslevelizedcostandprices)andtransitionisacceleratingwiththealignmentofclimate,RemiEriksensustainability(suchascarbonemissionsintensity).Soindustrial,andenergysecurityobjectives.GroupPresidentandCEOfar,thethirdcornerofthetrilemma—energysecurityDNV—hasbeenlargelyviewedinaqualitativeway.IntheShort-termenergyforecastinghasbeenathanklesspast18monthstheworldhasexperiencedtheconse-taskintherecentcontextofthepandemic,war,andquencesofthe‘grabforgas’inthewakeofRussia’spriceshocks.However,withinoursystem-dynamicsinvasionofUkraineandthereversiontocoalinsomeapproach,thelonglinesofdevelopmentareclear:regionsasacheaperalternativetogas.WehavealsotheenergylandscapewilllookverydifferentintheCONTENTSDEMANDELECTRICITYRENEWABLESFOSSILFUELSFINANCEPOLICYEMISSIONSREGIONSAPPENDIXDNVEnergyTransitionOutlook2023HIGHLIGHTSThetransitionisstillattheRenewablesoutsprintfossilsfrom—From2025onwards,almostallnetnewcapacity—Coalusepeakedin2014buthascomeclosetothatstartingblocksthemid-2020saddedisnon-fossil.Windandsolargrowten-foldlevelinrecentyears.However,itsshareofprimaryand17-fold,respectively,between2022andenergyfallsfrom26%todayto10%in2050—Globalenergy-relatedemissionsarestillclimbing—Thetransitioninvolvesboththeadditionof2050andareonlylikelytopeakin2024.Thatiseffec-renewablesandtheremovaloffossilsources—Fossilprimaryenergydemanddeclinesfromtivelythepointatwhichthetransitionbegins,(Figure1)—Overthenextdecade,newfossilproductionin490EJto314EJby2050.Cumulatively,thefossileventhoughacrossmanynationsandcommunities,low-andmedium-incomecountrieswilllargelyenergynotusedcomparedwithtoday'suseenergy-relatedemissionshavealreadystarted—Itwilltakethenext27yearstomovetheenergybenullifiedbyreductionsinhigh-incomeamountsto1,673EJor275,000millionbarrelsoftofallmixfromthepresent80%fossil20%non-fossilcountriesoilequivalentby2050splittoa48%:52%ratiobymid-century—Overthelastfiveyears(2017–2022)renewableshavemet51%ofnewenergydemandandfossilsources49%.Inabsoluteterms,fossil-fueluseisstillgrowing—The‘grabforgas’inthewakeofRussia’sinvasionofUkraine,andthedisruptionoftheoilmarket,hasledtohighpricesandasurgeinnewoilandgasprojects—Highgaspriceshavealsoseenseveralcountriesintensifycoal-firedpowergenerationoverthelast18months,drivingemissionsyethigher.Naturalgasislosingitsstatusasa‘bridgingfuel’forthetransition3CONTENTSDEMANDELECTRICITYRENEWABLESFOSSILFUELSFINANCEPOLICYEMISSIONSREGIONSAPPENDIXDNVEnergyTransitionOutlook2023HIGHLIGHTSEnergysecurityismovingtothetopof—ThistrendisfavouringrenewablesandnuclearProgressivepolicyismaking—IntheEU,theEUGreenDeal,REPowerEU,andFittheagendaenergyinallregionsandcoalinsomeregionsanimpactfor55policypackagesmakeEurope’snet-zerogoalmorerealistic—Geopoliticaldevelopmentsoverthelast18—Wehavenowfactoredintoourpowersector—Bigdecarbonizationpolicypackagesrolledoutmonthshavebroughtenergysecurityintosharpforecastthewillingnessofgovernmentstopayainthelastyeararesuperchargingthetransition—Shippingissetforafastertransitionduetothefocuswiththedisruptionofenergysuppliesandpremiumofbetween6%and15%forlocally-regionallyandnudgingitforwardgloballyinclusioninEU’semissiontradingsystemandthepriceshocksforenergyimporterssourcedenergyIMO’sambitiousnewdecarbonizationstrategy—TheInflationReductionActisacceleratingtheaimingfornetzeroby2050—Worldwide,energyproducedlocallyisbeing—Reshoringandfriend-shoringpoliciesareaddingtransitionintheUS,withUSD240bnalreadyprioritizedoverenergyimportstosupplychaincomplexitiesandcostsalreadycommittedincleaninvestmentsinresponseto—The‘racetothetop’incleantechnologyamongststrainedbyinflationthebroadarrayofincentivesundertheActtheadvancedeconomieswilldrivegloballearningbenefitsine.g.hydrogenandcarbonFIGURE3—2022sawanincreaseinthelevelizedcostofcaptureandstoragetechnologiesEnergytrilemmarenewablesinseveralregions,particularlywithwindprojects,butweexpectcostreductionsto—ThescalingofcleantechinadvancedeconomiesSECURITYreturntohistoriclearningcurveratesby2028willonlypartlybenefitmedium-andlow-incomeregionswhereeconomicdevelopmentand—Inthelongterm,energysecurityandsustainabilityotherSDGsareprioritized.De-riskedfinancingiswillpullinthesamedirection,withdecarbonizingneededtoacceleratethepaceofthetransitionenergymixes—withwind,solar,andbatteriesasbeyondleadingregionsthemainsources—increasinglyshieldingnationalenergysystemsfromthevolatilityoftheinter-nationalenergytradeAFFORDABILITYSUSTAINABILITY4CONTENTSDEMANDELECTRICITYRENEWABLESFOSSILFUELSFINANCEPOLICYEMISSIONSREGIONSAPPENDIXDNVEnergyTransitionOutlook2023HIGHLIGHTSGridlockimpedingthenear-termexpansion—Theglobalgrid—transmissionanddistributionGlobalemissionswillfall,butnot—From2024,theshareofrenewablesintheprimaryofdecarbonizationtechnologiescombined—willdoubleinlengthfrom100millionfastorfarenoughenergymixwillgrowbymorethanonepercentage-circuit-km(c-km)in2022to205millionc-kminpointperyear,resultingina52%non-fossilshare—Despiteinflationaryandsupply-chainheadwinds,2050tofacilitatethefastandefficienttransferof—Weforecastglobalenergy-relatedCO2emissionsby2050,upfrom20%todaysolarinstallationsreachedarecord250GWinelectricity.However,inthenearterm,transmissionin2050tobe46%lowerthantoday,andby2030,2022.Windpowercontributed7%ofglobalanddistributiongridconstraintsareemergingemissionsareonly4%lowerthantheyaretoday—Thepaceofthetransitionisfarfromfastenoughgrid-connectedelectricityandinstalledcapacityasthekeybottleneckforrenewableelectricityforanet-zeroenergysystemby2050.Thatwouldwilldoubleby2030expansionandrelateddistributedenergyassets—Theemissionsweforecastareassociatedwithrequireroughlyhalvingglobalemissionsby2030,suchasgrid-connectedstorageandEVcharging2.2°Cofglobalwarmingabovepre-industrialbutourforecastsuggeststhatambitionwillnotpointsinmanyregions,includingtheUS,Canada,levelsbytheendofthiscenturyevenbeachievedby2050andEurope—Limitingglobalwarmingto1.5°Cisthereforeless—Ourforecastfactorsintheimpactoflagginglikelythanevergridcapacityinthenear-andmedium-termonbuild-outratesofrenewables—Whileemissionsrise,theconsequencesofclimatechangearebecomingmorevisibleandimpactful,—BoththeEUandtheUSareadvancingpoliciestowithextremeweathereventsbecomingmoreaddresspermittingdelays,butadeeperpolicyfrequentanddamagingresponseisneeded,whichmayencompassexpro-priationandfinancingtoeasecablemanufacturingproductionconstraints—Gridexpansionisalsoimportantfortheproductionofhydrogen,whichinturnisdependentonmorerobustdemand-sidemeasuretoincentivizeofftake5CONTENTSDEMANDELECTRICITYRENEWABLESFOSSILFUELSFINANCEPOLICYEMISSIONSREGIONSAPPENDIXDNVEnergyTransitionOutlook2023ENERGYSECURITYANDASHIFTINGGEOPOLITICALSlowbalization:lessinternationalLANDSCAPEtradeandmorefocusonnationalenergysecurity,supplychains,Globalization—thefreeflowofideas,people,goods,services,andcapital—arguablyandlocalmanufacturingstartedinearnestinthe19thCenturyoncesteamshipsruledthewaves(O’RourkeandWilliamson,2000).SincetheendofWorldWarII,spurredonbytechnologicalprogressTheworldeconomyhasentereda'slowbalization'andtheso-called'longpeace'inthepost-wardecades,thetrendofmovingthingsphasedatingbacktothe2007-2008financialcrisis,betweennationshasgrownalmostfour-fold,asameasureoftraderelativetoglobalcharacterizedbyaslowdowninthepaceofinter-GDP(Aiyaretal.,2023).TheendoftheColdWar,thechangeinChineseeconomicpolicy,nationaltradeandweakeningpoliticalsupportforandthecreationoftheWorldTradeOrganization(WTO)in1995,allboostedglobaltrade,opentradeinashiftinggeopoliticallandscape.withmedium-incomecountriesandregionslikeChina,SouthEastAsia,andLatinAmericaThereisheightenedfocusonreshoringofproductionbenefittingeconomically,withwidespreadgainsinpovertyreductionandimprovedand,ofrelevancetoourforecast,thisoftenaddstolivelihoods.thecostofenergyCAPEXeverywhere.Againstthisbackdrop,theworldhasnowenteredTheCOVID-19pandemicrevealedsupply-chain6aperiodofslowerexpansionofcross-bordercoop-vulnerabilitiesthatdecadesofglobalizationhaderationandtradethatstarted15yearsagowiththecreated.Theseincludedthepursuitofa‘better,financialcrisis.Thisissometimesreferredtoas'slow-cheaper,faster’mindset,anover-relianceonarela-balization'.Duringthisperiod,trademeasuredasativelyfewmanufacturinghubs,alackofvisibilityintofractionofGDPplateaued.Wehavealsowitnessedsupply-chaindynamics,andinexperienceinresilientamorechargedgeopoliticallandscapetriggeredsourcingfromadiversityofsuppliers.Initially,coun-byseveralsignificantevents,suchastheannexationtriescompetedforaccesstomedicalsuppliesduringofCrimeabytheRussianFederationin2014,thethepandemic,butothershortagesemergedrapidlyforeignpoliciespursuedbyPresidentTrump,theduetoshiftsindemand,labourshortages,andCOVID-19pandemic,andthewarinUkraine.otherstructuralfactorsduringthelongmonthsofEventhoughtheannexationofCrimeain2014lockdown.Inthepost-pandemicperiodtherehasreinforcedtheUS-Europealliance,italsohighlightedbeenarushtodiversifysupplychains,boostvisibilitysomeareasofdivergencewithinthealliance.Earlythroughdigitalization,andaddressvulnerabilities,warningsaboutthedependenceofsomeEuropeannotleastcybersecurity.Atthesametime,govern-countriesonRussianenergysupplieswentlargelymentshaveturnedtopolicyincentivestolaunchorunheededbutwereindeedprophetic.returnproductiontotheirhomelands(West,2022).CONTENTSDEMANDELECTRICITYRENEWABLESFOSSILFUELSFINANCEPOLICYEMISSIONSREGIONSAPPENDIXDNVEnergyTransitionOutlook2023EnergytrilemmaInparticularlysensitiveareas,forexampleTheeffectontheenergytransitionoilprojectsthatcarrytheriskoflockingcountriesintomicrochipmanufacturing,governmentsstartedEnhancingsecurityofsupplyisachievablethroughacarbon-intensiveenergysystemforyearstocome.Theenergytrilemmadescribestheattempttodraftinglegislationtosecuresupplybyboostingincreasingdomesticenergyproduction,diversi-balanceenergysecurity,equity(accessibleanddomesticR&Dandproduction.ficationofenergysourcesinthesupplymix,orIncreasedsupply-chaincostscausedbydisruptionsaffordable),andenvironmentalsustainability.diversificationgeographicallybyusingavarietyofintheproductionanddeliveryofintermediateSincethesigningoftheParisAgreementandtheAnxietyoverbrittlesupplychainswasfurthersuppliersandtransportationroutes.goods,likesteelandcomputerchips,havechal-rapidadvanceofrenewableenergy,thequestincreasedafterRussia’sinvasionofUkraineinlengedglobalmanufacturingsupplychainsand,toreduceemissionshasbeeninthespotlight.February2022.ThewarinstantlyimperilledfoodEnergysecuritygenerallypullsinfavourofrenewablecombinedwithimporttariffs,havecreatedanewHowever,energysecurityisnowmovingtosecurity,bothdirectlyandthroughthecurtailmentenergyastheobvious,lowcost,nationally-availablesituationforglobaltrade.Renewablesprojects,withcentrestageduetotheshiftinggeopoliticaloffertilizersupplies,andraisedvulnerabilitiesinresource.Nuclearenergyissimilarlyfavoured,buttightermarginsthanmanyoilandgasprojects,havelandscapeandescalatingtensionsinsomeseveralsupplychains.However,theprincipalimpactenergysecuritycanalsoslowthetransitionifbeendisproportionatelyaffectedbythischainofregionswherecontroloverenergyisbeingofthewarhasbeenitsdisruptionofglobalenergycountriesturntoavailablefossilresourcestoaddressevents,leadingtoariseincostofsomerenewableusedasameanstoachievepoliticalends.supplychains.GiventhatRussiaisEurope'smainenergyshortfalls.projectsandattendantdelaysand,insomenotablesupplierofnaturalgas(around45%ofimportscases,failedauctions.SECURITYin2021),thewarraisedseriousconcernsaboutSomeoftheemergingtrendsinclude:energysecurityinEurope.FearsofsupplycutsasNuclearisinvoguethankstothechangesintheENERGYEuropelookedforalternativegassuppliesledtoAsurgeinenergypricesresultingfromRussia’sgeopoliticallandscapeandfocusonenergysecurityTRILEMMArecordincreasesinenergypricesandglobalmarketinvasionofUkrainehascertainlymaderenewablethathavemadenuclearenergyamoreattractiveimbalancesanddisruption.Thesituationpromptedenergymorecompetitive.However,ithasalsooptionforsomecountries,sendinguraniumpricesAFFORDABILITYSUSTAINABILITYEuropetoexpediteitseffortstowardsenergydiversi-puteconomicpressureonmanyhouseholdsandtotheirhighestlevelsincetheFukushimaaccident.ficationandgreenenergytransition,focusingonbusinesses,leadingtoenergypovertyinsomeWhileweseeconcretelife-extensionprogrammes,renewableenergyandenergyefficiencymeasures.caseswhichhaspreventedordelayedinvestmentitisalsolikelythattherewillbeaslightlybroaderincleantechnologylikeelectricvehicles(EVs)anduptakeofnuclearenergy.HowbigthiswillbeThislongchainofevents,culminatingintheheatpumps.Atanationallevel,manylow-anddependsonhownuclearmanagestosolvesomeenergysupplyshockof2022,hasembeddedamedium-incomecountriesthatwerepreviouslyofthesamechallengesithasfacedbefore,suchshiftininternationalrelationsandusheredinandependentonimportingnaturalgashavehadtoascostoverruns,safetyconcerns,wastehandling,erawhereenergysecuritybecomestheprimaryswitchtolocalenergyresources,suchascheaperpublicopinion,andtheproliferationrisksassociatedfocusintheenergytrilemma(seesidebar).Energycoal,inordertosecureenergysupply.withapotentialhigheruptake.Generalenergysecurityconcernsdifferanddivergeacrossregions.securityconcernsare,however,likelytoaccepttheEnergyimportingregionswillfavourresourcesInvestmentinenergyinfrastructure,includingenergyhighercostsofnuclear,whichleadstoaslightlythatarelocallyavailableoraccessiblefromreliablestorageandsmartgridtechnology,isadvancingthehigheruptake.partners;exportingcountrieswillhavetoconvincedeploymentofrenewableenergy.However,thetighttheirpartnersthattheyareatrustworthy,long-termmarketforfossilfuelsandhighpricesforoilandgas7sourceofsupply.hasalsoledtoasurgeinCONTENTSDEMANDELECTRICITYRENEWABLESFOSSILFUELSFINANCEPOLICYEMISSIONSREGIONSAPPENDIXDNVEnergyTransitionOutlook2023AprotectionistpolicyshifttowardsnationalenergyInsomecases,energyresourceswhicharepredomi-8policiesthatprioritizeenergysecurity,resilience,nantlyimportedarebeingpenalizedordeprioritized,andindependencecouldpotentiallyspeeduptheevenifshort-termeconomicsfavourthosesources.energytransition,ascountriesinvestmoreinlocallyTheprioritizationofenergyresourcesdependsonavailablerenewableenergysources.However,ittheavailabilityofdifferentenergyresourceswithinalsoriskspromotingprotectionistpoliciesthatcouldacountry’sbordersandontechnologicalknow-howhinderglobalcooperationontechnologytransfer,andavailabilityofaqualifiedworkforce.R&D,andactiononclimatechange.ThisbehaviourismostpronouncedinthepowerSocietalresponsestoinflationandthecost-of-sector,andwehavethereforemadedirectchangeslivingcrisishavestokedsocialunrestwhichcouldinourpowersectormodellingtoreflectenergydelaytheenergytransitionasthefocusshiftstosecurityconsiderations.Thesechangesincludetheshort-termpriorities.Conversely,itispossiblethatprioritizationofbothlow-carbonandfossil-basedpublicsentimentcouldfavourenergyindependenceenergyresources.Forexample,regionssuchasthroughrenewablesandnuclearandtheacceptanceEuropewillprioritizenuclearandrenewables,whileofhigherenergypricesasstrategicmeanstosecuretheIndianSubcontinentwillprioritizedomesticallyenergyindependence.availablecoal.HowweincorporateenergysecurityandInputstotheETOmodelling:geopoliticaltrendsintoourforecastWehaverevisedtheregionalpolicysupportofInourview,thegeopoliticalchangesandenergydifferentelectricitygeneratorsinourETOmodelsecuritydescribedabovehaveadirectimpactontoreflectsupportlevelsdirectlyobservedforthetheenergytransitionandwehavethereforetakenyear2022.Thesesupportlevelsarethenprojectedinitialstepstofactorthisintoourforecastoftheforwardtoreflectanongoingattentiontoenergymostlikelyenergyfuture.Threekeyshiftshavesecurityconsiderationsrangingbetween6%tobeenconsidered,andwearticulateeachonesepa-15%globallybetween2023and2050forallpowerratelywithrespecttotheirqualitativeorquantitativegenerationsources.Thesupportlevelsvarytempo-impactonourforecastingmodel.rallyandregionally,asstatedabove,withsomeregionsfavouringnon-fossilsourcesandothersfossilEnergysecurityconsiderationsinthepowersectorsources.Weacknowledgethedifficultiesofdisag-Weseenations/regionsincreasinglywillingtogregatingenergysecurity-basedsupportfrom,forsupportdomesticenergyresourcestocurbtheirexample,decarbonizationsupport.Adjustmentstodependenceonuncertainenergyimportsandtoourmodelinthisregardwillthereforebesubjecttohedgeagainstthepotentialweaponizationofenergy.ongoingresearch.CONTENTSDEMANDELECTRICITYRENEWABLESFOSSILFUELSFINANCEPOLICYEMISSIONSREGIONSAPPENDIXDNVEnergyTransitionOutlook2023Impactsontheforecastresults:supplychainsanddomesticmanufacturingtoreducesinglemanufacturinghubandboostsupplychainseveralstudiesdocumentingthattheenergyToassesstheimpactofthesenewenergysecuritydependenceonsuppliesfromoneregion.resilience(TheEconomist,2023).Forexample,transitionismineral-andmetal-intensivefactors,comparedlastyear'sforecast(whichdidwearelikelytoseesomeproductionmoving(WorldBank,2020;IRENA,2023a).notfactorinenergysecuritydirectly)withwhatweInputtotheETOmodelling:outofChinatootherneighbouringcountriesinconsiderthemostlikelyfuturethisyear.WehaveconsideredtheimpactofreshoringenergySouthEastAsiaandtheIndianSubcontinent;inThemajorshiftweforecastisatransitionfromtechnologymanufacturinginfrastructureasashort-otherinstances,domesticmanufacturingstrat-aworldwhereenergyisextractedinahandfulOnaglobalaggregatedscale,thedifferenceintermcostincreaseof10%onthecapacitycostsofegiesarepursued,combinedwithstrategictradeofnationsandtradedoverlongdistancestotheprimaryenergydemandisabout5%.However,thatwind(bothonshoreandoffshore),solar,andLi-ionpartners;otherupstreaminitiativesareaimedatrestoftheworld,toasituationwhereenergyisattributablemostlytotherevisedandhigherpopu-batteriesinEuropeonly.Thecostincreasegraduallysecuringaccesstorawmaterialsources.Allofthisisproducedlocally,largelybyrenewables,andlationforecastfromWIC(2023).Overall,thechangerisesfrom2023andreachesamaximumof10%inisreflectedinmoderatelychangingmanufacturingconsumedlocallyintheformofelectricity.Ourintheglobalsharesofnaturalgas,coal,renewables,theyear2028beforereturningtozerocost-increasevolumeeffectsinourmodel,wherethemanufac-forecastisthatelectrificationwillmorethandoubleandnuclearareminimalin2050.Theeffectsofenergyby2033.turingsectoroutputisreducedinsomeregionsoverthenext30years.Thistrendhasintensifiedsecurityconsiderationsaremorepronouncedataanddivertedtoothers.Theimpactonglobalinrecentyearsowingtoenergysecurityconcernsregionalandpowergeneratorlevel.WhiletheshareWeonlyconsiderthisimpactasacostforreshoringmanufacturingenergydemandofvolumeshiftswhichmilitateagainstdependenceonenergyofnuclearinglobalprimaryenergyconsumptionforEuropebecause,giventheexistingregion-isminimal,asthecarbonintensityoftheregionalthroughtranscontinentalpipelinesandtrans-oceanincreasesfrom5%to6%in2050,betweenthetwodifferentiatedtechnologycoststhatweinputtothemanufacturingsubsectorsdoesnotdiffermarkedlyshipment.That,inturn,haspromptedustodirectlyforecasts,Europe’snuclearelectricitygenerationinmodelfortheabove-mentionedenergytechnologies,andthedivertedvolumesrelativetototalmanufac-factorin‘energysecurity’asadriverofchangein2050increasesfrom647TWh/yrto724TWh/yr,aitisuncertainwhetherthesecostincreaseswillturingissmall.Theimpactinindividualregionsisthecomingenergyfuture.12%increase.InGreaterChina,bothcoalandnuclearmanifestforotherregions,suchasNorthAmerica,lowtomoderatedependingonthesizeofexistingincreaseby19%and41%,respectively,fromlastyear’swhosehigher-than-global-averagecosts(basedonmanufacturingsectorvolumes.Weexpectafuturewithafarwidermixofforecasttothisyear’swhilethereislessbiomassandpre-existingmarketfactors)alreadyreflectsomeofenergysourcesandforenergyefficiencywinddeployed.In2050,theIndianSubcontinenthasthereshoringcosts.Conclusiontoplayancentralroleowingtowidespreadalmost500TWh/yrmorecoalelectricityinourmostSecuringaccesstoenergyhasbeenaperennialelectrification.likelyfuturethanlastyear’sforecast.Impactsontheforecastresults:anddramaticfeatureoftheenergylandscapeThecostincreaseonwind,solar,andLi-ionbatteriessincethe19thCentury.Oilhasbeeninstrumental9ReshoringenergytechnologymanufacturinginEuropedoesnothaveasignificantimpactoninshapingthegeopoliticsofthe20thCentury,notinfrastructureEurope’sortheworld’senergytransition.IntheleastbyfuellingconflictsandprofoundlyshapingThesecondenergysecurityshiftwehaveconsideredcomingyearswemay,onthebasisofnewobser-thecourseofmajorwars.Goingforward,weexpectissecuringaccesstocriticalenergyinfrastructurevations,considersuchcostincreasesonrestoftheafuturewithafarwidermixofenergysourcesandwithintheregionalenergysystemandtheresultingworldaswell.forenergyefficiencytoplayanoutsizedroleowingshort-termincreaseincostoftheenergyinfra-towidespreadelectrification.DanielYerginrecentlystructure/technology.AnexampleisbuildingRegionalrestructuringoftheglobaleconomycharacterizedthisshift,itisoneinvolvingamovealternativelocal/nationalsupply-chains(e.g.forThereisanacceleratingshiftinsourcingandglobal"fromaworldofbigoiltoaworldofbigshovels”solarpanels)todiversifyandcontrolaregion’sownmanufacturingpatternstoreducedependenceona(Yergin,2020).ThischaracterizationalignswithCONTENTSDEMANDELECTRICITYRENEWABLESFOSSILFUELSFINANCEPOLICYEMISSIONSREGIONSAPPENDIXDNVEnergyTransitionOutlook2023INTRODUCTIONAboutthisOutlookOurapproachincorporationofnewpolicydevelopments,mostnotablytheeffectsThisannualEnergyTransitionOutlook(ETO),nowinits7thedition,DNVpresentsasingle‘bestestimate’forecastoftheenergyfuture,withoftheUSInflationReductionAct.presentstheresultsfromourindependentmodeloftheworld’senergysensitivitiesconsideredinrelationtoourmainconclusions.However,system.Itcoverstheperiodthroughto2050andforecaststheenergywealsopublishour‘PathwaytoNetZeroEmissions’scenario(tobeIndependentviewtransitiongloballyandin10worldregions.OurforecastdatamaybelaunchedaheadofCOP28),whichiseffectivelya‘backcast’ofwhatweDNVwasfounded159yearsagotosafeguardlife,property,andtheaccessedateto.dnv.com/data.considertobeafeasible,albeitchallenging,pathwayfortheworldtoenvironment.Weareownedbyafoundationandaretrustedbyaachievenet-zeroemissionsby2050tosecurea1.5°Cwarmingfuture.WewiderangeofcustomerstoadvancethesafetyandsustainabilityofMoredetailsonourmethodologyandmodelcanbefoundonbelievereaderswillfinditusefultoexplorethedimensionsofthegaptheirbusinesses.page200.Thechangesweforecastholdsignificantrisksandbetweenour‘bestestimatefuture’andournet-zeropathwayscenario.opportunitiesacrossmanyindustries.Someofthesearedetailedinoursupplements:Foundationalaspectsofourapproachareillustratedbelow.TheseincludeO70u%rboefstoeusrtbimuastinee,ssisrelatedtotheproduction,generation,trans-thefactthatwefocusonlong-termdynamics,notshort-termimbalances.notthefuturewewantAsingleforecast,notscenarios—Maritimeforecastto2050However,giventherisingimpactofenergysecurityconcerns,wedescribemission,andtransportofenergy.Developinganindependentunder-—Transportintransitionto2050howthisimpactsourforecastintheopeningpagesonthisreport.standingof,andforecasting,theenergytransitionisofstrategicAllETOreportsarefreelyavailableonwww.dnv.com.Inaddition,wedrawourreaders’attentiontoongoinginsightsintotheenergyindustryimportancetobothusandourcustomers.ThisOutlookdrawsonpublishedbyDNV,whichincludeourmostrecentInsightreport,Closingtheenergystoragegap.theexpertiseofover100professionalsinDNV.Inaddition,weareThemostsignificantupdatestoourmodelsincethereleaseofour2022verygratefulfortheassistanceprovidedbyanumberofexternalETOarelistedonpage202.Theyinclude,forexample,updatedGDPexpertsanddialoguewithothercompaniesresearchingtheenergyandpopulationnumbers,revisedwindcostandtechnologyparameters,transition.AllcontributorsarelistedontCheonlatisntupedagdeevoeflothpimsreenptort.revOisuerdbceastrbeostnimparticee,s,adetailednewbioenergysectormodel,andtheLong-termdynamics,ofproventechnology,notnotthefuturewewantAsingleforecast,notscenariosnotshort-termimbalancesuncertainbreakthroughsOurbestestimate,Asingleforecast,notscenariosLong-termdynamics,ContinueddevelopmentMainpolicytrendsincluded;Behaviouralchanges:somenotthefuturewewantnotshort-termimbalancesofproventechnology,notcautiononuntestedassumptionsmade,e.g.linkeduncertainbreakthroughscommitments,e.g.NDCs,etc.toachangingenvironment10CONTENTSDEMANDELECTRICITYRENEWABLESFOSSILFUELSFINANCEPOLICYEMISSIONSREGIONSAPPENDIXDNVEnergyTransitionOutlook2023CONTENTSForeword23Renewableandnuclearenergy635.2Challengesandopportunities8Regionaltransitions1333RenewableandnuclearenergyHighlights33.1Solar64facinginvestors1018Analysisoftheregions1343.2WindIntroduction103.3Hydropower645.3Howwillcostofcapitalevolve?1028.1NorthAmerica1353.4Nuclearpower3.5Bioenergy698.2LatinAmerica1383.6OtherEnergy1EnergyDemand12756Policyandtheenergytransition1078.3Europe1434Fossilfuel1Energydemand134Fossilfuel766.1Policyandtheenergytransition1088.4Sub-SaharanAfrica1514.1Coal1.1Transport154.2Oil786.2Thetransitioncontexshaped8.5MiddleEastandNorthAfrica1574.3Naturalgas1.2Buildings244.4Summarizingenergysupply81by10opposingforces1108.6NorthEastEurasia1631.3Manufacturing305Financingtheenergytransition6.3Thepolicytoolbox1118.7GreaterChina1685.1Energyexpenditures1.4Non-energyuse(feedstock)33836.4Synopsisonthestateofpolicy8.8IndianSubcontinent1751.5Theeffectofenergyefficiency3484inETOregions1168.9SouthEastAsia1811.6Finalenergydemandfromallsectors37856.5PolicyfactorsintheETO1188.10OECDPacific186878.11Regionalemissions1912Electricityandhydrogen38917Emissionsandclimateimplications1228.12Comparisonofregionaltransitions1922.1Electricity39947Emissionsandclimateimplications1232.2Powergrids527.1Emissions123Appendix1942.3Storageandflexibility54967.2Carboncaptureandremoval126References2042.4Hydrogen57977.3Climateimplications131Theprojectteam2102.5Directheat6211CONTENTSDEMANDELECTRICITYRENEWABLESFOSSILFUELSFINANCEPOLICYEMISSIONSREGIONSAPPENDIXDNVEnergyTransitionOutlook2023Highlights1ENERGYDEMANDWequantifyandforecasttheenergydemandfortheThechapterconcludeswithaconsiderationofthe1Energydemand�13majordemandsectors:transport,manufacturing,globalshiftsinfinalenergydemand,whichpeaks1.1Transport�15andbuildings.towardstheendofourforecastperiodandactually1.2Buildings�24reducesslightlyby2050.Inourdiscussiononenergy1.3Manufacturing�30Weexploredeepshiftsintheenergycarriersservingefficiency,weanalysehowthisoccursdespitethe1.4Non-energyuse(feedstock)�33thesesectors.Thisincludesbothdirectelectrificationcontinuedgrowthindemandforusefulenergy(i.e.1.5Theeffectofenergyefficiency�34(e.g.inthecaseofEVs),andindirectelectrificationviaenergyservices)1.6Finalenergydemandfromallsectors�37hydrogenanditsderivatives(e.g.inaviation.shipping,andmanufacturingheat).12CONTENTSDEMANDELECTRICITYRENEWABLESFOSSILFUELSFINANCEPOLICYEMISSIONSREGIONSAPPENDIXDNVEnergyTransitionOutlook20231ENERGYDEMANDBy2050,weexpecttheglobalpopulationtoincreasedecadebefore2050,finalenergydemandisbyabout20%tosome9.6billionpeopleandthevirtuallyflat,effectivelylevellingoffat2040levels.ThischapterdetailsourforecastforthefoursectorsresponsibleforalmostallenergyglobaleconomytoalmostdoubletoUSD320trn,withThatisbecausemassiveefficiencygains,particularlydemand:transport,buildings,manufacturing,andfeedstock.Ineachsector,therehasanaveragegrowthrateof2.4%from2022to2050.thoseenabledbyelectrification,willalmostoffsettraditionallybeenastrongcorrelationbetweeneconomicactivityandfinalenergydemand.FurtherdetailsonpopulationandeconomicgrowtharethepopulationandeconomicgrowthpropellingInthecomingthreedecades,thisrelationshipwillchange:demandforusefulenergywillincludedintheAppendixA.1ofthisOutlook.demandforenergyservices,seeSection1.5ofcontinuetorisebutelectrificationandenergyefficiencieswillseealevellingoffinfinalthischapter.energydemand.Thetotalamountofenergyservicesrequiredglobally—measuredingoodsproduced,kmofItisnotagiventhatenergydemandwillremainflattransport,orsquaremetreheated—willroughlyafter2050.Oncemostenergyservicesareconverteddoubleacrosstheglobe,butenergydemandwilltoelectricity,whichautomaticallyimprovesenergynot.Insteadofdoubling,energydemandwillgrowefficiencyinmostsectors,energydemandmaystartonly10%from441EJto489EJbetweennowandtoincreaseagain.Thiscouldbecounteredbyan2050,asillustratedinFigure1.1.Moreover,intheeventualdeclineintheglobalpopulation.Anall-electricrefusetruck.Image:courtesyVolvoTrucks13CONTENTSDEMANDELECTRICITYRENEWABLESFOSSILFUELSFINANCEPOLICYEMISSIONSREGIONSAPPENDIXDNVEnergyTransitionOutlook2023‘Finalenergy’inthisOutlookandasshowninFigureManufacturingenergyusewillmaintainitsAworldusingmoreenergy,butdemandinglessofit!1.1meanstheenergydeliveredtoend-usesectors,shareofglobalenergyusejustabove30%intheexcludinglosses(forexample,heatlossesinthermalentireforecastperiod,withabsoluteenergyuseAstheworldpopulationgrowsandeconomypowerplants)andexcludingtheenergysector’sownincreasing13%to156EJin2050.Substantialexpandsthereisnoescapingthefactthatuseofenergyinpowerstations,oilandgasfields,efficiencygainsandincreasedrecyclingmoderatehumanitywilluseprogressivelymoreenergyrefineries,pipelines,andsimilarinfrastructure.Intheincrease.Thefeedstocksectorwillseeenergyservices.Whydowethereforeforecastanenergytermsofthemaindemandsectorsthekeydevelop-demandgrowby11%andpeakinthemid-2030s,futurewhereenergydemandgrowsataratewellmentsincludethefollowing:beforereturningtopresentlevels.beloweconomicgrowth,andinfactlevelsoffinthe2040s?TheanswerliesinthedifferenceBuildingsenergyuseforspacecoolingwillRoadtransportsectorwillseethestrongestbetween‘usefulenergy’and‘finalenergy’.morethantriple,whilespaceheatingdemandwillshifttoelectricityandthereforealsothestrongestdeclinesomewhatduetonewtechnologieslikeefficiencygains,andwhileaviationandmaritimeUsefulenergy:istheenergyoutputthatservesheatpumpsreducingenergyneeds.Overallenergycannotelectrifysimilarly,globaltransportationaspecificpurpose,suchasheatingastove,demandwillincrease29%to2050,atthattimerepre-energydemandpeaksaround2030andthereafterpropellingavehicle,lightingaroom,orrunningasenting33%ofglobalenergydemand,overtakingreducestoalevel9%lowerthantodayin2050,atmachine.Inourforecastusefulenergygrowsbymanufacturingasthebiggestdemandsector.thattimerepresenting23%ofglobalenergyuse.90%betweennowand2050.Althoughglobalfinalenergydemandwillleveloff,Finalenergy:isthetotalamountofenergyorgasoline(the‘finalenergydemand’)iswastedasthisisnotthecaseforallregions.InEuropeandrequiredtomeetvariousneedsand,crucially,itheat,incompletecombustion,andfrictionbeforeitOECDPacific,energydemandhasalreadypeaked,includesbothusefulandwastedenergy.Finalprovidestheusefulworkofpropellingthevehiclewhileinmanyofthemiddle-andlow-incomeenergydemandreferstotheenergydeliveredto(usefulenergy).AsICEVsarereplacedbyEVs,regions,energydemandwillcontinuetoincreaseend-usesectors(e.g.transportation,buildings,orenormousenergylosseswillbeeliminated.throughto2050,asillustratedinFigure1.2.Greatermanufacturing).Inourforecast,globalfinalenergyChina'sshareofglobalenergydemandisat25%,demandgrowsbyjust10%beforeflatteningForafullerdiscussionoftheroleofenergybutwilldeclinetoabout22%in2050,whiletheafter2040.efficiencyintheenergytransition,seeSection1.5IndianSubcontinentwillovertakeNorthAmericaofthischapter.asthesecondlargestenergyconsumingregioninThedifferencebetweenusefulenergyandfinalthe2040s.energyisclearlyillustratedinthecaseofaninternalcombustionenginevehicle(ICEV),whichisEnergydemandbycarrierissummarizedinSectiontypicallyonly25%to35%efficient–meaningthat1.6.Itisincarrierformthatthestoryoftheenergymuchofthechemicalenergyintheformofdieseltransitionismostapparent,withashiftawayfromfossilfuelstowardrenewablesandelectricity.14CONTENTSDEMANDELECTRICITYRENEWABLESFOSSILFUELSFINANCEPOLICYEMISSIONSREGIONSAPPENDIXDNVEnergyTransitionOutlook20231.1TRANSPORTbiofuelscontribute6%and4%respectively,withbiofuelblendsorprovidepreferentialtreatmenttoelectricityaccountingfor1%.Currently,theenergybiofuels.Anticipatingthecontinuationofemission-Transportationacrosstheworldispoisedforbothgrowthanddeeptransition.Betweennowmixesforaviation,maritime,androadtransportationtargetedpoliciesandprohibitions,weexpecttheseand2050,therewillbeanear-doublinginthesizeofthevehiclefleet;passengerflightswillcloselyresemblethatoftheglobaltransportsector,effortstopersistforanotherdecade,withrobustgrow140%abovepre-pandemiclevels;cargotonne-milesatseawillexpandby40%;andrailwhilerailpredominantlyreliesonelectricityforitsbackingfrombothindustryandconsumers.energydemandwillalmostdoublewhilepassengernumbersmorethandouble.In2022,allenergysource.Overtime,technologicaladvancementsandcostthesetransportactivitiesconsumed121EJ.Yet,inthemuchbusierworldof2050withmorelearningwillrenderpoliciesboostingbiofuelsandgoodsandpeopletransportedthanever,transportactivitieswillinfactconsume9%lessTocombatlocalairpollutionandglobalemissions,electrificationunnecessary,particularlyinroadenergythanatpresent,or111EJ.Thatwillmainlybeaconsequenceoftheenormoustheintegrationofnaturalgasandbiofuels,bothintransport(responsiblefor75%ofenergyusageinefficienciesintroducedthroughtheelectrificationofroadtransport.Asteadyswitchtotheirpureformsandasblendswithgasolineandtransportation)whereEVsuptakeisnowgrowingzero-emissionpropulsionwithbiofuelsandhydrogenanditsderivativesinlargepartsofdiesel,wasinitiatedseveraldecadesago.WhileChinaexponentially.Wecaution,however,thatprematurelyaviationandmaritimewillalsocontributetototaltransport-relatedemissionsfalling44%.abandoneditsbiofuelblendingpolicy(2019)andwithdrawingsupportforEVs,particularlyformediantheMiddleEastandNorthAfrica,NorthEastEurasia,andbelow-medianincomeconsumers,couldreverseandSub-SaharanAfricahavenoprominentbiofueltheiradoptiontrend(Sheldonetal.,2023).requirements,otherregionshaveeithermandatesfor15Currentdevelopmentsinglobaltransport4%,railby5%,androadby7%.Post-pandemic,Ultimately,reducingcarbonemissionsintransportationallthesesectorshavenowcomeroaringbacktolife.boilsdowntothefuelchallenge.Emissionsfromtrans-portationarespreadacrossavastnetworkofmoreIn2022,globaltransport-relatedCO2emissionsrosethanabillionroadvehicles,airplanes,andships,andbyover600millionmetrictonnestoreachabout8theseemissionscannotbeeffectivelycaptured.Inbillionmetrictonnes,markinga7.5%increasefromadditiontofromcarbondioxide(CO2),theseemissions2021,butstillmarginallybelow2019levels.Thegrowthoftenconsistofpotentgreenhousegases(GHGs)andwaslargelydrivenbyaviation,whichreboundedtoharmfulparticulatematterthatcannegativelyimpactabout70%of2019levelsafterpandemic-relatedlows.boththeenvironmentandhumanhealth.However,theincreaseinemissionswaspartiallyoffsetbythecontinuedriseofEVs,withover10millionEVsThepandemicledtodecreasedenergydemandinsoldgloballyin2022.alltransportsubsectors—air,road,rail,andsea.In2020,totaldemandacrossthesesectorsdroppedbyIn2022,thetransportationsectoraccountedfor26%11%.Aviationsawthemostsignificantdecline,nearlyoftheoverallglobalenergyconsumption,predomi-halvingfrom2019to2020,andisprojectedtoremainnantlysourcedfromfossilfuels.Asshowninbelowpre-pandemiclevelsduetoreducedbusinessFigure1.3,oilconstitutesasignificant88%ofthetravel.Meanwhile,maritimeenergydemandfellbyenergyusedintransportation,whilenaturalgasandCONTENTSDEMANDELECTRICITYRENEWABLESFOSSILFUELSFINANCEPOLICYEMISSIONSREGIONSAPPENDIXDNVEnergyTransitionOutlook2023Roadinfluencedbyvariousfactorslikegeography,culture,'Commercialvehicles'compriseothernon-passengerTheriseofEVstechnology,infrastructure,environment,andthevehicleswithatleastfourwheelsandareparticularlyEVadoptionistakingoff.Typically,individualsoptingFleetdevelopmentpresenceofalternativetransportationoptions.Toprominentinless-developednations.However,asforanEVwillmaketheirchoicebyweighingupcostsAmorepopulousandprosperousworldwillseetheforecastfuturevehicledensitytrends,wehaveutilizedthesecountriesexperienceeconomicgrowth,theandbenefits.Ourapproachentailssimulatedbuyersworld’svehiclefleet(passenger,commercial,andtwo-historicaldatafittedtoaGompertzcurve(atypeofshareofpassengervehiclesinthefleettendstorise.choosingbetweenincreasinglyaffordablebatteryandthree-wheelers)expandfrom2.4billionto3.5S-shapedcurve),showninFigure1.4.Insomecases,Thistrendisexpectedtostabilizeinthenearfuture.EVs(BEVs)withlongerrangesovertime,fuel-cellbillionvehiclesfrom2022to2050.From2035,thisfleetexpertopinionssupplementthis,allowingadjustmentselectricvehicles(FCEVs),andinternalcombustionsizewillstartplateauingowingtotheeffectsofauto-fortheimpactofpoliciespromotingalternativestoTaxiscurrentlyconstituteasubstantialproportionofenginevehicles(ICEVs)acrossthreecategories:mationandsaturation.Vehicle-sharingwillalsoincreaseroadtransport.theglobalpassenger-vehiclefleet.However,forth-passengervehicles,commercialvehicles,andtwo-andwillgenerallymeanthatthedistancedrivenpercomingstructuralshiftswillchangetheoverallsizeofandthree-wheelers.Forpassengervehiclebuyers,vehicleswillbehigher,implyingthatalevellingoffofWedividetheroadtransportsectorintothreethecarfleetand,crucially,thetotalvehicledistancepurchasepricetakesprecedence,whileoperatingthefleetsizedoesnotnecessarilyimpactmobility.categories:passengervehicles,commercialvehicles,travelled.Communaluseofpassengervehiclesiscostsholdmoreswayforcommercialvehicleowners.andtwo-andthree-wheelers.'Passengervehicles'morecommoninregionswithlowerincomes.DuetoGDPpercapitaisadrivingforcebehindvehicleencompassthosewiththreetoeightpassengertheefficiencyandcostadvantagesofferedbyplatform-AnotablehindrancetoEVadoptioninmostregionsdensity(numberofvehiclesperperson).Thislinkisseats,includingmosttaxisbutexcludingbuses.basedridesharingservices,thissectorispoisedisthescarcityofchargingstationswithinreasonableforfurtherexpansion.Thistrendwilllikelyleadtoreach,beitduringtraveloratdestinationslikehomedecreasedprivatevehicleownership,particularlyinorwork.AchievingsubstantialEVadoptionhingesonwealthierareas.Additionally,ourprojectionsaccountbothboostingtheaveragefleetrangeandenhancingfortherising—butsignificantlydelayed—presencechargingstationavailability.Weprojectthattheofautomatedvehiclesandtheincreasingfractionofcurrentbatterycost-learningrateof19%perdoublingsharedvehicles.Automatedandsharedvehicleswillofcumulativecapacitywillpersistthroughoutthedrivebetween20%and90%morekilometresthanaforecastperiod.Asaresult,vehiclepriceswillprivatelyownedcar,dependingonregion.decreaseinthelongterm,despiteanear-termriseattributedtomaterialshortagesandsupply-chainTheincreasedutilizationofdigitally-enabledchallenges.HeightenedcompetitionamongEVtransportoptions(automationandridesharing)mightmanufacturers,asrecentlyobservedintheworld’scomeattheexpenseofconventionalpublictrans-biggestcarmarketChina,willhelpalleviatetheseportation,walking,andcycling.However,theseshiftspriceincreases.inmodesoftransporthavenotbeenthoroughlyexamined.GiventheexpectedinterplayofvariousInEurope,theaveragebatterysizeisanticipatedtofactors,notleastvehiclenumbersanddistancesincreasefromthecurrent60kWh/vehicletoaroundtravelled,weanticipatethattheoveralldistance90kWh/vehicleinadecade.Thisexpansionwilltravelledbyvehicleswillnotbesignificantlyextendvehicleranges,renderingEVsevenmoreimpactedbyautomationorridesharing.appealing.Batterysizeswillvaryelsewhere,16CONTENTSDEMANDELECTRICITYRENEWABLESFOSSILFUELSFINANCEPOLICYEMISSIONSREGIONSAPPENDIXDNVEnergyTransitionOutlook2023influencedbyregionalcommutingpatternsandpervehicle.Weexpectcontinuedwillingnesstoexhibitbetteroverallcarbonefficiencythroughouttheywillrepresentupto12%ofthecommercialcorrespondingrangerequirements.providesuchsupportinOECDregionsandGreatertheirlifetimescomparedwithequivalent-sizedICEVsEVfleetby2050,withminorsingle-digitsharesinChina,enhancingtheappealofcommercialEVs(ICCT,2018).Europe,OECDPacific,andNorthAmericawhereEconomicsofEVsthroughtheTCOeffectbymakingICEslessattractivehydrogenadoptionisbolsteredbyrespectiveTotalcostofownership(TCO)servesasapivotalviahighercarbonpricing.EVswillbe50%ofnewvehiclessalespolicies.WhileFCEVsholdacostandenergy-factorinpurchasedecisions,reflectingtheinfluencegloballyby2031.efficiencydisadvantagecomparedwithBEVs,theyofpublicpolicysupport.Materialscarcityandsupply-Beyonddirectpurchaseandmanufacturingarelikelytofindtractionprimarilyinheavy,long-chainlimitations,includinglocalizationchallenges,willsubsidies,mostregionsemployvariousfavourableWhencontrastingtheutilityofEVs,FCEVs,andICEVsdistancecommercialvehicletransport.However,initiallyexertupwardpressureonvehicleexpensesoperationalincentivesforEVs.Theseincludeprivi-acrossthesefourfactors,theadoptionofcommercialevenwithinthisdomain,anotableportionwillbebutareexpectedtoeaseovertimeduetocompetitivelegeslikebuslaneaccess,freeparking,andreducedEVsismarkedlyslowerthanthatofpassengerclaimedbybattery-electrictrucks,sharingthemarketdynamicsandinnovativeapproaches.Beyond2030,oreliminatedregistrationfeesandroadtaxes.Roadvehicles,despitetheprolongationofsubsidies.fornon-fossilfueltransportationalongsideFCEVthedeclineinoperationalcostswillleadtolongertaxesarewidespreadgloballyandoftenfeaturetrucks.Commercialtruckingmayalsocontinuetodrivingdistances,consequentlyelevatingtheTCOperanexplicitcarbontaxcomponentinOECDnationsAsoutlinedinFigure1.5,ourprojectionindicatesincorporatecombustiontechnologies,allowingforvehicle.CurrentTCO-influencingpoliciesencompass(OECD,2019).WeanticipateariseintaxandcarbonthatEVswillcomprise50%ofthenewpassengerbiofuelutilization.buyerincentivesforpassengerEVs,varyingfromnopricelevelstoreflectlocalairqualityimprovementvehiclemarketshareinGreaterChinaandEuropeincentivesinlow-incomenationstoseveralhundredeffortsandinitiativesaimedatcurbingcongestionbythelate2020s,intheearly2030sinOECDPacificPolicybackingiscrucialforhydrogenintegrationUSDincertaincountriesandexceedingseveralandgreenhousegasemissions.andNorthAmerica,andgloballyby2031.Thismile-indemandsectors.AlthoughsomecountrieslikethousandUSDinOECDregions,notablyincludingstoneremainsacornerstoneofourforecast,largelyJapanandSouthKoreastronglyadvocateforFCEVtheUSundertheInflationReductionAct(IRA).BothAssessingbuyerpreferencesunchangedoverthepastfiveyears.adoptionintheirautomotiveemissionreductionpassengerandcommercialvehiclesbenefitfromWhenassessingthecomparativebenefitsofBEVs,strategies,substantialobstaclespersistinthewide-thesesubsidies,whichencompasssubstantialsupportFCEVs,andICEVs,weconsiderfoursignificantInlowerincomeregions,adoptionwilltakelongerduespreadadoptionofhydrogeninroadtransport.Theforvehicleandbatterymanufacturers.factors,eachwithvaryingimportance:tolimitedcharginginfrastructureandfewersubsidies.conversionofpowertohydrogenincurssignificantNevertheless,eveninareaswithslowerinitialuptake,energylosses,andadditionalefficiencyreductionsChinaandNorway,theleadingnationsinEVadoption—Speedofrecharging/refuellingthe50%thresholdwillbereachedbymid-century.occurwhenhydrogenisconvertedbacktoelectricityrates(commercialvehiclesinChinaandpassenger—Availabilityofcharging/fuellingstationswithinBy2050,ICEVswillscarcelybesoldinGreaterChinawithinthevehicle.Consequently,FCEVscanachievevehiclesinNorway),adoptacombinationofEVpref-andEurope,whileotherregions,notablyNorthEastanoverallwell-to-wheelefficiencyofonly25%toerentialtreatmentandindirectsubsidiesforbuyers.reachEurasia,willstillseeICEVsaccountingforaround30%35%,significantlylowerthanthe70%to90%rangeMeanwhile,inEurope,existingpoliciespromoteEVs—ConvenienceofEVuseofnewpassengervehiclesales.achievedbyBEVs.Moreover,FCEVpropulsionisbygrantingcarmakersadvantagesforzero-emissions—EV'sadvantageintermsofecologicalfootprintmoreintricateandthereforemorecostlythanthatofvehicleswhileimposingadditionalchargesonfleetsWeforecastFCEVstoentertheroadtransportland-BEVs.Asaresult,almostallvehiclemanufacturersarethatsurpassthesettarget(EC,2019).Theecologicalfootprintadvantagereflectsthescapeinvisibleamountsafter2030.InGreaterChina,leaningtowardsintroducingexclusivelyBEVmodels.valueattributedtousinglow-emissionelectricityorCommercialvehiclesneedlargerbatteries,andwelow-emissionhydrogenasfuelandtheassociatedTwo-andthree-wheelersrepresentacategoryofanticipatemoresubstantialandextendedsubsidiesenvironmentalbenefits.Notably,evenEVspoweredtransportwithminimalenergyconsumptioninmostbyelectricityderivedfromahigh-fossilenergymix17CONTENTSDEMANDELECTRICITYRENEWABLESFOSSILFUELSFINANCEPOLICYEMISSIONSREGIONSAPPENDIXDNVEnergyTransitionOutlook2023regions,exceptforGreaterChina,theIndianSub-Theworldisdividedintofront-runnerregionscontinent,andSouthEastAsia.Therefore,ourvehicleandsloweradoptersconcerningtheuptakeofdemandandelectrificationmodellingfortwo-andcommercialBEVs.GreaterChinaispoisedtothree-wheelersisconfinedtothesethreeregions,achievea50%salesshareforcommercialBEVsexclusivelyencompassingregisteredvehicles(electricwithinroughlyfiveyears,followedbyEuropetwobicyclesarecategorizedashouseholdappliancesyearslater.Incontrast,NorthEastEurasiaisnotratherthanroadvehicles).Weprojectswiftelectrifi-expectedtoreacha50%salesshareforBEVswithincationwithinthissegment;already,morethanathirdourprojectedtimeframe,asshowninFigure1.6.ofalltwo-andthree-wheelersalesinChinaareBEVs.CommercialFCEVswillplayaroleforheavy-dutylong-haultrucking,althoughelectricsolutionsareTheelectrificationofcommercialvehicleswilltakeeatingintothiscategoryatafasterratethanwehadplaceataslowerpacethanforpassengervehicles.previouslyforecast.The2-and3-wheelersareelectrifyingrapidlyandmorethanathirdofsalesinthisvehiclecategoryarealreadyelectricinChina.18CONTENTSDEMANDELECTRICITYRENEWABLESFOSSILFUELSFINANCEPOLICYEMISSIONSREGIONSAPPENDIXDNVEnergyTransitionOutlook2023Atransformationoftheglobalvehiclefleet19Figure1.7depictsourprojectionforthevehiclefleetdevelopment,encompassingtwo-andthree-wheelers,consideringtheimpactofbothincreasedridesharingandautomation.Thecurrentpassengervehiclefleetof1.2billionisestimatedtogrowtoslightlybelow2billionby2050,whiletheshareofICEVsdramaticallydeclinesfrom97%tobelow40%bymid-century.Theconversiontoelectricpowerwillencompassnearlytheentirefleetoftwo-andthree-wheelersby2040,althoughtheadoptionofEVsincommercialvehicleslagsbehindadvancementsintheothertwocategories.EventhoughEVsarepredictedtoconstitutealmostthree-quarters(72%)oftheglobalvehiclefleetby2050,theywillonlycontributearound30%oftheenergydemandwithintheroadsubsector,whilehydrogenFCEVswillcontributeanadditional5%.Thesmallersegmentofthevehiclefleetstillreliantonfossil-fuelcombustionwillberesponsibleforthemajorportionofenergyconsumption.In2050,oilwillaccountfornearly60%oftheglobalroadsubsector'senergydemand,withnaturalgasrepresenting4%.PhotobyDennisSchroeder,NREL48742Itisincarrierformthatthestoryoftheenergytransitionismostapparent,withashiftawayfromfossilfuelstowardsrenewablesandelectricity.CONTENTSDEMANDELECTRICITYRENEWABLESFOSSILFUELSFINANCEPOLICYEMISSIONSREGIONSAPPENDIXDNVEnergyTransitionOutlook2023AviationDespitethesetbackcausedbyCOVID-19,whichkilometre.AlthoughannualefficiencyprogresswillTRANSPORTINsignificantlycurtailedairtravel,passengertripgrowthdeceleratefromthepresent1.9%peryearto1.2%TRANSITIONPre-pandemic,civilianaircraftconsumednearly9%persists.Whiletheimpactonleisuretravelwasclearlyperyearby2050,thecumulativeimpactwillrestrictSeearticleonoftheworld'soil,andthissharewasonanupwardtemporary,thetransformationinbusinesstravelfuelconsumptiontoamere40%increase(FigureDHLExpress–trajectory.Globalaviation,drivenbyimprovingpatternsissettocontinue.Thepandemicintroduced1.9),despitetheanticipated140%surgeinflightafront-runnerwithlivingstandards,hadtripledinthefirsttwodecadesenduringchangesinworkdynamicsthatwillleadtonumbers.Cargoflightswillalsorise,yetpassengerSAF,onpage53inofthecentury.Thisgrowthpatternestablishedaa20%reductioninbusinesstravelthroughoutourflightswillcontinuetodominateaviation.Currently,ourTransportinclearlinkbetweenGDPexpansion,thenumberofforecastperiod.cargotripsaccountfor15%ofglobalaviationenergyTransitionreport.travellers,andflightfrequency.Weforecastthatbyconsumption(WEF,2020),andthisproportionisDownload2050,globalpassengerflightswillreach10.4billionEnhancementsinaircraftandenginetechnology,projectedtoremainconstantacrossallregionsannually(Figure1.8),markinga140%surgefromrefinedroutes,improvedoperationalstrategies,throughouttheforecastperiod.Image,courtesy:DeutschePostDHLpre-pandemiclevels.ThemostrobustgrowthisandincrementalgainsinloadfactorsandaircraftsizeanticipatedinGreaterChina,followedbySouthwillcontributetoongoingefficiencyimprovements,Fuelmixfuel,makinghybrid-electricapproachespertinentforEastAsia.quantifiedasenergyusageperpassenger-Aviationfaceslimitedoptionstoreplaceoil-basedmediumandlong-haulflights.However,sinceonlyfuel,andisthusoftenlabelledasectorhardtoaminorshareofaviationfuelisconsumedduringdecarbonize.Ontheonehand,theadoptionofshort-haulflights,electricity'sshareintheaviationlow-GHG-emissiontechnologiesandfuelsiseasedfuelmixispredictedtoreachonly2%by2050.byaviationhavingarelativelymanageablegroupofstakeholdersandaninternationalgovernanceTwoalternativepathwaysunderexaminationareframeworkfacilitatingdecision-making.Ontheotherpoisedtoreshapetheaviationfuellandscape:purehand,thefuturecostandavailabilitychallengesforhydrogenandsustainableaviationfuels(SAF).Thisalternativestoconventionaljetfuelremainsignificanttransitionentailshighercostscomparedtocurrenthurdles,inhibitingwidespreadadoptionduetohighoil-basedfuels,bothintheshorttermandleadingexpensesandlimitedsupplyandinfrastructure.upto2050.Thus,theimpetusforchangesinfuelandtechnologyareanticipatedtostemprimarilyfromElectrificationisemergingasaviablepropulsionsolutionprimarilyforshort-haulflightsonly,due20tobatteryweight.Commercialelectricaircraftdeploymentisprojectedtocommencebefore2030,initiallyfocusedonverysmallaircraftcarryingfewerthan20passengers.Thistrendwillexpandinthe2030stoencompassslightlylargershort-haulplanes,predominantlyinleadingregions.BatteriespossessnotablylowerenergydensitythanaviationCONTENTSDEMANDELECTRICITYRENEWABLESFOSSILFUELSFINANCEPOLICYEMISSIONSREGIONSAPPENDIXDNVEnergyTransitionOutlook2023regulatoryandconsumer-drivendynamics.NotablescalabilityduetoregulatoryimpetusandconsumerMaritimeincludingfleetandshipoptimization,wind-assistedexamplesencompassinitiativesliketheReFuelEUdemand.Consequently,SAFispoisedtobeprimarilypropulsion,on-boardCCS,energyefficiencyinitiative,aviationwithintheFitfor55legislativecomprisedofbiofuelsintheneartomediumterm,Maritimetransportiscurrentlythemostenergy-enhancements,andasubstantialtransitiontolow-package,augmentedcarbonpricingfollowingthereachinga22%shareofthefuelmixbymid-century.efficienttransportationintermsofenergyperandzero-carbonfuelslikegasandammoniawillremovalofaviation'sfreeallowancesinthefutureEUWhiletheabundantproductionofsustainabletonne-kilometre,andmorethan80%ofgloballybeusedintheprocessofachievingthestrategy.emissions-tradingsystem(EUETS)(EC,2023a),andbiofuelposeschallenges,aviation'sgreatercapacitytradedgoodsaretransportedbysea(UNCTAD,2021).Thepotentialforelectrificationinmaritimeremainsindividualwillingnesstoinvestinsustainableaviation.topay,andlimiteddecarbonizationalternatives,Atpresent,shipsaccountfornearly3%ofglobalfinallimitedtoshorepowerduringdockingandshort-seamakeitaviablechoice.energydemand,and7%ofglobaloilconsumption,shippingduetotheconstrainedenergydensityofWhenemployedasanaviationfuel,purehydrogenprimarilyforinternationalcargoshipping.batteriesfordeep-seavoyages.presentscertainadvantagesoverSAF.DerivedDuringthe2030s,theadoptionofe-fuelsbasedonInaworldwhereGDPdoublesby2050,thedemandfromrenewablesources,ahydrogenvaluechaininhydrogenwillgraduallyincrease,withsignificantInitsmostsignificantupdatesince2018,theforcargotransportationwilloutweighefficiencyaviationholdsthepotentialfornearlyemission-freeuptakeanticipatedinthe2040s.Nonetheless,liquidInternationalMaritimeOrganization(IMO)revisitedgains.Consequently,cargotonne-milesaretransport,withcarefulmanagementofresultingSAFsderivedfromrenewablesourcesorbiogenicitsGHGstrategyadoptingthe2023IMOStrategyonprojectedtoriseacrossmostshipcategories(Figureby-products(watervapourandNOxemissions).originsofferamorefittingavenueforaviationReductionofGHGEmissionsfromShipsandfortified1.10),withatotalgrowthof40%from2022to2050.Nonetheless,hydrogenfacestechnicallimitationsdecarbonization.Thesefuelsarewell-suitedasitsobjectivesaimedatdecreasingemissionsfromduetoitslowenergydensity.Thesubstantialdrop-inoptions,seamlesslyintegratingwithexistingmaritimetransportation.21hydrogenstorageneededwouldnecessitateinfrastructureandcombustiontechnology.afundamentallydifferentaircraftdesign,likelyTheupdatedGHGstrategyencompasses'levelsofresultinginhigherpassengercosts.Moreover,theWeighingthedifferentadvantagesofhydrogenandambition'thatalignwiththeoverarchingobjectiveimplementationofnewdesignsrequiresaminimume-fuelsagainsteachother,wewillseethreetimesofdiminishingemissionsintheshippingsector,andof20yearsduetoaircraft'sextendedoperationalmoree-fuels—a12%shareinthemix—thanpurewhichincludeamongstothers:life.Synchronizingaircraftdesignalterationsandhydrogenintheaviationsubsector.Thispredomi-infrastructureadjustments,aswellasrevisingnanceofe-fuelsisattributedtotheirversatileappli-—“Strivingtoachievenet-zeroemissionsfrominter-handlingandsafetyregulations,mustcoincidewithcationacrossvariousflighttypes,incontrasttopurenationalmaritimeoperationsbyapproximatelytechnologyadvancements.Giventhesignificanthydrogen,whichislimitedmainlytomedium-haul2050(consideringdiversenationalcircumstances)barriersimpedingthewidespreadadoptionofpureflights.Despitethisshift,oilwillcontinuetobetheandpursuingendeavourstowardstheireventualhydrogeninaviationbeforethemid-centurymark,itsprimaryaviationfuelsource,retaininga60%shareelimination,inlinewiththelong-termtemper-shareofthesubsector'senergydemandisprojectedin2050witha21%increaseinusagecomparedtoatureobjectivedelineatedinArticle2oftheParistoremainrelativelymodest,atapproximately4%presentlevels.Notably,theefficiencygainsandAgreement.”by2050.gradualfuelmixtransformationweforecastpositionsaviationtooutperformthe(currentlyunderrevision)Asidefromreaffirmingitslatestlevelsofambition,Bio-basedSAFhasalreadymadestridesatasmallgoalsoftheCarbonOffsettingandReductiontheIMO'snewstrategyoutlines‘tentativemilestones’scaleduetomandatorybiofuelblendratesinsomeSchemeforInternationalAviation(CORSIA)forthefor2030and2040.DNVanalysissuggests(DNV,countries.Itisexpectedtoexperiencerapidpartialdecarbonizationofaviationthroughto2050.2023b)thatablendofdecarbonizationmeasures,CONTENTSDEMANDELECTRICITYRENEWABLESFOSSILFUELSFINANCEPOLICYEMISSIONSREGIONSAPPENDIXDNVEnergyTransitionOutlook2023Whilesomecategories,suchasgascarriers,willandsupplydictatethatanyimbalancesareresolvedasignificantchangeinfuelcompositionovertheOurMaritimeForecasttoexperiencegrowth,efficiencyimprovementsandbytransportingexcessresourcesfromsurpluscomingdecades.Shiftingawayfromitspredomi-2050providesvaluableglobaltradepatternchangeswillleadtoreduc-regionstodeficitregions.Moreover,significantnantlyoil-basedfuelmixtoday,thecompositionbyinsightstoempowertionsinmostsegments.Asaresult,coaltransportmaritimetransportationoffossilfuelstakesplace2050willmainlyencompasslow-and/orzero-carboninformation-baseddecisionisexpectedtohalveby2050,andcrudeoilandoilwithinindividualregions.Similarly,themovementoffuels(84%).Amongthelow-andzero-carbonfuels,makingforallmaritimeproductstransportwilldecreaseby20%.Itmustberawmaterialsandfinishedgoodsoccursbothwithinammoniaisprojectedtocommandthelargestsharestakeholdersontheirnotedthatinthecomingyears,transportonkeeland,notably,betweenregions.(36%),followedbybiofuelat25%ande-fuelsat19%.decarbonizationjourney.willbecomemoreexpensiveduetoanincreasingTheroleofelectricity,aspreviouslydiscussed,isshareoflow-emissionfuelsinthemaritimefuelmix.Fuelmixanticipatedtobeminimalat4%.Thisextensiveshift22ThismightimpactestablishedtransportroutesinTheviewonthemaritimesector'sabilitytodecar-infueltypeswillbebolsteredbyregion-specificcaseswheredomesticproductionmighthaveanbonizehasprogressedrapidlyoverthelastfiveyears,decarbonizationinitiatives.advantageoverhigher-pricedtransportation.pushedbytheIMO'sdecarbonizationstrategyintro-duced2018andrevisedin2023.AshiftinmindsetHowever,thefuelswitchinmaritimeindustrydependsGlobalcargoshippingisafundamentalaspectofourwithinthesectortowardsshoulderingitspartoftheonmanyfactorssuchasadvancedbiofuelavailabilityanalysis.Theregionaldynamicsoffossil-fueldemandnet-zerochallengeisevident,andwillhelptodriveandsufficientavailabilityofrenewablehydrogenfore-fuelproduction.ThoseuncertaintyfactorsMaidenvoyageandarrivalatCopenhagenfornamegivingofLauraMaersk,theworld'sarecapturedinDNV’s2022versionoftheMaritimefirstmethanolfuel-enabledcontainership.Image,courtesyA.P.Møller–MærskA/S.Forecastto2050(DNV,2022c)where24scenariosforthemaritimesector'sfuturefuelmixareoutlined.BasedontheupdatedIMOstrategyandapushfrombothcharterersandregulatorssuchastheEU,ourourmainETO2023hasamoredecarbonizedfuelmixthanlastyear’sforecast.Nevertheless,thisforecastacknowl-edgesthattheIMOambitionslackenforcementmech-anismsandmightnotbefullymet,astheambitionshaveyettobetranslatedtoship-specificregulations.OurfuelmixforecastformaritimeillustratedinFigure1.11isaresultofourbestestimateassessmentandnottheresultofacostcompetition-basedmodeloutput.Thisimpliesthatourviewonthemaritimefuelmixto2050holdssignificantuncertainties,partlydescribedaboveandmorefullydetailedinDNV’sMaritimeForecastto2050.CONTENTSDEMANDELECTRICITYRENEWABLESFOSSILFUELSFINANCEPOLICYEMISSIONSREGIONSAPPENDIXDNVEnergyTransitionOutlook2023Railtransport,particularlyinurbanareas,boastssuperiorInregionsotherthanEurope,whererailfreighthas(upfrom41%today),41%diesel,and5%biofuel.spaceefficiencycomparedtoothermodes.Itshistoricallythrived,increasedrailfreightvolumesareWhilehydrogenholdspotentialtoreplacedieselonThissubsectorencompassesrail-basedtransportation,suitabilityforelectrificationfurtherpositionsitasanspurredbyGDPgrowthandtransportationsectornon-electrifiedrail,alarge-scaleadoptionofgaseousincludingurbanrailsystems.In2022,railaccountedattractivechoicefortransportdecarbonization.Thedecarbonizationstrategies.Despitetheremarkableenergycarrierslikehydrogenisnotforeseendueforjustunder2%ofglobaltransportenergydemand,increasingspeedandcompetitivenessofhigh-speedsurgeinroad-freightdemandinEurope,thepotentialtofactorssuchaspullingpowerlimitationsforrailapproximately0.5%oftotalglobalenergydemand.Bytrainsvis-à-visaviation,drivenbydecarbonizationforfurtherrail-freightexpansionislimitedduetofreight,theneedforgovernmentalsupport,and2050,globalpassengernumbersareexpectedtomoregoals,alsocontributetorail'sexpansion.Significantcongestedtracks,enhancedroadnetworks,andinadequatehydrogenrefuellinginfrastructurealongthandouble(+140%),resultinginasurgeofrailtraveltopassengergrowthisforecastedintheIndianSubcon-prioritizationofpassengerrail.mainrailroutestogetherwithastrongcompetitionfor9.9trillionpassenger-kilometres.tinentandGreaterChina,propelledbyrisinglivingrenewablehydrogenstemmingfromuptakeinotherstandardsandrobustpublicpolicysupportforrailEnergy-efficiencyadvancementswillprimarilyrevolve(transport)sectors.Railfreighttransportisprojectedtogrowby90%development.AsdepictedinFigure1.12,nearlyallaroundelectrification,complementedbyefficiencybymid-century,withsubstantialregionaldisparities.passengerrailgrowthisexpectedtobeconcentratedgainsindiesel-poweredunits.Figure1.13illustratesNotably,GreaterChinaanticipatesdoublingrailinthesetworegions,withtheIndianSubcontinentourprojectionthatongoingelectrificationtrendsfreightdemandoverthenextthreedecades,whileprojectinga57%shareofglobalrailpassengerwillbemaintainedtomeetrailtransportdemand,Europe'sequivalentdemandremainsstable.Railtransportin2050andGreaterChinacontributing27%.resultingina2050fuelmixcomprising54%electricity23CONTENTSDEMANDELECTRICITYRENEWABLESFOSSILFUELSFINANCEPOLICYEMISSIONSREGIONSAPPENDIXDNVEnergyTransitionOutlook20231.2BUILDINGSIn2022,28%oftheworld’stotalfinalenergyandtheassociatedenergyconsumptionwillnotincreasenearly50%ofglobalelectricitywasconsumedinatthesamespeedthankstoenergyefficiencyDespiteincreasingelectrificationandimprovementsintheefficiencyofthermalinsulationbuildings.Aboutthree-quarters(92EJ)ofthisfinalimprovements,drivenbyhigherefficiencystandards,andheating/coolingequipment,globalenergydemandforbuildingsissettogrownearlyenergydemandwasinresidentialbuildings,andthecontinueddeclineinthecostsofenergy-30%overthenextthreedecades,from125EJperyearin2022to161EJperyearin2050.rest(33EJ)incommercialbuildingsincludingprivateefficienttechnologies,andimprovementsintheThesector’sshareinfinalenergydemandisalsoexpectedtogrowfrom28%nowto33%andpublicworkspaces,hotels,hospitals,schools,andbuildingstock.Forexample,heatpumptechnologybymid-century.Thisismainlydrivenbyanincreaseinpopulationandthereforeinfloorareaothernon-residentialbuildings.TotalCO2emissionsenablesheatprovisionwithanefficiencyabove300%demand,aswellasariseinpercapitaincomesleadingtogrowingdemandforspacecoolingfromthissectoramountsto3GtCO2,about8%of(theratiobetweenusefulheatingenergyprovidedandotherelectricappliances.Globalwarmingfurtherintensifiesthedemandforcooling.totalenergy-relatedCO2emissions.overtheelectricityused).Figure1.14showsdevel-opmentsinusefulandfinalenergydemandforfourAstheglobalpopulationcontinuestoincreaseanddifferentendusesinbuildings.Asageneralpattern,standardsoflivingriseacrosstheworld,wewillseenotethestarklydifferentgrowthrateinthetwobarsacontinuationofthehistoricalgrowthinenergyrepresentingusefulandfinalenergy.Whileusefulservicesprovidedinthebuildingssector.However,energydemand(demandforenergyservices)keeps24CONTENTSDEMANDELECTRICITYRENEWABLESFOSSILFUELSFINANCEPOLICYEMISSIONSREGIONSAPPENDIXDNVEnergyTransitionOutlook2023growingrapidlyforallenduses,finalenergydemanddominanceofmoreefficientelectricappliancesBuildingstockcommercialbuildingsinfiveselectedregions.Thesharedoesnotgrowasquickly(anddropsinthecaseofinbuildings,mostimportantlyheatpumps.TheThefloorareaofthebuildingstockisoneofthemostofcommercialbuildingsisexpectedtogrowinallthesespaceheating),asaresultofimprovingefficienciesgrowingshareforelectricitymostlycomesoutoftheimportantdriversofenergydemandinbuildings,sinceregionsbecauseofGDPgrowthoutpacingpopulationinequipment.Thisismostvisibleinspacecoolingsharesofnaturalgasandbiomasswiththeformerenergyconsumptioninkeyenduses,suchasspacegrowth.Thisismostvisibleinfast-growingregionssuchwhich,despitethedecouplingbetweenusefulandreducingfrom29%in2022to23%in2050,andheatingandcooling,scalewithfloorarea.In2022,theasGreaterChinaandtheIndianSubcontinent,wherefinalenergydemand,isstillexpectedtobethemostthelatterfrom23%to15%overthesameperiod.totalglobalfloorareaofresidentialandcommercialGDPwillbegrowingmuchfasterthanpopulation.importantsourceofgrowthinenergydemandfromInthe2030s,wewillstarttoseehydrogenuseforbuildingscovered257,000km²,justabovethesizebuildingsoverthenextthreedecades.heatingpurposesinbuildingsrisingtoamodestoftheUK.ThefloorareaofresidentialbuildingsisBy2050,GreaterChina’stotalfloorareaofbuildingswill1.1%shareintheenergymixby2050.Thiswillbeexpectedtogrowgloballybynearly50%throughbeabout105,000km2,whichisequaltothecurrentFigure1.15showsdevelopmentsinbuildingsfinalmostlyintheformofhydrogenblendedintonaturalto2050,whilecommercialfloorareawillmorethan(2022)floorareaacrossallfouroftheregionsshownenergydemandbyenergycarrier.Themostsalientgaspipelinesatfirst,transitioningtosomeuseofdoubleinlinewiththegrowthineconomicactivity.inthefigure.Itisperhapsnotsurprisingthenthatfeatureofthegraphhastodowithelectricitytakingpurehydrogenasfuelfurtherahead.AsoutlinedThiswillresultina58%expansionofcombinedbuildingsinGreaterChinawillcontinuetoconsumeanincreasinglylargershareinthemix,upfrom34%inmoredetailinDNV’sHydrogenForecastto2050residential/commercialfloorarea.Figure1.16showsnearlyone-fifthofglobalbuildings’energyuse.in2022to52%in2050.Thisreflectsthegrowing(DNV,2022a),hydrogenusewillberatherlimitedinforecastdevelopmentsinthesharesofresidentialandbuildingsbecauseitwillberelativelyexpensivefromSpacecoolingalevelizedcostperspective,losingoutcompetitivelyWeestimatethatspacecoolingaccountedforonly6%toincreasinglycost-efficientheatpumps.oftheenergydemandofthebuildingssectorin2022butpredictanincreaseto17%by2050,splitroughlyAppliancesandlighting70:30betweenresidentialandcommercialbuildings,In2022,appliancesandlightingused27EJofrespectively,by2050.Energydemandforcoolingwillenergy,justover20%ofglobalbuildingsenergygrowfrom7.7EJperyearin2022to27.5EJperyeardemand.Weexpectthisdemandtoreach43EJin2050.by2050,withitsshareofglobalbuildingsenergydemandrisingto27%.ThisprojectiontakesintoWithanthropogenicemissionsdrivingglobalaccountsignificantexpectedimprovementsinthewarming,heat-relatedweathereventsarebecomingenergyefficiencyofappliancesandlighting,aswellmorefrequentandspacecoolingisbecomingcriticalasamoreintensiveuseofboth.Firstpostulatedbyforadaptation.Thisalsohasenergyandclimate-Jevons(1865)inthecontextoftheimpactofblast-justicedimensionstoitsincethecountriesandfurnaceefficiencyofcoalconsumption,theJevonsregionsleastresponsibleforthiswarmingaregoingParadoxassertsthatefficiencygainswillleadtoatobemostaffectedbyit(Sharples,2023).Thus,inthedemandincreaseassavingsfromefficiencieswillfuture,livingspacesandmostindoorworkinregionsbeusedtoconsumemore.Thisreboundeffecthasclosetotheequatorwillbecomeunbearablewithoutmanyexamples,fromcarstorefrigerators,acrossspacecooling,whichwillbeparticularlyneededbyvarioustimesandcultures.theinfirm,elderly,andchildren.25CONTENTSDEMANDELECTRICITYRENEWABLESFOSSILFUELSFINANCEPOLICYEMISSIONSREGIONSAPPENDIXDNVEnergyTransitionOutlook2023AmongourETOregions,thosewiththehighestEurope’selectricityconsumptionforcoolingwillSpaceandwaterheating—isdrivenprimarilybyfloorarea.Globally,demandfutureeconomicgrowtharealsomostvulnerabledoublebetween2022and2050(Figure1.17).Spaceandwaterheatingaccountedfor32%and18%,forhotwaterwillrisemorethan60%from11EJoftoheat-relatedclimateevents,suchastheIndianrespectively,ofthebuildingssector’stotalenergyusefulheatin2022to17.5EJin2050.Subcontinent,LatinAmerica,andSouthEastAsia.Thoseregionswiththefastesteconomicgrowthalsoconsumptionin2022.WithincreasingpopulationandThisisreflectedasregionalvariationsinthegrowthhappentobethosethatdemandthemostcooling,floorarea,demandforspaceheatingwillcontinuetoRegionswithcolderclimates(NorthEastEurasia,ofcoolingenergydemanddrivenmostlybyincreasesmeasuredinCDD.Currently,fourregionshaveCDDgrow,rising12%intermsofusefulheatdemandbyNorthAmerica,Europe,andGreaterChina)createincoolingdegree-days(CDD),andinairconditionerabove1,000Celsiusdegree-daysperyear:theIndian2050.Improvementsininsulation,andfewerheatingmostofthedemandforspaceheating.Forwaterpenetrationduetorisingincomelevels.CDDistheSubcontinent,theMiddleEastandNorthAfrica,Southdegree-days(ameasureofhowcoldthetemperatureheating,theregionaldifferencesaremostlydrivencumulativepositivedifferencebetweendailyaverageEastAsia,andSub-SaharanAfrica.Collectively,theirisonagivendayorduringaperiodofdays)duebystandardofliving.Inhigher-incomeregions,outdoortemperatureandreferenceindoortemper-economicoutputisexpectedtotripleby2050.Thetoclimatechange,willhelpreducetherateofthisincreasinglyefficienthotwatertanksareusedcontin-atureof21.1°C.NorthAmericapresentlyaccountsforresultwouldbeaseven-foldincreaseinelectricitygrowth.GDPpercapitaisthemaindriverofdemanduouslytoservemultipleneeds,fromdailyshowershalfofglobalelectricitydemandforcooling.However,consumptionassociatedwithspacecoolingfortheseperpersonforwaterheatinginresidentialbuildings.towashingdishes.Insomelower-incomecountries,in2050,about31%ofcoolingdemandwillbefromregions(Figure1.17).Bymid-centuryalmosthalfofallThewaterheatingdemandofcommercialbuildings—waterisheatedasrequiredforbasicneedsusingGreaterChina,andonly13%fromNorthAmerica.energyconsumedforcoolingwillbeintheseregionsabout27%oftotalfinalenergyusedforwaterheatinginefficientmethods.withhighCDD.26CONTENTSDEMANDELECTRICITYRENEWABLESFOSSILFUELSFINANCEPOLICYEMISSIONSREGIONSAPPENDIXDNVEnergyTransitionOutlook2023Averageefficiencyofheatingequipmentisdefinedmainlytotheexpectedtransitionfromlessefficientpumpsinallregions.Thiscostreductionisexpectedhigherreturnoninvestment,heatpumpsconstituteastheratioofusefulenergyprovidedtofinalenergytechnologiessuchasgasorbiomassboilerstoheattovarybetween17%and26%byregion.mostofthemarketeventhoughcoldtemperaturesdemand.Thisefficiencyvarieswidelybetweentech-pumpsforspaceandwaterheating—andbecauseofmeanalowerseasonalcoefficientofperformance.nologies,fromlessthan10%fortraditionalopengradualefficiencyimprovementsintechnologies—weGlobally,heatpumpswillprovideaboutathirdofthewood-burningtomorethan300%forheatpumps.seeaverageefficiencyrisingfrom0.9in2020to1.2inusefulheatforspaceheatingin2050whileconsumingThemoveawayfromtraditionalbiomassstovesHeatpumpsextractmoreenergyintheformofheat2050forspaceheating,andfrom0.5to0.75forwateronly13%ofthetotalfinalenergydemandforspaceforwaterheatingisanotherbigdriverofefficiencyfromtheairorearththantheenergytheyconsumeheating.heating.InEurope,basedonstatisticsfromtheimprovements.Althoughconsuming26%ofthefinalintheformofelectricity.Figure1.18showsdevelop-EuropeanHeatPumpAssociation,around3millionenergyusedgloballyforwaterheatingin2022,tradi-mentsintheshareofheatpumpsinprovidingusefulTheincreaseduptakeofheatpumpsisaresultofunitsofheatpumpsweresoldin2022,increasingthetionalbiomassonlyprovided7%oftheusefulenergy.heatandinfinalenergyuse.Italsotrackstheimpactthereductionintheircost,helpedbycost-learningtotalnumberofheatpumpsinstalledintheregiontoIncreasedenergyaccesswillreducethefinalenergyofthesedevelopmentsintechnologyuptakeonthefeedbackloopswherethecumulativeinstalled20million.Weforecastthatheatpumpswillmaintainrepresentedbytraditionalbiomassto18%by2050,overallefficiencyofspaceandwaterheating.By2050,capacityofthetechnologybringsdownproductionbetween40%to60%marketshareinspaceheatingresultinginsavingsof1.8EJperyear.heatpumpswillprovide32%oftotalusefulenergyforcosts.Costsvarybetweenregions,butwithaglobalcapacityadditionsthroughto2050.Insomelocalspaceheatingand22%forwaterheating,whileusinglearningrateof15%,weexpecttoseeareductionbymarkets,likeNorway,wherecheaperelectricitypricesFigure1.19showsdevelopmentsintheglobalenergyonly13%and5%offinalenergy,respectively.Thanksmid-centuryinthelevelizedcostofheatingbyheatreduceoperatingcostsandlongwintersensureamixforspaceandwaterheatinginbuildings,and27CONTENTSDEMANDELECTRICITYRENEWABLESFOSSILFUELSFINANCEPOLICYEMISSIONSREGIONSAPPENDIXDNVEnergyTransitionOutlook2023totalfinalenergydemandforeachenduse.AsaresultCookingaccountingforaquarterofsuchdemand,and6.4%Cookingenergydemandisanimportantoftheabovedevelopments,finalenergydemandforCookingenergydemandisexpectedtogrow15%oftotalfinalenergydemand.Moreimportantly,thedriverofgenderinequalityandproductivitywaterheatingwillstaystableintherangeof23–24from27EJin2022to31EJby2050.Weestimateonusforcookingandsourcingtheenergyforitinloss,especiallyinregionswithnoaccesstoEJ/yrfrom2022to2050,withaslightshiftfromthatin2022,42%ofcookingenergydemandismetregionssuchasSub-SaharanAfricaandtheIndiancleancookingfuels.residentialtocommercialbuildings(duetohigherbytraditionalbiomassstovesburningfuelssuchasSubcontinenttraditionallyfallsonwomenandgirls.growthinglobalGDPthaninworldpopulation).Finalanimalwaste,charcoal,andwood.ThisrepresentsThus,coupledwiththehighprevalenceoftraditionalannualenergydemandforspaceheatingwillfallaquarteroftheglobalpopulation,themajorityofbiomassstoves,IEA(2023a)estimatesthathouse-from40EJto35EJperyearinthesameperiodwithwhomliveinSub-SaharanAfricaandtheIndianholdswithoutaccesstocleancookingfuelsspendfurtherimplementationofinsulationandretrofittingSubcontinent.By2050,traditionalbiomassstovesfivehoursperdaycollectingfuelandcooking.Mostmeasures,andastheuseofefficientelectricheatwillsupplyonly30%ofcookingenergy,followingofthistimeisspentbywomenandgirls,whichaffectspumpsspreads.Intermsoftheenergymixinspacereplacementprimarilybyelectricandmoderntheiropportunitiesfordevelopment,accesstoheating,theshareofnaturalgasshrinks,givingwaytobiomassstoves(Figure1.20).education,employment,andincome(andfrequentlyelectricity.Inwaterheating,besidessomeincreaseinallfour).Therefore,cookingenergyisanimportantelectrification,useoftraditionalbiomassgiveswaytoCookingisanoften-overlookedcomponentdriverofgenderinequalityandproductivitylossifnaturalgastosomeextent.ofenergydemandinbuildingsdespitetodaythereisnoaccesstocleancookingfuels.28CONTENTSDEMANDELECTRICITYRENEWABLESFOSSILFUELSFINANCEPOLICYEMISSIONSREGIONSAPPENDIXDNVEnergyTransitionOutlook2023Energyefficiencythroughinsulation,retrofitting,andbuildingthermalcharacteristicsBuildingefficienciesdeterminetheoverallspaceimproveitsBTCthroughretrofittingonaregionalmentstooverallBTC.InthecaseoftheIndianheatingandcoolingloadsofbuildings.Inourbasis,andhowmuchbetterBTCofnewbuildingsareSubcontinent,improvementsinBTCreducetheforecast,buildingthermalcharacteristics(BTC)areforeachregion.Combined,thesetwoimprovementsspecificcoolingdemandby20%in2050,whichisinfluencedbythebuildingcodestandardsandthereducethespecificheatingandcoolingenergyaconsiderablesavingintermsofenergydemand.improvementinBTCduetoretrofittingofbuildings.demandoftheoverallbuildingstock.Similarly,inGreaterChina,thedifferencebetweenTherearepushandpullforcesatplaythatdeterminespecificheatingdemandwithandwithoutimprove-thedynamicsofchangeofBTCataregionallevel.Figure1.21showsshowthedynamicsofchangementsinBTCis18%in2050.Butmoreimportantly,ofresidentialspecificheatingdemandofGreatersuchimprovementscandampenthepeakinspecificPushingbetterBTCarethebuildingcodesandChinaandresidentialspecificcoolingdemandofheatingdemand,thus‘bendingthecurve’ofoverallstandardssetbyorganizationswithjurisdictionsovertheIndianSubcontinent,withandwithoutimprove-energydemandforspaceheating.localities,countries,orsupra-nationalentitiessuchAddinginsulationtothewallsastheEU,whichareapplicabletobothexistingandofahome.PhotobyWernernewresidentialandcommercialbuildings.Similarly,Slocum,NREL72236theEUalsomandatesretrofittargetsforbuildingsstock,aimingtoincreasetheefficiencyand/orEnergyefficiencyinbuildingsisanoftenunder-reducethespecificenergydemandsofbuildings.utilizedor‘hidden’energysource.EnergyefficiencygenerallyconsistsofefficiencyduetothebuildingPullingtowardsbetterthermalinsulationandstockandtotheequipmentand/ortechnology,suchbuildingenergyefficiencyarefinancialincentivesasefficiencyoflightingfixtures.availablesuchastaxcreditsthroughtheUSInflationReductionAct,mainlyforhouseholdstoimproveBuildingstockefficiencyisoftenafunctionofthetheirenergyefficiency(IRS,2023).buildingenvelopeandtheinsulationprovidedbythethermalpropertiesofthematerialsusedinabuilding.InourETO,specificheatingandcoolingenergyEnergyefficiencyofthebuildingstockmayalsobedemand,givenasenergydemandperyearandperimpactedbybuildingdesign,suchasplacementofsquaremetreareimpactednotonlybyclimateandwindows,shadingmaterials,windowawnings,prosperity,butalsobythechangeinBTCthroughandsoon.insulationimprovementandretrofitting.Weestimatehowmuchoftheoldandnewbuildingstockwill29CONTENTSDEMANDELECTRICITYRENEWABLESFOSSILFUELSFINANCEPOLICYEMISSIONSREGIONSAPPENDIXDNVEnergyTransitionOutlook20231.3MANUFACTURINGManufacturinginatenseworldMedium-incomeregions(LatinAmerica,theMiddleGlobalgeopoliticaltensionshaverecentlycasttheEastandNorthAfrica,NorthEastEurasia,SouthEastManufacturingiscurrentlythelargestenergyconsumerat138EJ(31%)offinalenergyspotlightonthedominanceofcertainregions,espe-Asia)willseemanufacturingcontinuetoexpand,demandin2022.Despitesubstantialenergy-efficiencygainsandincreasedrecyclingandciallyGreaterChina,intheglobalsupplyofessentialmostlytosupporttheirgrowingeconomies.Conse-reuseofmaterialsandgoods,thesector’senergydemandwillkeepgrowing.Itwillincreasetechnologiesfortheenergytransition.Someofthequently,energydemandwillsteadilyincreasebyanaverageof0.5%everyyear,reaching156EJby2050.deindustrializationtrendsthatwereobservedinthe0.6%/yronaveragethrough2050.lastdecadeswillbestoppedandevenreversedinLower-incomeregions(Sub-SaharanAfricaandFigure1.22showsthesector’senergymixtodayisiswhytheironandsteel,chemicals,andcementsomeregions,thoughitwillnotleadtodramatictheIndianSubcontinent)willseethemostspec-dominatedbyfossilfuels,inparticularcoalandnaturalproductionindustriesareoftendescribedas‘hard-changesinenergydemand.AshighlightedinFiguretaculardevelopments,asbothGDPandpopulationgas,whichtogethersupplymorethanhalfofitsfinalto-abate’,astheycannoteasilybedecarbonized1.23,energydemandwithinthedifferentgroupsofincreaseswillleadtofast-developingmanufacturingenergy.Theircombinedsharewillprogressivelythroughelectrification.regionswillprogressivelyconvergetowards2050.capacityinallsubsectors.Althoughnotasdramaticdeclineinfavourofdirectelectrification,hydrogen,Differentdynamicswillbeatplay:asthepasttransitioninChina,energydemandwillandbioenergy,butthehighheatoftenrequiredposesAdditionally,theoverwhelmingmajorityofnewstillincrease2.5-foldby2050.aproblemforusingdecarbonizedalternatives.Thisinstallationsstillrelyonfossilfuel-basedtech-GreaterChinaisaglobalmanufacturinghubnologies.Astheseplantsarecapital-intensive,supportingdomesticneedsandexportindustries.30long-terminvestments,therewillbeonlymoderateTheexplosionofenergydemandinthelastchangesinthefuelmixduringourforecastperiod.twodecadeshasbeensupportedbyaboomCoalwillremainthelargestenergycarrier,driveninconstructionofbuildingsandinfrastructure,bypersistentuseinGreaterChinaandtheIndianwithsteelandcementproductionrepresentingSubcontinentwhich,together,willstillrepresenthalfChina’smanufacturingdemandtoday,andtwo-thirdsofdemandbymid-century.aroundaquarterofthecountry’stotalenergydemand.DemandfortheseproductswilldeclineThisshouldnot,however,minimizesomeforecastedasconstructionslowsdown,buttheinertiaofnewlyprogressindecreasingthesector’sdependenceinstalledandplannedcapacityadditionswillkeeponfossilfuels.Forinstance,low-andmedium-heatChinaataveryhighlevelofdemand.needswillincreasinglybesuppliedbyindustrialheatpumps(seefactboxpage32).OECDregions(NorthAmerica,Europe,andOECDPacific)havehistoricallyseenmanufacturing’sshareHydrogenwillalsobeusedforheatingandasaintheireconomiesdecline,withservicesdominant.reducingagent,meeting6%ofenergydemandbyReshoringofenergy-intensiveindustriesinthebasetheendofourforecastperiod.Therewillbehugematerialsandmanufacturedgoodssubsectorswillregionaldifferencesinitsshareofthemix,from1%halttheslowdeclineofrelatedenergydemand.intheIndianSubcontinentupto20%inEurope.Decarbonizationwillalsobeakeyfeature,withmanufacturingCO2emissionshalvingby2050.CONTENTSDEMANDELECTRICITYRENEWABLESFOSSILFUELSFINANCEPOLICYEMISSIONSREGIONSAPPENDIXDNVEnergyTransitionOutlook2023ManufacturedgoodsChemicalsandpetrochemicalsIncludesproductionofgeneralconsumergoods;foodandtobacco;electronics,Includesthemanufactureofplasticsandotherpetrochemicals,includingammoniaandappliances,andmachinery;textilesandleather;andvehiclesandtransportequipment.methanolusedasfeedstock.Thesubsector’senergydemandisexpectedtogrowbyabout20%between2022Aseconomiesgrow,thedemandforfinishedgoodsexperiencesasimilarrise.Despiteandthemid-2030s,thenslowlydecreaseuntil2050.Thevariationofenergydemandefficiencyimprovements,thisexpectedgrowthindemandwillleadtoa46%increaseinismostlyattributedtodemandforvirginplastics.Thisdemandisinitiallyexpectedtorelatedenergydemandby2050.continueincreasingexponentiallybutwillbecomeprogressivelyattenuatedbyhigherrecyclingratesinallregions(seeSection1.5formoredetails).Thesubsector’sgreatdiversityisreflectedinitsenergyuseandfuelmix.FossilfuelsEnergyandnon-energyusesareforthemostpartintertwinedintoday’sindustrialmeethalfitsenergydemandnow,buttheirsharewillprogressivelydeclineaselectricity,processes.Futureprocesseslikegreenammoniaproductionorelectrifiedsteambioenergy,andhydrogentoalesserextent,becomeattractiveoptionstofueltheusuallycrackingwillprogressivelydecouplethesetwodistinctusesinthesubsector.However,low-ormedium-temperatureindustrialprocesses.long-life,multi-billion-dollarpetrochemicalsitesoperateonafragileequilibrium.Heatrecoveryiswell-developed,andexcessheatorby-productsfromsomeprocessesoftenAround50%oftoday’senergydemandforthesubsectorisconcentratedinthreefuelothers.Retrofittingoptionsareconsequentlylimited,asarepotentialenergy-efficiencyregions:GreaterChinaandtheIndianSubcontinent.Theseregionswillcontinuetogains.Thisleadsustoexpectaslowtransitionintheenergymix,slowuptakeofhydrogendominate,buttheIndianSubcontinentwillprogressivelytakeoverChina’sleadingforenergy,andslowelectrification.positiontorepresentmorethanathirdofthesubsector’senergydemandby2050.BasematerialsIronandsteelIncludestheproductionofnon-metallicminerals(excludingcement);non-ferrousmaterials,Steelproductionhasdoubledinthepasttwodecades,duemainlytoinfrastructureandincludingaluminium;andwoodanditsproducts,includingpaper,pulp,andprint.industrialdevelopmentsinChina;weforecastitwillincrease15%bythemid-2030s,andTheseenergy-intensiveindustriesproducematerials(e.g.lithium,aluminium)forwhichthenplateau.demandwillcontinuetogrowinthecomingdecades,supportedbytheenergytransition.Energydemandwillassuchgrowbyasixth(17%)by2050.TheElectricArcFurnace(EAF)method’sshareinglobalsteelproductionwillprogres-Thefuelmixwillbeprogressivelydecarbonized,bothbecauseofemissiontargetsandsivelyincreasefrom26%in2020to49%in2050,drivenbyreduceddemandforsteelashifttomaterialsforwhichproductionprocessesarewell-suitedforelectrification.andanincreasingquantityofscrapsteelbecomingavailable.Consequently,energyElectricitydemandwillthusincreasebyathirdby2050.demandforsteelmakingwillplateauafter2030.Thesubsectoralsocurrentlyrepresents5%ofglobalbioenergydemand,mostlyforthepulpandpaperindustry.Bioenergydemandisexpectedtoslightlyincrease,asdemandCoalusewillprogressivelydecreasebutwillstillmeetmorethanhalfthesubsector’sfortheseproductsremainsstrong.energydemandbythen.Indeed,steelwillplayakeyroleinsustainingdemandforcoalthroughtomid-century.Thesubsectoraccountedforasixthofglobaldemandforcoalin312022.Ascoaldemanddeclinesslowerthaninothersectors,steelwillrepresentathirdofthatdemandin2050.TheincreasedshareofEAFwillleadtoa58%increaseinelectricitydemandforsteelmaking.Adrivetowards‘green’steelanddirectreducediron(DRI)willalsoincreasethesubsector’suseofhydrogenforenergy,frompracticallyzerotodayto9%ofitsfuelmixby2050.CONTENTSDEMANDELECTRICITYRENEWABLESFOSSILFUELSFINANCEPOLICYEMISSIONSREGIONSAPPENDIXDNVEnergyTransitionOutlook2023CementIndustrialheatpumpsontheirwell-establishedindustrialheat20MWindustrialheatpumpfordistrictheatingpumpindustriestoexpandtohigh-inMannheim.Image,courtesySiemensCementproductionhasmorethanManufacturingprocessesconsumesignif-temperatureheatpumps.doubledfrom1.7billiontonnesin2000icantamountsofprocessheat.Industrialto4.1billiontonnesin2022.Globalheatcurrentlyrepresentsabouttwo-thirdsHigh-temperatureheatpumpapplicationsproductionwillincreaseonlyslightlyinofmanufacturingenergydemand,largelyarecurrentlymadeavailableonlyaspilotsthefuture,to5billiontonnesin2050,suppliedbyfossilfuels.andsmall-scaleindustrialdemonstrations,asproductioninChinaslowsandotherwithspecificinvestmentcostsbetweenregionssuchastheIndianSubcontinentAsforspaceheating(seeSection1.2),USD200/kWandUSD1600/kW,capacitiesstepin.heatpumps,withefficienciesabove100%,rangingfrom30kWto70MW,andtheareanattractivesolutionforprovidingabilitytosupplyheatatmaximumtemper-Hydrogenandelectrificationaredecarbonizedindustrialheat.Heatpumpaturesupto280°C.High-temperatureheatexpectedtoplaylimitedroles,duetoefficiencyislargelydependentonthepumpsareexpectedtoprogressivelybehigh-temperaturerequirementsandtemperaturedifferencebetweenthemadefullycommerciallyavailableandusedthenecessityofabatingtheprocesssourceandthesink.Consequently,alargerbetween2024and2027(HPC,2023).emissionsofcementregardlessofthetemperaturedifferenceleadstoalowerenergymix.Thefuelmixwillremainefficiency.ItischallengingtoreachhighWhiletheinvestmentcostisseenasahighlycarbon-intensive,anddecarboni-temperaturesifairistheheatsource,likeinbarrierforheatpumpuptake,thecostszationgoalswillbecoveredwithcarbonspaceheatingapplications.Butindustrialwillbereducedwithmoredeploymentcaptureandstorage.processesoftenhavesignificantamountsinthefuture.Additionally,strategiessuchoflow-gradewasteheat,whichcaninsteadassectorcoupling,heat-as-a-service,andConstructionandminingbeutilizedasaheatsourcetoimproveflexibilityserviceswillimprovethebusinessefficiencies.Processstreamsthatneedcaseforindustrialheatpumpsandaccel-Construction(ofroads,buildings,andcoolingareevenbetterheatsources,aseratethedeployment(WBCSD,2022).infrastructure)andminingisthesmallesttheycanfurtherimprovetheoverallsystemoftheETOmanufacturingsubsectors.efficiency.HeatpumpswillbecompetitiveinregionswheretheelectricitytogaspriceratiosHowever,itwillseethelargestrelativeAsillustratedinFigure1.24,processarelowest.IntheEuropeanmarket,bothincreaseinenergyuse,growing50%heatingapplicationsupto100°Ccanbeelectrificationandenergyefficiencyareby2050.Thegrowthisespeciallycoveredbymatureheatpumptechnol-keydriversforheatpumpsuptake,whilepronouncedinregionsthatwillseerapidogies.EuropeandJapanareleadingtheenergyefficiencytakesprecedenceineconomicgrowth,includingSub-Saharanwayintechnologydevelopment,buildingmarketslikeNorthAmerica.Africa(+260%),theIndianSubcontinent(+180%),andSouthEastAsia(+70%).Demandforfossilfuelswillremainconstantoverourforecastperiod,whileelectricityandhydrogenwillcovertheadditionalneeds,andrepresenthalfofdemandby2050.32CONTENTSDEMANDELECTRICITYRENEWABLESFOSSILFUELSFINANCEPOLICYEMISSIONSREGIONSAPPENDIXDNVEnergyTransitionOutlook20231.4NON-ENERGYUSE(FEEDSTOCK)purposesisexpectedtoincreasefrom6EJin2020tomethanol),thesameprimarychemicalsobtained10EJin2050,drivenbyincreaseddemandforroadviasteamcrackingareused.Non-chemicalusesareNon-energyusereflectsconsumptionofcoal,oil,naturalgas,orbiomassasindustrialinfrastructureingrowingeconomies.andwillbecoveredbyoil;forexample,bitumenisfeedstock,andtypicallyresultsintangibleproductslikeplastics,paints,orfertilizers.In2022,essentialforroads.41EJ(about8%)ofglobalprimaryfossil-fuelsupplywasusedfornon-energypurposes.FuelmixOverall,non-energydemandforoilandnaturalgaswillOilandnaturalgasdominatetoday’sfuelmixforincrease.AsFigure1.26shows,non-energywillmaintainDemandincreasesby91%,non-energyusewillonlyrisenon-energyuse,meeting54%and42%,respectively,aconstantshareoftotalnaturalgasdemand.Foroil,Plasticsproductionrepresented18EJ(45%)oftotal28%.Thisisduetoasignificantincreaseinrecyclingofdemandin2022,withcoalcoveringtherestoftheshareofnon-energydemandwillgraduallyincreasenon-energydemandin2022.Globalplasticsdemandratesduringourforecastperiod.Secondaryplasticsthemix.90%ofthiscoaluseisinChina,mainlyforfrom14%in2020to22%in2050asdemandgrowsforhasgrownsignificantlyinrecentdecades,reachingobtainedbymechanicalrecyclingcovered7%ofammoniaandmethanolproduction.feedstock(particularlyplastic)butwilldeclineforother450Mtperyearin2022.Thisgrowthisexpectedglobaldemandin2022.Thiswillgrowto27%by2050,enduseslikelubricantsforroadtransport.Feedstocktocontinueandreach860Mtperyearin2050,asowingtothegeneralizationofrecyclingschemesinPlasticsproductionnecessitatesprimarychemicalsusewillthereforebeoneofthekeydriversforoilplasticsconsumptionisstronglyrelatedtorisingallregions,andtoadvancesinrecyclingtechnologies,likeethene(ethylene)orpropene(propylene),whichdemandinthecomingdecades,withthecaveatthatitGDPpercapita.However,evenifplasticsdemandincludingfeedstockrecycling(UNEP,2023).Atthesamecanbeobtainedfromcrackingoilorfromnaturalwillpeakinthe2030sandthereaftersteadilydecline.time,theuptakeofchemicalrecyclingviapyrolysisandgas.Feedstockchoiceisdependentonlocalavaila-similartechnologieswillcreateastreamofrecycledbilityandprices.NorthAmericarelies,forinstance,33fuelthatcouldbedirectlyfedintotraditionalsteamonnaturalgasduetotheabundanceofethane,acrackers,asareplacementforoil.Weestimatethatbyby-productofnaturalgasextraction.Regionswith2050,1.1EJofthisrecycledfuelwillbeproducedeachlittlefossil-fuelextraction,suchasEuropeorGreateryear,coveringabout1%ofoilprimaryenergydemand.China,willusuallyusenaphtha,afractionofoilwhichcanbeeasilyimported.In2020,64%ofplasticsDemandforammonia,mainlydrivenbyfertilizerfeedstockdemandwascoveredbyoilandtherestviaconsumption,isexpectedtoslightlyincrease.Naturalnaturalgas(methanol-to-olefinsisnotincludedhere).gasorcoal(mainlyinChina)arecurrentlyusedtoTheseshareswillremainstableto2050.providehydrogenfortheproduction.Ammoniaproducedviaelectrolysis-basedhydrogencould80%ofammoniaisproducedfromnaturalgasbyreducethenon-energydemand,butsubsequentreusesteam-methanereforming,andthisshareisexpectedofCO2intheprocesstoproduceureawilllimitinteresttostayconstant,withanincreasinguptakeofcarboninthisalternative.Thus,productionusingfossilfuelscapture.Coalgasificationwillbeprogressivelyphased(withandwithoutCCS)willretaina90%sharein2050.outandwillrepresent7%ofammoniaproductionin2050versus18%in2022.Non-chemicalusesincludeapplicationsforasphalt(bitumen),lubricants,andsolvents.DemandfortheseThefuelmixforotherchemicalsiscloselyrelatedtothatforplastics,giventhatinmostcases(notforCONTENTSDEMANDELECTRICITYRENEWABLESFOSSILFUELSFINANCEPOLICYEMISSIONSREGIONSAPPENDIXDNVEnergyTransitionOutlook20231.5THEEFFECTOFENERGYEFFICIENCYFFIGIGUURREE11.X.27Asglobalpopulationsexpandandeconomiesgrow,wewillseeescalatingdemandforFlowofglobalfinaltousefulenergydemandthroughconversionsbyend-useequipmentin2022and2050energyservicesincludingtransportandconsumergoodsproduction,andfornewcategoriesofdemand,includingtheproductionofhydrogenonalargescale.AkeyelementofthisFlowofglobalfinaltousefulenergydemandthroughconversionsbyend-useequipmentin2022and2050surgeisenergyefficiency,whichstrivesformaximumvaluefromeachenergyunit.441EJ2022OilCoalOilInternalLossesNaturalgasCombustionBioenergyCoalTransport314EJHydrogenNaturalgasEnginesTransportAmmoniaManufacturingManufacturingE-fuelsBioenergyElectricMotorsGeothermalDirectheatBuildingsSolarthermalOtherLossesElectricityElectricityHeatUsefulenergydemandpinpointshowconsumedinefficiencybecomesevenmoreglaringwhenNon-energyBoilers,Motionenergyiseffectivelyconvertedintomotion,usablecomparedwithotherenergy-consumingsystems.FINALENERGYFINALENERGYburners,Light,computing,...heat,andlight,andcontrastsenergyusedefficientlyDEMANDBYCARRIERDEMANDBYSECTORfurnaces,Coolingwithenergythatiswasted.Figure1.27illustratesthisCombustionequipmentlikeboilers,burners,stovesNon-energybycomparingglobal'final'energydemandto'usefulfurnaces,andstoves—especiallythosefuelledbyenergy'in2022and2050.'Finalenergy'iswhatisfossilfuels—reflectasimilarstory.ApproximatelyHeatexchangersBuildingsOtherdirectlydeliveredtoend-usersinformssuchasoil,one-thirdoftheenergyinfuelsremainsunusedonNon-energygas,electricity,orhydrogenbeforethatenergyaglobalscale.WhileweacknowledgethatthereareElectricheaterscontinuousadvancementsintechnologyaimedatUSEFULENERGYisconvertedtoenergyservicesor‘usefulenergy’reducingenergyconsumptionacrosssectors,theLighting/electronicsDEMANDBYSECTORwithassociatedlosses.changesaremostlyincremental.Ourprojectionsindicatethatby2050,theaverageefficiencyofNon-energyBetween2022and2050,weprojecta90%increasecombustionequipmentwillonlyincreasetoaroundinglobalusefulenergydemandfrom314EJ/yrto49470%.Thisfigurealsofactorsinpotentialtechno-AmbientheatHeatpumpsEJ/yr.Inthesameperiod,thefinalenergydemandlogicalshiftssuchastheadoptionofgasforcooking24EJisexpectedtogrowbyonly10%to489EJ/yr.Thisinsteadofsolidbiomass.CONVERSIONBYdifferenceisstartlingandhistoricallyunprecedented,END-USEEQUIPMENTanditisessentialtodelveintothenuancestofullyOnthebrighterside,electricalequipmentlikeelectricunderstandthelandscapeweanticipate.motorsandheatersconsistentlydemonstratehigh610EJefficiencies,withmanyoperatingabovethe90%Ourobservationshighlighttheinherentinefficienciesmark.Heatpumpsstandout,offeringtheabilityto489EJ2050494EJinmanyenergy-consumingsystemstoday.Takethe'amplify'theinputfinalenergyintoagreateroutputTransportinternalcombustionengine,whichisprevalentintheofusefulenergybyextractingambientenvironmentalOilInternalLossestransportsector.Itstank-to-wheelefficiencytypicallyenergy.Itisthispotentialthatmakesthepushforelec-CoalCombustionManufacturingliesbetween25%and35%.Thispronouncedtrificationsynonymouswiththepushforefficiency.NaturalgasTransportReductioninBioenergyEnginesusefulenergydemandHydrogenManufacturingDirectheatElectricMotorsasaresultofBuildingsinsulation,behaviourchange,ElectricityOtherBoilers,Lossesrecycling,automation,modalburners,FINALENERGYNon-energyfurnaces,shifts,etc.DEMANDBYCARRIERFINALENERGYstovesDEMANDBYSECTORBuildingsHeatexchangersNon-energyOtherElectricheatersLighting/electronicsNon-energyAmbientheatHeatpumps2050113EJUSEFULENERGYDEMANDUSEFULENERGYIFDEMANDSCALEDBYGDPDEMANDBYSECTORGROWTHFROM2022TO2050CONVERSIONBYEND-USEEQUIPMENTHistoricaldatasourceforfinalenergy:IEAWEB(2023),usefulenergy:DNV’sownestimates34CONTENTSDEMANDELECTRICITYRENEWABLESFOSSILFUELSFINANCEPOLICYEMISSIONSREGIONSAPPENDIXDNVEnergyTransitionOutlook2023Airconditioners,functioningasreversedheatWhilethesestrategiesdonotdirectlyimprovetheandhydrogen,requiretransformationfromprimarytorenewables,mainlysolarPVandwind,leadstoapumps,deserveamention.Weprojectthatbyratiooffinaltousefulenergy,theydohavethesources,whetherrenewableorfossil-based.Figuremassiveincreaseintheshareofprimaryenergythat2050,themajorityofheatpumpswillbeemployedpotentialtocurbusefulenergyconsumptionoreven1.28chartstheevolutionoflosssourcesintheglobalisconvertedtousefulenergy—fromhalftothree-forspacecooling.Asincomelevelsinpreviouslynegatetheneedforitaltogether.Bycomparingenergysystem.Powergeneration,encompassingquarters.Asthesesourcesdirectlyconvertcapturedlow-incomeregionsriseandaselectrificationtheusefulenergydemandweprojectfor2050withelectricityanddirectheat,isthechiefcontributorofenergytoelectricitywithoutheatloss,theirgener-continuesitssteadymarch,accesstocoolingwillahypotheticaldemandthatwouldscalelinearlylossbetweenprimaryandfinalenergy.Otherlossesationisdeemed100%efficient.Nuclearenergyexpand.This,pairedwiththechallengesofglobalwithglobalGDP,weestimatethatthesestrategiesemergefromconversionslikehydrogenproductionstandsat33%efficiency,countingtheheatfromwarming,leadsustoanticipatethatspacecoolingwillreducetheenergydemandbyabout118EJ/yrandtheenergysystem'sconsumption,termednuclearfueldecayasprimaryenergy.Asrenewableswillemergeastheprimaryusefulenergydemand(19%)fromanexpected610EJ/yr.Thatisalmostthe‘energysectorownuse’,andarenotincludedinfinaldominateby2050,powersystemefficiencywillrisecategoryby2050.equivalenttheentire2022energydemandofChina.energydemand.to70%,upfrom44%in2022.EvenwiththedoublingHowever,itisalsocrucialtonotepotentialreboundofelectricityanddirectheatdemandfrom2022toTheshifttorenewablesleadstoamassiveeffects,suchasconsumersoptingforlargervehiclesHistorically,traditionalelectricitygenerationfrom2050,powergenerationlossesremainconstant.increaseintheshareofprimaryenergythatwhenfuelischeaporincreasingtheirheatinguseifcoal,gas,andoilwashighlyinefficient,losingmuchisconvertedtousefulenergy—fromhalftogaspricesdecrease.Thesecouldpotentiallydriveupprimaryenergyasheat.In1990,globalpowerBetween2000and2019theprimary,final,andusefulthree-quarters.thedemandforenergyservices.systemefficiencywasjust34%.However,theshiftenergysupplygrewatsimilarrates.Thecompoundannualgrowthrateinthisperiodhasbeen2.3%/yrBy2050,theheatextractedbyheatpumpswillFigure1.27alsoincludesnon-energyprocesses,forusefulenergy,1.9%/yrforfinalenergyand2.0%/effectivelyoffsetthecumulativelosseswitnessedincludingusingfossilfuelsasfeedstockforproductsyrforprimaryenergy.From2019to2050,however,ininternalcombustionengines,boilers,heaters,likeplastics,bitumen,andotherchemicals.Strictlywhileusefulenergyprovidedwillcontinuetogrowatfurnaces,andstoves.Asaresult,thetotalusefulspeaking,theseprocessesdonothavean‘energyarateof1.5%/yr,finalenergywillonlyriseby0.4%/yrenergysupplyisprojectedtomarginallysurpassefficiency’assuch,butwehaveincludedtheminandprimaryenergyby0.2%/yr.totalfinalenergy.Thisrepresentsasignificantshiftourconsiderationsbecausenon-energyuseisoftenfromthesituationin2022,whentheglobalusefulincludedinenergystatistics.Theroleofstandards,policies,andinitiativesenergyconstitutedamere72%ofthefinalenergyImprovementsinenergyefficiencyoftenneces-supply.Usefulenergydemandsitateafinancialcommitment,typicallyinreplacingFigure1.27excludesconsiderationsofelec-outdatedequipmentwithmodern,efficientalter-Strategiesaimedatreducingthedemandforenergytricityoriginsandassociatedgenerationlosses.nativesorupdatingexistingstructurestobetterservices—suchasinsulatingbuildings,boostingContrasting'useful'withboth'final'and'primary'conserveenergy.Whiletheseupfrontinvestmentsrecyclingrates,orlevyingcongestionchargesonenergyoffersdeeperinsights.While'finalenergy'yieldlong-termbenefitsintheformofreducedvehicles—playasignificantroleinourpredictions.referstoenergydirectlydeliveredtousers,'primaryenergyconsumptionandcostsavings,theycanbeenergy'denotesitsraw,pre-transformedstate.inaccessibletothosewithoutampleresources.ThisEnergysourceslikefossilfuelscanbeconsumedhighlightstheessentialroleofstandardsandpoliciesdirectly,despitehighconversionlosses.However,inensuringthatimplementationofenergy-efficiencysecondaryforms,includingelectricity,directheat,measuresisbothaffordableandwidespread.The35CONTENTSDEMANDELECTRICITYRENEWABLESFOSSILFUELSFINANCEPOLICYEMISSIONSREGIONSAPPENDIXDNVEnergyTransitionOutlook2023standards,policies,andinitiativesforenergyefficiencyPublicsectorinitiatives:Governmentsoftenenact36fallintodifferentcategories:thesetoensurethattheirownoperationsandpublicstructuresadheretohighenergy-efficiencyApplianceandequipmentstandards:Policiesinthisstandards.Canada'sGreeningGovernmentStrategy,categorydictatetheminimumefficiencyrequirementswhichseeksasubstantialreductioningreenhouseforhouseholdandcommercialappliancesandgasemissionsfromfederalundertakings,isonesuchequipment.Forinstance,theUSDepartmentofinitiative.Energy(DOE)EnergyPolicyandConservationAct(EPCA)prescribesenergy-efficiencystandardsforLabellingandcertificationprogrammes:Byvariousconsumerproducts,ensuringtheymeetsetprovidingconsumerswithclearinformationonaefficiencythresholds.product'senergyefficiency,theseprogrammesempowerinformedchoices.TheENERGYSTARBuildingcodes:Thesestandardsestablishtheprogramme,initiatedintheUSandnowrecognizedminimumenergyperformancemetricsfornewinternationally,isaprominentcertificationforconstructionsandrenovationstoensureenergyenergy-efficientproducts.conservation.TheEU'sEnergyPerformanceofBuildingsDirective(EPBD)exemplifiesthisbyMarket-basedinstruments:Thesemechanismsmandatingthatallnewstructuresapproximateanearencouragetheadoptionofenergy-efficientprac-zero-energyconsumptionbythecloseof2020.ticesbyoffsettingtheircosts.Policiesmightoffertaxbreaks,subsidies,orgrantsforenergy-efficientVehicleemissionandfuel-efficiencystandards:Suchupgrades.TheUK'sGreenDeal,whichgrantsloanspoliciesspecifyboththeacceptableemissionlevelsforsuchenhancementsrepaidthroughenergybillfromvehiclesandtheirminimumfuelefficiency.savings,isanillustrativemodel.Forexample,theCorporateAverageFuelEconomy(CAFE)standardsintheUSoutlinestrictfuelBehaviouralprogrammes:Targetingthemannerinconsumptionnormsfornewpassengervehicles.whichindividualsandentitiesutilizeenergy,theseinitiativespromoteenergy-conservinghabits.Japan'sUtilitydemand-sidemanagementprogrammes:CoolBizcampaignencouraginglighterworkplaceTheseinitiativesbyutilitycompaniesaimtoreduceattiretodiminishair-conditioninguseshowcasesthisconsumerenergyusethroughincentivesorassis-approach.tance.Programmesmightincluderebatesforpurchasingenergy-efficientappliances,orsupportforbusinessestoadoptenergy-conservingmeasuresintheiroperations.CONTENTSDEMANDELECTRICITYRENEWABLESFOSSILFUELSFINANCEPOLICYEMISSIONSREGIONSAPPENDIXDNVEnergyTransitionOutlook20231.6FINALENERGYDEMANDFROMALLSECTORS37ThefinalenergydemandbyenergycarrierforalldemandsectorscombinedisshowninFigure1.29.Themostnoticeablechangeisthegrowingroleofelectricityinfinalenergydemand.In2022,electricityrepresentedjust19%ofworldHydrogenandhydrogenderivativesalsogrowfinalenergyuse.Bymid-century,thiswillbe35%,stronglyintheETOforecast,butstartfromaverywithelectricitydemanddoublingfrom86EJperyearlowbase.Fromanegligiblecontributiontoday,theyin2022to171EJin2050,averaging2.5%growthwillreach0.4%offinalenergydemandin2030andannually.Theimportanceofelectricityisalsogreater5%by2050.thanthe35%indicates:withhigherefficiencyinitsendusethantheotherenergycarriers,wecanDirectuseofbiomassremainsmoreorlessstaticsafelysaythatmorethanhalfofallenergyservicesinat10%ofglobalenergydemandthroughoutourmid-centurywillbeprovidedbyelectricity.forecastperiod.Directuseoffossilfuelreducesoverthecomingyears,butthedeclineislessthanfortheTechnology,cost,andpolicyallcontributetotherisefossilfuelsusedinelectricityproduction.Directuseofofelectricity.Withsuperiorefficiency,electricityhasfossilfuelmeets67%oftoday'sfinalenergydemand,aninbuiltadvantageoverotherenergycarriers.Anbutnearlyathirdless(47%)in2050.Theenergyoften-repeatedpieceofgeneraladviceisto‘usecarrieraddsnuancetothistrend:coalusealmostelectricitywhereverelectricitycanbeused’.Costhalving,oilusedecliningbymorethanathird,andreductionsforsolarandwindpowerhavebeendirectuseofnaturalgasremainingvirtuallystatic.significantandareexpectedtocontinue,supportingelectricitybecomingcheaperthanotherfuels.NewWithhigherefficiencyinitsendusethanapplicationsrequiringmodernenergyareemerging—theotherenergycarriers,wecansafelysayforexample,communicationappliancesandairthatmorethanhalfofallenergyservicesinconditioning—forwhichtherearefewornoalterna-mid-centurywillbeprovidedbyelectricity.tivestoelectricity.Additionally,becauseelectricityisfairlyeasytodecarbonizecomparedwithotherenergycarriers,evermoreambitiousdecarbonizationpoliciesarealsofavouringelectricity.CONTENTSDEMANDELECTRICITYRENEWABLESFOSSILFUELSFINANCEPOLICYEMISSIONSREGIONSAPPENDIXDNVEnergyTransitionOutlook2023Highlights2ELECTRICITYANDHYDROGENGlobalelectricitydemandwillmorethandoubleotherwise-curtailedorzero-pricedpowerfrom2.1Electricity�39throughto2050.Importantly,thepowermixwillwindandsolar.rapidlytransformatthesametimetobecome2.2Powergrids�52dominatedbynon-fossilsources(renewablesandRisingelectricitydemandwillseeadramaticnuclear).Solarandwindpowerwillsupplythelion’sexpansionoftransmissionanddistributiongrids,shareofelectricitybymid-century,andweexplorewhichnotonlymorethandoubleintermsoftheimplicationsofthisforthepowersystem—e.g.circuit-kilometresbutrequireinvestmentin,theneedfordramaticallymorestorageandflexi-andapplicationof,advanceddigitalizedcontrolbility,includingdemand-sidemeasures.Wediscussmechanisms.theimplicationsforthepowermarketandtheroleofhydrogenelectrolysisinofferingbothameans2.3Storageandflexibility�54ofstorageandarevenueopportunityfor2.4Hydrogen�572.5Directheat6238CONTENTSDEMANDELECTRICITYRENEWABLESFOSSILFUELSFINANCEPOLICYEMISSIONSREGIONSAPPENDIXDNVEnergyTransitionOutlook20232.1ELECTRICITYElectricitystandscentralintheongoingglobalenergytransition,shapinginnovationsandstrategiesinbothsupplyanddemandsectors.Thistransition,delineatedbytheevolvinginterplayofrenewablesandconventionalpowersources,ismarkedbyshiftsinconsumptionpatterns,investmentflows,andtechnologyadvancements,steeringthefuturetrajectoryofglobalenergydynamicsandenvironmentalsustainability.2.1.1Electricitydemandglobalelectricitydemand,morethandoublingfrom29.5petawatt-hours(PWh,or29,500terawatt-hoursWorldelectricitydemandhasbeengrowingbyTWh)demandedin2022toreach60.8PWhin2050.about3%peryearsincethe1980s,inlinewithThesenumbersincludetheenergysector’sowneconomicgrowth.By2050,weanticipateasurgeinuseandtransmissionanddistributionlosses(Figure2.1).Electricitywillconstitute35%oftheworld'sfinalthereareefficiencygains,forinstanceinlighting,energydemandin2050,upfrom19.5%in2022.Thisnewconsumptionareas,particularlyspaceheatinggrowthislargelydrivenbytheburgeoningdemandandcooling,areemerging.Heatpumps,despiteforexistingapplicationsaswellaswholenewcate-theirefficiencyintransferringmoreheatthantheygoriesofdemand,forexampletheelectrificationconsume,aresettoamplifyaccesstoairconditioning,oftransportandinnovativeenergysolutionslikeadding5.9PWhofannualelectricitydemandhydrogenproduction.between2022and2050.Inindustry,electricitypowersmachinesandappli-Transportwillaccountforasignificantsliceoftheancesproducingdiversegoods.Fluctuationsinpiewith5.9PWh/yrofthe31.3PWh/yrspikeinproductdemand,insyncwitheconomicactivities,demand,primarilyduetothechargingdemandsdirectlyinfluenceelectricityconsumption.Concur-ofanexpected2.6billionEVs.Additionally,manu-rently,buildings,drivenbypopulationgrowthandfacturing'selectricitydemandisrising,underlinedhigherlivingstandards,useelectricityforanarraybyincreasedmechanization,especiallyingrowingofpurposesfromlightingtoentertainment.Whileeconomies.39CONTENTSDEMANDELECTRICITYRENEWABLESFOSSILFUELSFINANCEPOLICYEMISSIONSREGIONSAPPENDIXDNVEnergyTransitionOutlook2023Asweapproach2050,electrolysersconnectedtothehaveverysmallornotaxonelectricity.IncreasingthePowerlinesrisingaboveHongKong—gridwilluse1.2PWh/yrofelectricitytodeliver24Mt/yrtaxburdeninthesecountrieswouldcreateasimilarGreaterChinaistheworld'sleadingelectricityofhydrogen,whileanother2.7PWh/yrwillservethedeviationfromourelectrificationforecast.consumer(32%ofglobalelectricitydemand).productionoffuelslikeammoniaormethanol.Wealsonoteanexcluded10.2PWh/yrofrenewableRegionalvariationinelectricitydemandThissharewillfallto26%in2050,buttheelectricityreservedforonsitehydrogenproductionGreaterChinaistheleadingconsumerofglobalregionwillstillholditsleadingposition.fromrenewables.electricityasof2022,accountingfor32%ofglobaldemand.WhileitispoisedtomaintainitsleadingSignificantvariationsexistinelectricity-relatedleviespositioncome2050,itsdemandsharewilldecreaseamongnations,withsomeEuropeanregionshavingto26%.Incontrast,weanticipatetheIndianSubcon-taxesandleviesamountingtooverhalfofthetinenttoleapfrogbothEuropeandNorthAmericabyelectricitybill.Weanticipateataxshiftawayfromelec-2050,commanding14%oftheglobalelectricityshare.tricity,butdeviationsfromthistrajectory,particularlyinlow-incomecountries,mighthinderourelectrificationUpuntil2035,theIndianSubcontinentandSouthforecast'srealizationpace.Manylow-incomecountriesEastAsiaaresettoshowcasethemostremarkable40CONTENTSDEMANDELECTRICITYRENEWABLESFOSSILFUELSFINANCEPOLICYEMISSIONSREGIONSAPPENDIXDNVEnergyTransitionOutlook2023growthinelectricitydemand.Fromtheirexistinglow2050,weenvisageanearlycompletetransitiongeneratorstoconsumers,eveninareaswithoutariseFirstly,integratingrenewables,especiallyinter-electrificationratesacrosspivotalsectors—includingtoEVsinChina,leavinganegligiblescopeforinannualaveragedemand.mittentsourceslikewindandsolar,magnifiescooling,appliances,andmanufacturing—wepredictelectrificationinthetransportsectorbythelateelectricitygenerationvariabilityandimpactstheextensiveelectrificationinitiativesandsubstantial2040s.Unlikeitswesterncounterparts,GreaterTounderstandtherelationshipbetweenpeakandloadfactor,butadvancementsinenergystoragedemandgrowthwithintheseregions.Chinamightnotheavilyinvestingrid-connectedaveragedemand,wefocusontheloadfactor—theandgridmanagementwillbufferandevenreverseelectrolysers,furtherstabilizingitsmid-centuryratioofaverageloadtothesystem'speakload.Thisthesevariationsinmanyhigh-incomeregions.TheFast-forwardingtothetimeframebetween2035electricitydemand.metricshowcasestheelectricalload'sconsistencydrivetowardselectrifyingtransport,mainlytheand2050,andSub-SaharanAfricaemergesastheandvariability.Ourglobalestimateshowsa78%risingadoptionofEVs,issettoredefineelectricityglobalfront-runnerinelectricitydemandgrowth,Sub-SaharanAfricaemergesasthegloballoadfactorin2022,butweprojectadecreasetodemandpatterns.AlthoughconcentratedEVaveraginganimpressive5.8%annually.Factorssuchfrontrunnerinelectricitydemandgrowth,76%by2050(Figure2.3).Thissignifiesgrowthinchargingcouldheightenvariability,EVsintroduceaspotentialeconomicadvancementsandanantici-averaginganimpressive5.8%annually.peakloadoutpacingannualaveragedemand,aflexibilityviavehicle-to-gridmechanisms.Moreover,patedpopulationsurgeunderlineSub-Saharantrendtowardsincreasedvariability,asthenetresultdemand-sidemanagement,throughinnovationsAfrica'smonumentalelectricitydemandsurge.ThisLastly,intheMiddleEastandNorthAfrica,thereofmanyopposingfactorshappeningsimultaneouslylikesmartgrids,real-timepricing,anddemand-evolutionunderscoresthevastopportunityawaitingisasurgeinbuildingelectrification,predominantlyandatvariousratesacrosstheworld.responseschemes,willhelptemperpeakdemand,theregioninharnessingrenewableenergysourcesdrivenbytherisingGDPpercapitaandconsequentpushingtheneedletowardsamorebalancedandelectrifyingamultitudeofitsdemandfacets.expansioninspacecooling.Thistrend,combinedelectricityconsumption.withsimilardevelopmentsinSouthEastAsiaandHigh-incomeregionslikeNorthAmerica,Europe,LatinAmerica,suggestsanaccelerationinelectricityConcurrently,stridesinenergyefficiencywillinduceandtheOECDPacificwillhaveslowergrowthtrajecto-demandpost2035.Instarkcontrast,NorthEaststeadierelectricityusage,affectingtheloadfactor.ries,attributabletotheiralready-highratesofelectri-Eurasiamighttrail,withtheslowestgrowthduetoRegionswithescalatingindustrialoperationssuchficationcoupledwithmodesteconomicexpansion.stagnantpopulationmetricsanddelayedelectrifi-asSub-SaharanAfricawillseeanincreaseinloadHowever,theadventofnewelectricity-consumingcationcomparedtoitsglobalpeers.factorduetothecontinuousnatureofindustrialsectors,notablytransportandhydrogenproduction,powerconsumption.Conversely,regionssuchasensuresgrowthinelectricitydemandinthesePeakdemandGreaterChinathathaveanincreasedshareoffluc-regionsremainsabovestagnationevenby2050.Addressingtrendsinpeakelectricitydemand,nottuatingresidentialusage,especiallyveryseasonaljusttheannualaverages,iscrucial.Peakdemandend-useslikespaceheatingandcooling,combinedDivingdeeperintorecenttrendsinGreaterChina,criticallyaffectsbothpowergeneratorsandthewithareducedshareofindustrialdemandandverywehaveobserveditselectricitydemandgrowthregionaltransmissionanddistributiongrids.Wehighpenetrationsofsolarandwind,willexperiencerate,whichhasbeenabove5%annually,ispredictedneedtobolsterandexpandthegridinfrastructure,acontinuedincreaseinthepeakloadanddecliningtodecelerateto3.2%upto2035andthenfurtherensuringitcaneffectivelytransferpeakpowerfromloadfactorthroughouttheforecasthorizon.Notably,diminishtolessthan1%inthesubsequent15years.extremeweathereventstriggeredbyclimatechangeSuchashiftisanticipatedduetoChina'simpendingcouldproducestarkdemandpeaks,especiallypopulationandeconomicstabilization,coupledwithduringeventslikeheatwaves—anelementnotitsaggressivestanceonvehicleelectrification.Byincludedinourprediction.41CONTENTSDEMANDELECTRICITYRENEWABLESFOSSILFUELSFINANCEPOLICYEMISSIONSREGIONSAPPENDIXDNVEnergyTransitionOutlook20232.1.2ElectricitysupplyRenewableshavebeenanintegralpartoftheglobalEconomicsplayapivotalroleinthisshifttowardsforecastitsgrowthatanimpressive12%annuallyelectricitysystemforoveracentury,mainlyintheformrenewables.Solar,withitsdwindlinglevelizedcosts,from2022tothemid-centurymark.Theglobalelectricitylandscapeisonthebrinkofofhydropower.AsFigure2.5reveals,2003markedthewillcommanda39%shareinthe2050globalpowermonumentalchange.However,thetransitionfromfossillowestshare(17.8%)ofrenewablesinthepowersystem,mix.Enhancingsolar'sappealistheintegrationItiscrucialtoacknowledgethatregionssuchasthefuelstorenewablesispepperedwithchallenges.Fromafterwhichtheysteadilyrecoveredtoashareof31%ofstoragesolutionswithsolar,allowingenergyMiddleEastandNorthAfrica,theIndianSubcontinent,its2022baselineof8.8PWh/yr,renewableelectricityin2022.However,thisisareboundfromadeclinethatconsumptionevenaftersunset.AlthoughwindandNorthEastEurasiamightnotmirrorthisglobalgenerationworldwideissettogrow15PWh/yrthroughlastedfromthepinnacleofrenewablesin1919until2003energyisgenerallymoreexpensivethansolar,itistrendimmediately.Theircontinueddependence2035(Figure2.4).Yet,anincreaseindemandby13.6(Figure2.5).Thisdeclinecanbeattributedtotheemer-expectedtogrowinpopularityacrossallregions.onfossilfuelsarisesfromacombinationoffinancialPWh/yrduringthesameperiodpresentsachallenge:genceofnewenergysources,notablyoil,naturalgas,Unlikesolarenergy,windisapotentially24-hourconstraintsandunderdevelopedrenewableinfra-whilethegrowthinrenewablesisimpressive,itmightandnuclearpower.Thedecliningcostsofsolar,wind,sourceofenergy,eventhoughitsoutputcanvary.structure.GreaterChina'scoalconsumptionforprimarilymeetthegrowingelectricitydemandratherandstoragetechnologiesofferachanceforreversal.Wind'scontributionby2050isanticipatedtobeelectricitygenerationwillremainunparalleleduntilthansignificantlycurtailfossil-fuelreliance.ItisonlyWeforecastthatby2033,theshareofrenewableswill30%ofthepowersupply:21%fromonshore,7.3%themid-2040swhentheIndianSubcontinentispoisedafterthemid-2030sthatweanticipaterenewableseclipsethe1919peakof51%,furtherexpandingtoafrombottom-fixedoffshore,and1.6%fromfloatingtoovertakeit.Meanwhile,theuseofnaturalgaswillwillgenuinelystartsurpassingthisdemandandmakestaggering82%by2050.Outofthis,solarandwindwilloffshoresetups.Theconsistencyandreliabilityremainprevalent,withtheMiddleEastandNorthinroadsintoreplacingfossilfuels.beresponsibleforasignificant69%oftotalshare.ofoffshorewind,coupledwithfewerconstraints,Africaholdingaleadingpositioningas-firedpowergenerationforthecomingtwodecades.Thistectonicshiftintheenergydomainwillunde-niablyimpactbothconventionalpowerprovidersandsystemoperators.Asrenewables,especiallysolarandwind,becomepredominant,thespacefortraditionalenergysourcestoprovideenergywillshrink.Thistransitionsignifiesarole-redefinitionformanypowerstationoperators,astheirfocusshiftstoofferingflexi-bilityandbackupduringdowntimesofrenewables.Itisnotablethatwhilefossil-fuelelectricitygenerationisprojectedtofallby50%between2022and2050,capacityinstallationwillseeonlya22%reduction.Thistranslatestoadiminishingutilizationrateforfossil-fuelstations.Interestingly,around8%ofglobalcapacitywillincorporatecarboncaptureby2050,especiallyinregionswithrigorousdecarbonizationpolicies,likeEurope.Furthermore,hydrogenisearmarkedtoemergeasanotableplayerinpowersupply'sdecar-42CONTENTSDEMANDELECTRICITYRENEWABLESFOSSILFUELSFINANCEPOLICYEMISSIONSREGIONSAPPENDIXDNVEnergyTransitionOutlook2023bonization,solidifyingitspositioninEuropeandtheSolarPVandwindhavealreadysecuredthemostOntheotherhand,conventionalpowerstationsoneofincreasingcostduetocostoverruns.WithOECDPacificby2050.competitiveLCOEinmanyareas.Theirdownwardfacelimitedscopeforfurthertechnology-driventhebalanceshiftingtoGreaterChinaandtheIndianLCOEtrajectoryisduetotechnologicallearningrates,costreductions.Consequently,factorslikefuelSubcontinent,andtheemergenceofsmallmodularTraditionalpowerstationsarelikelytofacecompetitiondrivenbytechnologicaladvancements,economiesofcosts,carbonpricing,andoperationaldurationreactors,weexpecttheaveragecostofnuclearfromenergystoragesystemsinthefuture.Yettheirvastscale,andimprovedmanufacturinganddeployment(capacityfactors)willdeterminetheirfuturecosts.todecreasetoUSD70–80/MWhby2030s.withaanddependablecapacitiesensuretheyremainindis-practices.From2020to2050,theselearningratesWhilecoal-firedpowerstationsareexperiencingrangeaslowasUSD50/MWh.pensabletotheenergyframework.Theseconventionalareprojectedat12%forsolarPV,13%foronshoreanupwardLCOEtrendduetodecliningcapacityThereal-termcostofcapitalisasignificantplantswillretaintheirinfluenceinprice-settingduetowind,and15%forfixedoffshorewind.Thismeansfactors,gas-firedpowermaintainsarelativelycomponentintheLCOEequationasitrepresentsthetheirhighmarginalcosts.Withtheseshifts,theconcepteachdoublinginglobalcapacitycorrespondstoasteadycapacityfactorandasteadyLCOEinthereturnrequiredbyinvestorstofundapowerproject.ofbaseloadsupplymightbecomearelicofthepastinrespectiveLCOEdropbythesepercentages.USD50–120/MWhrange,thankstoitslowercarbonItreflectstheriskperceptionofinvestorsaboutnumeroussystems(seefactboxonpage49).footprintandstrategicshiftstoregionswithmorevarioustechnologiesandregions.AhighercostofSolarPVissettobreaktheUSD30/MWhmarkbyaffordablegas.ThecostdatafornuclearisscarcecapitalincreasestheoverallfinancingcostofapowerAswenavigatethisevolvingterrain,severaldebates2030attheglobalaverage,withon-sitestorageandasmallnumberofprojectscanskewthedata,project,therebyraisingtheLCOE.andquestionsarise:WhatimpedestheswiftaddinganotherUSD22/MWhtothelevelizedcost.butthegeneraltrendinOECDcountrieshasbeenadoptionofrenewablesinthenextfewyears?CanaAverageonshorewindLCOEwillfollowsolarPV43reliableelectricitysupplybemaintainedwithahighwithafive-yeardelayinreachingUSD30/MWh.Weproportionofsolarandwindenergy?Willthesystemforesee2030globalLCOEforfixedoffshorewindtonecessitatevastelectricitystoragecapacities?HowbearoundUSD68/MWh,andforfloatingoffshoretowillexcessrenewablepowerbemanaged?IsthebeatUSD140/MWh.From2030to2050,theglobalfinancialluresufficientforexpandinggenerationandweightedaverageofsolarPVLCOEwillreducebystorage?Canthegridhandleaugmenteddemand1.5%peryear,reachingUSD22/MWh.Onshorewindandvariabilitywithoutescalatingcosts?Thesectionswillexperienceanaverage1.1%/yrreductionwiththatfollow,backedbyourresearchandourmodel,amid-centurycostofUSD27/MWh.FixedoffshoreendeavourtoanswerthesequestionsandcastalightwindwillstayabovetheUSD51/MWhmarkononthepathahead.average,butwillbeaslowasUSD32/MWhinideallocations.FloatingoffshorewillmaintainanaverageCosttrajectoriesUSD16/MWhcostpremiumfrombottom-fixedinThelevelizedcostofenergy(LCOE)isessentialfor2050,butsiteswithconsistenthighwindsandshortdeterminingthecost-effectivenessandappealofdistancestoshorewillbecompetitiveintermsofpowerstationinvestments.TheglobalaverageLCOELCOE.Hydropowercostsaredependentonsite-oftechnologies,whichrepresentsthecostofproducingspecificgeologicalconditions,projectscale,amegawatt-hourofelectricitythroughoutapowerengineeringchallenges,andenvironmentalandstation’slifespan,isdepictedinFigure2.6,illustratingregulatoryconsiderations.Theglobalaveragecostitsevolutionacrossvariouspowerstationtypes.istoremainaroundUSD75–100/MWh.CONTENTSDEMANDELECTRICITYRENEWABLESFOSSILFUELSFINANCEPOLICYEMISSIONSREGIONSAPPENDIXDNVEnergyTransitionOutlook2023TABLE2.1demand.Asvariablerenewablesgrow,weanticipateNear-termchallengesCostofcapitalassumptionsbypowerstationtypeandregionariseinthesecapacitymarkets.EmergingflexibilityDelaysinplanningandpermitting,especiallyinmarkets,whicharenotyetwidespread,willlikelyregionslikeNorthAmerica(theUS),Europe,andFossil-fuelfiredNuclearMaturerenewablesEmergingrenewablesbecomekeyinfuturepowersystems.Suchflexi-theIndianSubcontinent,arebecomingmajorroad-bilitymarketscompensatepowerproducersandblockstotheenergytransition.Windenergyprojects,NAM2022203020402050202220302040205020222030204020502022203020402050storageoperatorsfortheirabilitytorapidlyadjustnotablyoffshore,canfaceuptoadecadeofdelay,LAM12%16%18%20%6%5%5%4%6%5%5%5%11%8%5%5%electricityoutputinresponsetogriddemands.Inwhilecomplexgridinfrastructurescantakeupto15EUR12%18%18%20%10%9%9%8%8%7%6%6%13%10%6%6%ourmodel,wesegmentthesemarkets—energy,years,forinstance,duetointricatenegotiationswithSSA15%20%23%25%6%5%5%4%5%5%5%5%10%8%5%5%capacity,flexibility—distinctly.Whenthereisagaplocalcommunitiesorcross-borderpermitconsider-MEA9%16%18%20%10%10%10%10%8%7%7%6%13%10%7%6%betweendemandandsupplyofenergy,itcanspurations.ThesesetbacksnotonlyinflateprojectcostsNEE12%16%18%20%6%6%6%6%8%7%7%6%13%10%7%6%newinvestments,withtherevenue-adjustedLCOEbutalsosowuncertainties,potentiallydissuadingCHN14%11%11%11%14%11%11%11%14%11%11%11%19%15%13%11%actingasaguidetoidentifythemostcost-effectivefutureinvestments.Figure2.7showsthetrajectoryofINDtechnologies.WealsocomputesimilarmetricsfornewsolarandwindcapacityadditionsweforecastupSEA6%10%15%20%6%5%5%4%6%6%6%6%11%9%6%6%capacityandflexibilitytoinfluencethemixofnewto2040,showingasteadybutrestrainedgrowthinOPA9%16%18%20%8%8%8%8%8%7%7%6%13%10%7%6%investments.theshortterm.Whilesomeregulatoryinitiatives,like9%16%18%20%10%10%10%10%8%7%7%6%13%10%7%6%12%16%18%20%6%5%5%4%6%6%6%6%11%9%6%6%Maturerenewablesinclude:hydropower,bioenergy,solar,onshorewind,andbottom-fixedoffshorewind.Emergingrenewablesinclude:floatingoffshorewind.OurcostofcapitalassumptionscanbefoundinTabledifferencebetweenatechnology'sannualcapture2.1.SeeChapter5foramoredetaileddiscussionofpriceandtheprevailingwholesaleprice.Suchourcostofcapitalprojectionsacrossenergysources.adjustmentsensurethattechnologyearningsalignwithmarketdemands.WhileLCOEhasbeenthemainmetricinassessingthecompetitivenessoftechnologies,itsinabilitytoPowerstationsalsoreceivecompensationforreflectrevenuesmakesitanincompletemeasureforensuringacertainportionoralloftheircapacitydeterminingfutureinvestments.Toovercomethisisavailableduringtimesspecifiedbythesystemlimitation,asshowninFigure2.6,weusetheenergy-operator.Thisarrangementunderpinsgridrelia-revenueadjustedLCOE.Thismetricaccountsforthebilityandensuresadequatecapacityduringpeak44CONTENTSDEMANDELECTRICITYRENEWABLESFOSSILFUELSFINANCEPOLICYEMISSIONSREGIONSAPPENDIXDNVEnergyTransitionOutlook2023Europe'sRePowerEUplanandIndia'sEnvironmentalLong-termchallenges45andSocialImpactAssessmentsframework,aimtoaddressthesechallenges,abroadershiftintheregu-Adequacylatorymindset,prioritizingproactivegridinvestmentsEnsuringthefuturepowersystem'sadequacy—theandupgrades,iscrucialforaseamlessenergytran-abilitytoconsistentlymeetdemand—remainscrucial,sition.OurdiscussiononpermittingdelaysinSectionespeciallywiththerisingintegrationofVRESand3.2onpage73exploresthisissueinmoredetail.changingconsumptionhabits.ArepresentationofthecoreofthischallengeisshowninFigure2.8,whichInadditiontotheplanningandpermittingchallengespresentsthesimulatedelectricitysupplyanddemandfacedbytherenewablessector,renewablepowerdistributionforEuropein2022and2050.Contraryconfrontsasetofpressingshort-termchallenges.tointuition,themostpressingadequacychallengesTheglobaluptickininterestrates,drivenbymajorin2050willnotemergeduringthehoursofpeakcentralbanks,issettoinflatebothdebtandequitydemand.Thereason?Solaroutput,forexample,alignscapitalcoststhrough2023and2024,hamperingwellwithhigh-demandhours.Instead,thechallengetheeconomicfeasibilityofprojects.Manufacturersappearsduringhourswithminimalsolarandwindaregrapplingwithdwindlingprofitmarginsduetooutput.surgingrawmaterialcosts,especiallysteelforwindturbines,andacceleratedtechnologicalevolutionInoursimulations,whichuse2015representativeprofilesleadingtocomponentqualityissues.Supply-chainforsolarandwindoutput,thehourshowcasingthelargestbottleneckshavefurtherexacerbateddelaysanddisparitybetweendemandandthesumofsolarandcostsforwindprojects.Concurrently,therapidwindoutput—the'residualload'—demandsnomoreevolutioninwindtechnology,markedbyenhancedthan772GWfromdispatchablegenerationsources.componentdesignsandincreasingrotorsizes,By2050,combiningdispatchablethermalgenerationistemporarilycurbingthetraditionalcost-saving(316GW)andhydropower(606GW)cansurpassthisbenefitsaccruedfrommassproduction.Furthermore,residualload,evenifsomecapacityisunavailableduetomandatesforlocalcontentinemergingmarketsmaintenance.Furtherbolsteringthiscapacity,weexpectsometimesbecomeimpedimentsratherthanincen-atleast5–10%of544GWofsolar+storagetobeacces-tives,ascomplianceprovesoverlycostlyorcomplex,sibleevenduringwinterdays,complementedby316leadingtocontractfailures.WeforeseetheimpactGWofstandaloneLi-ionbatteries,39GWoflong-ofthisintheformofincreasedsolarinvestmentcostsdurationbatteries,andover250GWofvehicle-to-grid.ofaround10%inEuropeuntiltheearly2030sastheAlthoughtheuseofstorageandvehicle-to-gridhingesregionbringsitssupplyfromChinatoEurope.Sectionontheirchargestateduringpeakresidualloadhours,3.2hasmoreonshort-termchallengesforwindweareconfidentthatwithstrategicplanning,aindustry.significantportionofthisstoragecanbetappedinto.CONTENTSDEMANDELECTRICITYRENEWABLESFOSSILFUELSFINANCEPOLICYEMISSIONSREGIONSAPPENDIXDNVEnergyTransitionOutlook2023ThecurvedisplaysEurope'saggregatesupplyandweekendsandshiftingelectricheatingandcoolingmaximizetheiroperationalcapacityduringhigh-Fromourstudies,wehaveidentifiedthatsolarPVdemand,organizedbytotalload.Forclarity,hoursaredemandsthroughouttheyear.pricedperiodstobolsterrevenues.Coupledwiththis,startsfeelingthepinchofpricecannibalizationoncegrouped,notplottedindividually.Thisgroupingcausesconsumers,armedwithsmartmetersandappliances,renewablepenetrationhitsthe20%mark.AsthetheappearanceofsolarPVoutputatalltimes,evenInasystemdevoidofsolarandwind,addressingwillincreasinglyshifttheirconsumptionpatterns,penetrationofrenewablesescalates,thecaptureduringhourswhenEuropehasnosolargenerationduehighdemandwouldnecessitaterampingupthermalmovingfromhigh-pricedhourstocheaperones.ThispriceforsolarPVcorrespondinglydiminishes.Toputtolackofsunlight.Curtailedoutputisnotshown.powerplantsanddeployingcostlydieselgenerators.evolvingdynamicwilleventuallybringaself-balancingthisintoperspective,ata70%variablerenewablesThistypicallyescalateselectricityprices,establishingfeedbackintoplay:asflexibilityprovidersincrease,penetration,solarPV'scapturepricedwindlestohalfHowever,real-worldpowersystemsfaceadditionalanaturalcorrelationbetweendemandandprice.thedemandforsuchflexibilitydecreases.Forathetypicalwholesaleelectricityrate.Incontrast,duechallengesnotcoveredinoursimulations,suchasHowever,aswedecipherfromthe2022supplychart,comprehensiveoverviewofthisfutureflexibilitytothereducedcorrelationbetweenwindgenerationgridconstraintsandunplannedoutages,oftenexac-renewablesarealreadyalteringthisconventionallandscape,theinfographiconpage47divesdeeperpatternsandelectricitydemand,windenergyfeelsaerbatedbyextremeweatherleadingtoextendedgenerationlandscape.SolarPV,forinstance,primarilyintooperationsofthepowerdispatchatvarioustimemarginalcannibalizationeffect.lowwinddurations.Hence,systemsincorporategenerateselectricityduringdaytimehoursofpeakscales,offeringinsightsbasedonoursimulations.extrasafetymargins.Thekeydebaterevolvesarounddemand.Thisdiminishestheneedforfossil-fuelgener-Asflexibilityprovidersincrease,thedemandtheprecisemarginrequired,influencedbytheation,therebyinfluencingtheoperationalpatternsandFurthermore,ownersofflexibleassetsstandtogainviaforsuchflexibilityreduces,bringingaself-system'sscale.Forinstance,smallersystemsmighteconomicviabilityofcoalandgaspowerplants.directremunerationsfromsystemoperators.Already,balancingfeedbackintoplay.needmoresubstantialmarginsduetovulnerabilitystoragesystemsandpowerplantsarecompensatedtoextremeweather,whilelarger,continental-scaleFastforwardto2050,theeffectsofsolarandwindforancillaryservices,suchasfrequencycontrol,whichInterestingly,opportunisticgenerationtechnologies,systemscanreliablyassumenon-zerowindandsolaronconventionalgenerationbecomeevenmoreallowsminorsupplyadjustmentsrangingfrommilli-suchassolarcombinedwithstorage,alongsideavailability.Ourmodellingalsoincorporatesthesepronounced,totheextentthattheymaychallengethesecondstoseveralminutes.Withthesurgeinvariabletraditionalfossil-firedpowerplants,willwitnesssafetymarginneeds.Additionally,enhancinginter-veryexistenceofconstant,or'baseload',generatorsrenewables,weanticipateamoresignificantroleforasurgeintheircapturepricescomparedtothecountryconnectionsandintroducingotherflexibilitylikenuclearpower.Thisheightenedsupplyvariationtheseflexibilitymarkets.Forathoroughexplorationofregionalaveragewholesaleprice.Thistrendismeasuresemergeaspivotalstrategiesforreinforcingispoisedtoofferampleopportunitiesforflexiblethistopic,turntothefactboxonpage50.vividlyillustratedinFigure2.6,whichshowcasesthisadequacy.energysuppliers.thedisparitybetweenLCOEandrevenue-adjustedPricecannibalizationLCOE.Takingrevenueadjustmentsintoaccount,FlexibilityOnelucrativeavenuecapitalizingonthesefluctua-Pricecannibalizationisaloomingchallengeforthesolar+storageemergesasthemostpromisingFlexibilityinpowersystemsisbecomingincreasinglytionsispricearbitrage.Aspricedifferentialsexpandcontinuedgrowthofvariablerenewables.Essentially,electricitysource,aconclusionfurtherbolsteredbyparamount,asevidencedbythe2022Europeanthroughoutdays,weeks,orevenyears,opportunitiesitreferstothephenomenonwhererevenuesofitsproportioninoverallinvestments.WhilerevenueelectricitydemandshowninFigure2.8.Here,demandarisetopurchaseelectricityinexpensivelyduringvariablerenewablesdiminishduetoasignificantadjustmentssomewhatupliftconventionalgener-fluctuatesbetween290GWand510GW,withthesetimesofabundantrenewableoutputandtosellpresenceofsolarandwindinthesystem,leadingtoation'sappealoverpureLCOE,thecostgapwithvariationsmainlyattributedtodailyend-useactivitiesduringpeakpricinghours.However,competitionmorehoursannuallywithpricesdictatedbytheserenewablesbecomesoverwhelminglyevident.suchastheoperationofappliances,lighting,andloomslargeatbothpricingextremities.Electro-zero-costtechnologies.Thispotentialforpricecanni-waterheating.Additionally,distinctpatternsemergelysers,forexample,mightrivalstoragesystemsbybalizationthreatensthefutureappealofrenewables46duetovariationsacrossdaysoftheweekandmonths,buyingcheapelectricitytoconvertintohydrogen.thatdonotintegratestorage,withsolarPVbeingresultingfromfactorslikeofficeclosuresoverConversely,conventionalgeneratorswillaimtoespeciallyvulnerable.CONTENTSDEMANDELECTRICITYRENEWABLESFOSSILFUELSFINANCEPOLICYEMISSIONSREGIONSAPPENDIXDNVEnergyTransitionOutlook2023MODELLINGPOWERHOURBYHOURHereweillustratehowourhourlypowerAnnualelectricitydemandbysegmentcomesfromInthefigurebelow,weexpandtheyear2050over52Winter'slowsolaroutputisoffsetbyhigherwindanddispatchmodeloperateswithreferencetothecorrespondingpartsofthemodel.Investmentinweeks.Solar,wind,andheating/coolingloadprofilesseasonalflexibilityfromconventionalgenerationandregionEuropeandyear2050.newcapacityisbasedonenergy,firmcapacityandfluctuateovertheyear.Dispatchablegenerationandpower-to-hydrogen.flexibilityneeds.Technologymixisdecidedbystoragereacttoprice.Allprofilesareaggregatedrevenue-adjustedlevelizedcost.overEurope.47CONTENTSDEMANDELECTRICITYRENEWABLESFOSSILFUELSFINANCEPOLICYEMISSIONSREGIONSAPPENDIXDNVEnergyTransitionOutlook2023MODELLINGPOWERHOURBYHOURThechartbelowfocusesonweek37.StorageandAtnight,storedelectricityisreleased,whileHourly,themodelsetsdemandandsupplycurves,hydrogenproductionrespondtopricesignals.Duringsolar+storageplantsprovidepower.shownbelow,representingthemateveryprice.midday,withabundantsolarandcheaperelectricity,Theintersectionofthesecurvesrevealstheactualelectrolysisplantsrun,andstoragecharges.supply,demand,andprice.48CONTENTSDEMANDELECTRICITYRENEWABLESFOSSILFUELSFINANCEPOLICYEMISSIONSREGIONSAPPENDIXDNVEnergyTransitionOutlook2023CHALLENGINGTHECONCEPTOFBASELOADadequatelysuppliedbyvariablerenewablesincombi-nationwithvariousstoragetechnologies,whichisInthefuturepowersystem,thesignificanceofbaseloadwilldiminishasrenewablepower,generallyeithercheaperand/orcleanerthannuclear,especiallyfromwindandsolar,becomesmoreprevalent.coal,andgas.Additionally,thepublicisoftenledtobelievethatthemorevariablerenewablesaddedtoaBaseloadTraditionalpowersourceslikecoal-fired,gas-fired,givengrid,thehighertheintermittencyofsupplyandacharacteristicofsupplytechnologies.NuclearorBaseload(sometimeswrittenasbaseload)andnuclearplantsareassociatedwithbaseloadthustheneedfor‘traditional’baseloadincreases.Thatcoalpowerplantsoperateinbaseloadmodeduetorepresentstheconstantandrelativelystablelevelprovision.Becausebaseloadmustbeprovidedatisalsoafallacy:owingtothelawoflargenumbers,thetechnicallimitations,astheyareincapableofoper-ofgrid-basedelectricityconsumptionandassuchalltimes,theargumentisoftenadvancedthatsuchgreaterthenumberandvarietyofrenewablesourcesatinginamoreflexiblemanner.Additionally,thesetheminimumlevelofelectricalpowerdemandthatpowerstationsare‘essential’.Thisisinfactamyth.addedtoagrid,thelowertheoverallintermittency.plantsrelyonhighutilizationtorecouptheirsignif-occurscontinuouslyoveragivenperiod.Ingeneral,Baseloadisafunctionofelectricityconsumption,icantinvestmentcosts.powerdemandexhibitscyclicvariationsonadailyandisnotdefinedbysupplytechnology.AsweHistorically,baseloadpowerhasbeensuppliedbasis,butgenerallypeaksduringbusinesshoursanddemonstratebelow,baseloadcanbeperfectlyprimarilybylarge-scalefossilpowerplants,butalsoButitissimplyafalseclaimthatrenewableenergygraduallydecreaseslateatnightandduringtheearlynuclearandhydroelectricpowerplants.Baseloadcannotreplacecoal-firedelectricityasabaseloadmorninghours.Throughouta24-hourperiodthereplantsaretypicallylarge-scalefacilitiesandplayapowersource.Ifthisfallacygainswidespreadbelief,itwillbeaminimumlevelofdemand,whichiseffec-criticalroleinmaintainingtheefficiencyofanelectriccouldhinderthedevelopmentofrenewableenergyastivelythebaseload,andthismustbemetregardlessgrid.Theseplantsoperateconsistently,generatingamainstreamenergysupplytechnology,confiningitoffluctuatingconsumerdemandorvaryingweatherpoweratasteadyratewithouttheabilitytoswiftlytoanichemarketinsteadofrealizingitsfullpotential.conditions.accommodatepeakdemandsoremergencysituations.Consequently,theconceptofbaseloadiscloselyInthefuturepowersystem,thesignificanceofbaseBaseloadusuallyrepresents30to40%ofthetiedtothecharacteristicsoffossilpowergenerationloadwilldiminish.Asrenewablepower,especiallymaximumload.Theremainingpowerdemand,sourcesandnuclearandhydroelectricpowerplantsfromvariablesourceslikewindandsolar,becomesknownasabove-base,ismanagedbyintermediateastheyarecharacterizedbytheirabilitytooperatemoreprevalent,supplyanddemandwillbebetterandpeakpowerplantsthatareintegratedintothecontinuouslyforextendedperiodswithlimitedharmonizedinaflexiblemanner—aswehavealreadygrid.Baseloadpowerplantsoffersignificantvariationsintheiroutput.showninourdiscussiononflexibilityabove.advantagesintermsofcostefficiencyandreliableoperationatoptimalpowerlevels.However,theySomearguethatitisnotfeasibletobuildalarge-alsohavecertaindrawbacks,includingslowerscaleelectricitygenerationsystemusingrenewableresponsetimes(exceptofnaturalgasplants),limitedenergysourcesexclusivelybecausetheyareinter-fuelflexibility,andreducedefficiencywhenoperatedmittentandunabletoconsistentlyprovidebaseloadbelowtheirmaximumcapacity.powerfor24hours.Thiscritiqueisdeceptive.Baseloadisacharacteristicofelectricitydemand,not49CONTENTSDEMANDELECTRICITYRENEWABLESFOSSILFUELSFINANCEPOLICYEMISSIONSREGIONSAPPENDIXDNVEnergyTransitionOutlook2023Renewablepowergeneratorscanbeclassifiedintoeffectivelymitigatevariability.InBrazil,theinterplayChangingelectricitymarketdefinition,generationfromVRESwillfluctuate,andtwomaincategories:dispatchableandvariable.betweenhydropowerandwindpoweriscompli-designforhighrenewablestherewillbemorevolatilepricingsetbydemandandDispatchablerenewablepowergeneratorshavementary.Similarly,inGermany,PVandwindpowerpenetrationconsumptionlevels.theabilitytoregulatetheiroutputwithinadefinedgenerationcomplementeachother,thankstotheirrange,similartoconventionalfossil-fuelpowercontrastingseasonalvariations.EstablishedpowersystemsweredesignedaroundAsexplainedabove,pricecollapse/cannibalizationplants.Thesegeneratorsarecapableofprovidingthermalgenerationwithdispatchableproductionwilloccurunlessdemandistailoredto‘excess’supplybaseloadpowerwhennecessary.ExamplesofTheexamplesofDenmark,Germany,andSpainandincreasingvariablecosts,matchingsupply(e.g.makinggreenhydrogenandchargingEVswhendispatchablerenewablepowersourcesincludedemonstratethatincorporatingupto50%VREStovariabledemand.Thisischangingwherehighpowerischeap).Conversely,pricehikeswillhappenreservoirhydropowerplants,biomass(includingintheannualelectricitysupplyposesminimalpenetrationofvariablerenewables,suchaswindunlessbalancedbyflexibilitysourcesoradditionalbiogas)powerplants,geothermalpowerplants,andchallenges,especiallyinpowersystemsthatareandsolarPV,enablegenerationatnear-zerocost,capacitybeingavailable.Thekeypointisthatwhenconcentratedsolarpower(CSP)plantsequippedwellinterconnectedwithneighbouringcountries.leadingtozeromarginalproductioncosts.Bysupplybecomeslesscontrollable,managingdemandwiththermalstorage,suchasmoltensalt.However,highersharesofVRESpresentsignificantwillbecomeincreasinglyimportantforloadstofollowchallenges,necessitatingareevaluationofpowerrisesandfallsingeneration.ConsumptionadjustedbyControllingtheoutputofVRES,suchaswindandsolarsystemoperationandplanning.Evenwiththecurrentthepricelevelwillhelptoevenoutprices.photovoltaic(PV),isconsiderablymorechallenging.moderateaverageVRESshares,thereareinstancesTheseareunabletoconsistentlymeetthedemandforwheninstantaneouspenetrationlevelscanreachhighForcontinuedrenewablesgrowthandelectrificationbaseloadpoweratalltimes.However,thislimitationlevelsduringcertainhours,sometimesexceedingofend-use,regulatoryframeworksmustincentivizedoesnotnecessarilyposeadisadvantage,astheelectricitydemand.Consequently,theneedforchange:objectiveisnotsolelytofulfillbaseloadpowerrequire-dispatchablepowerplantstocoverthepermanentments.BycombiningVRESwithdispatchablerenewableminimumloaddiminishesandeventuallydisappearsUpstream:forcontinuedinvestmentinhighCAPEXpowersourcesandstorageorflexiblefossil-fuelledwithincreasedVRESdeployment.Infuturepowerrenewablegenerationassets;diversetechnicalpower,itispossibletoreliablymeettheoverallpowersystemswithhighersharesofVRES,thedistinctionflexibilityresourcesovermultipletimeframes(e.g.demand,includingbaseload,atalltimes.Itisimportantbetweenbaseloadandotherloadtypesbecomesbatterystorage,real-time,day/week,months);and,toacknowledgethatthevariabilityofindividualwindlessmeaningful,andattributingpowergeneratingavailableconventionalcapacity—despitelowcapacityorsolarplantsisatitshighest.However,whenmultipletechnologiesaccordinglybecomeslessrelevant.factors—forresourceadequacy.plantsofthesametypeareaggregatedacrossacountryorcontinent,theoverallvariabilitydecreases.WhenmultipleplantsofthesametypeareDownstream:forengagementandactivepartici-Additionally,combiningdifferenttypesofVRES,suchasaggregatedacrossacountryorcontinent,pationattheconsumerleveltoprovideoperationalsolarandwind,furtherreducesvariability.theoverallvariabilitydecreases.flexibilityanddemandresponse(e.g.timingofheating/cooling).Severalcountrieshavealreadydemonstratedthatacombinationofrenewableenergysourcescan50CONTENTSDEMANDELECTRICITYRENEWABLESFOSSILFUELSFINANCEPOLICYEMISSIONSREGIONSAPPENDIXDNVEnergyTransitionOutlook2023Future-fitmarketarrangements:ACERpublisheditsassessmentonEUwholesaleelectricity—Introducemeasurestobringmoreclean,flexiblefromcompetitivetendersbackedbygovernments,ThecaseofEuropemarketdesignsuggesting13measuresforpolicymakerstosolutions(e.g.demandresponseandstorage)totheofferingreliablerevenueandlessfinancialrisk.future-proofthemarketdesign.systemtocompetewithgas.EnergybillssurgedinEuropeaswholesaleelectricityPrepareforcrisis:In2022,pricelevelswereunac-pricessoaredfromanaverageEUR35/MWhin2020toprotectandempowerconsumers,andraisenet-zero—Mandateallpublicsupportfornewinvestmentinceptablesocietally.Futuresurprisesareinevitable;aboveEUR500/MWhinMarch2022(Ceviketal.,2022).competitivenessbycreatinglong-termcertaintyandinfra-marginalandmust-runrenewableandnon-fossilso,interventionsandsupportschemesmustbeinrestoringinvestorconfidence.Thekeyproposalsare:electricitygenerationtobethroughtwo-wayplacetoensurecontinuedsupportforthetransition.Themaindriverswerecostliergas-firedgenerationafterContractsforDifference(CfDs),withMemberStatesRussiainvadedUkraine,agassupplyshortfall,lossof—Protectcustomersagainstfossil-fuelvolatility,obligedtochannelexcessrevenuestoconsumers.Howweconsiderfuturemarketdesigningeneratingcapacity,anddrought.UnderthemarginalobligingMemberStatestoensureavailabilityofourforecast?pricing(or‘meritordermodel’)underpinningEurope’smarket-based,long–termPowerPurchaseAgree-TheCommission'sproposalwasprogressingthroughOurmodellingofelectricityisdiscussedinthischapter.wholesaleelectricityprices,themostexpensivetech-ments(PPAs)betweenproducersandconsumers,theEUlegislativeprocedureatthetimeofwritingthisWhiletheLCOEmetricisfavourabletorenewablenologyformeetingdemandinagivenperiodsetsandguaranteesforpaymentobligations.Outlook.generation,investmenthingesonrevenueprospects.thefinalelectricityprice.ThisisdoneaccordingtotheWeassumemechanisms(CfDs,capacity,flexibility)productioncostdeterminedbytheenergysourcesusedWhatisimportant?ensuringcontinuedprofitability.Capacityadditionsingeneration,inthiscasenaturalgas.Preservethepricesignal:Marginalpricingisinthemodeloccurunderthreeheadings:electricityhowpricesemergenaturallyinfreemarkets.Itisdemand,capacitydemand,andflexibilitydemand.Amidrisingconsumerbills,thismodelandelectricityimportantforpricediscoveryandsignallingscarcity.marketreformcameunderscrutiny.“ThismarketPricevolatilitytriggerstomorrow’sflexibility—Electricitydemand:themodellingusestherevenue-systemdoesnotworkanymore.Wehavetoreformit,(technologies)andcontributestoadequatedemandadjustedLCOEasaguidetoidentifythemostwehavetoadaptittothenewrealitiesofdominantresponse.cost-effectivetechnologiestomeetdemand.renewables,”saidEuropeanCommissionPresidentUrsulavonderLeyen(EUParliament,2022).However,Preservemarketintegration:Marketintegrationand—Capacitydemand:understandingthatVRESaretheEUAgencyfortheCooperationofEnergyRegu-cross-borderresourcesharingaremeanstosecurenon-dispatchableandbasedontheresidualpeaklatorsconcludedthatthecurrentelectricitymarketsupplies,butexpandingrenewablegenerationneedsloadrequirement,ourmodelensuresadequatedesignwasnotbehindthecrisisandwashelpingtorapidinfrastructurebuild-out(seeSection3.2).capacitythroughcontinuedinvestmentinconven-alleviateit(ACER,2022).tionalgenerationandstorage.Improvelong-termmarkets:InvestingingenerationTheEUCommission’sMarch2023proposaltooverhauldependsonprojectprofitabilityovertimeand—Flexibilitydemand:themodelcomputestheneedelectricitymarkets(COM/2023/148)ismoreevolutionthusonlong-termpriceexpectations.Long-termforrampup/downbasedonsupplyanddemandthanrevolution.Itaimstoboostrenewablesinvestment,contractscanprovideafixedpricethroughmech-profilesandinvestsinnewcapacityforsufficientanismslikecapacityremuneration,PPAs,andCfDssystemflexibility.51CONTENTSDEMANDELECTRICITYRENEWABLESFOSSILFUELSFINANCEPOLICYEMISSIONSREGIONSAPPENDIXDNVEnergyTransitionOutlook20232.2POWERGRIDSOftenanunder-appreciatedpartofthepowersystem,powerplantsoverlongdistancesathigh-voltagetothegridisthebackboneofamodern,electrified,minimizelosses.DistributiongridsconsistoflowandGlobalgrid,transmission,anddistributioncombinedwilldoubleinlengthfrom100millionwell-functioningsociety.Withincreasingelectrificationmediumvoltagepowerlinesalongwithstep-downcircuit-km(c-km)in2022to205millionc-kmin2050tofacilitatethefastandefficientforecastinalmostallworldregions,astrongerandtransformers,distributingelectricitytodifferenttransferofelectricity.Thesamegridwillgrow2.5timesincapacityglobally,deliveringsmartergridisessentialfordeliveringpower,especiallydemandcentres,suchashousesandfactories.electricitytoschools,factories,andcities.withrisingelectricityandpowerdemandandgreateruseofvariablerenewabletechnologies.Figure2.10presentstheregionalgrowthoftrans-missionanddistributionlinesinmillionc-km.WithinThepowergridsfortransmissionanddistributionthetimeframepresented,allregionsareexpectedtocantogetherbethoughtofasthebiggestmachineinundergogrowthinpowerlines.Thoselagginginelec-anycountry.Transmissioninvolveshigh,extra-high,tricityaccess,suchasSub-SaharanAfricaandSouthandultra-highvoltage(alldenotedforbrevityEastAsia,experiencealarger,three-foldgrowth,whileashighvoltage,HV)powerlines,transformers,OECDPacific,alreadyfullyelectrified,isexpectedtocontrolcentres,etc.Theytransmitelectricityfromseeonly20%morec-kmbetween2022and2050.52CONTENTSDEMANDELECTRICITYRENEWABLESFOSSILFUELSFINANCEPOLICYEMISSIONSREGIONSAPPENDIXDNVEnergyTransitionOutlook2023Surprisingly,evenNorthAmerica,afullyelectrifiedregion,TheupfrontcostsofDCarehigherthanforAC.inthedistributiongrid.ThefirstishigherelectricityisexpectedtoseeadoublingintransmissiongridlengthHowever,DCislesscostlyonthebasisofelectricitydemandwithmoredemandsegments,transitioningduetoelectrificationoftheeconomyandtheenormoustransmittedperdistanceandhaslowervoltagetoelectricity,andnewdemandsegments,suchasamountofrenewablepowerthatwillbeconnectedlosses.Besidesthis,HVDClinesarecriticalforinte-EVsinroadtransport,beingintroduced.Second,tothegrid.Thewindierandsunniergeneratingsitesgratingoffshorewindpowerintothemoderngridinthepeakpowerdemandofaregionalsogrowsdueareoftenfarfrompopulationcentres,requiringlongthefuture.AsshowninFigure2.12,by2050almosttomoreelectrification—thatis,electricitydemandtransmissionlinestodelivertheirpowertodemand20%oftheHVDClineswillbeundersea,connectingoveraunitoftimebecomes‘peakier’orhigher.centres.Alongwithexpansion,weexpecttoseeoffshorewindfarmstothetransmissiongrid.Onthesupply-side,asdistributedVRESgrows,themodernizationandrefurbishmentofplants,especiallydistributiongridwillneedstrengtheningtohandleinregionswithanaginggrid,suchasNorthAmerica.DistributiongridvoltagefluctuationssuchasthediurnalvariationsGlobally,thedistributiongridmorethandoublesofsolarpower.ThismeansthatthedistributiongridTransmissiongridfrom200TW-kmin2022toabout500TW-kminneedstogrowitscapacityandevolvetohandletheThegrowthintransmissiongridcapacity,asmid-centuryduetotherapidelectrificationexpectedhigherpowerdemand.deliveredbyalternating(AC)anddirectcurrent(DC),inalmostallregions.ThiselectrificationhappensisshowninFigure2.11.ontwofrontswhichbothcontributetothegrowthGrid-enhancingtechnologiesAstheshareofVRESinelectricitysupplygrowssignificantly,integrationofrenewablesandgridmodernizationmustworkhand-in-handtoachievegridreliability.Modernizationofthegridwillinvolvegrid-enhancingtechnologies(GET)suchas:—Dynamicpowerlinerating—Powerflowcontrollers—Digitaltwinand/orreal-timemonitoring—Advancedgridfeatures,suchassmartmeters—Measurestoprotectthegridfromcyberattacks,inclementweather,andtoincreaseresilience53CONTENTSDEMANDELECTRICITYRENEWABLESFOSSILFUELSFINANCEPOLICYEMISSIONSREGIONSAPPENDIXDNVEnergyTransitionOutlook20232.3STORAGEANDFLEXIBILITYload.ThishelpsustounderstandhoweachFromabroadersystemperspective,wearetechnologyrespondstothisvariability.Wewitnessingtheriseofsmartgridfeatures.TheVenturingtoward2050,theintertwinedtalesofenergystorageandflexibilitytakecentregaugetheflexibilitycontributionbyobservingintegrationoftoolslikesmartmeters,Internetofstage.Astheworldgrappleswithanevolvingenergymatrix,flexibilityemergesasthethedecreaseinsupplystandarddeviationwithaThings(IoT)sensors,andadvancedautomationlinchpin.FromLi-ionbatteriestoinnovativegridfeatures,theshiftispalpable.Concurrently,particulartechnologycomparedtoitsabsence.techniquespromisesmoreefficientenergyflowthesignificanceofstorageaccelerates,withaspotlightonnotjustdailyneeds,butseasonalmanagement.Anexcitingdevelopmentisthedemands.DiveintothissectiontoexploretheinterplayofthesepivotalcomponentsinourSignificantly,Li-ionbatteriesemergeastheprimaryburgeoning'prosumer'trend.Theevolvingtech-sustainableenergyfuture.sourceofflexibilityworldwide.ThesebatterieswillnologiesandmarketstrategiesareempoweringaneitherbeintegratedwithrenewablesoroperateasincreasingnumberofconsumerstoofferflexibilityFlexibilityVREScapacitysurgesbyafactorofseven,theglobalstandalonesystems.Alongsidethistrend,thermalthroughdemandresponses,vehicle-to-grid(V2G)Theglobalenergylandscapeisundergoingamajorneedforflexibilitywillalmostdouble.InFigure2.13,generationtechnologieswillbeaffected.Existingsystems,andbehind-the-meterstorage.shiftaswemovetowards2050,andthekeytoweexaminetheprojectedincreaseintheratioofthermalplantswillincreasinglyoperatewithrenew-managingthistransitionsuccessfullyisflexibility.Asdailyhour-to-hourstandarddeviationstoaverageables,amplifyingtheimportanceoftheirflexibility.EVsdeservespecialattentioninthisflexibilityHowever,itisessentialtonotethatnotallthermalnarrative.Morethanjusttransportationmediums,sourceshavethesameeaseinrampingtheiroutputEVsareevolvingintocrucialgridcomponents.upordown.Besidestheirtechnicaladaptability,theThistransformationisfuelledbyfinancialstimulieconomicviabilityofthesethermalplants,especiallyfromnetmeteringschemesandincentivesforV2G-whenVRESprovidespoweratlowercosts,becomescapablechargingapparatus.Withtheseincentives,paramount.EVownerscouldpotentiallyofferstoredenergytothegridduringhighdemand,openingarevenueThetransitiontogreaterflexibilityisn'tjustaboutchannelthatcanreduceEVownershipexpensesandequipment.Itdemandstangiblemodificationslikebolstertheembraceofcleanenergy.retrofittingspecificpartsandsignificantinvestmentinautomationandanalytics.ImprovingtheaccuracyLastly,anotheravenueofflexibilityemergesfromofrenewablepowergenerationpredictionsandconvertingVRESintootherenergyformslikerefiningdemandresponseswillbeinstrumentalinhydrogen.Strengtheningthephysicaltransmissionhandlingsurplusesinrenewablesandinreallocatingsystemsandrefiningtheconnectionbetweenpowerelectricityusagefromhigh-demandperiodstothosegenerationandconsumptionhubswillfurtherwithlesserdemand.Moreover,thereisapressingoptimizetherenewablepowersupply'sutility.needforinnovativemarketstructures.Theseshouldpromotetheadaptivefunctioningofthermalplants54andintroducefreshcontractmodels,alterationsingridcodes,andnewbenchmarks,ascitedbytheInternationalRenewableEnergyAgency(IRENA,2019).CONTENTSDEMANDELECTRICITYRENEWABLESFOSSILFUELSFINANCEPOLICYEMISSIONSREGIONSAPPENDIXDNVEnergyTransitionOutlook2023StorageAshiftisunderwayinmajorbatterystoragemarketsoffercostadvantagesovertheirLi-ioncounterparts.55Aswejourneytowards2050,thecrucialroleoflikeChina,SouthKorea,Japan,andtheUS.AsstorageEmerging'very-longduration'technologiessuggestenergystorageinthetransformingpowerlandscapecapacitysurpasses0.5%ofgridcapacity,thefocusisevenmoresignificantcostefficiencies.Whiletheirbecomesincreasinglyevident.Currently,pumpedtransitioningfromfrequency-responsemanagementcommercialviabilityremainsunderevaluationandhydroistheprimarymethod,asillustratedinFiguretobroaderapplicationssuchaspricearbitrageortheyarenotfeaturedinthe2023Outlook,their2.14,yet,itsgrowthpotentialislimitedduetocapacityprovision.Thisshifttranslatesintolongerdevelopmentcouldreshapethebatterylandscape.geographicalconstraints,meaningweneedtoturnaveragestoragedurations,thatrangefromtwotofourourgazetootheremergingtechnologiestomeetthehours.Therealdrivefortheselong-durationsolutionswillburgeoningstoragedemandsofthecomingdecades.comefromrevenuemodelsvaluinglongerstorageAlongsidetheriseofLi-ion,themarketisshowingdurationsandthebroaderadoptionofVRES.Astech-Li-ionbatteriesarepoisedtofillthisgap.Weantici-anappetiteforalternative,long-durationstoragenologyprogressesandpoliciesadapt,thedemandforpateasurgeintheircapacityto1.6TWhby2030,technologies.Thesespan5–24hoursandincludeflowtheseextendedbatteriesisprimedtorise.Ultimately,furtherexpandingtoarobust22TWhby2050.batteries,zinc-basedchemistries,andgravity-basedourlong-termstoragemarketpredictionshingeonIntriguingly,asignificantportionofthiscapacityisstoragemethods.Ourprojectionsindicateamain-potentialcostinnovationsandpolicyencouragements,beingintegratedwithrenewablegeneration.streammarketentryforthesesolutionsaroundtheespeciallyconcerningfledglingbatterytechnologies.latterhalfofthe2030s,withalong-durationcapacitytargetof1.4TWhby2050.DespitethedominanceofLi-ion,whichcurrentlyforms95%ofthestorageprojectsthatweareinvolved,theindustryisonthebrinkofinnovation.Supply-chainchallenges,exacerbatedpost-pandemic,havenudgedLi-ionbatterypricesupward.Never-theless,weareoptimisticaboutthecosttrajectory.By2030,costsforutility-scaleLi-ionbatterysystemsareprojectedtodipbelowUSD200/kWh,furtherreducingtoapproximatelyUSD130/kWhby2050,asillustratedinFigure2.15.Li-ionisnotthesolecontenderinthestoragerace.Inourforecast,wehavehistoricallymodelledthepotentialoflong-durationenergystorage(LDES),particularlyvanadiumflowbatteries.Theseappearpromisingfor8-to24-hourapplicationsandcouldCONTENTSDEMANDELECTRICITYRENEWABLESFOSSILFUELSFINANCEPOLICYEMISSIONSREGIONSAPPENDIXDNVEnergyTransitionOutlook2023A10MWlithium-ionbatterySeasonalstorageanteeconsistentsupply.Thisisvital,notonlyforguishingbetweenadequacy,capacity,andseasonalSeasonalstorageispivotalinbridgingthegapselectricityreconversionbutalsoforotherapplicationsstorage,giventheannualfluctuationsindemandandstoragesystem,combinedwiththebetweenelectricitysupplyanddemandthroughoutsuchasheatingandtransport.Asgas-dependentVRESgeneration.AkeytakeawayisthatseasonalgasturbineatSCENorwalkPeakertheyear.Essentially,itshiftstheabundanceofelec-spaceheatingdeclines,especiallyinthehigh-latitudestorage'sefficacyhingesontheconcertedinvestmenttricitygeneratedduringspecificmonthstotimeszonesofEuropeandNorthAmerica,theglobaleffortsbyallstakeholdersinthechain,frompower-Plant,CA,theUS.Imagecourtesywhenelectricityconsumptionspikes.Asweproceeddependencyonseasonalnaturalgasstoragewillto-gastophysicalstorageandpowergeneration.ofYscusccreativecommonsintothefuture,seasonalvariationsinelectricityreachitszenithwithinthenextfiveyears.Contrarily,supplyanddemandwillaccentuate,necessitatingacome2050,weanticipatethedevelopmentofaround56morepronouncedroleforseasonalstorage.70billionm³ofhydrogenstorage,withrepurposedmethanestoragesitesaccountingforabout40%ofit.Fromthedemandviewpoint,electrificationofspaceheating,especiallyinregionswithcolderwinters,Our2020positionpaper,ThePromiseofSeasonalwillmakeelectricitydemandmorecyclical.OntheStorage(DNV,2020a),delveddeepintoseasonalsupplyfront,VRES,notablysolar,willintroduceastorage'ssignificance.ThroughthelensoftheNether-starkcontrastinelectricityoutputbetweensummerlands,thestudyunderscoredthechallengeofdistin-andwinter,especiallyinhigherlatitudecountries.Identifyingtherighttechnologyforseasonalstoragedependsonthreemainfactors:storagelosses,cost-effectiveness,androundtripefficiency.Whenitcomestoofferingefficient,affordable,andlarge-scalestorage,chemicalenergy—specificallyenergystoredinmolecules—emergesasthefront-runner.Amongthemyriadofchemicalstoragepossibilities,compressedhydrogenstorageinsaltcavernsorformerhydrocarbonfieldsappearstobeaparticularlypromising,cost-effectivemethod.Ourpredictions,presentedinFigure2.16,layouttheprojectedglobalundergroundgasstoragecapacityinsaltcavernsandformeroilandgasreservoirs.Thisisrootedinameticulousexaminationofnaturalgasandhydrogen'sweeklyconsumptionandproductionpatterns,alongwiththestorageimperativetoguar-CONTENTSDEMANDELECTRICITYRENEWABLESFOSSILFUELSFINANCEPOLICYEMISSIONSREGIONSAPPENDIXDNVEnergyTransitionOutlook20232.4HYDROGENRenewableandlow-carbonhydrogenplaysacriticalmanufacturing(58%),followedbytransport(20%),roleinreducingemissionsfromhard-to-electrifyandbuildings(14%),withtheremainingportionHydrogeniscriticalfordecarbonizingandmovinghard-to-electrifysectorstowardsnet-zerosectorsandachievingtheobjectivesoutlinedinallocatedtoelectricitygenerationandvariousotheremissions.WeforecastthathydrogenuptakewillfallwellshortofthetotalrequiredtomeettheParisAgreement.InordertomeettheParispurposes.theParisAgreement,butnonethelesswillspurindustrytransformingchanges.Agreementtargets,hydrogenmustaccountforapproximately15%oftheworld'senergydemandHydrogen'sfuturedemandasanenergyby2050.Ourprojectionsindicatethattheglobalcarrierwillgrowfromitscurrentnegligibleadoptionofhydrogenanditsderivativeslagginglevelstosurpass238MtH2behindtherequirementsoftheParisAgreement,withhydrogenmakingupjust0.5%oftheglobal57finalenergymixin2030and5%in2050.However,insomepartsoftheworldtheshareofhydrogenintheenergymixwillbetwiceashighasthesepercentages.Althoughhydrogen'scontributiontoglobalenergydemandisprojectedtoreachonly5%,thedevelop-mentsinhydrogentechnologyandinfrastructureoverthenextthreedecadeswillbesignificant—essentially,thisisanentirelynewenergysourceforonethirtieth(andclimbing)oftheworld’senergydemand.Thesedevelopmentshavethepotentialtotransformvariousindustries.Theestimatedglobalexpenditureonhydrogenproductionforenergypurposesfromnowuntil2050isexpectedtoreachUSD6.8trn,withanadditionalUSD180bnallocatedforhydrogenpipelinesandUSD530bnfortheconstructionandoperationofammoniaterminals.Hydrogen'sfuturedemandasanenergycarrierwillgrowfromitscurrentnegligiblelevelstosurpass238MtH2annuallybytheyear2050—inotherwords,asharpupwardincline,asillustratedinFigure2.17.ThepredominantapplicationofhydrogenwillbeinCONTENTSDEMANDELECTRICITYRENEWABLESFOSSILFUELSFINANCEPOLICYEMISSIONSREGIONSAPPENDIXDNVEnergyTransitionOutlook2023MSGreenAmmoniaconceptvessel.Image,courtesyGriegEdgeTransportregionstoglobalbunkeringhubs.Initially,ammonia'sWereferthereadertoDNV’sTransportinTransitionuptakeinshippingisexpectedtobeslowerthan58report(DNV,2023a)foradeepdiveintochangesine-methanol,butitislikelytoscalemorerapidlytransport.towardtheendoftheforecastperiod.OurhydrogenforecastpredictsammoniausageinshippingtobeMaritime170PJ(1%oftheshippingfuelmix)in2030,1,900PJHydrogenwillbecriticalintheeffortstodecarbonize(13%)in2040,and5,000PJ(36%)in2050.internationalshipping.Electrificationwillbefeasibleforonshorepowerwhenshipsareberthed,andforAviationshort-distanceseatravelsuchasclose-to-shoreferryHydrogen,eitherinitspureformorasderivede-fuels,operations.Hydrogen-basedfuels,suchasammoniaisprojectedtogaintractioninaviationduringtheande-fuels,areanticipatedtoprovidethemajority2030s,primarilyduetoconsiderationsofcostandofzero-emissionfuelsfortheshippingindustrybyavailability.However,widespreadadoptionofe-fuelsmid-century.hingesonasubstantialincreaseinrenewablepowerproduction,asthecurrentcostdisparity,approximatelyOurforecastindicatesthattheadoptionofe-fuelsfourtofivetimeshigherthanfossilkerosene,needs(mainlye-methanol)inshippingwillreach480peta-tobenarrowed.Intheaviationsubsector,e-fuelsjoules(PJ)or3%oftheshippingfuelmixin2030,areexpectedtooutpacepurehydrogenbyaratioincreasingto1,800PJ(12%)in2040and2,600PJofthreetoone,accountingfora12%share.Thisis(19%)in2050.mainlybecausee-fuels,asdrop-inreplacements,canbeusedacrossalltypesofflights.Conversely,pureSimilartoe-fuelssuchase-methanol,ammoniacanhydrogenislimitedprimarilytomedium-haulflightsutilizelargepartsoftheexistinginfrastructure,albeitduetoitslowerenergydensity,anditsextensivewithhigherproductioncostscomparedtocurrentstoragerequirementswouldnecessitateaircraftalternatives.Whenproducedusingrenewabledesignswithhigherper-passengercosts.Together,energy,theconversionlossesaresignificant,purehydrogenandhydrogen-basede-fuelsarenecessitatingasubstantialincreaseinrenewableprojectedtoconstituteroughly16%ofaviationpowergeneration.However,capturingCO2duringenergyusageby2050.ammoniaproductionfromnaturalgasisrelativelystraightforward,making‘blueammonia’thepredom-Hydrogenwillbecriticalinthequesttoinantchoiceforshippinginourforecast.Althoughdecarbonizeinternationalshipping.ammoniahassometoxicityconcernsforships,weanticipatetheseissueswillberesolved,leadingtolarge-scaletransportfromcost-effectiveproductionCONTENTSDEMANDELECTRICITYRENEWABLESFOSSILFUELSFINANCEPOLICYEMISSIONSREGIONSAPPENDIXDNVEnergyTransitionOutlook2023RoadtransportHowever,thecurrentlandscapesuggeststhatby2050,particularlyinregionsleadingthetransition,BuildingsWhenitcomestoroadtransport,propulsionviafuel-cellbattery-electricsolutionswillalsogainsubstantialsuchasGreaterChinaandEurope.AccordingtoourInouranalysis,weprojecthydrogenuptakeinelectricvehicles(FCEVs)isnotablylessefficient,moregroundinthissegment.Consequently,weforeseeforecast,thedemandforhydrogenasanenergybuildingstoreachapproximately2EJ/yr(aboutintricate,andconsequentlymoreexpensivecomparedhydrogenplayingarelativelyminorroleinroadcarrierinmanufacturingwillexperiencegradual15MtH2/yr)bytheyear2050.Thisconstitutesonlytobattery-electricvehicles(BEVs).Duetothesetransport,primarilyinheavy-dutylong-distancegrowth,reachingnearly9EJ/yr,whichisapproxi-amodest1.3%ofthetotalenergydemandinthefactors,vehiclemanufacturersaresolelyconcentratingtrucking.Bythemiddleofthecentury,hydrogenismately75MtH2/yrby2050.Thisaccountsforbuildingssector.ThepredominantportionsofthisondevelopingBEVmodelsforpassengervehiclesforestimatedtoaccountforapproximately3%oftheapproximately6%ofthetotalenergydemandindemandwillbespaceheating(60%)andwaterzero-emissiontransportation.Thisemphasisonthemenergydemandinroadtransport,slightlylessthanmanufacturingandabout31%oftheglobaldemandheating(30%).ThisshareofhydrogenremainsisanticipatedtoresultinBEVscapturinganimpressivebiomassandnaturalgas.Itisworthnotingthatthisforhydrogenasanenergycarrier.Notably,theironquitesmallwhencontrastedwithnaturalgas,which95%shareofnewpassengervehiclesalesgloballyusageconsidersthathydrogenwillbeemployedinandsteelindustrywillrepresentthelargestportionisexpectedtofulfilaboutafourthoftheenergyby2050,whereasFCEVsareexpectedtorepresentaheavy-dutyandlong-distancetrucking,wherefuelofhydrogendemandinmanufacturing,amountingdemandinbuildingsby2050.mere0.2%ofnewvehiclesales.consumptionnaturallytendstobehigher.Thistrans-to3EJ/yror37%ofthetotal.Thisisinadditiontothelatestoapproximately2,000PJin2050,equivalentnon-energyuseofhydrogeninthedirectreductionThelimitedexpecteduptakeofhydrogenintheForalongtime,hydrogenwasperceivedastheto16.7milliontonnesofhydrogen(MtH2)peryear.ofiron,whichwillbeapproximately0.7EJ/yr,buildingssectorcanbeattributedtovariousfactorsprimarysolutionfordecarbonizingheavytrucking.Notably,about20%ofthisdemandwillbeconcen-equivalenttoaround5.8MtH2/yr.includingcomparativeefficiency,costconsiderations,tratedinGreaterChina,primarilyduetoitslargesafetyconsiderations,andtheavailabilityofinfra-vehiclefleetandpolicy-drivenfocusondecarbon-structurewhencomparedagainstcompetingizingtransportation.EuropeandNorthAmericaaretechnologies,primarilyelectricheatpumpsandprojectedtoaccountfor25%ofthisshareeach,withdistrictheatingsystems.theOECDPacificregioncontributinganother20%.TheutilizationofhydrogeninbuildingsisanticipatedManufacturingtobeconcentratedinfourregionscharacterizedbyHydrogenhasthepotentialtosubstitutefossilfuelsthepresenceofexistingnaturalgasinfrastructureforgeneratinghigh-temperatureheatinindustrialandrelativelymoreaccessiblehydrogensources,processes.However,thecurrentutilizationofhydrogennamelyNorthAmerica,Europe,GreaterChina,andinthesehigh-heatapplicationsisminimal.ThisistheOECDPacificregions.primarilyduetohydrogen'scostlinessasanalternativefuel,makingitlesscompetitivewhencomparedPowerandseasonalstoragetotraditionalfossil-fueltechnologies.Additionally,Inregionscharacterizedbysignificantpenetrationhydrogenfacestoughcompetitionfrombioenergy,ofVRES,hydrogenservesasaviableoptionforparticularlyinscenarioswithhighercarbonprices.balancingpeakdemandandstoringexcesselectricityforextendedperiods.However,itisimportanttoNonetheless,low-carbonhydrogenisanticipatedtoacknowledgethatthisapproachentailsnotableplayasignificantroleinthemanufacturingsectorenergylossesandsubstantialstoragerequirements.59CONTENTSDEMANDELECTRICITYRENEWABLESFOSSILFUELSFINANCEPOLICYEMISSIONSREGIONSAPPENDIXDNVEnergyTransitionOutlook2023Whenassessingthehierarchyofhydrogenapplications,hydrogen,suchasmethanereformingandcoalgasi-BluehydrogenCCStechnologyisstillevolving,andconcernsabouttheutilizationofhydrogenforre-electrificationislikelyfication,isexpectedtodiminish.ThesemethodswillCostandbuild-upspeedaretheprimaryfactorslong-termstorage,costuncertainties,andlimitedtobethelastinline.Nonetheless,startingfrom2030,beprogressivelyreplacedbymoreenvironmentallydeterminingproductionroutesharesinthesupplyeconomiesofscalehinderitsrapiddeployment.weanticipatethegradualincorporationofhydrogenfriendlyalternatives,includingmethanereformingmix.Currently,themostcost-effectivelow-carbonAdditionally,achievingCO2captureratesbeyond90%intopowergenerationfacilities,albeitinlimitedcoupledwithcarboncaptureandstorage(CCS),hydrogenproductionmethodismethanereformingremainseconomicallyunviable,makingbluehydrogenquantities.Initially,thiswillprimarilyinvolveinjectinggrid-connectedelectrolysis,andelectrolysisinte-withCCS,oftencalledbluehydrogen,averagingjustlesscompetitivecomparedtootherlow-carbonhydrogenintonaturalgasgrids.Subsequently,thesharegratedwithdedicatedrenewableenergysources.underUSD3/kgH2.Thisaverageprimarilyreflectsrenewablealternativesinthemediumtolongterm.ofhydrogeninpowergenerationwillexpand,driveninregionslikeNorthAmericaandNorthEastEurasiawithpartbytheneedforpeakdemandmanagement.HydrogensupplyaccesstocheapernaturalgasanddoesnotconsiderBy2050,anoverwhelming85%oftheThecompositionofthefuturehydrogensupplywillbethegaspriceincreasessince2020,whichraisedblueworld'shydrogensupplywilloriginatefromTheleadingregionsinthistransformativejourneyareinfluencedbytwointerrelatedtrends.Firstly,therewillhydrogencostsby20–30%ingas-producingregionslow-carbonpathways.forecastedtobeOECDPacific,followedbyEuropebeanincreasingutilizationofhydrogenasanenergyand60–400%ingas-importingregions.andGreaterChina.Theseregionswillincreasinglycarrier,andsecondly,therewillbeagradualphasing60harnesshydrogenforelectricitygeneration,withoutofexistingproductioncapacityinfavourofmoreWhilegaspricesareexpectedtodecreasebytheNorthAmericaalsojoininginfromthemid-2040s.Byenvironmentallyfriendlyalternatives.Giventhatthe2030s,bluehydrogenfacesadditionalchallenges.themiddleofthecentury,weenvisiontheseregionsprimaryimpetusforintegratinghydrogenintoenergycollectivelyconsumingnearly10Mthydrogenpersystemsistoreducecarbonemissionsinsectorsyearforpowergenerationpurposes.whereelectrificationisnotfeasible,thecontendersforthefutureofhydrogenproductionwillpredominantlyHydrogenasfeedstockbelow-carbonmethods.Atpresent,hydrogenservesasacrucialfeedstockintwokeysectors:oilrefineriesandtheproductionBy2030,ourforecastindicatesthatone-thirdofofammoniaforfertilizers.Ourforecastindicatesthattheglobalhydrogensupplywillbederivedfromwhiletheabsolutedemandforhydrogenintheselow-carbonandrenewablesources.Withinthismix,segmentsmayexperienceaslightdecline,therewillmethanereformingwithCCSwillconstitute14%ofbeagrowingrequirementforhydrogenderivativestheglobaltotal,whilehydrogengeneratedthroughtailoredforenergy-relatedpurposes.Infact,bytheelectrolysiswillcontribute13%.By2050,anover-year2050,thedemandforhydrogentoproducewhelming85%oftheworld'shydrogensupplywille-fuelsandammoniaasafuelsourcewillsurpasstheoriginatefromlow-carbonpathways.Thisbreakdowncombineddemandforhydrogeninoilrefineriesandisasfollows:28%willcomefrommethanereformingfertilizerproduction.withCCS,15%fromgrid-connectedelectrolysis,28%fromdedicatedsolar-basedelectrolysis,7%fromAsweadvancetowards2050,thedominantpositiondedicatedwind-basedelectrolysis,and2%fromofCO2-intensiveproductionmethodsforfeedstockdedicatednuclear-basedelectrolysis.CONTENTSDEMANDELECTRICITYRENEWABLESFOSSILFUELSFINANCEPOLICYEMISSIONSREGIONSAPPENDIXDNVEnergyTransitionOutlook2023Nevertheless,ascapitalexpendituresformethanenotbesufficienttosignificantlyimpactelectricityPurehydrogentransportbetweenregionswillplayaanalysis,weassumethatallseabornehydrogenreformingandcarboncapturedecrease,hydrogenpricedistribution.Therefore,anycostreductioninrelativelyminorrole.Pipelinetransportationismosttransportwillinvolveliquidammonia.Weanticipateinvestmentsbecomelessrisky,andcarbonpricesgrid-connectedelectrolysersinthenextfewyearscost-effectiveforlargevolumesandmediumdistances.a20-foldincreaseinammoniaseabornetransportrise,bluehydrogenislikelytogainasignificantwillprimarilyresultfromgovernmentsupportandForshorterdistancesandsmallervolumes,methodslikebetween2030and2050,withitsusagegrowingmarketshare,particularlyinammoniaandmethanoldecliningcapitalexpenditures.truckingandrail,typicallyusingammoniaasthecarrier,fromalmostnothinginthemid-2030stoconstitutingproduction.Thecostofcarboncaptureforammoniabecomemorepractical.Seabornetransportisaviable95%ofthetradein2050,totalling150milliontonnesproductionislowerthanformerchanthydrogen.Lookingtowards2050,twomaintrendswillaffectalternativeforlongerdistances,butitrequiresenergy-ofshipmentsatthattime.In2050,97MtH2/yrareproducedgloballyfromannualoperatinghours:increasedcompetitionfromintensiveandcostlyliquefactionattheexportsiteandmethanereformingwithCCS,constituting28%ofthealternativehydrogenproductionmethodsandmoreexpensiveregasificationatimportlocations,addingBy2030,costsofrenewables-basedglobalhydrogensupply.hourswithcheapelectricityduetohigherVRESUSD1.5–2/kgH2tocosts.By2050,lessthan2%ofglobalelectrolysisareexpectedtodroptoaroundintegration.AsVRESbecomesmoreprevalentinthehydrogenwillhavebeentransportedviaships,andonlyUSD2/kgH2.Greenhydrogenenergysystem,thenumberofhourswhenhydrogenabout4%throughinterregionalpipelines.Dedicatedrenewables-basedelectrolysisiscurrentlyfromelectricityandelectrolysisischeaperthanblue61tooexpensive,averagingUSD5/kgH2globally.hydrogenwillincrease.Consequently,grid-connectedInourforecast,ammoniaemergesasthepreferredHowever,by2030,costsareexpectedtodropgreenhydrogenisexpectedtoclaimasimilarmarketzero-emissionfuelforinternationalshipping.Inthissignificantly,withdedicatedsolarorwindelec-shareasbluehydrogen.Closeto130MtH2/yrwillbetrolysisaveragingaroundUSD2/kgH2.Keydriversproducedbymid-centuryfromdedicatedrenew-ofthiscostreductionincludea40%decreaseinables,morethanathirdoftheworld’stotalhydrogensolarpanelcostsanda27%decreaseinturbinedemandbythen.costs.Furthermore,improvementsinturbinesizesandsolarpaneltechnologieswillleadtoincreasedHydrogentransportannualoperatinghoursby10–30%,varyingbytech-Hydrogenwillprimarilybetransportedviapipelinesnologyandregion.Additionally,thecapitalcostofformediumdistanceswithinandbetweencountries,electrolysersisanticipatedtodecreaseby25–30%butitisunlikelytobetransportedbetweenconti-duetoreducedperceivedfinancialrisk.nents.Ammonia,beingsaferandmoreconvenientfortransport—especiallybyship—isexpectedtoForgrid-connectedelectrolysers,theprimarycostaccountfor59%ofenergy-relatedammoniatradecomponentiselectricity,particularlytheavaila-betweenregionsby2050.Tomaximizecost-effi-bilityofaffordableelectricity.Inthelongterm,theciency,over50%ofhydrogenpipelinesworldwideproportionofVRESinpowersystemswillbethewillberepurposedfromexistingnaturalgaspipe-mainfactorinfluencingfutureelectricityprices,lines,potentiallyrisingtoasmuchas80%inspecificwithmoreVRESleadingtomorehoursofveryregions,asthecostofrepurposingpipelinesischeaporevenfreeelectricity.However,beforeprojectedtobeonly10–35%ofthecostofbuilding2030,thepenetrationofVRESinpowersystemswillnewones.CONTENTSDEMANDELECTRICITYRENEWABLESFOSSILFUELSFINANCEPOLICYEMISSIONSREGIONSAPPENDIXDNVEnergyTransitionOutlook20232.5DIRECTHEATEastEurasia,Europe,andGreaterChina.Inthesesuggestanimpendingplateauindirectheatbioenergyandnaturalgaswillascend,andareregions,thereisapronouncedinclinationtowardsdemand.By2030,itisanticipatedthatthedemandestimatedtoprovide37%and58%ofdirectheat,Directheatisatermthatencompassesthethermaldirectheat.Historically,theseregionshaveleanedfordirectheatenergywillseeamodestrisefromrespectively.energyprocuredfrompowerstationsandcertainintocentralplanning,whichhasfacilitatedtheinte-approximately15EJ/yrin2022tojustbelow17EJ/yr.Theevolutionofdirectheatwillbeinfluencedbyindustrialprocesses,andisconventionallydeliveredgrationandexpansionofdistrictheatingsystems.Thislevelisexpectedtostabilizeuptomid-century.shiftingtechnologicallandscapes,marketdynamics,intheformofhotwaterorsteam.ThisspecificthermalNorthEastEurasiaandGreaterChinadominatetheandemergingenergyalternatives.Whileregionsenergy,dependingonitssourceandapplication,isgloballandscapeofdirectheatconsumption,trailedThesourcesfuellingthisdemandarealsopoisedlikeNorthEastEurasia,Europe,andGreaterChinaeitherretailedtoexternalentitiessuchasdistrictheatingbyEurope,wherecountrieslikeGermanystandout.fortransformation.Coal,currentlyadominanthavelaiddownacertainblueprint,eachlocalewillsystems,localcommunities,orutilizedmoredirectlyplayer,willlikelycedegroundtobioenergyinevitablycraftitsownpath,weighingitsuniqueforindustries'intrinsicoperationalrequirements.Theindustrialembraceofdirectheat,especiallywhen(Figure2.24).By2030,bioenergy—predominantlyneedsandresources.Itisimperativethatwesourcedfromadjacentpowerplantsorthroughpipe-leveragingmunicipalandindustrialwasteasfuelcontinuetoscrutinizethesetrends,astheywillnotGlobally,around8%ofhouseholdsrelyondirectheatlines,marksanoteworthyshiftinenergyconsumption—alongwithnaturalgas-firedtechnologies,willonlydictateourenergynarrativesbutalsoshapefortheirspaceheatingneeds.However,thisglobalpatterns.Industries,andnotablythosewithhighdrivedowncoal'sshareindirectheatdemandtothebroadercontoursofsustainableurbanandaverageissomewhatskewedbythesignificantsharesthermaldemandslikemetalsmeltingorchemicalaround37%.Fast-forwardto2050,andcoal'scontri-industrialdevelopmentinthedecadestocome.incertainregions:42%inNorthEastEurasia,20%inprocessing,finddirectheatanoptimalsolution.butionisprojectedtoplummettoamere5%,whileGreaterChina,and14%inEurope.WhenevaluatingItpresentsanopportunitytooptimizeenergy62theoverallheatdemand,spaceandwaterheatinginconsumptionpatterns,diminishoperationalexpenses,residential,commercial,andpublicbuildingsconsumeandinaworldincreasinglyattunedtoenvironmentalapproximately42%oftheworld'sdirectheat.Theramifications,lowertheircarbonfootprints.Usingindustrialsectorisslightlyahead,accountingfor43%.directheat,theseindustriescantapintowasteheatfromneighbouringpowerfacilities,drivingbothDistrictheatinghasseenvariancesinadoptionratesefficiencyandsustainability.acrossregionsandthroughtime.Historically,itsuptakehasnotbeendrivenpurelybyitsenvironmentalIn2022,theglobaldirectheatsupplywaspredomi-benefits.Whileitisundeniablethatthesecommunalnantlypoweredbycoalandgas,accountingfor48%systemscanpresenteconomiesofscaleandthereforeand42%respectively(Figure2.24).Intriguingly,oversomecost-efficiencyforconsumers,otherfactorstwo-thirdswassourcedfromcombinedheatandhavebeeninstrumentalinitsrise.Forexample,centralpower(CHP)plants.planninghasplayedapivotalrole,particularlyinareaswithhighurbanconcentrations.Theever-evolvingenergylandscape,technologicalinnovations,andglobalshiftstowardssustainabilityThreeregionsdistinctlyexemplifythistrendduetotheirurbanstructureandgovernancemodels:NorthCONTENTSDEMANDELECTRICITYRENEWABLESFOSSILFUELSFINANCEPOLICYEMISSIONSREGIONSAPPENDIXDNVEnergyTransitionOutlook2023Highlightsthecomingdecadethatweexploreinour‘Gridlock’3RENEWABLEANDNUCLEARENERGYWeexploredevelopmentsinnon-fossilsourceswhichareexpectedtogrowfrom20%oftheenergyanalysis.mixtodayto52%by2050.SolarPVandwindaresettogrowspectacularly,withgridcapacity-additionsAlthoughnuclearwillcontinuetograpplewithcost,growing13-foldandseven-foldrespectivelybysafety,andnon-proliferationschallenges,itwillbemid-century,spurredbysignificantcostreductions.favouredforenergysecurityreasonsandwillgrowinimportance.Thisincludesacontributionfromsmall3Renewableandnuclearenergy�64Bothsolarandwindoff-gridinstallationswillriseinmodularreactors(SMRs),whichwillstarttocommer-3.1Solar�64importanceandscaletoprovideenergyaccessincializefromthe2030sonwards.3.2Wind�69remotelocationsandasdedicatedpowersources3.3Hydropower�75forhydrogenelectrolysis.However,theirmainBiofuelsarecriticalfordecarbonizinghard-to-3.4Nuclearpower�76contributionisviathegridandthisiswheretheyelectrifysectors,butrisinguptakewillbeattenuated3.5Bioenergy�78faceapermittingandsupply-chainbottleneckinbyfood-competitionandsustainabilityconcerns.3.6Otherenergy�8163CONTENTSDEMANDELECTRICITYRENEWABLESFOSSILFUELSFINANCEPOLICYEMISSIONSREGIONSAPPENDIXDNVEnergyTransitionOutlook20233RENEWABLEANDNUCLEARENERGY3.1SOLAR2050,wewillwitnesssolarPVcapacitiesof8.8TWandanadditional6.5TWforsolar+storage,bringingInthisyear’sforecast,wefindthatnon-fossilenergywillbe52%oftheprimaryenergymixThegrowthofsolarPVhasbeennothingshortofthetotalto15.3TW,a13-foldgrowthfrom2022.by2050—aslightuptickonour2022forecast.Thischapterunpacksdevelopmentsinandastonishing.In2004,solarinstallationswereataforecastsforthekeynon-fossilsources:solarPV,wind,hydropower,bioenergy,andnuclear.modest1GWperyear.By2019,thatnumberhadBythemid-century,solar’sfootprintwillaccountforskyrocketedto100GW.Despitesetbacksin2021—54%ofinstalledgenerationcapacity.However,itwillcausedbytheCOVID-19pandemicandtensionsinaccountforonly39%ofglobalon-gridelectricityNorthEastEurasia—150GWwereadded.By2022,generation.Why?Theefficiencyorthecapacitysolarinstallationsapproachedastaggering250GW.factorsofsolarpowerstationstrailbehindotherUnsurprisingly,thefuturetrajectoryissharplyupward.renewableenergysourceslikewindandhydropower.By2040,weseeglobalinstallationsrisingfurthertoNevertheless,theunderlyingcauseofsolar’srapidabout500GWannually(Figure3.1).Itisworthnotingproliferationliesinitsdwindlingcosts.Bytheearlythatwithinadecade,10%ofallnewPVwillintegrate2020s,solarPVemergedasthemostcost-effectivededicatedstorage,andby2050,thatnumberwillformofelectricityinnumerousregions,butitisascendto62%.Ifwelookatthebiggerpicture,byessentialtounderstandthatitscostreductionratewilldecelerateovertime.TheeconomicsofsolarPVundergoashiftwithincreasingpenetrationintheenergymix.Initsearlystages,solarPVprimarilycurtailstheneedforconven-tionalenergyduringdaylight.Butwithhighermarketpenetration,solar(alongsidewind)canoftenmeetorevensurpassthepowerdemand,pushingelectricitypricestonear-zeroorevennegativevalues.Thisparadigmshiftunderscoresthecrucialroleofstoragesystems,especiallyco-locatedsolar+storagesystems,insupportingsolargrowthduringsunlesshours.DecodingthecostsSolar'scostcompetitivenessisrootedinitsdeclininglevelizedcostofenergy(LCOE).Asofnow,theglobalaverageLCOEforsolarPVhoversaround64CONTENTSDEMANDELECTRICITYRENEWABLESFOSSILFUELSFINANCEPOLICYEMISSIONSREGIONSAPPENDIXDNVEnergyTransitionOutlook2023USD41/MWhandUSD69/MWhforsolarpairedwith26%.However,thiswillslow,settlingataround17%tostoreexcessenergyduringpeaksunlighthoursabouthigherrevenues;itisalsoaboutcostsavings.storage.Delvingdeeper,weexpecttheLCOEforsolarby2050.Thisshiftoccursascostcomponentsadjustandthensellitwhenpricessoar,givesitanedgeSharedcostsrelatedtopermissions,siteselection,PVtodiptoapproximatelyUSD21/MWhby2050todecreasingexpenses.DespitethiseasementintheoverstandalonesolarPV.Figure3.3illustrateshowequipment,andgridconnectionscutdowntheinitial(Figure3.2),withsomeprojectscostingevenlessthanrateofcostreduction,solarPVispoisedtobethesolar+storageopensupthepossibilityforsolarinvestments.Operationallytoo,combinedcostsUSD20/MWh.Thecatalystbehindthisdeclineistheunrivalledcontenderforthecheapestnewelectricityenergytobeutilizedatnightandhowsolar+storageareslashedwhenthesesystemssharetransactionalreductioninunitinvestmentcosts.Presently,thesesourceglobally,withexceptionsonlyinareaswithoperatessothatitopportunisticallytakesadvantageexpenses.costsaverageUSD870/kW.AssolarPVinstallationslessconduciveirradiationconditionslikethehigherofhigherpricesonanexampleweekin2050forcontinuetodouble,thesenumbersareboundtonorthernlatitudes.ThelearningrateforoperationalNorthAmerica.Havingsolarandstorageintandemoffersundeniabledrop,landingbelowUSD700/kWshortlyafter2030expenses(OPEX)ispredictedtoremainsteadyat9%costadvantages.Forexample,considertheUSandshrinkingfurthertoUSD560/kWby2050.till2050,thankstotheadventofadvanceddataThisrevenueedgeisalreadydiscernibleintherevenue-scenario:beforethe2022InflationReductionAct,monitoringandefficientmaintenancepractices.adjustedLCOE(Figure3.2)inthe2020s,whereco-locatedstorageprojectsreapednearly30%Anintriguingaspectofsolar'scostisthelearningsolar+storagewilloutperformregularsolarPVincapitalcostbenefitsfromgovernmentincentives.rate,whichpertainstothedecreaseincostswithSolar+storage:arevenueboostertermsofrevenues.By2040,wepredictmostoftheThisfinancialbackingcatapultedNorthAmericatoeverydoublingofsolarproductioncapacity.TheAlthoughsolar+storagecomesatapremium,itglobalsolarcapacityadditionstointegratestorage.theforefrontofthesolar+storagedevelopments.learningrateforsolarmodulecostsiscurrentlyatconveysauniquerevenueadvantage.TheabilityThesynergisticpairingofsolarandstorageisnotjustButco-locationhasitschallenges.Siteschosenfortheirsolarpotentialmightnotalwaysbefinanciallyoptimalforthestoragecomponent.Whilestandalonebatteriesthrivebybuyinglowandsellinghigh,thisbalancemightbeupsetinaco-locatedsetup.Policyshiftsin2022,whichremovedtheneedforbatteriestosourceenergysolelyfromrenewables,mightreducethedriveforco-location.Yet,giventhefallingpricesofbatteriesandsolarmodules,itisundeniablethatbothco-locatedandstandalonesystemshaveasignificantroleintheenergytapestryofthefuture.RegionaltrendsBy2050,weanticipatethesolarenergytobeledbyGreaterChinaandNorthAmerica.However,itisimportanttoanalyseregion-specificdevelopmentstounderstandthebroaderpicture.65CONTENTSDEMANDELECTRICITYRENEWABLESFOSSILFUELSFINANCEPOLICYEMISSIONSREGIONSAPPENDIXDNVEnergyTransitionOutlook2023GreaterChina,asshowninFigure3.4,secureditsvariousregions.Auniversalincreaseinsolar'ssharetheless,abundantdomesticoilandgasresourcespositionasthefront-runnerin2022byproducing30%from2020to2050isevidentacrossallregions.Yet,delaythepointatwhichsolarsurpassesfossilinofglobalsolarelectricity,whileNorthAmericatrailedthepaceandreasonsforthisshiftdiffer.Europe,electricitygenerationuntilpost-2040.NorthAmerica'sbehindat18%.Thoughbothregionswillexperiencewithitsworld-leadingdecarbonizationagendaandsolarexpansion,ontheotherhand,owesitstrajectoryaslightdipby2050,theywillnonethelessremainsupportivesolarpolicies,willwitnesssolarsurpasstocompellingeconomicsandstrengthenedpolicydominantinthesolarenergyhierarchy.Meanwhile,fossil-fuelgenerationby2030.Theoverwhelmingendorsement.theIndianSubcontinentandtheMiddleEastandsurgeinsolarwillslightlydecreasetheshareofNorthAfricawillnearlytripletheirsolarsharesfromothervariablerenewableenergysources(VRES)Lastly,by2050,theIndianSubcontinentissetto6%and3%in2022to14%and12%by2050,respec-andnuclear.surprisewitha37%shareofsolarinelectricitygener-tively.NorthEastEurasia,however,willcontinuetoationinthatregion,slightlyedgingoutGreaterChinalag,contributingamere2%totheglobalsolarTheMiddleEastandNorthAfricaregion,blessedonthatmetric.AsportrayedinFigure3.6,thisnecessi-electricityshare.withhighsolarirradiation,willharnesssolarforalmosttatesaconnectionofabout2.6TWofsolarcapacitytohalfofitselectricityby2050.Thisregion'sinclinationthegrid,secondonlytoGreaterChina's4TW–whichFigure3.5furtherelaboratesonsolarelectricity'stowardssolarisfurtherenhancedbytherelativelyrepresents26%ofthetotalsolarcapacitysettobeprominenceinthetotalelectricitygenerationoflimitedpresenceofotherVRESlikewind.Never-installedby2050.66CONTENTSDEMANDELECTRICITYRENEWABLESFOSSILFUELSFINANCEPOLICYEMISSIONSREGIONSAPPENDIXDNVEnergyTransitionOutlook2023Off-gridsolarcapacityhand,wehavevastcentralizedpowerhouses,whileBeyondthegrid,weseetheriseofoff-gridsolar,ontheother,wewitnesstheriseofdecentralized,particularlyinhydrogenproductionandservingindividualizedenergysystems.isolated,oftenrural,demands.By2050,nearly3TWofoff-gridsolarwillbededicatedtohydrogenSensitivitiesproduction,predominantlyinGreaterChina(40%),SolarPV'sdeploymentremainsconsistentacrossEurope(26%),andNorthAmerica(16%)(Figure3.7).differentcarbonpriceassumptions.InourextensiveFurther,about137GWwillbelocatedinremotemodeltesting,wefoundthattheimpactofcarbonregionsinSub-SaharanAfricaandtheIndianSubpricesonsolarPVisminimal.Theprimaryreasoniscontinent,deliveringlife-changingelectricityaccess.thatsolarPVchieflycompeteswithwindandotherTheseregions,despitethegeographicalchallenges,renewablesratherthanfossil-fuelsourcesintheoffervastuntappedsolarpotentialandholdthepowergenerationsector.Thus,itspositioningandpromiseoftransformationalenergyindependence.growthisnotheavilyreliantonfluctuatingThisnarrativeunderlinesthefuture'sduality:ononecarbonprices.By2050,wewillwitnesssolarPVcapacitiesBiodiversityandtheextinctionrate10-fold,andprotectingtraditionalof8.8TWandanadditional6.5TWforenergytransitionknowledgeofindigenouspeoplesandlocalcommu-solar+storage,bringingthetotalto15.3TW,nities.TheGBFisnotalegallybindingtreaty,anda13-foldgrowthfrom2022.The15thConferenceofParties(COP15)totheachievinggoalsandtargetswillbedifficultandchal-UNConventiononBiologicalDiversityledtothelengedbyother,sometimesconflicting,priorities.internationalagreementtoprotect30%oflandandoceansby2030(‘30by30’)andadoptionStill,GBFisexpectedtohaveasignificantimpactonoftheKunming-MontrealGlobalBiodiversitythefinancialsectorandenergycompaniesalike,asFramework(GBF),agreeingonfourgoalsand23countriesaroundtheworldendeavourtodeveloptargetstohaltandreversebiodiversitylossbynewplansandregulationstomeettheirtargets.2030.UNEP-FI(2023)suggestsfiveforeseeableregulatoryactions:1)mandatorynature-relateddisclosuresandThefourgoalsare:increasingtheareaofnaturaldata,2)increasingnature-positivefinancialflows,ecosystems,restoringtheirintegrityandnormalaidedbyharmonizedtaxonomiesandstandards,functioning,reducingthehuman-caused3)biodiversitytargetsandduediligenceobligationstoformamandatorypartofcompanies’governance,67CONTENTSDEMANDELECTRICITYRENEWABLESFOSSILFUELSFINANCEPOLICYEMISSIONSREGIONSAPPENDIXDNVEnergyTransitionOutlook20234)clarificationofsupervisoryexpectationsandconflictinsomesocieties.Thisisequallytrueforprintsandinthedegreetowhichtheaffectedsea,permittingandsimilarprocesses,arescaledtoalsoguidanceonbiodiversityrisk-management,andallfossilenergybuild-out,includingpipelinesforland,andhabitatisdegraded.reflectnatureandbiodiversitypriorities.Withthe5)furtherinternationalalignmentinpolicytransport.OnekeyconsiderationhereisthatglobalimplementationoftheGBF,weexpectadeepeningconcerningnature-basedsustainablefinance.warmingwillcausemassivebiodiversityloss,andInAppendixA.4tothisOutlookwediscusslandofregulatoryeffortsfordecarbonizationandformitigatingtemperatureincreasebyreplacingfossilandsea-areasrequiredtosupporttheforecastaccountability/responsibilityalongenergyvalueThelossofbiodiversityalsoneedstobeseenagainstenergywithrenewablesisanextremelyimportantrenewablegrowth.DNV’sOutlookdoesnotreflectchainsandacrossprojectlifecycles.Regulatoryinter-thebackgroundofothernature-relatedprioritiesandactionforpreservingbiodiversityovertime.specificconstraintsontheenergysupplysidesetventionswilldeepentominimizeandmitigatebiolossofacreage,includingacreageforrecreationalbybiodiversityrequirements.However,thesupportdiversityrisksandlosses,andthesedevelopmentspurposes,visibilityandsoundimpactonhumanAllformsofenergyneedtomanagenatureimpactslevelsweincludeforrenewables,andthetimeforwillbemonitoredforfutureOutlooks.settlements,andsimilarpriorities.TheseconcernsAllenergyprojectsaffectbiodiversitythroughtheirandprioritiesarestrengtheningtogetherwiththeplacement,construction,andtransportation,asFIGURE3.8biodiversityconcerns.wellasmining,drillingandextraction.ThemineralEnergy-relatedbiodiversitymanagementrequirementsoftransition-relatedrenewableenergyTheclosetiesbetweenenergytransitionandtechnologiesaswellastheirend-of-lifehandlingMetalsNaturalresourcemanagementWaternatureimpactshavereceivedgrowingattention.However,energyFossilfuelLandElectrificationbasedonincreasinglyhigheroptionsneedjudgingonequalterms.ThisinvolvesBiodiversityrenewableelectricitygenerationisakeyfeatureassessmentofpositiveandnegativeeffects,andvalueoftheenergytransition,Figure2.4inSection2.1.2by-products(e.g.biodiversityloss,emissions,waste)showsglobalpowergenerationfromrenewableanddecommissioningrisks,colossalandcostlyintheMineralsBiomassenergysourcesin2050willbesix-foldhigherthancontextofnuclearpower,aswellasforthefossil-fuelin2022.WiththeestablishmentofGBF,thismassiveextraction,distribution,refinementandusephasesAdaptedfromIRP–InternationalResourcePanel(2021)build-outwillbesubjecttomorescrutinyforits(Hartfootetal.2018).biodiversityimplications.However,theevaluationof68biodiversityimpactsofenergyproductionanddistri-Yetfromatotalenvironmentalperspective,thebutiongoesbeyondrenewablepowergeneration.potentialandroleofrenewablesincuttingenergyTheGBFwillbeequallyrelevantforactivitiessuchsystemGHGemissionswilllikelyoutcompetemoreasland-use/deforestationforbiofuelproduction,localizedconcerns.Thisisnottoarguethattheirminingtransitionminerals,landandoceanuseforbiodiversityandnatureimpactsshouldnotbemini-solarandwindfarms,decommissioningofwindandmizedandmanaged.Onthecontrary,allnaturalsolarfacilities,andtheconstructionofnewtrans-resourceandenergyprojects(Figure3.8)shouldbemissionlines–allpotentiallyleadingtohabitatloss,managedfortheirpositiveandnegativecontribu-speciesextinction,disruptionstoecosystemsandtions,withaviewtoland,climate,andwaterfoot-CONTENTSDEMANDELECTRICITYRENEWABLESFOSSILFUELSFINANCEPOLICYEMISSIONSREGIONSAPPENDIXDNVEnergyTransitionOutlook20233.2WINDIn2022,windpowercontributed7%totheglobalanannualaveragegrowthrateof8%.Attheonsetofgrid-connectedelectricityoutput.Thelion'ssharethisperiod,in2022,onshoresiteswerethedominantWeforecastanine-foldgrowthingrid-connectedwindpowergenerationglobally,ofthiswasfromonshorewindfarms,whileamereplayers,accountingfor91%ofthewindgeneration,from2,000TWhin2022to18,300TWhbymid-century.Thisisaccomplishedbyonlya0.6%wasattributedtofixedoffshorewind.However,whileoffshorewindfarmsinshallowwatersprovidedseven-foldgrowthinglobalwindcapacity,thankstoincreasingcapacityfactorsofwindthisdistributionwasnotuniformacrosstheglobe.Intheremainder.However,by2050,thelandscapeisgeneration,especiallyinoffshorewind.WeexpecttotalinstalledwindcapacitytogrowregionssuchasNorthEastEurasiaandSouthEastexpectedtoshift:whileonshorewindwillstillleadfrom950GWin2022to6,400GWby2050.Asia,windpowerrepresentedaminuscule1%ofelec-with70%,fixedoffshorewillrisetocover25%,andtricitygeneration.Instarkcontrast,Europe'sgridsawfloatingwindturbinesindeeperwaterswillcontributeOverthelastyear,thewindpowersectorhasfacedmanydescribeastheperfectstorm.Theseissueswindpowermeeting16%ofitselectricityneeds,as5%tothetotalwindelectricity.significantchallenges.CostinflationimpactinghavepromptedustoreviseourforecastsforthisdepictedinFigure3.9.Severalfactorsaredrivingthisrapidexpansion.TheLCOE,supply-chaindisruptions,concernsaboutyear.Specifically,wepredictaminorreductioninprimarycatalystistheworld'sgrowingdemandforturbineandrotorquality,andshrinkingprofitwindpowergenerationandinstalledcapacitybyOurlong-termprojectionsremainoptimisticforwindelectricity.Beyondthat,theeconomicefficiencyofwindmarginsfororiginalequipmentmanufacturers2050comparedwithourprojectionsinlastyear'spower.Thisisfuelledlargelybyregionalcommitmentsenergyisbecomingincreasinglyevidentinmanyloca-(OEMs)allconverged(DNV,2023c),resultinginwhatOutlook(DNV,2022b).todecarbonizeandtheattractivenessoffosteringtions.Despiteinitialhighcosts,thelong-termfinancialemergingwindtechnologyindustries.High-incomebenefits,combinedwiththepressingneedtoreducecountrieswithlimitedlandavailabilityarecurrentlycarbonemissions,makewindenergyanattractivefacingauniquepredicament.Ononehand,onshoresolution.windtechnologyintheseregionshasmaturedandisreadyfordeployment.Ontheother,decidingwherePhotoby,toplacetheseturbinesissparkingdebatesandDennisSchroeder,conflicts(SupremeCourtofNorway,2021),high-NRELlightingtheneedforcarefulplanningandstrategy.Also,theregulatedsubsidylevels—forkickingoffnew69technologiesusedinfloatingwindprojectsandforbalancingthecurrentcostinflationandstimulatingwindpowerinnewcountriesandregions—willbekeyinthefuture.Regulationclarity,speed,andfirmnesswillallplaycrucialrolesinunderpinningtheadoptionofwindpowerforallcountries.ElectricitygenerationFrom2022to2050,globalwindelectricitygenerationissettoexperienceasignificantleap,growingfrom2,000TWhtoanimpressive18,300TWh,markingCONTENTSDEMANDELECTRICITYRENEWABLESFOSSILFUELSFINANCEPOLICYEMISSIONSREGIONSAPPENDIXDNVEnergyTransitionOutlook2023Furthermore,regionslikeEuropeandGreaterChinameansthatevensiteswithlessfavourablewindpatternsglobalmarkets,includingNorthAmericaandEurope.Currently,theLCOEforfloatingoffshorewind(USDarestrengtheningwindenergyplansasastrategicarenowviablebecausetheycangeneratemorepower.Thischangeintrend,compoundedbyshort-term270/MWh)ismorethanthreetimesthatoffixedmovetowardsbolsteringtheirenergysecurity.ByTheglobalaveragecapacityfactorforonshorewindwindmarketchallenges,suchasfinancingandqualityoffshorewind(USD80/MWh).Despitetherecentinvestingindomesticenergyproductionthroughstoodat24%in2022,butwithadvancementsindigitalconcerns(seefactboxoverleaf),influencedchangesLCOEdeceleration,ourmedium-termoutlookwind,theseregionsarereducingtheirrelianceoncontrolandrotordesign(DNV,2019),itisprojectedtowemadethisyeartoourLCOEforecast.remainsoptimistic.By2032,floatingoffshorewindimportedenergysources.Intermsofregionalcontri-riseto30%bythe2030sandleveloffat32%by2050.ispredictedtocostonlytwicetheamountoffixedbutionstoon-gridwindelectricity,Europeisantici-Froma2022baselineofUSD49/MWhforprojectsoffshorewind.Bythemid-21stcentury,theglobalpatedtoleadthepackwith43%,boastinganequalHowever,growthinrotordiameterforonshorewindatfinancialclosethatyear,weanticipatetheglobalcostdifferencebetweenthemisprojectedtobesplitbetweenonshoreandfixedoffshoresources.isgraduallyslowing.Withprimewindsitesinestab-weightedaverageLCOEforonshorewindtodroptoabout30%duetothebenefitsofeconomiesofscaleTrailingclosebehindareGreaterChinaat37%andlishedmarketslikeNorthAmerica,Europe,andChinaUSD33/MWhby2030.Thereafter,thepaceofthisandimprovedefficienciesinproduction.ToprovideNorthAmericaat35%.alreadybeingutilized,increasedcapacityfactorsareLCOEreductionispredictedtodeceleratefrom2030specificnumbers,by2050,weestimatetheglobalnowbeingdrivenbynewermarkets,suchasSouthto2050.ThisisprimarilyduetoahaltinrotorsizeaverageLCOEforfixedoffshorewindataroundUSDHowever,thisanticipatedgrowthisnotsimplyamatterEastAsiaandtheMiddleEastandNorthAfrica.advancementandthecrowdingofthemostoptimal51/MWhandfloatingoffshoreatapproximatelyUSDofinstallingmoreturbines.Itiscrucialtoconsiderthesites.Overthesetwodecades,weexpecttheLCOEto67/MWh,withthesecostreductionsdrivenbyvolumeeconomicdynamicsofwindpower.FactorssuchasIncontrast,offshorewindprojectionsareevenmorefurtherdropfromUSD32/MWhtoUSD27/MWh.increasesandtheadvantagesofexperientiallearning.installationcapacity,thecostsassociatedwithcapacitypromising.Whilethecurrentcapacityfactorsforandmaintenance,andtheefficiencywithwhichtheseexistingoffshoreturbineshoveraround30%,projects70turbinesoperate,playacriticalrole.Moreover,asthethatwerestartedin2022arepredictedtohavecapac-industrygrowsandmatures,thecumulativeeffectofitiesof35%to45%andthesenumbersareantici-hands-onexperienceisexpectedtodrivedowncostspatedtorise.Bymid-century,theaverageoffshorefurther,makingwindpowernotjustanenvironmentalwindcapacityfactorcouldbe42%to43%,andevenimperativebutaneconomiconetoo.exceed50%inregionswithoptimalwindconditions.Therelativenoveltyoftheoffshorewindmarket,CapacityfactorscombinedwithongoingimprovementsintowerandGeographicalwindpatternsandthediameterofthefoundationtechnologies,allowsfortheexploitationofrotorinfluencethecapacityfactorofwindpower.windiersitesinaquaticregions,evenwiththehigherOverthepasttwodecades,bothonshoreandinitialinvestmentcomparedwithonshorewind.offshoreturbineshaveexperiencedconsistentgrowthinrotordiameters,whichinturnhasledtoanincreaseLevelizedcostofenergy—LCOEintheirratedpower.Figure3.10illustratestheglobalLCOEforthreetypesofwindpowergenerators:onshore,fixedoffshore,Withlargerandmoreefficientrotors,notonlyhasthereandfloatingoffshore.Whilewehadseenaconsistentbeenariseinelectricitygenerationfromwind,butdecreaseinLCOEovertheyears,lastyearmarkedatheLCOEhasalsodecreased.Thisrotorsizeevolutionchange.ThedeclineslowedorevenreversedinseveralCONTENTSDEMANDELECTRICITYRENEWABLESFOSSILFUELSFINANCEPOLICYEMISSIONSREGIONSAPPENDIXDNVEnergyTransitionOutlook2023Short-termchallengesforHighinterestratesandcostofcapitalDwindlingprofitsandmarginsforOEMstobeashort-termeffect,endingoncethedesignwindpowerThecentralbanksofalmostallmajoreconomiesElevatedcostsofrawmaterials,suchassteelforwindandsizeincreasesstabilize.haveincreasedtheinterestrateforborrowingturbine,rotor,andhubmanufacturing,hasaffectedThewindpowermarkethasbeenbuffetedbyhead-(explainedinSection5.3),whichhasledtothetheprofitmarginsofOEMs,leavingthemverylittleLocalcontentrequirementswindsexacerbatedbythecost-inflationarypressuresexpectationthatthecostofbothdebtandequityroomformanoeuvringasforward-signedcontractsManywindpowermarketsmandatelocalcontentinthathaveaffectedmanymatureeconomies.Twocapitalwillseeelevatedlevelsin2023and2024andmuststillbehonoured.Similarly,rapidlyevolvingdomesticprojectsasprerequisitesforawardingofrecentexamplesarethefailuresofwindpoweronlyreturnto2022levelsby2025.Thisshort-termtechnologydevelopmentcycleshavealsoledtocontractstostimulateandboostlocalmanufacturingauctionsintheNorthSeaintheUK(Reed,2023)andincreaseincostofcapitalseverelycurtailsthequalityissuesincomponents,thusincreasingtheindustries.Insomenascentmarkets,suchrequire-intheGulfofMexicointheUS(Noor,2023).Here,wefinancialviabilityofwindprojects,deterringprojectcostsandreducingthemargins.mentsprovetobetoocostlyand/ortoodifficulttosystematicallyoutlinethearrayofchallenges,givingdevelopersfrominvestinginwind.adhereto,resultingincontractsnotbeingawardedbriefexplanations.Supply-chainsnarls(Buljan,2022).Whileelevatedcostsareonething,theinabilitytosourcerawmaterials,components,andappropriateWhyarewestilloptimistic?skilledlabourhavealsoaddedtothedelaysinwindTheseshort-termchallengesarenotshow-stopperspowerprojectsgoingahead,contributingtolongerforwind,andshouldratherbeconsideredsmallleadtimes,translatingtoelevatedcosts.speed-bumpsinthenearfuture,forthefollowingreasons:Gridlock,delaysinbuildingtransmissionlinesWhileprojectsmaybeready,strugglestoplan,—Unlikesolar,windhaslessdiurnalvariability,andpermit,andbuildtransmissionlinestotransmitthethusservesasacomplementarygenerationoptionelectricitygeneratedfromwindfarmstotheload-inmanyregionalgridswithahighshareofsolarcentresincertainregionsplacesevererestrictionsongeneration,suchasNorthAmerica.projectprofitability(asexpandedoninSection2.1.2).—Expectedcapacityfactorincreasesinthefuture,Suppressedcost-learningeffectsespeciallyforoffshorewind,andextensionofThecontinuousdevelopmentoftechnology,withlifetimewithrepoweringpossibilitiespushtheimprovementstodesignofcomponentsandsizecostcalculusconsiderablytowardsaninvestmentofrotorsandturbines,willsomewhatdampenthedecision.cost-learningeffect,whichnormallyaccruesthroughproducinghighvolumesofthesameproduct.Signif-—Nationalandsometimessub-nationaldecarboni-icantchangestodesignandsizesimplythatthezationgoalscomewithcontractsfordifferenceandlearningisonlytransferredpartially.Weexpectthispremiumpayments,whichstimulatethemarket.71CONTENTSDEMANDELECTRICITYRENEWABLESFOSSILFUELSFINANCEPOLICYEMISSIONSREGIONSAPPENDIXDNVEnergyTransitionOutlook2023Installedcapacitybyeconomicincentivesfromtheregion'semergingTotalinstalledcapacityofwindpowerin2022wascarbonmarketinthepowersector.950GW,93%ofwhichwasonshorewindturbines.Weexpecttotalwindcapacitytogrowto1,950GWOntheotherhand,Europeisshapinguptobetheby2030andsubsequentlyreach6,400GWbyleaderinthefloatingoffshorewindmarket,particu-mid-century.larlyleveragingdevelopmentsintheNorthSea.Whenbreakingthesenumbersdownbyregion,Beyondthesefigures,itisworthnotingthatwindasshowninFigure3.11,someinterestingtrendspowerwillservemorethanjustourelectricityneeds.emerge.ThisfiguredividestheinstalledcapacitiesAdedicatedportionofthiscapacitywillbespecifi-intothreecategories:onshore,fixedoffshore,andcallygearedtowardshydrogenproductionthroughfloatingoffshorewindturbines.GreaterChinastandselectrolysis.Ourforecastsindicatethatby2050,outasthedominantplayerinbothonshoreandtherewillbe385GWofonshoreand100GWoffixedfixedoffshorecapacities.Thissurgeisnotjustdueoffshorewindcapacitydedicatedsolelytohydrogentotherapidrateofinstallationsbutisalsofuelledproductiononaglobalscale.72CONTENTSDEMANDELECTRICITYRENEWABLESFOSSILFUELSFINANCEPOLICYEMISSIONSREGIONSAPPENDIXDNVEnergyTransitionOutlook2023GridlockandpermittingdelaysDelaysinexpansionofgridinfrastructurearisefrom—Lackofappropriatecross-border,inter-state/InherrecentStateoftheUnionaddress,ECPres-severalfactors,including:provincecollaborationonpermitconsiderations.identUrsulavonderLeyenunveiledanewEU‘WindPlanningandpermittingofpowercapacityandgridPowerPackage’.Itaimstofasttrackpermittingareincreasinglyabottleneck,potentiallyacting—Time-consumingprocessestoobtainpermittoTheextentofdelaysandthedynamicbetweenevenmore;toimproveauctionsystems,skillsdevel-asabarriertotheenergytransition.bydelayingbuildhigh-voltagetransmissionlines,involvingrenewablecapacityandgridswerehighlightedbyopment,andaccesstofinance;and,tostabilizerenewablecapacitydevelopments.Itcantakeuptoenvironmentalimpactassessments,publicBloombergNEF(BNEF,2023a)asshowninFiguresupplychains(Sanderson,2023).10yearstobuildawindenergyproject,especiallyhearings,andnegotiationswithlocalcommunities.3.12.Almost1,000GWofsolarprojectsarestuckoffshore(WEF,2023).DeployinggridinfrastructureintheinterconnectionqueueacrosstheUSandIntheIndianSubcontinentregion,theEnvironmentaliscomplex,involvesmultiplestakeholdersandcan—LackofcoordinatedspatialplanningandpermittingEurope,closetofourtimestheamountofnewsolarandSocialImpactAssessments(ESIAs)frameworktakeupto15years.Delaysresultinincreasedprojectprocessforgenerationsites,grids,andtherelatedcapacityinstalledaroundtheworldlastyear.Overhasexpeditedthedeliveryofrenewableenergycosts,anduncertaintiesforbothprojectdevelopersprojectinfrastructure.500GWofwindwerealsowaitingtobepluggedprojects(WEF,2023).IndiahaslaunchedtheNationalandinvestors,thuspotentiallydecreasingtheflowofintothegrid,fivetimesasmuchaswasbuiltin2022.Single-WindowSystemtoprovideinvestorsandbusi-capital.—Lackofanticipatoryinvestmenttoaccommodatenesseswithaone-stop-shopforapprovals,andfordistributedenergysourcesatthedistributionlevel.DelaysarereceivingregulatoryattentionadvancinginvestmentsinaninterstatetransmissionDelaysinrenewableenergyprojectsarisefromThepermittingandsitingprocessforbothnetwork(Mercom,2022).severalfactors,including:renewableplantsandgridshasreceivedextensiveattentionsincelastyear’sETO.PolicymakersinIntheOECDPacificregion,theAustralianEnergy—Sitingissues:PermissiontobuildrenewableseveralETOregionshavetakensignificantstepstoMarketOperatordevelopedtheIntegratedSystemenergyprojectsmeetcontradictoryenergy,expeditepermitting.Plan(ISP)(AEMO,2022)whichaimstobroadenitsclimate,environmentalandsocietalgoalsinscopefrombigtransmissionprojectsandspeedupspecificareas,suchasculturalorhistoricalsignifi-InEurope,theRePowerEUplan,CouncilRegulationplanningandapprovalsdecisionsforcleanenergy,cance,biodiversitypreservation,andthepotential2022/2577(December2022),andtheagreeduponwindandsolarprojects.disruptionoflivelihoodsonpoductivelandandRenewableEnergyDirective(RED)emphasizenew,waterbodies.simplerpermitting.ForexampleREDIIIdetailsIntheNorthAmericaregion,severalstepsattheondesignatedprojects/areasofoverridingpublicfederallevelhavebeentakenfocusingonexpediting—Interconnectionchallenges(gridlock):Permissiontointerest,digitalprocesses,andswifterpermittingpermittingreform,andwereferthereadertoDNV’sconnectarenewableenergyprojecttoanexistingdeadlines(oneyearforpre-identifiedappropriatereportEnergyTransitionNorthAmerica2023(DNV,transmissiongridcanbecomplex.Ifthegridisland/‘go-to’areas,otherswithatwo-yeartimeframe,2023c)forfurtherdetails.alreadyheavilyloaded,theremaybeinsufficientthreeforoffshorewindconstructionpermits).ThecapacitytoaccommodatetheadditionalpowerTrans-EuropeanEnergyNetworks—Electricity(TEN-E)Inourforecastofthemostlikelyfuture,scalinguptheunlessupgradesorexpansionsofthegridinfra-regulationaimstobetterinterconnectnationalworld'sgridstosupporttheenergytransitioncomesstructurearemade.infrastructureacrossEurope(Euroelectric,2022).withaheftypricetag.Byourestimate,morethanUSD73CONTENTSDEMANDELECTRICITYRENEWABLESFOSSILFUELSFINANCEPOLICYEMISSIONSREGIONSAPPENDIXDNVEnergyTransitionOutlook202332trnwillneedtobeinvestedby2050(from2023),andConsiderablegridaccelerationisneededforwhichdifferentiatedbypowerplanttypeandbyregion,Figure3.13givesanillustrativeexampleoftheNorthAmerica,China,andtheIndianSubcontinentregulatorscannotrelyonabusiness-as-usualregu-andtherawinputdataisprovidedbyGlobalDatadifferencebetweenourmostlylikelyfutureandawouldaccountforthemajorityofthisgridinvestment.latoryenvironment.Inmatureelectricitysystems,the(2023).ThisdatabasecollatesallpowerplantsathypotheticalfuturewithoutpermittingdelaysandThisinvestmentisnecessary,notonlytoexpandandregulatoryfocushasbeenonmaintainingthegridvariousstagesoffullorpartialonboarding—e.g.supply-chainconstraints.Thefigurepresentstheupgradethenetworks,butalsotoreplaceageingsuchthatthemodestorevenstagnantelectricityannounced,underplanning,underpermitting,undercomparisonbetweenthetwofuturesforglobalassets.Underpinningthisestimateistheexpectationgrowthcanbeaccommodatedandoverseeingthatconstruction—andgivestheyearinwhicheachiscapacityadditionsofoffshore(bothfixedandthattheregulatorymindsetbehindgridsundergoescompaniesdonotoverinvesttoavoidgridtariffsexpectedtostartoperating.floating)windinthenearterm(2023–2030).Theaconsiderableoverhaul,aselaboratedbelow.fromrising.differenceinourforecastandacasewherethereareAprojectinitsearlystageshasarelativelylownopermittingdelaysandsupply-chainconstraintsArevampoftheregulatorymindsetThisregulatorymindsetiscompletelyoutdated,likelihoodofcomingtofruitionwithoutanyhitches.rangesfrom2%to100%.Electricitygridsareveryregulatedbusinesses,hencereactive,anddragsprogressbackbydecades.Toreflectthisreal-lifedelay,weadoptaproba-thedrivingforcebehindtheirexpansionmustinev-bilisticapproach.Wemodifythepipelineofnewitablycomefromregulators.LookingtohistoricalFurthermore,therealityisthatthegridisa‘publiccapacityadditionsbymultiplyingthecapacitieswithgridtrendsisnotagoodindicatorforthefuture.good’andacriticalpartofnationalinfrastructure,adecreasingprobabilityiftheyareatearlierstagesakintothemilitary,forexample.Theexternalitiesandinthepipeline,rangingfrom10%forannouncedconsequencesresultinginnotupgrading,expanding,projectsto100%forprojectsunderconstruction.andmodernizingthegridhaveseriousimplications,Theprobabilitiesarefurtherreducedbasedonanotleastofallfordecarbonizingtheenergysystem.project'santicipatedyearofoperation;projectsslatedforamoredistantfutureareassignedalowerAccelerationingridinvestmentsneedstobedoneprobability.ProbabilitiesforthedifferentstagesofinananticipatoryandproactivewaytoenableonboardingareadoptedfromtheLawrenceBerkeleyonboardingofrenewablesandtheelectrificationNationalLaboratory(2023).Thesedelaysareoftransport,industries,andhouses.Ifregulatorsconsideredonlyforsolarandwindprojects.continuetorelyontherear-viewmirror,andfailtoincentivizeinvestments,therewillbeinsufficientSuchpermittingdelaysarepromptingabehaviouraldeploymentofinfrastructurethatcouldbecomecountermeasurefromprojectdevelopers,whichisablockagetorenewablesandelectrificationalsoreflectedinthepipelineofnewcapacityaddi-objectives.tionsandourinterpretedprobabilities.KnowingthattherearedelaysatmultiplestagesofarenewableHowwereflectdelaysintheOutlookproject,developersare‘hedging’byaskingforAcriticalinputtoourforecastisthe‘pipeline’ofnewpermissionsandgridconnectionsforprojectsthatcapacityadditionsinthepowersector.Thesearetheythemselvesknowmaynotgetapproved.74CONTENTSDEMANDELECTRICITYRENEWABLESFOSSILFUELSFINANCEPOLICYEMISSIONSREGIONSAPPENDIXDNVEnergyTransitionOutlook20233.3HYDROPOWERHydropowerandclimatechangeFurthermore,hydropowerhasadualpurposetoGlobalwarmingmaychallengethehithertoprevailinggenerateelectricityandmanagewaterresourcesforHydropoweristheoriginalmeansofrenewableelectricitygeneration.In2022,itrepresentedviewthathydropoweristhemostreliablesourcefloodcontrolandirrigation.Ensuringthathydropowercomfortablymorethanathird(37%)oftotalrenewableenergygeneration,andmorethanofpower.Climatechangeacceleratesmeltingofschemesareequippedtomanagethecomingchal-aseventh(15%)ofoverallelectricitygeneration.However,incontrasttosolarPVandwind,mountainglaciersandinducesgreaterrainfalllengesinrainfallandweatherpatternscancontributehydropowergrowthtowards2050willbemoderate.variationsandrecurrentdroughts.Evenifabsolutetoreduceddamagetolocalcommunitiesandcropsinprecipitationislikelytoincreasewithhighertemper-extremeweatherconditions.Inmanypartsoftheworld,solarPVandwindwillpumpedhydrorequiresnewinvestments,whichcouldatures,thechangescreateuncertaintyoverfuturecompetestronglywithhydropower,causingaverageinvolvebiodiversitychallengesandenergylosses,hydropoweroutput.Thiswasdramaticallyillus-Thesizeandregionalplacementofhydropowerelectricitypricestodeclineandcreatingadversemanyareaswillcontinuewithtraditionalhydro-tratedrecentlyinChina’sSichuanprovincewhereschemesarealsoimportanttoconsider.Whilesmallconditionsfornewhydropower.However,policyconti-powerwithoutpumpingfacilities.Run-of-riverhydro,adrought-inducedhydropowerdeficitcausedthehydropowerschemesaregenerallylowimpact,largenuityforhydropowerprojectsandrisingelectricitythoughlackingstorageandthereforeonlypartiallyprovince'scoal-firedplantstorunatmaximumrateddamscanhaveregionaleffectsandinfluencethedemandwillensurethathydropowerprojectswilldispatchable,willalsocontinuetoplayarole.capacity,leadingtoyetfurtherwaterdraw-downforwaterflowinareaswherewaterisalreadyascarcecontinuetobepursued,atleastinlow-incomepowerstationcooling(Zhang,2023).resource.Intheseareas,climatechangemightexac-economies.Forecasterbateconflictarounditscontrol,andcouldpossiblyHydropowergenerationhasdoubledoverthelast20endangeralreadyfragileagricultureanddrinking-ThereisacompatiblerelationshipbetweenVRESandyears,andgrowthwillcontinueuntilitslowsdownandwatersupplytogrowingpopulations.hydropower.AssolarPVandwindenergywillgrowplateausin2040(Figure3.14).Untilthen,mostofthestrongly,thereisincreasingneedfordispatchablegrowthwillbeinGreaterChina,theIndianSubcon-Theeffectsofthesevariousparametersarehardtopowerthatprovidesthenecessaryflexibilityfortinent,andSouthEastAsia.After2040,growthinquantifyandarenotdirectlyaccountedforinourthegrid,bothfordailyandseasonalvariationhydropowergenerationwillstabilizeinallregions.Inforecast.However,theymightsignificantlyinfluencemanagement.Hydropowerisexcellentfromthis2050,suchgenerationwillprovidelittlemorethanathepurposeofhydropowerincomingdecades,andperspective,beingbothzero-emissionandeasytotenth(11%)ofthetotalelectricitysupply,downfromwewillpayattentiontothesechanges.turnonandoffasneeded.Althoughwemightsee15%in2022,butthegrowthfromtodayismorethanincreasedcompetitiononprice,thisabilityenableshalf(54%)inabsoluteterms.75hydropowertoreceivemuchhigheraveragepricesandensureprofitsdespitehavingahigherLCOEthanMostregionswillseemoderategrowthinhydropowerwindandsolarPV.capacitytowards2050.ThelargestcapacityadditionswillbeinGreaterChina,theIndianSubcontinent,andPumpedhydro,whichincreaseswatervolumesbySouthEastAsia.In2050,thehighestabsoluteinstalledharnessingsurplussolarandwindenergytopumpgrid-connectedcapacityisseeninGreaterChina(490waterbackuptothereservoir,hasadditionalcapacityGW),theIndianSubcontinent(280GW),andLatintoprovideenergywhenneeded.However,becauseAmerica(260GW).CONTENTSDEMANDELECTRICITYRENEWABLESFOSSILFUELSFINANCEPOLICYEMISSIONSREGIONSAPPENDIXDNVEnergyTransitionOutlook20233.4NUCLEARPOWERmixbetweensite-builtandfactorymanufacturedSMRincreaseofallregions,growingfromtoday's64TWhpowerplants.Nuclearenergyoutputpeaksatalmostto260TWhby2050,withover50GWofinstalledChangesinthegeopoliticallandscapefollowingeventssuchastheannexationofCrimeaby3500TWhperyearby2047thenstaysflatuntil2050,capacityrepresentingalmost10%oftheworldRussia,theCOVID-19pandemic,andtheinvasionofUkrainehaveshiftedtheconversationbutatalevel41%higherthantoday.nuclearfleet.aboutenergysources,includingnuclearenergy.However,whetherthiswillresultina'nuclearrenaissance'willbedependentonmanyfactors,notleastthecostoffuturenuclearpower.NorthAmerica,Europe,GreaterChina,andNorthCapacitybuild-outanddecommissioningEastEurasiaarecurrentlythetopfournuclearenergySeveralnations—suchasBangladesh,Belarus,Historically,nuclearpowerhasofferedareliablecompetewiththecontinuouscostdeclineofrenew-regions.However,withinadecade,GreaterChina’sTurkey,andtheUAE—arejuststartingtopivotandcarbon-freesourceofcontinuouselectricityatablesandsolvetheexistingchallengesfacingtoday’soutputwillhavegrowntoalmostthesamelevelastowardsnuclear.However,thefutureofnuclearreasonablecost,particularlyaddressingconcernsnuclearfleet.Eventhoughlong-termwastestorageEuropeandNorthAmerica.JapanandSouthKoreacapacitywillbedeterminedbywhathappenstoaboutenergysecurity.However,the2011Fukushimacanbeconsideredtechnicallysolved,fewcountrieswilldoubleoutputfromtodaybybringingnewexistingpowerstations.Halftheworld’sinstalleddisasterinJapan,followedbyGermany'sdecisionhaveselectedandapprovedsitesforlong-termwastecapacityonlineaswellasreopeningthosecurrentlynuclearcapacityisover30yearsold,andmanytophaseoutitsnuclearpowerplants,hasmadethemanagement,withonlyFinlandconstructingsuchadormant.SouthEastAsiawilladd70TWhofnuclearreactorsareapproachingtheendoftheiroriginalpastdecadechallengingforthenuclearindustry.Insiteatpresent.InOECDcountries,newnuclearplantsby2050,butstartingonlyinthelate2030s.Thedesignlifetimes.Somecountries,suchasGermany,developedcountries,ithasstruggledtocompetehavebeenbesetbylongconstructiontimesstemmingIndianSubcontinentwillseethebiggestrelativearemostlikelytofollowthroughwithdecommis-withbothtraditionalfossilfuel-basedelectricityandfromseveralfactors,includingmovingtargetsinregu-sioningrapidly,butelsewheretherenewedfocusonemergingrenewableenergysources,buttherenewedlatoryregimes,increasedmaterialcost,andreducedenergysecuritycoupledwiththehighcostofnuclearemphasisonenergysecurity,drivenbythewarinlabourproductivity.Forexample,thecommissioningdecommissioning,therelativelylowcostofnuclearUkraine,hasledmanyregionstoreconsidernuclearoftwonewreactorsatPlantVogtleinGeorgia,theUS,lifetimeextension,andthedifficultyofrapidlypower.Nuclearenergyoffersastablesupplyofelec-wassevenyearslateandhadcostoverrunsofUSDreplacinglargecapacityretirementswithlow-carbontricitywithlessrelianceonfuelimportsfromother17bn(Amy,2023).However,thefuturelooksslightlyalternatives,haveledsomegovernmentstoconsidercountries,suchasnaturalgas.Withthedevelopmentmorefavourablefornuclearbuild-outduetotheextendingnuclearplantlifetimesthroughupgradesofSmallModularReactors(SMRs,seefactbox),theincreasedfocusonenergysecurity.andlife-extensionmeasures.Forexample,BelgiumindustryexpectstostandardizethetechnologyandandSpainextendedtheirnucleardecommissioningharmonizetheregulatoryregimes,therebyreducingElectricitygenerationtimetablefrom2025to2035.FranceandSwedenarecostsandimprovingcostpredictability,andthusOurOutlookthisyearreflectstherenewedinterestinpostponingtheirnucleardecomissioningplans,butanticipatessignificantmarketgrowth.nuclearenergysparkedbyenergysecurityconcerns.withincreasingdebateoverre-invigoratingnuclearOurforecastshowsnuclearenergyoutputstableatresearchandbuildingnewplants(Hernandezetal.,Developmentsinnucleartechnology,suchasSMRstoday’slevelsforthecomingyears,butgrowingfrom2023).SouthKorea'spresidenthasvowedtoreverseandotheradvancedreactors,promisesafer,morethelate2020s,seeFigure3.15.Fromtodaytowardsphase-outplans,andJapanadoptedanewplaninflexible,andpotentiallymorecost-effectiveoptions2030,mostaddedcapacitywillbebasedonsite-built,December2022thatwillmaximizetheuseofexistingthancurrentnuclearpowerplants.However,evenlarge-scalereactorsandisalreadyinthepipeline.reactorsbyrestartingasmanyofthemaspossiblewhenconsideringthoseconcerns,nuclearwillhavetoBeyond2030,additionalcapacitywillmostlikelybeaandprolongingtheoperatinglifeofagingonesbeyondthecurrent60-yearlimit(Reynolds,2022).76CONTENTSDEMANDELECTRICITYRENEWABLESFOSSILFUELSFINANCEPOLICYEMISSIONSREGIONSAPPENDIXDNVEnergyTransitionOutlook2023NuclearinvestmentsduetoenergysecurityNewcapacityalsointhepropulsionofmerchantships.WeseeneedtosecureasupplyofelectricitycombinedwithThechangesinthegeopoliticallandscape,disrup-SmallmodularreactortechnologyhasincreasinglyspecificusecasesemergingwhereSMRsareheatandpossiblyhydrogen.Inalltheseusecases,tionstonaturalgassupplies,andincreasedfocusbeenpraisedasthenext-generationtechnologytoespeciallywell-suitedtocompete.TheseincludeanSMRcouldsupportenergysupplyasacheaperonenergysecurityhavepromptednationstorecon-takeover.But,justlikeexistingnuclearplantdesigns,areasthatareremoteorunsuitableforlarge-scalealternativetohydrogenderivatives,orthroughflexiblysidertheirenergyportfolios.Nuclearenergy,whichSMRsneedtodemonstratecostcompetitiveness,renewablesdeployment,commercialshippingunablesupplyingelectricitytothegridorfactorydependingcanprovideastable,domesticsourceofpower,ishighsafetylevels,andsolvenon-proliferationandtousecheaprenewableelectricitydirectly,andlargeontheavailabilityofcheapwindorsolarenergy.Atanattractiveoptioninthiscontextbutcouldcomewaste-managementchallenges.Thereislimitedsourcesofmanufacturingdemand,suchassteel,othertimes,itcoulddiverttoincreaseitsproductionatahighercostcomparedwithalternativeenergyevidencetosupportclaimsthatSMRswillsolvethecostcement,andpetrochemicals.Theseindustrieswillofhydrogen.options.Inourmodelthisyear,wehaveincludedhurdle.TheAPR-1400-basedBarakahnuclearpowersuchpolicychoicesforregionsdependentonenergyplantintheUnitedArabEmiratesmayhoweverbeSmallModularReactors(SMRs)improvesafety.Inthelongrun,novelreactorimportsandwherenuclearenergyalreadyexists.consideredaspreliminaryevidenceofcostcontrolandtechnologiesmayreduceradio-toxicwaste,inBasedonourimplementation,wefindthatregionscostreductionsachievedusingstandardizedmodules.SmallModularReactorsareadesignconceptparticularifaclosedfuelcycleisachieved.arewillingtoinstallmorenuclear.ComparedwithGovernmentfinancedprojectscouldassumealowerreferringtothesize,capacity,standardization,aworldwithoutsuchconsiderations,therewillbediscountratethanprivateinvestorswhoperceiveandmodularmanufacturingforin-factorymassSofar,USregulatorshaveapprovedonlyoneSMR22GWmoreinstallednuclearcapacityand3.2%policyandtechnologyrisks,thusmakingnuclearmoreproduction.SMRsaresmallenoughtobeshippeddesign,theNuScalePowerCorporationVOYGR.Butmoreelectricitygeneratedby2050.However,thiscompetitive.PullingintheotherdirectiononcostistotheplantsitewhereseveralreactormodulesothercountrieslikeFrance(NUWARDSMR)andmanyisachievedbyadditionalsupportbygovernments/SMRssizewherematerialuse,andthuscost,perMWcanbeintegratedtotheneededcapacityandcompanieshavesubmitteddesignsforapproval,authoritiesintherangeof8%to20%ofthelevelizedincreasesthesmalleramodulegets;so,thequestionoperatedasasinglesysteminasinglehousing.planningoperationalstart-upearliestby2030.Therecostofnuclearenergy,from2023to2050.iswherethesweetspotformodularnuclearis?ThisproductionapproachmayreducecostsinarealsodesignsbeingdevelopedinChinaandthelongrunbutwilllikelyincreasecostsintheRussia,butthereisuncertaintyastowhethertheywillTheadditionalsupportgovernmentsarewillingtoNewSMRreactorsaresaferbydesign,relyingonshorttermduetoinvestmentneedsinmanu-beacceptedelsewhereinthecurrentgeopoliticalgivenucleartosecureenergysupplyisdifficulttomorepassivesafetyandhavingtocomplywithfacturingfacilitiesandhighermaterialintensity.landscape.WhileSMRsholdthepromiseofprovidingdisentanglefromotherparametersaffectingsupportincreasinglystricterregulations.However,newThesmallsizealsofacilitatesinstallationunder-stable,carbon-neutralenergy,especiallyinareasfordifferentpowergenerationoptions—forexample,designsremaintobetested.Thepotentialimpactofground,immersedinwaterpools,contributingunsuitableforlarge-scalerenewabledeployments,thecleanenergytaxcreditinNorthAmerica.Also,SMRtechnologiesonweaponsproliferationisunclear.toincreasedsafety.SMRsspanarangeofreactortheirwidespreadadoptioniscontingentonnumerousitisworthbearinginmindthatitisnotonlynuclearSMRtechnologiesrequiringhigher-enricheduraniumtechnologiesfromprovenlight-watertechnologiesfactors,includingpublicacceptance,regulatorycontributingtosecureenergy,butrenewableoptionsfuelcouldposeagreaterproliferationriskthanthetonovel,untestedtechnologies.Modernreactoragility,andeconomicviability.Inaddition,withSMRsaswell,whichalsowillincursubsidybenefitsfromcurrent5%-enricheduranium(Holt,2017).technologieshavepassivesafetysystemsandcomesprobablyanorderofmagnitudemoresites,ingovernmentsprioritizinglocalenergyoptions.Withanumberofnewsafetyfeaturesthatarguablymorecountries,whichcouldnegativelyimpactsafety,thiscaveat,wefindthatthetotaloveralladditionalSMRscouldeventuallymakeanimportantcontri-wastemanagement,andproliferationrisk.costsfromnuclear,asaconsequenceofenergybution,inparticulartothedecarbonizationofhard-security,isaround13%peryear.to-abatesectors,includingshippingandaviation,throughdedicatedpoweringofproductionoflow-carbonhydrogen,ammonia,ande-fuels,and77CONTENTSDEMANDELECTRICITYRENEWABLESFOSSILFUELSFINANCEPOLICYEMISSIONSREGIONSAPPENDIXDNVEnergyTransitionOutlook20233.5BIOENERGYarelikelytoundergorigorousscrutinybeforebeingenergysupplyisexpectedtoseeamarginalincrease,deemedsustainableandcarbonneutralforuse.Asreachingapproximately11%by2050,comparedtoCurrently,bioenergystandsastheforemostrenewableenergysourceandisakeyoptiontheinfrastructureforthenextgenerationofbiofuelsthecurrent10%.Theutilizationofbioenergyintheformeetingenergydemandsthroughto2050,particularlyinsectorsthatposechallengesisdevelopedduringthetransitionperiodupto2030,transportsectorisexpectedtoexperiencesignif-forelectrification.thoseproducedfromunsustainablesourceslikeenergyicantgrowth,primarilyintheformofliquidbiofuels,cropsmaystillplayasignificantroleinthebiomasswithgaseousbiofuelsplayingaminorroleinthisBioenergyisderivedfromvariousbiomasssources,Isitcarbonneutral?sector.Evenso,ongoingdebatessurroundingthesector.Thisgrowthisprojectedtobesubstantial,encompassingorganicwaste,agriculturalandlive-Thecombustionofbiomass,whichincludesbiofuels,trade-offbetweenfoodandfuelproductionwilllikelydoublingbetween2022and2050,makingbioenergystockresidues,forestwood,andenergycrops.Theistypicallyconsideredcarbonneutral,meaningthatprioritizetheuseofbiomassthatwouldnototherwiseacrucialenergysourcefordecarbonizingtransportapplicationsofbioenergyareasdiverseasitsorigins.nocarbonemissionsarecounted.Thisalignswiththebeutilizedforfeedingtheglobalpopulation.andaccountingfora10%shareoftransportenergyForinstance,solidbiofuelslikewoodorcharcoalareassumptionsmadebytheIntergovernmentalPanelconsumption.Thisexpansionwillbeprimarilydrivenusedforheatingbuildings,cooking,andincombinedonClimateChange(IPCC)thatthecarbonpresentThetemporalperspectiveofbiomassemissionsisabydecarbonizationpolicies,includingmandatesandheatandpowerplants.Woodchipsareincreasinglyinbiomassisultimatelyreabsorbedfromtheatmos-crucialconcern.Inourprojections,potentialadditionalcarbonpricing,andconsumer-push,coupledwithbeingintegratedintocoal-firedpowerplantstocurtailpherethroughphotosynthesis,assumingthattheemissionsstemmingfromactivitieslikedeforestationthelimitedavailabilityofalternatives,particularlyinemissions.Oneofthemostoutstandingexamplesofplantsburnedarereplacedwithnewones.However,tocreatespaceforcropsintendedforliquidbiofuelaviationandmaritimetransport,whereelectrifiedthisuseisDraxPowerStation,locatedinYorkshire,theputativecarbonneutralityofbiofuelsisheavilyproductionareaccountedforwithinthecategorypropulsiontechnologiesarelessfeasible.theUK,whichhasundergoneatransformationdebatedamongmanyscientists,primarilyduetotheofagriculture,forestry,andotherland-use(AFOLU)towardsfullbiomassutilization.However,questionsdisparityinthetimingofCO2reabsorptionbynewemissions.Emissionsassociatedwiththetransportof78remainabouttheactualcarbonreductionsachieved,plantgrowth,whichisconsiderablyslowercomparedbiomassarecategorizedunderthetransportsector.especiallybecauseofsourcingbiomassfromfarawaywiththerapidreleaseofCO2duringcombustion.Nonetheless,theprevailingviewpointisthatbiomass,placessuchasCanada.Moreover,therearesignificantconcernsassociatedandconsequentlybiofuels,remaincarbonneutralwithdirectandindirectlandusechanges–convertingoveranextendedperiod.Additionally,biomass-basedInthegaseousform,bioenergy,includingbiogasnaturalvegetationtogrowbiofuelfeedstockstypi-valuechainshavethepotentialtobecarbonnegative,generatedfromwaste,isutilizedforpowergener-callyreleasesalargeamountofcarbonfromsoilandsuchaswhenorganicwasteisutilizedasafeed-ation,asafuelsource,and,whenfurtherrefined,asplantbiomass,creatinga‘carbondebt’thatcantakestockforenergyproductionratherthanbeinglefttobiomethane.Biomethane,inparticular,hasgarneredyearstorepay(RoyalAcademyofEngineering,2017).decomposeandproducemethaneemissions.significantattentionduetoescalatingnaturalgasOtherconcernsrelatetoemissionsfromagriculturalpricesandgrowingconcernsaboutdomesticenergyequipmentandfertilizers.Forecastsecurity.Additionally,liquidfuelsproducedfromTheglobaldemandforbioenergyderivedfromcrops,algae,orgeneticallymodifiedorganismsholdLookingahead,thesourcesofbiomassforbiofuelsbiomasshasnearlydoubledsince1980.Figure3.16promiseforhard-to-decarbonizetransportationareexpectedtogravitatetowardsresiduesandillustratesthattheuseofbiomassforenergypurposessectorssuchasaviationandmaritime.biowaste.Secondandthird-generationbiofuelswillcontinuetogrowtomid-century.Theprimarydriversofthisgrowthwillbetransportandmanufac-turing.TheoverallcontributionofbiomasstoprimaryCONTENTSDEMANDELECTRICITYRENEWABLESFOSSILFUELSFINANCEPOLICYEMISSIONSREGIONSAPPENDIXDNVEnergyTransitionOutlook2023Currently,almostallbioenergyuseinthetransporttransportbymid-century,withthelargestportionandNorthAfricaisrelativelylow.Meanwhile,Northmodernbiofuelswillfindapplications,forinstance,sectoroccursinroadtransport(99.5%),primarilyin(47%)beingusedinaviation.AmericaandEuropeareprojectedtoexperienceainaviationandmaritimesectors.Incertainregions,theformofblendswithgasolineanddiesel,withaslightdeclineinbioenergyuse.traditionalbiomasscurrentlyservesasthedominantminimalamountingaseousformslikebiomethane.Inthebuildingssector,theuseofbioenergyisantici-energysourceforresidentialbuildings.WhilethisHowever,thislandscapeisanticipatedtoshiftbypatedtodecreasebyabout20%by2050.ThisdeclineOvertheforecastperiod,Sub-SaharanAfricaisdirectusageisexpectedtoevolve,itwillremaina2050.Aviationandmaritimetransportareexpectedcanbeattributedprimarilytoreducedrelianceonpoisedtomaintainitspositionasthelargestglobalsubstantialenergysourceinselectedregions.toincreasinglyadoptbiofuelstodiversifytheirfueltraditionalbiomassinlow-incomeregionsforspaceconsumerofbiomass,maintainingastableshareofsourcesandpromotedecarbonization.By2050,roadheatingandcookingfuel.Nonetheless,bioenergywill27%worldwide.Furthermore,theoveralldemandTheoveralldemandforbiomassisexpectedtransportisprojectedtowitnessa60%reductioncontinuetoplayaprominentroleintheenergymixforforbiomassisexpectedtorise,andtheglobaltorise,andtheglobalcompositionofinitscurrentbioenergydemandshare,drivenbybuildings,withapproximatelyone-thirdofbioenergycompositionofbiomassutilizationwillundergoabiomassutilizationwillundergoasignificantongoingelectrificationeffortsandreduceddemandstillbeingutilizedinthissectorby2050,comparedtosignificanttransformation.Thistransformationwilltransformation.forblendedfossilfuels.Thistrendisfurthersupported50%in2022.entailashiftawayfromtraditionalformsofbiomass,byintensifiedcompetitionforbiomasssourcingsuchaswoodorcharcoalthatarecommonlyusedfromothertransportsubsectors.MaritimetransportPowerstationsarepoisedtoincreasetheirconsump-foractivitieslikecooking,towardsagreaterrelianceisexpectedtoaccountfor32%ofbiofueluseintionofbioenergyby30%between2022and2050,onmodernbiofuelsderivedfromwaste.Theseelevatingpowergenerationtotakingupathirdofbiomassbymid-century.In2022,manufacturingFIGURE3.18accountedfor17%ofglobalbioenergyconsumption,Biomassusetodayandthisshareisexpectedtogrowbysomeadditional3%duringtheforecastperiod,reachingslightlyaboveUnits:Bntonnes/yr20%in2050.WoodEnergyBio-materialsLossesRegionalTrendsFigure3.17indicatesthattheregionaldistributionCropresiduesGrazed/burnFeedBeddingofdemandisforecastedtoundergoonlygradualchangesthroughouttheforecastperiodformostCropsFoodandfeedBiofuelsLossesregions.However,certainregionsareexpectedtoexperiencesubstantialincreasesintheirutilization0123456ofbioenergy,notablytheMiddleEastandNorthAfricawitharemarkablemorethandoubling,GreaterChina(+90%),SouthEastAsia(+35%),andtheIndianSubcontinent(+80%).Itisworthnotingthatwhilethesepercentagesrepresentsignificantgrowth,thestartingpointforbioenergyuseintheMiddleEast79CONTENTSDEMANDELECTRICITYRENEWABLESFOSSILFUELSFINANCEPOLICYEMISSIONSREGIONSAPPENDIXDNVEnergyTransitionOutlook2023Howmuchbioenergyisavailable,andforwhichindustries?Biofuelsstandasoneofalimitednumberofoptionsimproveinput-dataappliedinDNVtoolsandmodelsFIGURE3.19fordecarbonizingaviationandthedeep-seaportion(e.g.GHGPathwaymodel,FuelPriceMapper,ETO),Totalsustainableandeconomicalbiomasspotentialbyfeedstockcategoryoftheworldfleet.Today,themaincategoriesofathoroughassessmentonthesustainablepotentialUnits:EJ/yrbiomassbeingutilizedarewood,cropresidues,andofbiofuelsupto2050hasbeendone.Weestimatecrops.BiomassisusedprimarilyforfoodandfeedthattheexploitablebiomasspotentialtodayliesMinimum(crops)orenergy(wood),asdepictedinFigure3.17.between32EJand38EJ.Inthefuture,thiscouldOnlyafraction(4%)isusedfortheproductionofgrowtobetween42EJand106EJ(seeFigure3.18).202012843311132biofuels.InordertoexpandbiofuelproductionintheThereasonforthewiderangeinpotentialisduetofuturetomeetdecarbonizationobjectives,weneedtothediverseinformationfoundinliterature(e.g.on2050131083321138makesurethatthisdoesnotcompromisethecurrentthedrymattercontentofstraw),leadingtoawidesystemofbiomassusage.Asaresult,expandedsetofresults.TheseestimatesareinlinewiththeEUMaximumbiofuelproductionmustbebasedonsustainableREDIIdirectiveofsustainablebiofuelsasaguideline,biomasssourcessuchasagriculturalby-products,assuchexclude,forexample,conversionofland202012844361142residuesofforestryandwoodindustries,municipaltoaccommodateproductionofagriculturalrawwaste,andindustrialresidues.Incorporatingsustain-materialforbiofuels.20501813101044721106abilityasafactorinthepotentialassessmentishighly80important.Moreover,non-sustainableuseofbiomassWeassumethataverylowshareoftheexploitableAgriby-productsIndustrialwasteEnergycropsnon-foodLivestockexcretionscoulderodetheemissionreductionpotentialofpotentialforbiomassistappedtoday,duetothefactSequentialcroppingForestresiduesBiowasteWastewaterbioenergy.thatproductionofbiofuelsfromsustainablebiomasssourcesisitselflow.AssumingthatallfutureexpansionAsthequestionaboutthefutureavailabilityofofsustainablebiomassusage(e.g.inmaritimeandbiomassisapressingoneandhasbeenwidelyrecog-aviation)willhavetocomefromexploitableandnized,therearenumerousstudiesavailabledepictingsustainablesources,weseeastrongincreaseintheirviewonavailabilityofsustainablebiomass.demandtowards2050.WeseethatthegapbetweenHowever,somearenotverytransparentregardingexploitablepotentialanddemandforbiomasstheirassumptions,justcoveracertaingeography,orbecomesnarrowerandnarrowerastimepasses,withshowalargebandwidthofresults.Therefore,andinsomeoverlapstartingfromabout2035.WeprovideordertostrengthenDNV'scompetenceonthesubjectmoreinformationaboutthisquitecomplextopicinourofbiofuelsinshippingandotherindustries,andrecentwhitepaperBiofuelsinshipping(DNV,2023d).CONTENTSDEMANDELECTRICITYRENEWABLESFOSSILFUELSFINANCEPOLICYEMISSIONSREGIONSAPPENDIXDNVEnergyTransitionOutlook20233.6OTHERENERGYGeothermalenergyinIcelandOtherrenewableenergysourcesarelikelytoremainmarginalonaglobalscalebetweenogiessuchasenhancedorengineeredgeothermalnowand2050.Forexample,solarthermalandgeothermalcombinedwillprovidearoundsystems,advancedgeothermalsystems,andsuper-1%ofworldprimaryenergybymid-centuryandconcentratingsolarpower(CSP)evenless.criticalgeothermalsystems.SomesynergiesmayexistbetweenthetechnologiesusedfortheextractionInthisOutlook,‘solarthermal’referstoheatthelargestCSPinstallationtodayistheNoorPowerofoilandgasandgeothermaltechnology,andpowerstations,withtheexceptionofGreaterChina,generatedinsolarwaterheaters.Globally,primaryStationinMorocco.ThoughLCOEsarestartingtosomeoilandgascompanieshaveshowninterestinwherethedemandcomesmostlyfrombuildings.energysupplyfromsolarthermalenergywillstartbecomelowenoughtobecompetitivewithotherexploringgeothermalenergy.ThelargestbarriersSouthEastAsiaandOECDPacificwillleadtheworlddecliningfrom1.24EJin2020to0.46EJin2050.renewabletechnologies,wedonotseethistech-tothewidescaleimplementationofgeothermalareingeothermalenergyin2050withitmakingupOver82%ofthisenergyheatsbuildingsandwillnologyreachingalarge-scalebuild-outduringthethehighupfrontcapitalexpenditures,longprojectaround3%oftheseregions’energymix.AlthoughmainlybeinuseinChina.Thisregionwillalsobeforecastperiod.developmenttimelinesandhigherrisksduringinitialgeothermalenergyhasthetechnologicalpotentialtoresponsibleformostofthedeclineinsolarthermalasphasesofexploration,allofwhichleadtochallengesgrowinsomeapplications,highcostsinmostoftheheatingwaterfromelectricitytakesover.Section1.3Geothermaltechnologyextractstheheatfoundunderinfinancingprojects.worldwilllimititsexpansion.discussesinmoredetailhowbuildingsuseenergyforthesurfaceoftheearth,andusesthiseitherdirectlyAsof2022,geothermalenergyprovided3.72EJheatingwater.forheatingandcooling,orconvertsitintoelectricity.(0.62%)oftheworld’sprimaryenergysupply,andAsof2022,geothermalenergyprovidedForelectricitygeneration,hightemperatureresourcesby2050thiswillriseto6.13EJ(0.93%).Worldwide,3.72EJ(0.62%)oftheworld’sprimaryCSP,thoughnotmodelled,isanothertechnologyareneeded—aminimumof150°C—whileforgeothermalenergyisoverwhelminglyusedbyenergysupply,andby2050thiswillrisewhichisnotyetlarge-scale.Thistechnologyconcen-heatingandcoolinglowertemperaturescanbeusedto6.13EJ(0.93%).tratesalargeareaofsunlightontoareceiver,gener-(90–150°C).Thesehightemperatureresourceslimitatingbothheatandelectricity.Whilethisimprovestheareaswheregeothermalenergycanbeproduced81theefficiencyofpowergeneration,itaddsadditionalforelectricitytotectonicallyactiveregionswheremanufacturingcomplexityandcost.Thiscomplexitywaterorsteamisclosetothesurface,andmanyofthehashinderedtheroll-outofCSPtechnology,andbestplacestoimplementthistechnologyhavebeenwellpublicizedfailuressuchasattheCrescentDunesused.facilityintheUShaveerodedfaithinit.TwotypesofCSPplantsexist,eitherparabolictroughpowerGeothermalenergyprovidesastablesourceofplantsormolten-salttower/centralreceiverpowerenergywithhighcapacityfactorsandisseenasaplants,withbothtechnologiesstillneedingtomature.renewabletechnologywhichcouldprovideastableChinacurrentlyleadsthewayinCSPinstallations,sourceofenergy,incontrasttovariablesolarandannouncingnewinstallationsin2022and2023whichwindpower.Thetechnologyforhightemperaturewillbringthecountry’scapacityto3GW.Spainalsogeothermalenergyisreasonablymature,soforfuturehasamodestamountofCSP(around2.3GW),thoughinnovationtheindustrynowlookstonoveltechnol-CONTENTSDEMANDELECTRICITYRENEWABLESFOSSILFUELSFINANCEPOLICYEMISSIONSREGIONSAPPENDIXDNVEnergyTransitionOutlook2023Scientistscheckinglargepulsedpowermachinewhichcosts.ThereisalsoconcernabouttheenvironmentalNuclearfusionisasimilarcase.Forseveraldecades,createsnuclearfusioninnuclearfusionresearchfacility.impactofthesestructures,includingnoise,riskofnuclear-fusiontechnologieshavebeendiscussedcollisionwithmarineanimals,andchangestotheflowasacarbon-freesourceofenergy.Severalprom-Potentialfutureenergysourcestidalbarrageenergy,tidalstreamenergy,waveandwaterquality.isingresearchprojectsfocusingonsmallerfusionAsstatedintheintroduction,webaseourforecastenergy,oceanthermalenergyconversion(OTEC),systemsarecurrentlybeingpiloted.Advancesinoncontinueddevelopmentofproventechnologies,andmarinecurrentpower.Ofthesefour,thefirstInDecember2022,anuclearfusionreactioncomputingpower,materialsscience,andmanufac-includingadvancesinthesetechnologies.Suchthreearethemosthighlydevelopedtoday,withaproduced,forthefirsttime,moreenergyturing,togetherwiththerisingavailabilityofventureimprovements,liketechnologicaldevelopments2020installedcapacityof521MWtidalbarrage,10.6thanittooktodrivethereaction.capital,haveenabledrecentprogressinfusioninsolarPVandwind,arealreadyincludedintheirMWtidalstream,and2.31MWwavepowergener-technology.Oncethedomainofgovernmentalrespectivesections.ationcapacity(IRENA,2020).TheLCOEsoftheseDespiteallthat,planshavebeenmadefornewtidalresearchlabs,privatecompaniesarenowbringingtechnologies,andtheinvestmentcosts,aredecliningstreaminstallations,thelargestbeingthefour-phaseexpertiseinotherareas,andstrongercommercialTechnologiesthatarenotyetproven,andmarginalbutremainhigherthanforotherformsofrenewableMeyGenprojectinScotland.Situatedbetweenthefocus,astheyseektorealizethepotentialofthistechnologiesthatarenotexpectedtoscale,arenotenergy.Otherbarrierstotheirlarge-scaleimplemen-ScottishmainlandandtheIslandofStroma,thesitetechnology(seedetailsinourTechnologyProgressincludedinourforecast.Oceanenergyisoneofthem.tationarelimitedsuitablelocations,oftenfarfromanhasidealdepth,waterflows,andproximitytotheReport,DNV2021a).InDecember2022,anuclearThereareseveraltypesofoceanenergy,includingexistinggrid,withaccordinglyhighgrid-connectionmainland.Phaseone,comprisingoffour1.5-MWfusionreactionproduced,forthefirsttime,moreturbines,hasbeenoperationalsinceMarch2018andenergythanittooktodrivethereaction.Theavail-hasgenerated51GWhasofMarch2023.Thereareabilityoffuel—primarilydeuterium—isalmostproposalsforothertidalprojectsintheUKinEastlimitless,buttherearelargeuncertaintiesaboutifAngliaandontheriverMersey,andtheEUcurrentlyandwhensuccessfuloperationofnuclearfusionwillhas17majorprojectsinprogress,withover160MWoccur.Evenwithabreakthrough,therewillstillbeofcapacity.Inthefuture,itlookslikeoceanenergyasignificantdelaybeforeenergyonascalecompa-technologieswillbesuitedtonichemarkets—forrabletootherpowersourceswillbeprovided.example,smallislanddevelopingstateswhereitTherefore,weconfineourforecasttotraditionalwouldbemorecostlytoimportenergy—orcoupledfissiontechnologies.toanotheroperationtoprovideitwithpower,suchasoilandgasplatformsoraquacultureoperations.InDuringtheperiodcoveredbythisOutlook,oneorothercases,oceanenergycouldbeuseddirectly(i.e.moreoftheemergingenergytechnologiesmaynotfirstconvertedtoelectricity),toavoidadditionalachieveabreakthrough,suchthattheybecomecostcostandcomponentry,forexampleforwave-poweredcompetitive.However,tohaveasignificantimpactdesalination(Garanovic,2022).onourforecast,theywouldneedtogrowmuchfasterthanincumbentrenewabletechnologies.Wedonotseethishappeningatscaleandhavethereforeexcludedemergingtechnologiesfromtheforecast.82CONTENTSDEMANDELECTRICITYRENEWABLESFOSSILFUELSFINANCEPOLICYEMISSIONSREGIONSAPPENDIXDNVEnergyTransitionOutlook2023Highlights4FOSSILFUELThischapterchartsthedeclineoffossilfuelsourcesNaturalgaswillsurpassoilastheworld’slargest4Fossilfuel�84fromwhathasbeentermedthe‘beginningoftheprimaryenergysourceinthemid-2030s.However,4.1Coal�85endofthefossilfuelera’intheclosingyearsofthisthereplacementbyrenewablesourcesofgasin4.2Oil�87decade.Firsttostartasteadydeclinewillbecoal,thepowermixisthemainreasonbehindnatural4.3Naturalgas�91despitethecurrentresurgenceincoaluselinkedgasusagepeakinginthemid-2030sandthengrad-4.4Summarizingenergysupply�94totheenergysupplyshockssetintrainbyRussia’suallydecliningin2050toalevelonlyslightlyhigherinvasionofUkraine.Foroil,itismainlytheelectrifi-thantoday’susage.LNGandpipelinetransportwill83cationofroadtransportthattipsdemandfromitsincreaseevenwhenglobalgasdemanddoesnot,steadyriseinrecentyearstowardsasteadydeclineduetoashiftindemandpatternstoregionswithfrom2027onwards.Oil’scurrent29%shareoflittlepipelineimports.primaryenergysupplywillebbawaytoreach17%ofprimaryenergyby2050.CONTENTSDEMANDELECTRICITYRENEWABLESFOSSILFUELSFINANCEPOLICYEMISSIONSREGIONSAPPENDIXDNVEnergyTransitionOutlook20234FOSSILFUELFossilfuelcurrentlycovers80%ofglobalprimaryenergysupply.Thissharehasbeenstableforseveraldecadesbutissetfordramaticchangeastheuptakeofrenewableenergysourcesisgrowingrapidly.Weforecastthat,beforetheendofthisdecade,thefossilsliceofthepiewillstartshrinkingbymorethanonepercentagepointperyeartobelessthanhalf(48%)oftheprimaryenergymixbymid-century.Overthecomingdecades,wewillseeagradualenergysupplymixthroughoutourforecastperiod.phase-down,firstofcoal,whichhasthehighestEventhoughrenewablesarealreadycompetitiveincarbonfootprint,andthereafteroil.Gaswillcomemostplaceswithfossil-firedelectricity,itwilltakelater,anditmaintainsahighshareoftheprimarymanyyearsforlow-andzero-carbonenergysourcestodislodgefossilfuelsfromthebroaderenergysystem.Nevertheless,wehavebeenclearandcontinuelongerthanburningitforenergy,andtheIfyousubtractthenon-energyuseofhydro-consistentinourEnergyTransitionOutlooksovernon-energyshareoffossil-fuelusewillgrowoverthecarbons,theshareoffossilfuelintheenergytheyearsthatdemandforfossilenergy–coal,oil,forecastperiod.Ifwesubtractwhatisusedforfeed-mixwillreduceto45%insteadof48%in2050.andgascombined–willbeginaninexorabledeclinestock,theshareoffossilfuelintheenergymixwillbeforetheendofthisdecade.Forthefirsttimethisreduceto45%insteadof48%in2050.Section1.484year,theIEAconcurswithourview,andhasbeguntodescribesfeedstockinmoredetail.statethattheworldisatthe“beginningoftheend”ofthefossil-fuelera(Birol,2023).Figure4.1illustratesourforecastforhowthecompositionoffossilenergysources,andthenon-fossilshare,willchangeby2050.Today,14%oftheworld'soil,10%ofthegas,and1%ofthecoalisnotusedforenergypurposes,butasfeedstockinplastics,petrochemicals,asphalt,andsimilarproducts.Thisfossilfuelisnotburnedanddoesnotcausedirectemissions.Theuseoffossilfuelforthesenon-energypurposeswillCONTENTSDEMANDELECTRICITYRENEWABLESFOSSILFUELSFINANCEPOLICYEMISSIONSREGIONSAPPENDIXDNVEnergyTransitionOutlook20234.1COALelectricitywillfacilitateagradualreductionincoaluseformostindustrialheatingneeds.Annualglobalcoaldemandexperiencedarapidsurgefrom4.7Gtin2000toitspinnacleForhigher-temperatureprocesseslikecement,iron,at8Gtin2014;sincethenitsusehasfallensteadily.Theeconomicandtradecontractionsandsteelproduction,transitioningawayfromcoalresultingfromtheCOVID-19pandemiccauseda7%reductionincoaldemandin2020.willbemorechallenging.DespiteitssubstantialAlthoughcoalwillrecovertosomeextent,itwillneverreclaimitspreviouspeak,insteadcarbonemissions,coalwillremainapreferreddwindlingtonearlyonethirdfromitspresentlevelby2050.choice,butitsusewillbechallengedbytechno-logicaladvancesandhydrogen.Intheshortterm,ThewarinUkrainehastriggeredaresurgenceindroughtsandtheunprecedentedsummerheatwavescoaldemandforhigh-heatprocesseswillslightlycoal-basedpowerproductioninseveralpartsofthein2022and2023.Theseresultedinheightenedincreasebeforedecliningrapidlyafter2030.Inironworld,butmainlyinEurope.Whilepolicymakersworkdemandforairconditioningandplacedstressonandsteelmaking,globalcoaldemandisexpectedtotoachieveastructurallylowergasconsumption,somethepowergridatatimewhendepletedriverlevels,dropbynearlyafifthby2050.countriesmayreactivatepreviouslyclosedorplaced-includingincertainsegmentsoftheYangtzeRiver,on-reservecoalplantsinEurope.ledtoreducedhydropowergeneration.Inaddition,85soaringpricesforliquefiednaturalgasduetotheSuchreactivationhashithertobeenrelativelylimitedconflictinUkrainehavegivenfurtherimpetustoinmostEuropeancountriesbuthasbeensubstantialChina'suseofcoalforenergysecurityreasons.inGermanywithapproximately10GWofcoalcapacitycomingbackonline.WeexpectEuropetoCoalhashistoricallyservedasaneconomicalandmaintaintheseelevatedlevelsofcoal-firedpowerreliablesourceofpower,makingitthepreferredgenerationforthecomingyears.technologyforelectricitygenerationinnumerouscountries.PowergenerationconsequentlyemergedAtthesametime,Chinagrantedapprovalforaastheprimarycatalystforcoaldemand,accountinggreaternumberofcoalpowerplantsinthepastfornearlytwo-thirds(63%)ofcoalconsumptioninyearthaninthepastseven.Forperspective,this2022(Figure4.2).Besidespowerproduction,coalequatestoapproximatelytwonewcoalpowerplantsisacrucialheatsourceinmanufacturingandservesreceivingthegreenlighteveryweek.Thisnote-asacarbonfeedstockforreducingironoreinsteelworthydevelopmentcomesdespitetheglobaltrendproduction.However,inlow-heatmanufacturingofmanycountriesmovingawayfromusingcoal.processes,coalwillgraduallybereplacedbyelectricity,especiallytoaddresslocalpollutionissues,asseenThesurgeinapprovalsfornewcoalpowerplantsinChina'stransitionfromcoaltogasforindustrialappearstobeareactiontotwokeyfactors:recurringapplications.Inotherglobalregions,gasboilersandCONTENTSDEMANDELECTRICITYRENEWABLESFOSSILFUELSFINANCEPOLICYEMISSIONSREGIONSAPPENDIXDNVEnergyTransitionOutlook2023GreaterChina,currentlythelargestcoalconsumer,ishingthecompetitivepositionoffossilfuels,particu-isalsothelargestimporter.However,thegradualandenhanceself-sufficiency,theIndianSubcontinentwillwillwitnessa70%reductionincoaluse,primarilylarlycoal.Consequently,newcapacityadditionswilllong-termphase-downofcoal-firedpowerplantsinreduceitsrelianceonimportedcoal.Majorcoal-ex-duetodecliningsteelproduction(down65%).Indwindle,retirementswillrise,andcapacityutilizationChinaandreducedcoaluseinmanufacturingwillportingcountrieslikeAustralia,Indonesia,Russia,contrast,theIndianSubcontinentwillseeadoublingwilldecrease.Thispatternalignswiththecoal'deathprogressivelydiminishitscoaldemand,withimportsandSouthAfricawillcontinueasexporters,butwithofcoaldemandforironandsteel,nearlymatchingspiral'feedbackloop:ascoalplantutilizationdeclines,remaininghighuntilaround2040beforedecliningdecreasingexportvolumesthroughouttheforecastGreaterChina'sdemandbymid-century.itscostincreases,furthererodingitscompetitiveness,significantlytowards2050.DrivenbyIndia'seffortstoperiod.makingcoal-generatedpowerlesseconomicallyCoalconsumptionhassignificantlydecreasedinviable,andsubsequentlyreducingitsuse.86NorthAmericaandEurope,primarilyduetoshiftstonaturalgasandrenewablesinthepowersector.MostbrowncoalandasubstantialportionofhardInNorthAmerica,thedeclinehasbeenattributedcoalareconsumedwithintheirrespectiveregionsmainlytolowgasprices,butisnowbeginningtoofproduction.OnlyfourofourtenregionsarenetfollowEurope,wherethegrowthofrenewablesisimportersofcoal:Europe,GreaterChina,theIndianplayingacentralrole.Bymid-century,coalusageSubcontinent,andtheMiddleEastandNorthAfrica.inOECDregions,notablyNorthAmericaandChina,thelargestproducerandconsumerofcoal,Europe,willhavedeclinedbyapproximately90%and80%,respectively.Evencoal-richOECDPacificregionswillwitnessasubstantial75%declineincoalconsumption.Inthedecadeleadingupto2020,onlytheIndianSubcontinent(witha45%increase)andSouthEastAsia(witha90%increase)haveseenconsistentgrowthincoaluse.Nevertheless,allregionsareprojectedtoexperiencealong-termreductionincoalconsumption,thoughshort-termtrendsmayvary.Asdescribedabove,coalwillfacecompetitionfromnaturalgasandrenewablesinOECDcountriesintheshorttermbutwillseeexpansioninmanydevelopingnations.Beyond2030,stricteremissionsregulations,increasedcompetitionfromrenewables,andadvance-mentsinenergystorageandflexibilitytechnologieswillenhancethedispatchabilityofrenewables,dimin-CONTENTSDEMANDELECTRICITYRENEWABLESFOSSILFUELSFINANCEPOLICYEMISSIONSREGIONSAPPENDIXDNVEnergyTransitionOutlook20234.2OILforafewyears.Thereafter,theshifttowardbiofuel,Mb/d)todayto26EJ/yr(11.5Mb/d)by2035,thenslowlygreenammonia,e-kerosene,andotherlow-carbondeclineto22EJ/yr(10Mb/d)by2050,duemainlytoaOilhaslongbeenthelargestcontributortotheenergysupplysincesurpassingcoalinfuelswillreducethisoildemandby30%from23.4EJdecreaseinplasticsproductioncausedbydemand-side1964.Theshareofoilintheprimaryenergysupplyhasbeenaround29%overthelastin2022to15.5EJin2050.Detailedinformationandreductionandsubstitutionmeasuresaswellashigherdecadeandwillremainsountil2027whenitwillstartdecliningto17%in2050.analysisfortransportfuelsareinSection1.1.ratesofrecycling(seeSection1.5formoredetails).Thethirdlargestsectorintermsofoiluseismanufac-Sectoraldemanddeclinesto61%towardstheendofourforecastperiod.Oil’ssecondlargestsectoraldemandisasfeedstockforturing,whichwillcontinuetodemandaround11EJforDrivenbytheever-increasingdemandfortransport,Electrificationofpassengervehicleswillhappensoonernon-energyusesuchasinthepetrochemicalindustries,thenextdecadebeforeitdeclinesto9EJ,thoughitsduetopopulationandeconomicgrowth,thedemandthanforcommercialtrucksandvans.Passengerandincludingplasticsproduction.Theshareofnon-energyinshareofoildemandwillrisefrom7%to9%by2050,foroilhasbeensteadilyrisingbyabout1%peryearforcommercialvehicleoildemandwilldecline58%andoildemand,whichdoesnotentailanydirectCO2emis-reflectingthedeclineinoildemandinothersectors.decadesdespitetemporarydipslikethosein2008and33%,respectively,overthenextthreedecades.Oilsions,hasbeenaround13%forthelasttwodecades.Oiloritsproductsarealsousedinbuildings,power,2020.Lastyear(2022),globalcrudeoildemandalmostuseinaviation,shipping,andrailtransport(collectivelyWithdecliningoiluseformostenergypurposes,the‘other’sectors,andforproducingtheoilitself.Never-reacheditspre-pandemic(2019)levelof83.3Mb/dtermed‘othertransport’inFigure4.4)willinitiallygrowshareofnon-energyuseinoildemandrisesfrom14%theless,theseusesaresmall(lessthan10%oftotaloil(161EJ).DespiteEVsalesgainingmomentumandthetodayto22%In2050.Inabsoluteterms,oildemandfordemand)andremainsothroughoutourforecastperiod.ongoingbuild-outofnon-fossilelectricitygenerationnon-energyusewillincreasefromaround22EJ/yr(10capacity,globaloildemandisexpectedtoincreaseby87between3%and4%overthenextthreeyearsbeforelevellingoffandthenstartingtodeclinebefore2030.In2050,weexpectdemandof52Mb/d,40%lessthanin2025.Aselectrificationinroadtransportaccelerates,thedeclinebetween2035and2050isalmosttwicethatseenovertheperiodfrom2025to2035.Figure4.4showshistoricalandprojecteddevelopmentsinglobaloildemandbysectorfrom1990to2050.Oildemandfromthetransportsectorin2022was108EJ,stilllessthanin2019(10EJ)pre-COVID,becauseoftheeconomicslowdowninhigh-incomecoun-triesdirectlyimpactingfuelconsumption.Oil’sshareofenergydemandintransporthasbeenaroundtwo-thirds(70%)since2017(exceptin2020),butwithEVsdominatingnewvehiclesalesfromtheearly2030CONTENTSDEMANDELECTRICITYRENEWABLESFOSSILFUELSFINANCEPOLICYEMISSIONSREGIONSAPPENDIXDNVEnergyTransitionOutlook2023RegionaloildemandSubcontinentwillemergeasthetopthreeregionsTABLE4.1Figure4.5showstheyearofpeakoildemand(andforoildemand.ThebottomthreewillbeSub-Crudeoildemandgrowthrateperregionproduction)varyingsignificantlybyregion.High-SaharanAfrica,OECDPacific,andEurope.Tableincomeregionspeakearly,low-incomeregionseither4.1comparesforecastgrowthratesforcrudeoilYear/RegionCHNEURINDLAMMEANAMNEEOPASEASSAlaterornotwithintheforecastperiodatall.Muchlikedemandineachregionupto2050.thebroaderenergydemandtrend,globaloildemand2022to20306%(-12%)49%0%8%(-17%)(-7%)(-13%)27%16%isshiftingeastwardandsouthward.Formanydecades,AlthoughNorthAmerica’soildemandwillreduceNorthAmericahadthehighestabsolutelevelofoildrasticallyduetoEVgrowth,itsdemandpercapita2030to2040(-19%)(-31%)10%(-2%)(-1%)(-37%)(-11%)(-31%)5%27%demand.However,theregion’sprojectedescalationofisprojectedtoremainthehighestforthenextelectrificationinroadtransportoverthenextfewyearstwodecades.By2050,NorthEastEurasiahasthe2040to2050(-30%)(-34%)(-8%)(-18%)(-17%)(-45%)(-11%)(-45%)0%14%(seeFigure1.4inChapter1)willseeGreaterChina,highestoildemandpercapitafollowedbythewithmanufacturingasitslargestsector,surpassNorthMiddleEastandNorthAfricaandNorthAmerica.America'soildemandafter2026.Figure4.6comparesregionaloildemandpercapitaintheperiod2010to2050.Sub-SaharanAfricawillOurforecastshowsthatby2050,theMiddleEastmaintainamuchloweroildemandpercapitathanandNorthAfrica,GreaterChina,andtheIndiantheotherregionsthroughouttheforecastperiod.88CONTENTSDEMANDELECTRICITYRENEWABLESFOSSILFUELSFINANCEPOLICYEMISSIONSREGIONSAPPENDIXDNVEnergyTransitionOutlook2023OilproductionandtradeTheshareofconventionalonshoreoilincreasesfromregions.AlthoughglobaloilproductionwillalwaysstatuseventhoughtheimportvolumeforGreaterIn2022,crudeoilproductionwas8%higherthaninaround52%todaytoabout58%by2050,whiletheequaldemandovertime,sincestorageislimited,China,Europe,andOECDPacificwilldecreaseby2021.MostofthisincreaseoccurredintheMiddleEast,shareofoffshoreproductiondeclinesslightlyfromregionaldistributionmightnotfollowthesame30%,50%,and70%,respectively.TheIndianSubcon-NorthAmericaand,despitesanctions,inNorthEastaround32%to27%andtheshareofunconventionaldisciplinedpatternassumedinourmodel.ThetinentandSouthEastAsiaoilimportswillincreaseEurasia.In2022,oilcompaniesearnedrecordprofits,onshoreproductioninitiallyrisesslightlyfrom18%reductioninoildemandwillmakeitlessattractiveforby80%and120%,respectively.NorthAmericahasbenefittingfromthesurgeinoilandgaspricesthatbeforefallingtoaround15%.Naturally,therearetheindustrytoexpandproductionintochallengingbeenanetexporterofoilsince2020astheUSflippedfollowedRussia’sinvasionofUkraine.Globalupstreamlargeregionalvariations,withconventionalonshoreenvironmentssuchasdeepwater,highpressure,and/fromimportertoexporter–CanadahasalwaysbeeninvestmentinoilandgasexplorationandproductionisdominatingintheMiddleEastandNorthEastEurasia,orremotelocationsliketheArctic.anetexporter.LatinAmericawillbeanetoilimporteratitshighestsince2015,growing11%year-on-yeartowhereasinNorthAmericatheleadisnowtakenbybeforetheendofthisdecade.USD528billionin2023.Figure4.5forecaststhatwhileunconventionalonshore.LookingatFigure4.7,theMiddleEastandNorthallregionswillreducecrudeproduction,theMiddleAfricaandNorthEastEurasiaarenetoilexportersand89EastandNorthAfrica’sshare,whichhasbeenaboutItshouldbeaddedthatuncertaintyoverwhereoilwillwillcontinueexportingthroughoutourforecasting35%forthelastthreedecades,willnearlydoubletocomefromishigh.InourETOmodel,oilproductionperiod.GreaterChina,Europe,theIndianSubcon-64%(from30Mb/din2022to33in2050).Theregionequalsdemand,andregionsdonotdeveloptheirtinent,OECDPacific,andSouthEastAsiahavebeenhasthecheapestoil,andthecostofproducingoilisoilresourcesifcheaperoilcanbesuppliedbyothernetoilimportershistorically.Theywillmaintainthisexpectedtobemorecriticalwhendemandreducesandmarketcompetitionistighter.Historyhasshownthatrelianceononeregionproducingwelloverhalftheworld’soilcouldbeconsideredarisk,andOPECandotherpoliciesprioritizinghighpricesaddstotheuncertainty.Thisdynamicisexpectedtoengenderasustainedfocusonenergysecurityinimporterregionswhichislikelytofurtherboostrenewableenergyatregionalandlocallevels.Consequently,thesignifi-canceofoilinthegeopoliticallandscapeislikelytowaneinthecomingdecades.Ourmodelseparatesoffshore,onshoreconven-tional,andonshoreunconventionaloilproduction.Asunconventionalcapacityhasashorteraveragelifetimethanconventional,bothonshoreandoffshoreregionaldistributionsofcapacityadditionsarenotdirectlycomparable.Globally,thedistributionremainsrelativelystableovertheforecastperiod.CONTENTSDEMANDELECTRICITYRENEWABLESFOSSILFUELSFINANCEPOLICYEMISSIONSREGIONSAPPENDIXDNVEnergyTransitionOutlook2023Thankstoshore-basedelectrification,Equinor’sJohanSvedrupfieldhasacarbonintensityofjust0.67kgCO2/boein2022throughelectrifying(flaring,turbines,heaters/coolers),venting,andfugitiveTheGlobalGasFlaringReductionpartnershipesti-moreofitsplatformsversusaweightedaverageforNorthSeaproductionofsome12kgCO2/boe(Kennetet.al.,2022).Imagecourtesyemissionsofnaturalgas(scope1),andtheelectricitymatesthatin2022,gasflaringreleased357MtCO2eq,Equinor/LizetteBertelsen/JonnyEngelsvollusedtoproduceoilandprocessingofnaturalgas88%(315Mt)ofitintheformofCO2andtherest(42andtheirsites(scope2).Notethatscope3,emissionsMt)asmethane.Notethatthereissignificantuncer-CarbonintensityofaccordingtotheUSDepartmentofEnergyOfficeoffromthevaluechain,mainlyfromthecombustionoftaintysurroundingmethaneemissionsfromgasflaring.ScientificandTechnicalInformation,(OSTI),in2015.theoilandgasitselfwhenitisusedinengines,plantsForexample,iftheaverageflareisjustfivepercentageproducingfossilfuelsorsimilar,accountfor80to95%oftotalcarbonemis-pointslessefficientinburningthegasthangenerallyEmissionsinoilandgasoperations(upstream,sionsfromoilandgascompanies.However,reportingassumed,thentheamountofmethanereleasedgloballyCarbonintensity(CI)expressedaskilogramsofmidstream,anddownstream)arecategorized,scope3isnotobligatory,andisnotincludedincarbonwouldbethreetimeshigherthancurrentlyestimated.carbondioxideequivalentperbarrelofoilequiv-measured,andreportedbasedondirect(scope1)andintensitycalculations.alent(kgCO2eq/boe)isameasureofthescope1andindirect(scope2)emissions.Forexample,inupstreamSomecountrieshaveintroducedpoliciestoreducescope2GHGemissionsassociatedwithproducingexplorationandproduction(E&P)activitiesmostAccordingtoIEA,in2021,scope1andscope2GHGflaring.Forexample,Norwegianregulationscrudeoil.Theglobalvolume-weightedCIestimateemissionsareassociatedwithstationarycombustionemissionsfromoilandgasoperations(includingrequiringoperatorstometergasandtaxingflaring-forcrudeoilproductionwas65kgCO2eq/boe,midstreamanddownstream)wereabout5.1relatedCO2emissionshavebeeneffectiveandhaveGtCO2eq,accountingfor15%ofglobalemissions.reducedflaringemissionsbymorethan80%sinceWithinthis,methaneemissionsaccountedfor44%,themid-1990s.Moreover,enhancingefficiencyandflaring5%,andtherestoriginatedfromownenergyadoptingelectrificationstrategies,whererenewableuseduringproduction,crudetransport,refining,electricityreplacesfossil-basedpower,cansubstan-andthetransportationofoilproductsandliquefiedtiallyreduceemissions.Notably,Norwayachievednaturalgas(LNG)(IEA,2023b).thelowestoffshorecarbonintensityonaverage,7kgCO2eq/boe.TheJohanSverdrupfieldoffshoreDependingonthecrude’squalityandonregulationNorwayhadaCIof0.67kgCO2eq/boein2022whereitisproduced,whentheassociatedgasthroughelectrifyingmoreofitsplatforms.producedisnoteconomicallysaleable,itiseitherflared,vented(directlyemittingmethane,whichAsinstitutionalinvestorsandprivateinvestmentfundsisdiscussedinChapter7),orreinjected.Thetoparerequestingcompaniestoevaluateanddisclosenineflaringcountriescontinuetoberesponsiblecarbonemissionsimpactsandclimate-relatedrisksforthevastmajorityofflaring.Venezuela,Algeria,totheirportfolios,itisbecomingimperativeforoilIran,Libya,Iraq,Nigeria,Russia,Mexico,theUS,andgascompaniestodomoreCI-relatedportfolioandChinacollectivelyaccountedfornearlythree-analysis.Severalcompanieshaveannouncedtargetsquarters(74%)offlarevolumesandjustunderhalftoreducetheirscope1and2emissionsusingcarbon(45%)ofglobaloilproduction(WorldBank,2023a).intensityasakeymetrictoindicatetheirperformance.90CONTENTSDEMANDELECTRICITYRENEWABLESFOSSILFUELSFINANCEPOLICYEMISSIONSREGIONSAPPENDIXDNVEnergyTransitionOutlook20234.3NATURALGASincreasingdisplacementinitsmainapplication,Gasdemandforhydrogenproductionwillincreaseshipping,bytheriseofhydrogenderivativessuchfromnegligiblelevelsin2022to2EJin2050.Overthepast50years,theshareofnaturalgasinglobalprimaryenergysupplyhasrisenasammoniaande-fuels.Theshareofnon-energyfrom16%to26%.Ourforecastindicatesthatthistrendwillcontinue,withnaturalgasapplications(largelypetrochemicals)indemandRegionalDemandsurpassingoilastheworld'sleadingenergysourcebythemid-2030s.forgaswillremainstableat10%asdemandforIn2022,globalgasdemandwas4,795billionm3,almostproductsthatusegasasafeedstockremainsatthesameasin2021.InEurope,gasconsumptionfellbyThetransitionfromcoaltogasispropelledprimarilythebuildingssectorwillstayalmostflatatthepresentcurrentlevelsandhydrogenisincreasinglyused.9%duetorecord-highgasprices,energyconservationbylocalenvironmentandclimateconsiderationslevelof37EJ.Manufacturing’sappetiteforgasinOwnuse(demandfromtheoilandgasandenergypolicies(includingindustrialproductioncurtailmentthatfavourthelowercarbonintensityofgasandits2050willincreasefrom27EJtodayto32EJ,whileindustriesduringproductionanddistribution)willmeasures)followingthesanctionsagainstRussiangas,higherefficiencyduringcombustion.Additionally,theitsshareofdemandforgasincreasesfrom16%togrowoverthenextfiveyearsbutwillreturntotoday’sandmildtemperatures.Gasconsumptiondecreasedbyefficientdistributionofnaturalgasthroughextensive21%.Fromarelativelylowstartingpoint,gasdemandlevelby2050.Decreasesinownusearelikelyto2%inNorthEastEurasiaduetosanctionshittingRussianpipelinenetworksandLNGinfrastructurehassignif-inthetransportsectorwillalmostdoubleby2040.arisefromefficiencygains,fromtheelectrificationofindustry.InIndia,highLNGpricescutgasdemandfromicantlyenabledthisshift.Goingforward,naturalgasItwillthendeclinebyalmosthalfby2050duetoitsproductionfacilities,andfromlessflaring.Someofthepower,refining,andpetrochemicalsectorsby11%,demandwillvarybyregion,typicallyincreasinginthisuseintheenergysectorwillbeforliquefactionandasimilardevelopmenthasbeenseeninothercoun-low-andmedium-incomeregionsandreducinginandregasificationofgasthatistransportedasLNG.triesthatcannotaffordLNGattherecord-highprices.OECDregions.Furthermore,therewillbedemandfornaturalgasinnewsectors,particularlywithincreasinguseinmaritimetransport,andasafeedstockformakingbluehydrogenandammonia.SectoralDemandFigure4.8showshistoricalandforecastnaturalgasdemandindifferentsectors.Naturalgasdemandin2022was166EJ,dominatedbypowergenerationdemand.Itwillincreaseto175EJin2027,maintainingthatlevelfor10yearsbeforedecliningto149EJ.Overthepast10years,powergenerationaccountedfor35%ofgasuse.Thissharewillriseto37%(64EJ)in2026beforerecedingto25%(37EJ)bytheendofourforecastperiod,ashiftdrivenbytheexpansionofrenewableenergysources.Demandforgasfrom91CONTENTSDEMANDELECTRICITYRENEWABLESFOSSILFUELSFINANCEPOLICYEMISSIONSREGIONSAPPENDIXDNVEnergyTransitionOutlook2023Inourforecast,globaldemandfornaturalgasincreasesNaturalgasproductionandtradeimportbyregion.TheMiddleEastandNorththeworld'ssecondlargestLNGexporter,andJapanto5,035billionm3(175EJ)around2027andplateausInthecomingdecade,globalnaturalgasproductionAfricaandNorthEastEurasia,havebeenexportersandSouthKoreaimporters.However,asproductionforaboutadecadebeforegraduallydecliningto4,173isanticipatedtoriseby10%comparedwith2022,throughouttheirproductionhistoryandwillremaininAustraliaincreasesandgasdemanddecreasesinbillionm3in2050,asixth(17%)lowerthanin2035.reaching5,063billionm3inaround2027,thenstabi-so.Theformer’sexportvolumedoublesby2050.JapanandSouthKoreainthenexttwoyears,supplyLookingatFigure4.9,inEuropeandOECDPacific,lizingforapproximatelyadecadebeforegraduallyNorthEastEurasia’sexportvolumestaysalmostthewillsurpassdemandandtheregionwillshiftfromnetgasconsumptionkeepsdecliningtoabout35%ofdecliningabout15%to4,272billionm3bytheendsame,thoughitsmarketsshiftwithexporttoEuropeimporttonetexport.Europehasbeenthelargest2022valuesby2050.InGreaterChina,itwillgrowoftheforecast.Figure4.9showsthatin2050,MiddledroppingtonearzeroandcountriesinAsiatakingimporterregioninrecentdecades,reachingarecord28%by2030,plateauuntil2040,andthendeclinetoEastandNorthAfricagasproductionincreasesbyover,firstforLNGandlaterthroughnewpipelines.volumeof370billionm3in2021.WithRussia'sinvasion444billionm3,12%lessthanin2022.Gasdemandin33%anditssharealsoincreasesby10%to35%,whileNorthAmericashiftedfrombeinganimporterofofUkraine,Europeanpolicymovedtoslashtheregion’stheSub-SaharanAfricaandtheIndianSubcontinentproductioninNorthAmericaandEuropewillhalve,naturalgastoanexporterin2014;in2022,with280dependencyonimportedRussiangas.Theimportwilldoubleandtripleby2050(comparedto2022).reflectinga10%dropingassharesinbothregions.billionm3,itbecamethesecondlargestexporterofvolumein2022decreasedto303billionm3andwillTheriseindemandinGreaterChinaandtheIndianNorthEastEurasiagasproductionanditssharearegas.However,withthereductionindemand,Northcontinuetodeclinesuchthatby2050importvolumesSubcontinentisdrivenbystrongpolicysupportforprojectedtobeslightlylowerthancurrentvalues.America’sexportvolumewillgraduallydecreasetoawithbeonefifthlowerthanpresentlevels.Greaternaturalgasconsumptionintheshortterm,andthethirdofitscurrentvolumeby2050.OECDPacifichasChinaandtheIndianSubcontinenteachhavehighshiftfromcoaltogastoreducelocalpollution.Figure4.10comparesnaturalgasnetexportandthehighestinterregionaltrade,withAustraliabeingdemandandlimiteddomesticnaturalgasresources.92CONTENTSDEMANDELECTRICITYRENEWABLESFOSSILFUELSFINANCEPOLICYEMISSIONSREGIONSAPPENDIXDNVEnergyTransitionOutlook2023InGreaterChina,gasimportswillincreaseinthewithlittlepipelineimport,andaheightenedfocusonTheroleofpipelinesHowever,astheworldshiftstowardscleanerenergycomingdecade,followedbyasteepdeclinethroughtoenergysecurityanddiversityofsupply.Figure4.11sourcesandseekstoreduceGHGemissions,2050asitsconsumptionofnaturalgasdecreases.Theshowsglobalcapacityforregasificationandlique-TheenergysectorhasusedpipelinesformorethanhydrogenhasemergedasapromisingalternativeIndianSubcontinentwillsignificantlyincreaseimportsfactionbyregion.TheMiddleEastandNorthAfricaacentury.Initially,theyweredevelopedtotransporttofossilfuels.Pipelines,withtheirestablishedinfra-–mostlyasLNG–tosatisfyaneardoublinginitsregionhasthelargestinstalledliquefactioncapacitycrudeoilfromoilfieldstorefineries,andlaterforstructureandtheiroperators’experienceinhandlingdemandfornaturalgas,requiringsubstantiallygreatertoday.However,NorthAmerica–beingdistantfromdistributingrefinedpetroleumproducts.Theirgases,canplayavitalroleinthehydrogeneconomy.LNGregasificationcapacityintheregion.itsnaturalgasexportcustomers–willincreaseitsefficiencyliesintheirabilitytomovelargevolumesSeveralfactorscontributetotheirsuitability:liquefactioncapacityby37%toreachthesameofliquidorgaswithminimalenergyinput,makingGastransportisexpensiveandaccountsforasignif-levelasintheMiddleEastandNorthAfricain2030.themcost-effectiveandenvironmentallyfavourable—Large-scaletransport:Pipelinescanefficientlyicantproportionofthecostofdeliveredenergy.Capacityinthelatterregionwillincreaseby26%comparedwithothertransportmodes.transporthydrogenoverconsiderabledistancesPipinggasischeaperthanshippingitwhenitcomesbetween2040and2050.LNGliquefactioncapacitywithoutsignificantenergyloss,providingameanstoshorterdistances,butLNGisstillexpectedtostaysthesameinotherregionsuptomid-century.Despitetherapidgrowthofwindandsolarpowertodistributecleanenergyonaregionalorevenincreaseitsshare.Infact,LNGandpipelinetransportOntheregasificationside,capacitywillgrowby47%generation,itisexpectedthatnaturalgasandoilglobalscale.willincreaseevenwhenglobalgasdemanddoesand66%inGreaterChinaandtheIndianSubcon-willcontinuetosupplyabout40%oftheworld'snot,duetoashiftindemandpatternstoregionstinent,respectively,between2022and2050.energyneedsbymid-century.Aslongasoiland—Safetymeasures:Hydrogen-specificmaterialsgasplayavitalroleinourlives,itwillbenecessaryandsafetyprotocolsarebeingdevelopedtoNationalGasNetworkInnovationCompetition(NIC)totransportthesemoleculesoverextensiveensuresecurehydrogentransportation.FutureGridPhase1ProjectintheUKwhereDNVistheprimarydistancestoensurethatthosewhorequirethemcanreapthebenefits.Transportingmoleculesvia—Reducedemissions:PipelinescanofferlowerGHGpartnerresponsiblefordesign,buildingandoperatingthepipelinesoffersgreatersafety,efficiency,econ-emissionsduetotheirenergy-efficientnature.testfacilityfortheresearchproject.omies,andareducedGHGemissionsfootprintwhencomparedtoshipping,trucking,orrail—Hydrogenblending:Pipelinescanfacilitatethetransportation.Pipelinescanalsoofferbenefitsblendingofhydrogenwithnaturalgasinexistingcomparedtotransportingelectricityviagrids,networkswhilemaintainingcompatibilitywithwhichiswhytherearedifferentsetupsdiscussedexistinginfrastructure.forwhatarecalledenergyislands.—Infrastructurerepurposing:ExistingnaturalTheincreaseduseofLNGasaconsequenceofgaspipelinescanberepurposedtotransportRussia’sinvasionofUkrainewillreducetheamounthydrogenwithpropermodifications,reducingofnaturalgasbeingtransportedthroughpipe-theneedforentirelynewinfrastructure.lines,leadingtoareductioninthetotallengthofsuchpipelinesworldwide.93CONTENTSDEMANDELECTRICITYRENEWABLESFOSSILFUELSFINANCEPOLICYEMISSIONSREGIONSAPPENDIXDNVEnergyTransitionOutlook20234.4SUMMARIZINGENERGYSUPPLYandnine-foldincreasesinprimaryenergysupplyTABLE4.2towards2050,respectively.Solarwillreach17%andWorldprimaryenergybysource(EJ/yr)wind11%oftheglobalprimaryenergymixin2050,Inthissection,wesummarizetheprimarysupplyofenergyfromallenergysources,withfurthergrowthexpectedbeyondmid-century.Source2022203020402050includingfossilfuels.DNVusestheprimaryenergycontentmethodinitscalculations,forBioenergyandhydropowerwillalsogrow,inbothwhichdetailsonthecountingmethodcanbefoundin(DNV,2018).Considerablelossesrelativeandabsoluteterms.Wind7174271occurintheglobalenergysystem.EnergyismainlylostwhenitisconvertedfromoneformSolar72362109toanother–forexample,heatlossesinapowerplantconvertingcoaltoelectricity.LossesCumulativelytheamountoffossilfuelsHydropower161924alsooccurduringthetransportofenergy,suchaselectricalpowerlostasfrictioningrids.notusedrelativetotoday'susageamountsBioenergy59657425Worldprimaryenergyconsumptionisthereforeconsiderablyhigherthanfinalenergyto13VLCCsofoilequivalenteachdayGeothermal41188consumption,withconversionlossesaloneexceeding100EJperyear.throughto2050.Nuclear2773511Naturalgas1533115538Primaryenergyalsoincludestheenergysector’sownPrimaryenergysupplywillreachitsmaximuminOil177160146137useofenergytoextracttheenergyitself.Forsome2038at663EJperyear,9%higherthantoday,thenCoal160175112110energycarriersthisshareisquitehigh;forexample,reduceabout2%to656EJin2050.Total61014866167aroundaneighth(12%)oftheprimaryenergy645656consumptionfornaturalgas.Theprimaryenergysupplymixwillchangesignifi-cantlyoverthecoming30years.AsdescribedintheThehistoricalandforecastworldprimaryenergyintroductiontothischapter,thefossilsharewillfallsupplyisshowninFigure4.12andTable4.2.Akeyfrom80%todayto48%inmid-century.Inhistoricalresultfromouranalysis,asshowninthefigure,isterms,thisreductionofmorethanonepercentagethatglobalprimaryenergysupplywilllevelofffrompointperyearforfossilfuelsiscomparativelyfast.around2035.ThiswilloccurdespitetheexpansionThedeclineisquickestforcoal,goingfrom26%tooftheglobalpopulationandeconomybecause10%overthenext28years,followedbyoil,whichconversionlossesreduceconsiderablyasthesharefallsfrom29%to17%overthesameperiod.Theofnon-fossilenergyincreases.Theamountofenergynaturalgasshareremainsalmoststaticthroughout.servicessuchasheating,lighting,andtransportwillcontinuetoincreasewithagrowingandmoreThesharetakenbynuclearenergywillincreaseprosperouspopulation.However,energy-intensityslowlyovertheforecastperiod,endingat6%inimprovements—alargeshareofwhichwillcome2050,whiletherenewablessharewilltriplefromfromelectrification,butalsofrommanyotherareas15%todayto46%bytheendoftheforecast—meansthatenergyservicescan,overtime,beperiod.Withinrenewables,thelargeincreasewilldeliveredwithlessuseofprimaryenergy.bedrivenbysolarandwind,whichwillsee17-fold94CONTENTSDEMANDELECTRICITYRENEWABLESFOSSILFUELSFINANCEPOLICYEMISSIONSREGIONSAPPENDIXDNVEnergyTransitionOutlook2023COMPARISONOFENERGYFLOWS2022PRIMARYENERGYDIRECTUSEANDFINALENERGYUSEFULENERGY2050PRIMARYENERGYDIRECTUSEANDFINALENERGYUSEFULENERGY610EJTRANSFORMATIONS441EJ314EJ656EJTRANSFORMATIONS489EJ494EJTransportTransportLossesRoadOilLossesRoadManufacturingManufacturingMaritimeOilDirectMaritimeCoalDirectAviationCoaluseBuildingsAviationuseBuildingsRailRailNaturalPipelinesOtherPipelinesgasBiomethaneproductionEnergysector’sHydrogenproductionManufacturedgoodsownenergyuseManufacturedgoodsBioenergyBasematerialsIronandsteelNaturalGrid-BasematerialsConstruction&mininggasconnectedIronandsteelCementConstruction&miningPetrochemicalsthermalCementGeothermalGrid-FeedstockpowerPetrochemicalsconnectedstationsFeedstockNuclearSpaceheatingfuelsthermalWaterheatingSpaceheatingpowerCookingWaterheatingSolarstationsCookingAppliances&lightingBioenergyAppliances&lightingSolarandwindSpacecoolingpowerstationsdedicatedtoAgriculture,fishing,militaryhydrogenproductionGeothermalGrid-SolarGrid-AmbientSpacecoolingconnectedpowerconnectedheatAgriculture,fishing,militaryNuclearnon-thermalnon-thermalfuelsWindpowerpowerpowerSolarstationsstationsWindHydropowerOtherHydropowerOilHydropowerBioenergyElectricityMethanolLight,computing,etcElectricitystorageEnergysector’sCoalWindpowerGeothermalHeatAmmoniaCoolingownenergyuseNaturalgasSolarpowerNuclearheatHydrogenMotionFeedstocks95CONTENTSDEMANDELECTRICITYRENEWABLESFOSSILFUELSFINANCEPOLICYEMISSIONSREGIONSAPPENDIXDNVEnergyTransitionOutlook2023Highlightsenergysystem5FINANCINGTHE—AreshufflingofregionalenergyexpendituresENERGYTRANSITIONGlobalannualenergyexpenditureswillriseby22%overourforecastperiod.ThiscompareswithanearThesechangeshaveapositiveimpactforconsumers�doublingofglobalGDPduringthesameperiod.inmostregions.WediscusshowaveragehouseholdEnergyexpenditureswillthusbeadiminishingenergyexpendituresinEuropeandNorthAmerica5.1Energyexpenditures�97shareofglobalGDP.Inthissense,thetransitionwearelikelytobe75%and50%,respectively,of2021forecastisaffordableevenbeforefactoringinthelevelsby2050.Householdexpenditureswillrisein5.2Challengesandopportunitiesfacinginvestors�101avoidedcostsofclimatedamage.absolutetermsacrosstheIndianSubcontinentduetogrowingprosperity.However,thisslightrisein5.3Howwillcostofcapitalevolve?�102Thetransitionweforecastwillresultin:energyexpenditurecontrastswithGDPpercapita—ApartialtransferofexpendituresfromfossiltoincreasingbyafactorofthreeintheIndianSubcontinentduringthesameperiod.non-fossilandgrids—Aresultingshiftfromoperational(OPEX)tocapital(CAPEX)expendituresinamoreelectrified96CONTENTSDEMANDELECTRICITYRENEWABLESFOSSILFUELSFINANCEPOLICYEMISSIONSREGIONSAPPENDIXDNVEnergyTransitionOutlook20235.1ENERGYEXPENDITURES97TheenergytransitionweforecastisnotonlycompatiblewithaneardoublingofglobalGDPby2050,butalsoleadstoconsiderablesavingsatagloballevel.Someaspectsofthetransition,liketheroll-outofrenewablesorgridbuild-out,willrequireverylargeupfrontinvestment.Thisiswhysomeconsiderthetransitiontobe‘unaffordable’.Ourresultssuggesttheopposite,andenergyexpendituresrepresentingadecliningshareofglobalGDP.Thisisastartlingconclusionfromtheperspective—TheunitcostofenergywillstaystablearoundUSDofpolicymakers—i.e.farfromcomingatagreen12to13/GJpremium,theenergytransitioninfactinvolvesasubstantialgreenreward,payingdividendstosociety—Globalenergyexpenditurespercapitawillcontinueforgenerationstocome—andissomethingthatDNVtooscillatearoundUSD650/person/yr,muchinlinehasemphasizedconsistentlyovertheyearsinourwiththevaluesobservedsince1990.annualEnergyTransitionOutlooks.ThestabilityofthesecostscontrastsheavilywithWorldenergyexpenditurethetransitionweforecast,whichwillresultin:Weconsiderenergyexpendituresastheupstreamcostsrelatedtoenergyproductionandtransport—Apartialtransferofexpendituresfromfossiltototheuser.Usingthisdefinition,totalworldenergynon-fossilandgridsexpenditurewasUSD5.2trnin2022,withinvest-mentsinlow-carbontechnologiessurpassingUSD—Aresultingshiftfromoperational(OPEX)tocapital1trnforthefirsttime(BNEF,2023b).Weprojectworld(CAPEX)expendituresinamoreelectrifiedenergyenergyexpendituretoincrease22%toUSD6.4trnbysystem2050,duemainlytotheriseinpopulationandfinalenergydemand.Notehowthis22%expenditurerise—Areshufflingofregionalenergyexpenditurescompareswiththeprojectednear-doublingofglobalGDPoverourforecastperiod.Notonlywillthesechangeshaveapositiveimpactfortheconsumerinmostregions,asdescribedlaterOverall,ourresearchindicatesthatfromanexpend-inthissection,butanadditionalco-benefitoftheitureperspective,someparameterswillremainstableenergytransitionweforecastwillbetheconsiderableoverourforecastperiod:savingsduetotheslowingdownofclimatechange(seefactbox),andtheconsiderablefinancialbenefitofcleanerair,whichwedonotquantifyherebutiswelldocumentedelsewhere(OECD,2016).CONTENTSDEMANDELECTRICITYRENEWABLESFOSSILFUELSFINANCEPOLICYEMISSIONSREGIONSAPPENDIXDNVEnergyTransitionOutlook2023Lessfossil,morerenewablesgoriesalsochange.Between2022and2050,fossilintheearly2040s,beforeaslightrebound.ThisisIntermsofthebreakdownofnon-fossilexpenditure,Untilnow,non-fossilexpenditureshavenotreplacedexpenditurewilldecrease40%inUSDterms,non-fossilexplainedbytwooppositetrends:weforeseelargegrowthinsolar+storageandfixedbuthaveeffectivelybeenaddedontopoffossil-fuelwillalmosttriple,andgridswillmorethandouble.offshorewind,fromrelativelysmalllevelsin2020.expenditureastheworld’senergydemandhasHowever,themajority(54%)ofcumulativeexpenditures—AsuccessivereductioninfossilCAPEXastheHoweverestablishedrenewabletechnologiessuchasclimbed.Overthelastfiveyears(2017–2022)renew-inthe2022to2050periodwillbeforfossilenergy,worldshiftsincreasinglytonon-fossilenergy.solarPVandonshorewindcontinuetodominateinablesrepresented53%oftheadditionalenergycomparedto77%inthe1990to2021period.WhileCAPEXdeclinescontinuously,fossilOPEXtermsofabsolutenumbersinourforecast.demandworldwidewithfossilsources(andnotcontinuestoincreaseinthe2020sand2030snuclear)takinguptheremainingshare.AsshownFromoperatingtocapitalexpendituresbecauseofcontinuinguseofupstreaminfra-WeexpectfloatingoffshorewindtoexperienceinFigure5.1,weexpectthatsituationtochange.InFigure5.2presentsthebreakdownofCAPEXandstructurebuiltintheleaduptothe2020s.Wetremendousgrowthinexpenditures,butfromavery2022,fossilfuelsmadeup71%ofthetotalworldOPEXforthecategories:fossil,non-fossil,andgrids.projectastructuralshiftawayfromfossilCAPEXsmalllevelin2020.Ontheotherhand,solarPVandenergyexpenditurebutweforecastthatthisshareTheexpendituresarepresentedasanaverageexpend-andOPEXfromthe2030s.Thesucceedingonshorewindseeathree-foldincreaseinexpendi-willalmosthalveto36%by2050.itureover10yearsleadingupto2020,2030,andsoon.decadeswillseelessandlesssuchCAPEXandturesfrom2020levelsby2050.GiventhattheseOPEX.technologiesarealreadyestablishedtoday,itisNotonlydotherelativeshareschange,theabsoluteOverallCAPEXwillrepresentaslightlydecreasingunsurprisingthattheirexpendituregrowthratesUSDvaluesofexpendituresunderthesethreecate-shareofexpenditures,from55%in2022to49%—Asuccessiveincreaseinnon-fossiland(connectedarenotashighasforfloatingoffshorewind.withit)gridsOPEXandCAPEX.RenewablesareCAPEX-heavy,andweprojectCAPEXalmosttwiceashighasOPEX,despitetheuninterrupteddecade-to-decadeincreasesinOPEX.Further,additionalinvestmentcosts(notcomputedinourmodel)willhavetobecarriedbyend-usersinamoreelectrifiedenergysystem.Forindividuals,heatpumpsandelectriccarsaretypicalexamplesoftechnologiesforwhichlevelizedcostsarelowerthanforfossil-basedalternatives,butupfrontcostsarehigher.Inthemanufacturingsector,switchingtoelectricity-orhydrogen-basedprocessesmayalsoentailhigherinvestmentsthanforconventionaltechnologies.Thishighlightstheessentialroleofthecostofcapitaltosupportthedecarbonizationoftheenergysystem,asdiscussedinSection5.3ofthischapter.98CONTENTSDEMANDELECTRICITYRENEWABLESFOSSILFUELSFINANCEPOLICYEMISSIONSREGIONSAPPENDIXDNVEnergyTransitionOutlook2023RegionalreshufflingtocontrasthowthetransitionisexpectedtounfoldgoonproducingfossilfuelsandoperatingexistingConsumerperspective—agreenprizeTheregionaldistributionofenergyexpenditurewillintermsofexpendituresintwofossil-fuelproducingfossil-fuelinfrastructureatincreasinglyhighlevelsfromforhouseholdsalsobegreatlyaffectedbythetransitionawayfromregions(NorthAmerica,theMiddleEastandNorthnowuntilatleast2050.Incontrast,NorthAmerica’sIntheintroductiontothischapterweunderlinedfossilfuels.Thistransition,andtherelatedgeneralAfrica)andone(Europe)withrelativelylessfossil-fuelOPEXstartsdecliningafter2030,signallingthestartthattheenergytransitionisaffordablefromaglobaltrendtowardsrelocationofenergyproductiontoaproductionandalreadyaheadofthecurveintheofitsgradualtransitionawayfromoperatingfossil-fuelperspective.AsshowninFigure5.4,thisconclusionmoreregionallevel,willinduceimportanttransferstransitiontonon-fossilenergy.infrastructure.isalsoconfirmedwithapercapitaanalysis,withGDPinexpenditures.percapitagrowinglinearlyfromthe1990swhileBothNorthAmericaandtheMiddleEastandNorthNotethatourdefinitiononlyconsidersexpendituresenergyexpendituresremainstablethroughoutourInvestmentsinfossilproductionwillincreaseinAfricahavelowerCAPEXforfossilfuelin2050forthefinalinstallation(e.g.windfarm,oilplatform),forecastperiod.regionssuchastheMiddleEastandNorthAfrica,comparedwith2021.Thatsaid,NorthAmerica’sbutpartsofkeysupplychainswillcontinuetobeatleastintheshortterm.CAPEXstartsreducingafter2030,whiletheMiddledominatedbysomeregionsintheforeseeableHowever,thisconclusionisoftennotsharedbyEastandNorthAfrica’stransitionawayfromfossil-fuelfuture.Themoststrikingexampleisprobablytheconsumers(Guthridge,2023).Asmentionedprevi-Figure5.3showsthechangeinenergyexpendituresinvestmentshappensadecadelater.EvenmorecurrentdominanceofChinainmostpartsoftheously,afirstreasonisthatthetransitionimpliesinNorthAmerica,theMiddleEastandNorthAfrica,significantly,OPEXintheMiddleEastandNorthsolarPVsupplychain,wheremostoftheinvestmentsimportantinvestments.AlthoughtheseinvestmentsandEurope.ThesethreeOutlookregionsareselectedAfricakeepsincreasing,implyingthattheregionwillareexpecteduntil2030(IEA,2022).mightbeprofitableoverthelongterm,upfrontcosts99CONTENTSDEMANDELECTRICITYRENEWABLESFOSSILFUELSFINANCEPOLICYEMISSIONSREGIONSAPPENDIXDNVEnergyTransitionOutlook2023andlackofvisibilityonthefutureregulationsand(suchascostofelectricstoves)andOPEX,whichisthebenefitsofinvestingincheaprenewableelectrimeasuredasshareofincome,energywillbemoreeconomicsituationcanfavourthestatusquo.theenergycostsandenergytaxes,ofrunningalltheficationarefeltbyhouseholdsthroughgenerallyaffordable.householdequipment,andpassengervehicles.cheaperenergy.ThesecondreasonisthatexpendituresarenotmarketEnergycostsarealsoembeddedinproductsandpricespaidbytheconsumer,whichincludemargins,HouseholdsinEuropehaverecentlyseentheirenergySimilarly,theIndianSubcontinentwillseeitsservices,butourresultsshowthattheenergytaxes,and/orsubsidies.Thegapisespeciallyvisibleinexpenditurerisingsharply,andthiswilllastuntilthehouseholdenergyexpenditureabovepastlevelstransitionwillatleasthaveapositiveimpactonthetherecentcontextofhighenergyprices,withenergyenergysupplyshocksarealleviatedaround2025.intheshorttermowingtopriceshocks,butgrad-visiblepartofthesecosts:directhouseholdenergyproducersmakingexceptionalprofitswhiletheirBythelate2020s,householdenergyexpendituresinuallydecreasingoverthecomingyears.However,expenditure.productioncostsarenotincreasing.Europewillbearound90%oftheir2021levels,inrealincreasingelectrification,especiallyresidentialterms.Therewillbeastableperiodbeforeafurtherairconditioners,andhigherhouseholdenergyWeforecastthatby2050averagehouseholdFigure5.5forecaststrendsinhouseholdenergydeclinetoaround75%of2021levelsbymid-century.consumption,willdampentheeffectofdecreasingenergyexpenditurewillbe75%of2021expendituresinNorthAmerica,Europe,andtheenergycostsforhouseholds.HouseholdenergylevelsinEuropeand50%lowerthan2021IndianSubcontinent.Thishouseholdenergyexpend-Afteralongersustainedpriceshockinthe2022expenditureswillconsequentlyriseslightlyto2050.levelsinNorthAmerica.itureincludesCAPEXforresidentialspaceheatingto2025period,NorthAmericawillfollowanevenNotethatoverthisperiod,averageGDPpercapitaandcooling(suchascostofairconditioners),watersteepertrajectory,with50%lowerenergybillsbyincreasesbyafactorofmorethanthreeacrossheating(suchascostofheatpumps),andcookingmid-century.InbothEuropeandNorthAmerica,theIndianSubcontinentandsoonarelativebasis100CONTENTSDEMANDELECTRICITYRENEWABLESFOSSILFUELSFINANCEPOLICYEMISSIONSREGIONSAPPENDIXDNVEnergyTransitionOutlook20235.2CHALLENGESANDOPPORTUNITIESFACINGINVESTORSChallengesOpportunitiesThewarinUkrainehasledtosupply-chaindisrup-AgainstthebackdropofthesechallengesaretheTheglobalandgeopoliticaldevelopmentsweintroducedatthebeginningofthisreporthavetions,impingingontheavailabilityofcriticalcompellingeconomicsofrenewables.SolarPVandtrickle-downimplicationsforinvestorsattheprojectlevel.Inthissectionwewillfirstreviewresourcesnecessaryforrenewableenergyprojects.windarebecomingmorecompetitiveintermsofthechallengesandopportunitiesfacinginvestorsandthendiscussthecostofcapital.This,inturn,hasdrivenupcosts,makingittougherlevelizedcostofenergy(LCOE),withcostsprojectedtofundtheseprojects.Additionally,thewarhastodeclinesignificantlyduetotechnologicaladvance-heightenedgeopoliticaluncertainties,makingmentsandeconomiesofscale.investorsmorecautiousandpotentiallyhamperinginvestmentflowsintotheenergysector.By2030,solarPV'sLCOEwillreachUSD30/MWhandonshorewind'sLCOEwillhitthismarkby2035.Inflationarypressuresacrossmanymajoreconomies,Incontrast,conventionalpowerstations,likecoalexacerbatedbythewarandthepost-COVIDandgas,havelimitedpotentialforcostreductions,environment,arefurthercomplicatingthescenario.andwithrisingfuelandcarbonprices,theiroperatingOutsideofChina,whichhashoveredonthebrinkofcostsareexpectedtostayaboveUSD60/MWhondeflationformuchof2023,thishasledtoincreasedtheglobalaverage,thoughinsomeregions,itwillcostsofrawmaterialsandequipment,alongwithstayaslowasUSD20/MWh.Thus,inthenextfivewagepushinflation,makingrenewableenergytotenyears,renewableenergysourcesarepoisedprojectsmoreexpensivetoprocureandslowertotobeatleastascost-effectiveasfossilfuelsevenindevelop,particularlyinNorthAmericaandEurope.regionswiththeleastrenewable-friendlypolicies.Furthermore,aswedetailinChapters2and3,gridHowever,itisimportanttoconsiderthatwhileconnectionavailabilityisbecomingaconstraint,theoperationalcostsofrenewableenergytech-duetotheincreaseddemandforelectricityandthenologiesaretypicallylow,theinitialinvestmentdisruptioninenergysupplychains,exacerbatingcanberelativelyhigh.Additionally,thecostofbothtimetomarketforprojectsandthetimingofrenewableelectricitycanbeinfluencedbyarangereturnsforinvestors.offactorsincludinggeographiclocation,techno-logicalmaturity,marketcompetition(particularlyifAlongsidetheabove-mentionedchallenges,thecompetingfossilsourcesaresubsidized),andpolicyfinancinglandscapeoftherenewableenergysectorframeworks.Therefore,whilerenewableelectricityisalsobeingreshapedbyrisinginterestrates.Asisprogressivelybecomingcheaper,itiscrucialtocentralbanksshifttheirpoliciestocombatinflation,examinethebroadereconomicandpolicylandscapethecostofborrowinghasincreasedsubstantially.togetacompletepictureofitscost-effectiveness.Thisshiftdirectlyimpactsthefinancingofrenewableenergyprojects,whichareoftenhighlyleveraged.101CONTENTSDEMANDELECTRICITYRENEWABLESFOSSILFUELSFINANCEPOLICYEMISSIONSREGIONSAPPENDIXDNVEnergyTransitionOutlook20235.3HOWWILLCOSTOFCAPITALEVOLVE?102Costofcapitalisamajorfactorforinvestorsinnewcontinuingtofinancecoal?",and"ArecompanieswhoenergygenerationreducetheiremissionsinlinewithnetzerorewardedbyCostofcapital(CoC)isoneofthekeycostdriversforthecapitalmarketswithalowerCoC?”capital-intensiveprojectslikenewpowergeneration,powergrids,andgasinfrastructure,andforend-useToanswerthesequestionsandcreatecredibleinputssubsectorssuchasbuildings,equipment,andzero-forCoC,DNVhasprimarilyutilizeditsinternalteamofemissionvehicles.financeexpertsandtheirhands-onprojectexperiencefromtransactionadvicetoprovideinformedopinions.DNVusesthelevelizedcosttocomparecompetingMultipleinternalworkshopshavebeensupplementedtechnologies,wheretheratiooflifetimecoststowithadesktopstudy,literatureresearch,andreviewlifetimegeneration(likeelectricityorhydrogenoffinancialreportsfrompowerproducersandoilandproduction),arediscountedbacktoacommonyeargascompaniesinvariousregions.usingadiscountratethatreflectsthecostofcapital.Withhigherdiscountrates,thebreak-evenprice,thatEvolutionofcostofcapitalsatisfiesequityanddebtreturns,movesup.DNVforecaststhatcleanenergyexpenditurewillincreasetoaroundUSD1.3trnperyearin2030,Hence,predictingthecompetitivenessof,forbuildinguptowardsUSD2.5trnperyearin2050.Weexample,competingpowergenerationtechnologiesobserveamassiveredirectionofcapitalfromfossilnowandinthefuture,requirescarefullyweighedCoCenergyexpendituretonon-fossilenergytofinancepredictions.Itisacrucialparameterinourforecasttothisgrowth.However,theyearsofabundantcapital,2050andDNVhasthereforecontinuedfocusontheavailableatlowcost,chasingfewrenewableenergygranularityoftheCoC.projectshasbeenreplacedwithamorecomplicatedriskpicture(DNV,2023e).Inthisyear’sOutlook,DNVmakesassumptionsontoday’sCoCpertechnology,perregion,andnotleastShortterm—Inflationarypressuresendsmixedonthespeedanddirectionofcapitalreallocationsignalsacrosstheglobebetweentechnologiesupto2050.Thisisachal-Intheshortterm,inflationarypressureimpactsCoC.lengingtaskbecauseitrequiresanswerstoquestionsInEuropeandtheUS,interestratehikesbycentrallike:“Howdoesinflationimpactborrowingcostsbankstotameinflationareuppermostinminds.acrossgeographies?","AreinvestorsandgovernmentsBanksandinvestorsarerevaluingtheirportfoliosCONTENTSDEMANDELECTRICITYRENEWABLESFOSSILFUELSFINANCEPOLICYEMISSIONSREGIONSAPPENDIXDNVEnergyTransitionOutlook2023andborrowingcostsareelevatedacrossthefulltheincreaseinCoCwillbehighercomparedwithguidinginvestmentdecisions:theAfricanDevel-2040,whentechnologyhasmaturedandbeenprovenenergyvaluechain.Thesoaringcostsforoffshorelessmaturetechnologies,whichhavemoreequityopmentBankcanfinancenewcoal-firedpowerinbothproductionandend-usesectors.ThemarketwindcompaniesinEuropeandtheUSare,toafinancing.plantswhiletheWorldBankcannot,butcanfinanceandbusinesscaseforcertainusecaseshasmaturedlargeextent,explainedbythesuddenincreaseinupstreamgasifurgentlyneededfromanenergytoo,resultinginlowerrisk,lowerborrowingcosts,borrowingcostsinthesegeographies,resultinginLongerterm—Riskperceptiondrivesthecostofsecurityperspective.Thisillustratesthatcapitalforthelowerequity-returnrequirementsfrominvestors,anddeterioratingmargins,contractrenegotiations,andcapitalfossilindustrywillgetscarcerandmoreexpensive,ahigherleveragealldrivingdownthecostofcapital.delayedinvestmentdecisions.Inthelongerterm,ourCoCshouldaccuratelyreflectbutthespeedofreallocationdiffersbyregion.WhetherfinancingcoalinEuropeorSouthEastAsiatheimpactofdebtandequitycostsonintra-tech-orhydrogenvaluechainsnoworinadecade,settingMeanwhile,inGreaterChinaandtoalesserextentnologycompetitionandtheopportunitycostandNexttoregionaldifferences,riskperceptionalsomid-tolong-termassumptionsaboutthecostoftheIndianSubcontinent,deflationriskpresentstheriskassociatedwiththeinvestmentchoice.variesbytechnologicalandcommercialreadiness.capitalisatoughanddynamicchallenge.reversechallenge.CentralbankstherehavefortheLessmaturetechnologies,likegreenhydrogenlastyearbeenreducinginterestratesandtherebyThemaindriverforthesevariablesisriskperception,production,willbeperceivedriskiertodaythaninCostofcapitalpredictionsusedin2023borrowingcosts.Theseregionaldifferencesinwhichvariesbyregion.InEurope,weobserveWecategorizeourinputsundertwomajorcategoriescentralbankbehaviourimpactCoCandhencetheEuropeanbanksexitingfromfinancingnewcoal-oftechnologies:matureandemerging.costofnewenergyforend-users.firedpowerplants,butthisisnottheregionwhereDNVpredictsnewcapacity.HotspotsfornewMaturetechnologiesmaythenbefurtherThisexemplifiestheimportanceofaccurateCoCcoal-firedpowerwillbeGreaterChina,theIndianconsideredas:predictionsthatdistinguishbetweengeographiesSubcontinent,andmuchofSouthEastAsia,regionsandtechnologies.DNVhasreviewedpolicyrateswhereGHGemissionsandairpollutionarestilloften—Oilandgasupstream,midstream,anddownstreamandinflationdevelopmentinallregionstoaccountoutweighedbyadriveforeconomicgrowthandtechnologiesincludinggreyandbrownhydrogenforthismixedbagofsignalsthatimpactborrowingincreasedenergydemand.State-ownedentitiesandgas-andoil-firedpowergenerationcosts.DNVpredicts,basedonforwardcurvesfromprovidethebulkofequityanddebt,withlowcentralbanks,thattheimpactonCoCduetoreturnrequirementsandsubsidizedinterestrates—Coal-firedpowergenerationandproductioninflationarypressureisshort-livedtowards2030.keepingCoCdown.Similarly,Europeanbanksthat—Maturerenewabletechnologies:solarandusedtofinanceworkingcapitalneedsforcoaltradeInflationpushesuprisk-freeinterestrates,sothearereplacedbybanksfromcoal-producingcoun-solar+storage,onshoreandbottom-fixedoffshoreimpactonthecostofdebtissimilarformaturetech-tries,suchasAustralia,Indonesia,andSouthAfrica.wind,biomass,hydropowernologies,whetheritisfossilorrenewables.However,Multilateralfinanceinstitutionscontinuetoplayan—Nuclearpowertheimpactoftheincreasedcostofborrowingdoesimportantroleinfinancingfossil-fuel.Asanexample,nothaveauniformeffectonemergingtechnol-theAfricanDevelopmentBankandtheWorldBankEmergingtechnologiesare:ogies,becausethedebt-to-equityratioisdifferentprovidedmostoffossilfuelfinanceinSub-SaharanfortechnologiesatdistinctstagesoftheirproductAfricabetween2016and2021(ClimateAnalytics,—Floatingoffshorewindlifecycle.Maturetechnologiestypicallyhavemore2022),mainlyfinancingnewfossilgas-firedpower—Grid-connectedanddedicatedelectrolyser-baseddebtfinancingthanequityfinancing,andhencegeneration.Bothinstitutionshaveinternalpolicieshydrogen—Productionofgreenammonia,e-fuels,andSAF—Geothermalpower103CONTENTSDEMANDELECTRICITYRENEWABLESFOSSILFUELSFINANCEPOLICYEMISSIONSREGIONSAPPENDIXDNVEnergyTransitionOutlook2023Figure5.6presentstheCoCforenergytechnol-costsisexpectedtobearound1.5%from2022tobetween11%and14%in2023.From2023,theCoCtheregionsin2023,rangingfrom6%inGreaterogiesassumedintheETOforNorthAmericaand2023.Thisisincontrasttoemergingrenewables,forthesetechnologiesgraduallydecreases,drivenChinato16.5%inEurope,andlargeincreasesinCoCGreaterChina.Foralltechnologies,onecanseethewhereincreasedborrowingcostshaveaslightlybytheassumptionthattheinflationpressureontowards2050,withinputsrangingfrom20%to25%.short-termincreaseinCoCfrom2022to2023duemilderimpactduetolowerleverage.Followingborrowingcostsisshort-lived,andbytheexpec-toinflationintheUS,whilethistrendisabsentinforwardcurvesfromcentralbanks,wepredictantationthatthesetechnologiesmaturegraduallyandNuclearChina.Forbothemergingandmaturerenewablesinflationaryimpactuntil2025andthentaperingattainparitywithmaturerenewablesby2040.WeexpectCoCtobelowandstableovertime,andnuclear,afterthetemporaryincreaseinCoCinofftowards2030.OurforecastassumesthatCoCwithinflationaryimpacttaperingofftowards2030.2023,thelevelscomedowntowards2050,withtheforthesetechnologieswillcomedownallthewayOilandgasWeexpectlargegovernmentinterventioninmostperceptionofriskdecreasing.Forfossilfuels,thetobetween5%and7%by2030,differentiatedWeexpectoilandgasin2023tohaveahigherCoCregions,wherereturnsoninvestmentareregulated.oppositeisexpected.bycountryriskpremiums,andthenstayconstantthanmaturerenewablesinallregionsexcepttheWeexpectthatpublicfundingandsupportwillbethroughout,untilmid-century.MiddleEastandNorthAfrica,mostlybecauseitisavailable,motivatedbyenergysecurity,safeguardingMaturerenewablesnowperceivedasriskierthanmaturerenewables.knowledgeinnucleartechnology,andshieldingIntheshortterm,allregionsexceptGreaterChinaEmergingrenewablesThatregionconsistsoftopoilandgasproducersatinvestorsfromsomeofthesafetyconcernrisks.seeanincreaseinrisk-freeratesduetoincreasesinUnlikematurerenewables,emergingrenewableslowcost,likeSaudiArabiaandUnitedArabEmirates,ResultingCoCpredictionsfor2023rangefrom4%steeringratesbycentralbanks.Withhighdebtratioshaveahigherriskpremium,andhencetheiraverageandisthereforerewardedwithattractivefinancinginGreaterChinato11.5%inLatinAmerica.Towardsinthiscategory,theimpactofincreasedborrowingCoCisexpectedtobemuchgreater,atlevelsterms,expectedtolastoverthefullforecasttowards2050,wedonotexpectlargedeviations,withinflation2050.CoCinputsfortheotherregionsvarybetweennormalizedby2030andcertainregionsdeveloping6%and11%in2023,withallseeinganupwardeconomically,therebyreducingthespreadbetweentrendtowards2030and2040,drivenbyincreasedtheregionsto4%and8%.perceivedrisksandcapitalmovingawayfromnewoilandgasproduction.Thecostofcapitalisdecidedbythreevariables:Coal1)Thecostofdebt(thecombinationoftheInvestorsinEuropeandNorthAmericaalreadyrisk-freerateandtheriskpremium,orperceivecoalassignificantlyhigherriskthanmargin,togetheroftenreferredtoasotherfossilfuelsorrenewableenergyprojects,asborrowingcosts)evidencedbyaclearincreaseinloanspreadsoverthepastdecade.Wedoexpectgrowingeconomies2)Thecostofequity(theequityreturninlow-andmedium-incomecountriestocontinuerequiredbyinvestors)tofinancenewcoalinvestmentsatcompetitiveratestowardsthe2030s,afterwhichweexpectarapid3)Theratiobetweenthesetwo(theleverage)increaseinriskandthereforeCoC,drivenbyreducedavailabilityofcapitalinallregionsandfallingdemand104forcoal.WeforecastlargevariationsinCoCbetweenCONTENTSDEMANDELECTRICITYRENEWABLESFOSSILFUELSFINANCEPOLICYEMISSIONSREGIONSAPPENDIXDNVEnergyTransitionOutlook2023FossilfuelsinenergysystemsarebyfarthelargestWhileclimatechangeanditsimpactsareheadedcontributortoclimatechange,andenergysystemsintounchartedterritory,sotooarethesocio-willthemselvesbeimpactedbyclimatedamage.economicconsequences.Eveniflimitedto2.2°C,Impactswillvaryfromacutedisruptionsofenergyclimatechangewillresultinlargemateriallossessuppliestocompromisedinfrastructuresduringwithimmensesocietalimplicationsandvastareasextremeweatherevents.Theseencompassheat-becominguninhabitable.Furthermore,climate-waves,drought,andvariabilityinprecipitation(e.g.relateddisastersareintensifyingalready,hinderingsnowlessyears)thatimpactwatersupplies,adverselyprogresstowardstheSustainableDevelopmentaffectinghydropoweroutputandwateravailabilityGoals(UNECOSOC,2023).forcoolinginpowerplants.Warmertemperaturesimpactthermalgenerationefficiency,anddecreaseRisingeconomiclossesthecarryingcapacityoftransmissionlineswhileClimatechangeiscausingahigherfrequencyofboostingelectricitydemandforcooling(seeSectionextremeweathereventswithdevastatingimpactsas1.2),andmightimpactresourcepotentialsinsolarshowninFigure5.7.Extremeweather,climate,andandwind,thelatterwithadecreasingtrend.WeTheeconomicsandrisksofclimatechangehaveyettoseecomprehensiveglobalstudiesontheextentandcostsoftheseweather-relatedenergyApervasivemisconceptiondeterringenergytransitionWeseetheworldatriskofsignificanteconomicandsystemeffects,butasexamplessuggest,therewillinvestmentsisthattheswitchtolow-carbonenergyissocietalsetbackinafuturewhereclimatechangebearisingneedforrobustweatherization(weather-prohibitively'expensive'(OxfordMartinSchool,2022).goesunmitigatedbeyondtemperaturelimitssetbyproofing)ofenergyassetsforresiliencetoclimateMuchinlinewiththefindingsofthestudybyWayetal.science,asrootedintheParisAgreementandrein-changeimpacts.Forexample,infreezingconditions,(2022),wepredictthattheinvestmentsinvolvedintheforcedbytheGlasgowPact.windturbinesneedmaterialsandelectronicsratedtransitionweforecastwillseetheworldspendprogres-forlowertemperatures,alongwithheatersandothersivelylessonenergyasaproportionofGDP.Moreover,In2023,theglobalaveragetemperaturehasalreadyde-icingmeasures.Inhot,desertenvironments,asdetailedinthischapter,householdswillalsoreaparisentoabout1.1°Cabovepre-industriallevelsturbinesrequiresand-proofingandventilationdividendfromthetransitionweforecastintheformof(NASAEarthObservatory,2023),andarecordengineeringadjustments.significantlylowerexpenditureonenergy.Thoseare+1.5°CinJuly.AswedetailinChapter7,theemis-directbenefitsofdecarbonization,butoffargreatersionsassociatedwithourforecastseeafurtherLookingbeyondtheenergysystem,impactsfromimportancearetheavoidedcostsofclimatedamageincreasetoaround2.2°Cabovepre-industriallevelsclimatechangearealreadybeingfeltacrossworldandadaptationassociatedwithaslowenergytransition.by2100.regions:fromextremehazardstoslow-onsetdisasterssuchasdroughts,oceanacidification,fastersea-levelrise,andchangingdiseasepatterns.105CONTENTSDEMANDELECTRICITYRENEWABLESFOSSILFUELSFINANCEPOLICYEMISSIONSREGIONSAPPENDIXDNVEnergyTransitionOutlook2023water-relatedeventscausednearly12,000disastersEconomiclossestimatesshowthatlower-andlower-reorganizes,oftenabruptlyandorirreversibly.Large106from1970–2021.Reportedeconomiclossesaremedium-incomecountriesarelikelytosee3.6timesbiophysicalsystemsthatregulatetheclimatesystemUSD4.3trnandrising(WMO,2023).Asevidentfromgreaterlossesonaveragethanhigher-middle-and(e.g.theAmazonrainforest,thesummericecoverthefigure,thenumberofclimate-relateddisastersandhigher-incomecountries,whilethelower-andlower-intheArctic,andthepermafrostsystem),ifpushedthecostsofclimaticandmeteorologicalhazardsaremedium-incomecountrieshavelesscapacitytoadapt,toofar,canshiftirreversiblytocreatecascadingrisksescalating,andtheincreaseinabsolutelossesislikelyhavingweakerinstitutionsandlessfinancialcapacity(ice-sheetmelt,forestdieback,permafrostthaw)tocontinuetogrowfasterthanGDP.(Mundayetal.2022).acrossinterconnectedsystems,likelytohavesevereimpactsonhumansocietyandbecomingincreasinglyReinsurersplayakeyroleinprovidingriskknowledge.Significantinvestmentsinclimateadaptation(buildingdifficulttomanage.MunichRE’sJanuary2023presentationsummarizedresiliencetobothcurrentandfuturechanges)willbetheposition:“Climatechangeistakinganincreasingneeded,andhigheradaptationinvestmentwilltendTheClimateChange2023:SynthesisReport(IPCC,toll.Weather-relatednaturaldisasterfiguresfor2022tomeanlowerresidualdamage.Accordingtothe2023)hasneverbeenclearerinitslanguageandaredominatedbyeventsthat,accordingtothelatest2022AdaptationGapReport,theestimatedannualmessage:“Climatechangeisathreattohumanwell-researchfindings,aremoreintenseorareoccurringadaptationcostisUSD160–340bnby2030andUSDbeingandplanetaryhealth(veryhighconfidence).morefrequently.”ThefloodinginPakistansaw1,700315–565bnby2050(UNEP,2022).Hitherto,adaptationThereisarapidlyclosingwindowofopportunitytopeoplekilled,withdirectlossesestimatedtobeateffortstendtobefragmented,sector-specific,andsecurealiveableandsustainablefutureforall(veryleastUSD15bn,enormousgiventhecountry'sGDPunequalacrossregions,withnotablegapsamonghighconfidence).”(MunichRE,2023a).Similarly,CycloneFreddylosseslower-incomeregions.ItisalsoessentialtorecognizeinMozambiqueandneighbouringcountriescametheconnectionbetweenthelimitstoadaptationThe1.5-degreeCelsiustargetisnotanarbitrary,toapproximatelyUSD1.5bn,butwithlowinsuranceandresultingresidualdamagethatitistoolatetonegotiatednumber,itisaplanetarysafetyvault.penetration,onlyanegligibleportionofthelossesmitigate(byreducingemissions)oradaptto.ThisisOurforecastglobaltemperatureincreaseisnotwasinsured(MunichRe,2023b).challengingtoquantifyletaloneallocateresponsibil-compatiblewiththeParisAgreement.However,aitiesandbothadaptationcostsandlossanddamage1.5°Cfutureisstillachievable.WedescribehowS&PGlobal,whichgivescountriescreditratings,hascompensationarecentralpointsofcontentionininDNV’supcomingPathwaytoNetZeroEmissionsassessedclimate-changeimpactsonGDPfortheinternationalclimatenegotiations.reportwhereweoutlineapathwaytoanet-zeroIPCCclimatechangepathway'RCP4.5'(basedonenergysystemthatiscompatiblewiththecontinuedcurrentpoliciesandresultantGHGconcentrationsAvoidingplanetaryrisksgrowthofglobalGDPandinlinewithcurrentprojec-withanaveragetemperatureincreaseinthe1.1°CtoTherewillbeadramaticuptickinclimate-relatedtionsfromtheIMFamongothers.Theimportant2.6°Crange).S&Pestimatedthat4%ofworldGDPrisksandrelatedlosseswitheveryincrementoftakeawayisthattheeffectsofclimatechangewouldwouldbeexposedtolossesfromphysicalclimateglobalwarming.Scientistsarealsowarningagainstbesignificantlylowerinthe1.5°Cscenario—morerisksby2050,butwithsignificantregionalvariationclimatetippingpoints(McKayetal.,2022;IPCC,thanjustifyinganyadditionalinvestmentneededforsuchas10%to18%ofGDPfortheSouthAsiaregion.2021)—criticalthresholdsbeyondwhichasystemfasterdecarbonizationandamorejusttransition.CONTENTSDEMANDELECTRICITYRENEWABLESFOSSILFUELSFINANCEPOLICYEMISSIONSREGIONSAPPENDIXDNVEnergyTransitionOutlook2023Highlights6POLICYANDTHEENERGYTRANSITIONThischapterexplorespoliciesimpactingtheenergyofexpectedcarbonpricedevelopmentsacross6.1Policyandtheenergytransition�108transitionanddescribes12policyconsiderations10definedglobalregions.directlyfactoredintoourOutlook.6.2Thetransitioncontextshapedby10opposingforces�110Wepresentahigh-leveloutlineofthestatusWediscussfourkeyissuesaffectingtransitionofpolicyintheOutlookregions.dynamicsanddescribe10opposingforcesthatshapethetransition.WeconcludebydescribingthepolicyanalysisandfactorsinfluencingourOutlookandappliedWeoutlineourviewonapolicymaker’stoolboxregionallyacrossourforecastperiod.withavailablepolicyoptionstoadvancethetransition.Thenwedemonstratethepolicytoolboxinselect6.3Thepolicytoolbox�111energyareasandsectors,followedbyadiscussion6.4SynopsisonthestateofpolicyinETOregions�1166.5PolicyfactorsintheETO�118107CONTENTSDEMANDELECTRICITYRENEWABLESFOSSILFUELSFINANCEPOLICYEMISSIONSREGIONSAPPENDIXDNVEnergyTransitionOutlook20236.1POLICYANDTHEENERGYTRANSITIONDNVnotesfourkeyissuesgainingprominencegloballysincelastyear’sETO.Thischapterexplorespoliciesimpactingtheenergytransition.Theprioritylistforpolicy-makersislong—infrastructure,productioncapacity,permitting,demandcreation,and1.Deliveryislaggingworldclimatecommitmentsmaintainingenergysecuritywhilekeepingcostsundercontrol.Thestakesarehigh.UnlessTheannualNetZeroStocktake(NZT,2023)putssightsaresetoncollaborationandspendingontransitionopportunitiesinagloballyParisAgreementachievementintoseriousquestioninclusivemanner,emissionreductionswillfailinthelow-incomeregions,withcascadingandshowstheurgencyandneedforactionoverrisksandplanetarycrisisasthefutureoutcome.Tappingintothepolicytoolboxwedescribeannouncements.Itfindsthatcountry-levelnet-zerobelowcanhelpthetransitionstaythecourse.targetscoveralmostall(92%)oftheglobalGDPandthevastmajority(88%)ofglobalGHGemissions.InMultipleandoftenopposingforcesareshapingtheFIGURE6.172countries,net-zerotargetshavelegalforce,andtransitionandaretrackedinouranalysis(Table6.1).PolicyfactorsincludedinourOutlooktarget-settingatthecompanylevelisexpanding.ThekeychallengeforpolicymakersismanagingHowever,net-zerointegrityislaggingintermsofshort-termpressureswithoutmakingdecisionsor1.Renewable2.Energystorage3.Zero-emissionrobustdeliveryplans.investinginenergyassetsthatunderminelong-termpowersupportsupportvehiclesupportsocietalgoalssuchastheParisandBiodiversityThisisindeedproblematic.The1.5oCobjectiveisaAgreements.4.Hydrogen5.CCSsupport6.Energy-efficiencyphysicalscientificlimitabovewhichclimatechangeInherstateoftheunionaddresson13September2023,Europeansupportstandardsthreatensthestabilityofplanetaryhealth(IPCC,2023).CommissionPresidentUrsulavonderLeyenreiteratedEurope's‘Polycrisis’,asuitablewaytodescribeacoalescencePolicymakersandthecommunitiestheyrepresentarecommitmenttotheenergytransition,butwithaprotectionistedge:ofcrises,wasthecatchwordwhenworldleaders7.Bans,phase-8.Carbonpricing9.Fuel,energy,andalreadybattlingimmenseclimate-changeimpacts"Fromwindtosteel,frombatteriestoelectricvehicles,ourambitionbegantheyearattheWorldEconomicForuminoutplansschemescarbontaxation(seefactboxpage105)atanaverageglobaltemper-iscrystalclear:thefutureofourcleantechindustryhastobemadeDavos.Theenergytransformationhasbeen,andis,atureincreaseofaround1.1oCsince1880(NASAEarthinEurope."Imagecredit:CC-BY-4.0:©EuropeanUnion2019centrestageinthisyear’snewscycleandthereis10.Airpollution11.Plasticpollution12.MethaneObservatory,2023).Extremeweatherevents—heat-–Source:EP.apolicyracetorespondtointerrelatedcrises(e.g.interventioninterventioninterventionwaves,drought,storms,wildfires,andfloods—areclimatechange,environmentaldestruction,inflation,amongthecostliestdisasters(MunichRE,2023a,b).areplayingoutagainstabackdropofgeopolitics,security)whichdirectlyimpactsthetransition.WeStayingwithin1.5oCmeansroughlyhalvingCO2disruptionofenergymarketsfromRussia’sinvasioncontinuouslymap,track,andassesssuchresponses,emissionsby2030andreachingnetzeroaroundofUkraine,andpandemic-relatedsupply-chainandproposals,andlaw-makingfortheirlikelyimpacts.mid-century(IPCC,2023).securityconcerns.AttentiontoenergyindependencePolicyinputs(Figure6.1andSection6.5)reflecthasalsointensified,withmountingfocusonChina’spolicydevelopmentsandprovisionssincelastyear's2.Thegeopoliticalbackdropdominantpositionincriticalmaterialsandenergytech-forecast.Amongleadingeconomies,theenergytransitionnologiesrelevanttoanet-zerofuture.Criticalmineralshasbeeninvigoratedandpropelledbyarealraceinindustrialpoliciesandsupportforpositioning108incleanenergyvaluechains.TransitionpoliciesCONTENTSDEMANDELECTRICITYRENEWABLESFOSSILFUELSFINANCEPOLICYEMISSIONSREGIONSAPPENDIXDNVEnergyTransitionOutlook2023arenowfullyentrenchedinthenet-zerotransitionlow-carbonactivitiesrepresentedonlyaminorsharebytheGlasgowPact.Thecombinationofmissingalternativetoexpensiveimportednaturalgas(Thediscourse.Severalstudieshavedocumentedthatoftotalinvestment.Forexample,low-carbonplayssupportandinsufficientcarbonpricing(coverage,Economist,2023b;IMF,2022a),and,indeed,Chinatheenergytransitionismineral-andmetal-intensiveaccountedforjust12%of2022capitalexpenditurepricelevel)isholdingbackthetransitioninthehasboosteditsowninvestmentincoaloverthepast(e.g.WorldBank,2020;IRENA,2023a).Reserves,amongsupermajorsExxonMobil,BP,Shell,TotalEn-regionswherepopulationandenergydemandareyearinresponsetobothmarketforcesanddroughtandindustryownership,aregeographicallyconcen-ergies,andChevron(InfluenceMap,2022).TheIEAgrowing.Amonglow-incomecountries,thereisconditionswhichhaveplaceditshydropowertratedinmanycases,andthereisalsothechallengefindstheoilandgasindustrycapitalspendingonlittledisincentivetoinvestingincoalasacheapersourcesunderstress.ofresponsiblyandsustainablyscalingcapabilitiesforlow-emissionalternativestobelessthan5%ofitsminingandrefining.upstreamspendingin2022(IEA,2023c).ThelargestImage:courtesyUNFCCCCOP27state-ownednationaloilcompanies(NOCs)inBrazil,109Trade,climate,energy,andindustrialpoliciesareRussia,India,China,andSouthAfrica(BRICS)areincreasinglymeshedinincentivesencouragingmakingonlylimitedprogressinaligningtheirinno-domesticmanufacturingand‘friend-shoring’throughvationspendingwithlow-carbongoals(Jaffeetal.,supply-chainnetworkswithallies.Theconceptof2022).WehaveyettoseearobustandforthrightnationalsecurityisbroadeningtoincludeenergyasresponsefromthehydrocarbonindustrytoourseenintheUSDefenseProductionAct(2022)thatfinding,withwhichtheIEAnowconcursforthefirstaimstospurproductionofcleanenergytechnology.timethisyear,thattheworldisatthe“beginningofSeedetailedcoverageontheshiftinggeopoliticaltheend”ofthefossil-fuelera,whichwillpeakbeforelandscapeintheintroductiontothisreport.2030(Birol,2023).3.Stayingpoweroffossilfuels4.MissingclimatefinanceandcarbonpricingDespitegovernmentobjectivesseekingtocurtailextendfossil-fuelinvestmentcarbon-intensiveenergy,tightmarketconditionsinNon-fulfilmentoftheannualUSD100bnpledgebothoilandgashaveseenhighpricesandupstreamfromdevelopedtodevelopingcountriesnotonlyoilandgasinvestmentsrising(Nakhle,2023).Capitaljeopardizesclimatejustice,butalsodelayseconom-spendingbyoilandgascompaniesisgrowing,icallyviabledecarbonizationprojects.TherewasadrivenbyasustainedfavourablecommodityshortfallofaroundUSD17bnin2020asassessedpriceenvironment,strongcashflows,andcostbytheIndependentHigh-LevelExpertGrouponinflation(Xuetal.,2023).DNV'sEnergyIndustryClimateFinance(Songweetal.,2022)attherequestInsights2023—TrilemmaandTransitionfindsthatoftheEgyptianPresidencyofCOP27andtheUKagreaterproportionofoilandgasrespondentsPresidencyofCOP26.TheExpertGroup’sanalysissaytheywillincreasetheirinvestmentsinhydro-alsoconcludedthat,separatelyfromtheUSD100bncarbonsintheyearahead.Evidenceoftransfor-peryear,USD1trnannuallyinexternalfinancetomationofprivateinternationaloilcompanies(IOCs)developingcountries(otherthanChina)by2030isintoenergycompaniesisbrittle.InvestmentinneededtodelivertheParisAgreement,reinforcedCONTENTSDEMANDELECTRICITYRENEWABLESFOSSILFUELSFINANCEPOLICYEMISSIONSREGIONSAPPENDIXDNVEnergyTransitionOutlook20236.2THETRANSITIONCONTEXTSHAPEDBY10OPPOSINGFORCESWechoosetohighlight10opposingforces.Thisisnotcreativedestruction,someforcesaretriggeringchange,anexhaustivelistbutincludesthetopicswhichhavewhileothersarehindrancesthatupholdthestatusquo,dominatedtheenergytransitiondiscoursesinceourmakingforarathermessytransitionwhichnevertheless2022Outlook.InkeepingwithSchumpeter’stheoryofremainsorientatedtowardsdecarbonization.TABLE6.110opposingforcesshapingthetransition1.LandmarkglobalagreementsLet-downinimplementation6.MorerigourinpledgesInsufficientriskgovernanceTheParisAgreement2015andtheBiodiversityAgreementFossilCO2andmethanemissionsareincreasing,deforestationUNtaskforcerequiresnon-stateentities’pledgestohaveStateentitiesandpolicymakerspayinsufficientattentionto2022uniteobjectives.Netgainfortheenvironmentistoberemainshigh1.Planetaryboundariesarebeingcrossed,concreteinterimtargetsandsetoutwaystoreachnetzerotransitionandphysicalclimateriskstoinformtheirownpledgespursuedinparallelwithnetzero.underminingcriticallife-supportingearthsystems2.inlinewithIPCCandIEA1.5oCpathways10.anddecision-making.2.PublicsupportforclimateactionCompetingconcernsonthepublicagenda7.CrackdownoncorporategreenwashingGreenhushingandjurisdictionaldelaysClimatechangetopsworldrisks3andimpactsabound.Risingcostoflivingandshort-termconcerns5threatentoThereispressurefromregulatorsandactiviststoendCompaniesareoptingforbareminimumtransparencyonPublicpollsshowdemandandsupportforclimateaction4.distractworldleadersanddeflatetransitionpolicy.misleadingstatements(e.g.EUGreenClaimsDirective,environmentalcommitments.Mandatoryapplicationofstan-ISSB'ssustainabilityandclimate-relateddisclosures).dardsrequiresregulatoryendorsement.3.ProgressivecleanenergypolicyBottlenecksFront-runnershaveprogressedpolicyframeworkswithInadequategriddevelopmentcommensuratewithnetworks’8.SurgeinclimatelitigationCorporatesescapingresponsibilitiesincentivestomanufacturing,economy-widedeployment,importance.Lengthysiting/permittingprocesses,skillsshortage,ClimatecasesagainstgovernmentsandcorporationsgrowTheNetZeroInsuranceAllianceisdisintegrating12,andtheShellandmarketredesignforhighrenewablesintegration.andsupply-chaincostinflation,causingcleanenergyprojectlogjam.year-on-yeararoundtheworldforcourtstodeterminecaseexemplifiesattemptsofcorporatemanoeuvringtolitigation:responsibilities11.appeal,namechange,relocation13.4.RecordspendingonrenewablesUnevengeographicaldistributionCleanenergyinvestment(2022),includingonenergy90%ofcleanenergyspendingisfromadvancedeconomiesand9.InvestorspropelthetransitionTroublescrowdinginmainstreaminvestmentsefficiency,grew19%from2021levels6andisexpectedtoChina.Only1.5%ofrenewableinvestments(2010–2020),wereinInitiatives,e.g.InstitutionalInvestorsGrouponClimateRealandperceivedgeographical-,technology-,andproject-extenditsleadoverspendingonfossilfuelsin20237.Sub-SaharanAfrica8.Popularfossil-fuelsubsidieshamperChange(IIGCC)focusonParis-alignment,alsocallingbanksspecificrisksinlow-incomeregionscontinuetodeterprivaterenewablescompetitiveness9.toaction.Emergentreformofmultilateralfinanceinstitutionssectorinvesting15.Inhigh-incomeregions,unrealisticpriceandwillenhanceclimatefinanceand‘fit-for-purpose’responselicencefeeexpectationsfromnationalgovernmentshobble5.StrongpaceforrenewablesinpowerCriticalsolutionshaveunfaircompetitiontopolycrisis14.renewablesauctions.Windandsolararecost-effectivesourcesofnewbulkpowerHydrogen,CCS,DAC,SAFascriticalnet-zerosolutionsmeetgeneration.Energypriceshocksmaketheeconomiccaseskewedcompetitionfromunabatedfossilfuelsandinsufficient10.Front-runnersadvancesolutionsSysteminertiafornon-fossilsmorecompelling.carbonpricing.Solutionsfordeepdecarbonizationareavailable.MultipleNon-power,low-carbontechnologiesproductioncapacitiesarepublic-privateinnovationinitiativesarebearingtheweightscalingslowly.Decommissioningofexpensivecapitalequipmentofbringingthemtocommercialreadiness.beforeendoftechnicallifetimesisundesirable.1.Friedlingsteinetal.,2022,2.Rockströmetal.,2023,3.WEF(2023),4.OECD(2022),5.Gebrekal(2023),6.IRENA(2023b),7.IEA(2023c),8.IRENA(2023b),9.Blacketal.,202310.UN(2022a),11.Setzeretal.,(2022),12.Smithetal.(2023),13.Owens(2023),14.Gordon(2023),15.Songweetal.(2022)110CONTENTSDEMANDELECTRICITYRENEWABLESFOSSILFUELSFINANCEPOLICYEMISSIONSREGIONSAPPENDIXDNVEnergyTransitionOutlook20236.3THEPOLICYTOOLBOXconditionsthatde-riskinvestmentsandbusinessThepolicytoolboxatworkengagementinthetransition.ListedbelowarenationalandinternationalpolicyInpreviousOutlooks,wehavedetailedwhatwelabelexamples.Thelistsarenotexhaustive,butexemplifythe‘policytoolbox’.AllpolicymakershaveagenericBeyondgoalsandfiscalmechanisms(likecarbonthepolicytoolboxcategoriesinselectenergyareastechnology-opportunityspaceandasuiteofknownpricesorenergytaxreforms),policymakersneedandsectors.Policyexamplesarealsogiveninpolicycategorieswithprovenmeasuresavailablefortoallocateequalattentiontopolicieswhich‘push’Chapter8onOutlookregions.catalysingstructuralshiftsinenergysystems.and‘pull’technologies.Technology-pushpolicyincentivizesandfosterstechnologydevelopment,Goals&POWER&GRIDSForclarity,thepolicytoolboxanditshigh-levelnewproduction,andsupplyinfrastructures.PrioritiescategoriesareillustratedinFigure6.2.Initsreal-Demand-pullpolicystimulatescertaintyondemand,—174countrieshaverenewablepowertargets(REN21,2023a)—e.g.Germany80%by2030,theUSandCanadaforworldapplication,atthelevelofsectorsorsupplymarketdeployment,andofftakearrangements.decarbonizedpowerby2035.Someregionshaveeconomy-widerenewabletargets—e.g.EU2030binding42.5%chains,blendedpolicies(policypackages)areoffinalenergyconsumption,orDenmarkfora100%renewableenergysupplyby2050withahighrateofusedconcurrentlytocreatepredictableframeworkelectrificationandsectoralintegration.FIGURE6.2Fiscal—Powersectorsarepartofcarbonpricingschemesglobally.ReformofenergytaxationforincreasingalignmentwithPolicytoolboxenvironmentalperformanceandclimateobjectivesisseeninEurope(EU).GOALS&PRIORITIESFISCALPOLICIES—EUinvestmentsupportemphasizesoffshorerenewablegenerationandoffshorewindmanufacturingsupplychainsas‘strategicnet-zerotechnology’,eligibleforStateaidunderitsTemporaryCrisisandTransitionFramework(TCTF).Purpose:StructureandinformnationalandsectoralpolicyPurpose:IntegrategoalsandleveltheplayingfieldTheUSInflationReductionAct(IRA)offersinvestmenttaxcreditstomanufacturingfacilitiesforcleanenergyequipment.—Plans—e.g.long-termlowgreenhousegasemission—NationalbudgetingandgovernmententitiesaligningwithTechnology-—Nuclearpowerreceivesinvestmentsupport,alsoforlifeextension,andisprioritizedforenergysecurityreasonsdevelopmentstrategies(LT-LEDS),NECPs(EU)toinformshort-SDGs,nature,orclimategoalspush(e.g.China,EuropeincludingtheUK,Japan,SouthKorea,andtheUS).andmid-termpriorities,policies,andinvestmentpipelines—Fiscalmeasures—e.g.carbonpricingschemes,energytaxation—Clearinvestmentsignalsandattentiontospeedgridinfrastructureinvestmentsanddigitalization.Regulationto—Industry,sectoragreements—e.g.IMO,ICAOdecarbonizationreformreflectingenvironmentalperformance,fossil-fuelstreamlinetheapprovalprocessforgridsandinterconnectionsisneeded–e.g.withinitialstepsbeingtakenintargetsandstrategiessubsidyremovalEuropeandNorthAmerica.—Public-privatepartnerships—jointinnovationundertakings—Utility-scaleprojects,inmostregions,areallocatedonamarketbasisthroughcompetitivetenderingprocedures/leveragingprivatesectorresourcesauctions,triggeringdemandandprovidingastablerevenueguaranteetoprojectdevelopers(contractsfordifference,(e.g.FirstMoversCoalition)CfDs).Atargetedmarketuptake(capacityquantity)isachievedbycombiningtendervolumeswitharenewableenergyobligationonelectricitysuppliers,orbyrequiringaspecifiedpercentageofrenewablesinthemix.IntheUS,POLICYTOOLBOXtheIRAoffersproductiontaxcredits.TECHNOLOGY-PUSHDEMAND-PULL—Complementingtendersbyaddingstorageforgridresilienceiscommon(e.g.Europe,China,NorthAmerica).SomeregionsrelyoncapacitymarketsforareservemarginwhichinvolvesapaymentmechanismtoexistingornewPurpose:StimulatetechnologydevelopmentandcostreductionPurpose:Stimulatedemandandincentivizemarketuptakeflexiblecapacityforresourcestobeavailabletomeetpeakdemand.—Fundingsupport—e.g.R&D,demonstration,investmentsin—Marketrequirements–e.g.fuelblending,zero-emissionDemand-pull—Phase-outpoliciesforcoalarepredominantlyahigh-incomeregionphenomenon–e.g.Europeaccountsforalmostproductioncapacityandcriticalsupplychainsmandates,phase-outpolicy(ICEs,fossil-fuelboilers),halfofannouncements.renewablecapacityquotas,carbonintensityreductiontargets—Infrastructureinvestments—e.g.grids,charging,—Nuclearreliesonoperationalsupport–e.g.the(US)IRAproductiontaxcredit.refuellingcorridors—Economicinstruments–e.g.investment/purchaseandoperationincentives,feed-intariffs,contractsfordifference,—Technicalrequirements—e.g.emissionlimits,fueleconomy,cleanpublicprocurementefficiencies—Mandatorydisclosure–e.g.oflow-orzero-carbonuse,—Taxonomy—e.g.eligiblesustainabilityinvestmentslifecycleemissions111CONTENTSDEMANDELECTRICITYRENEWABLESFOSSILFUELSFINANCEPOLICYEMISSIONSREGIONSAPPENDIXDNVEnergyTransitionOutlook2023Goals&HYDROGENGoals&CARBONCAPTURE,UTILIZATION,ANDSTORAGE(CCUS)&DIRECTAIRCAPTURE(DAC)PrioritiesPriorities—Nationalhydrogenstrategiessetpriorities,timelines,andtargets.ThesehavebeenmultiplyinginOutlookregions,—TheUKgovernmentCCUSInvestorRoadmapwithitsCCUSdeliveryplanfrom2021to2035.Fiscalandaremostconcreteintermsofhydrogenenergyinregionswithnet-zeromid-centuryambitions.—TheEU’sCCUSSETPlanstrategyto2030.—Carbonpricingimpactscost-competitivenessagainstconventionalfossil-fuelledtechnologies(captiveproductionFiscal—Carbonpricingimpactsthecost-competitivenessofCCS.at/orclosetoindustrialconsumer).Atasufficientlevel,itcanalsoincentivizelow-carbonproductionroutesfor—TheCarbonEmissionsReductionFacilityofthePeople’sBankofChinahasastructuralmonetarypolicyinstrumenthydrogenasafeedstock,whichfurtherreducesthecostoflow-carbonproductionroutesthroughcostlearning.providingfinancialinstitutionswithlow-costloanstosupportdecarbonizationprojects,includingCCUS.—Carbonpricingimpactscost-competitivenessofbluehydrogenversuselectrolyser-basedhydrogenproductionroutes,whichistiedtothecost-competitivenessofCCS.—Fundingprogrammesprovideinvestmentgrants/loanstoCCSinstallationsandrelatedinfrastructure.ExamplesincludetheUSInfrastructureInvestmentandJobsAct(IIJA);EUInnovationFundwithsupportofupto60%of—Europe(EU)isprogressingreformofenergytaxationforincreasedalignmentwithenvironmentalperformance.CAPEX;UKCCSInfrastructureFundandthe2023fundingannouncementofuptoGBP20bn(aroundUSD25bn)forLow-andzero-emissionfuelsandheatingfuelswillbesubjecttolowerminimumratestopromotehydrogenuse.CCUSapplications,includingforDAC,overthenexttwodecades;Norway’ssupporttotheLongshipdemonstrationproject,andgranttoindustrial-scaleCO2capture(HeidelbergCement);theUSChipsActsincreasingR&DfundingTechnology-toDAC;Canada'staxcreditof60%(capitalcosts)forDACprojects.push—RelaxedStateaidrulesintheEU’sTemporaryCrisisandTransitionFramework(TCTF)incentivizeproductionofTechnology-—Fundingprogrammesprovideinvestmentgrants/loanstopromotehydrogenproductionplants,clusterandCCSequipmentwithaidupto100%ofthetotalinvestmentcostifgrantedinacompetitivebiddingprocess,andpushinfrastructuredevelopment(e.g.theIPCEIHy2Useproject).Fundingisalsoavailableforinternationalprojectstootherwiseupto45%.accelerateglobalhydrogendevelopments–e.g.Germany’sInternationalPtXHubinitiative,andEUTeamEuropeRenewableHydrogenFund.Demand-pull—USexemplifiessupporttoOPEXinadditiontoCAPEX.TheIRAextendssupport(45Q)toCO2capturedandstored(USD85)orreused(USD60).DACtaxcreditsareUSD180(stored)andUSD130(reused).—Supportforcapitalexpenditure(CAPEX)isthedominantearly-stageformofsupporttoco-financeinfrastructureandproductioncapacity.Thisisavailabletodecarbonizeexistinghydrogenproduction,newmerchantproduction,—NorwayextendsgovernmentfundingtoOPEXprovidedprojectssecuresufficientownfunding(e.g.FortumOslo).andfortransformationprojectsforhydrogen-basedfuels(i.e.e-fuels,ammonia).Demand-pull—TheNorthAmericaandEuroperegionshavesupporttobothoperatingexpenditure(OPEX)andCAPEX.—The45VhydrogenproductiontaxcreditintheUSIRAsupportslow-carbonhydrogenproducedbasedoncarbonintensity(kgCO2/kgH2).Canadaisintroducingataxcreditbasedontheemissionintensityofproduction.—TheEuropeanHydrogenBankwillacceleratetherenewablehydrogenmarketintheEUandEuropeanEconomicAreabyprovidingoperationalsupporttohydrogenproduced,withspillovereffectsforhydrogenpriceanddemandinenduse.AfixedpremiumperkiloofH2fora10-yearperiodwillbesetviaauctions.—TheEURenewableEnergyDirective,REDIIIambitionforatleasta29%renewableshareinfinalenergyconsumptionintransportby2030includestargetsfornon-biologicalrenewablefuels.PleaseseeDNV’sHydrogenForecastto2050(2022a)foradditionalcoverageofhydrogeneffortsinETOregions.BrevikCCS–theworld’sfirstCO2-capturefacilityatacementplant.Imagecourtesy,HeidelbergCement112CONTENTSDEMANDELECTRICITYRENEWABLESFOSSILFUELSFINANCEPOLICYEMISSIONSREGIONSAPPENDIXDNVEnergyTransitionOutlook2023Thepolicytoolbox—demonstratedondemandsectorsTRANSPORTATIONBUILDINGSMANUFACTURINGTRANSPORTATIONBUILDINGSMANUFACTURING—InternationalMaritimeOrganiza-—China's14thFive-YearPlanfor—China'ssectoralguidelinesforMaritime&Aviation:—Fundingtoboostproductionof—TheIRAwithUSD6bnfordemon-tion(IMO)2023StrategyonReduc-BuildingEnergyEfficiencyandindustrialcarbonpeakingby2030.—Governmentinvestmentfundingelectricheatpumps(e.g.USstrationoflow-carbonindustrialtionofGHGEmissionstoreachnetGreenBuildingDevelopment.DepartmentofEnergy).productiontechnologies.DOEzerofrominternationalshipping—Japan’s10-yearGreenTransforma-tomature,scaleandexpandIndustrialHeatShot™todeliverGoals&closeto2050(July2023).—EU’sREPowerEUPlanandEnergytion(GX)BasicPolicyadopted2023.Technology-productioncapacity,relatedinfra-decarbonizationtech(US).PrioritiesEfficiencyDirectivetarget(11.7%pushstructure,valuechains(drop-in—TheInternationalCivilAviationreductionby2030).—SouthKorea’sGreenNewDeal(continued)sustainablefuels+newfuels).—China'sstate-ownedcompaniesOrganization(ICAO)long-term(2020)with2025targets.—Public-privatepartnerships–e.g.directedtodevelopdecarboniza-globalaspirationalgoalforGreenVoyage2050,Greentioninitiatives/technologies.net-zeroemissionsby2050—Australialaw(2023)requiringaboutShippingCorridors,CleanSkies(October2022).5%annualindustryGHGemissionforTomorrow.cutsthrough2030.Road:—EUETS2(buildings,roadtransport)—Removalofcarbonpriceexemp-Road:—Mandatorybuildingenergycodes—19countrieshavepoliciesthat—EUemissionstradingsystemforthosebringingfuelstothetions–e.g.EUETSphase-outof—ICEphase-outpolicy(e.g.EU-wideexistin40%ofcountries(REN21,incentivizeormandatetheuseofmarket(2028).freeallowancesparalleltophasing2023b).Forexample,India'srenewablesinindustry(REN21,(ETS2)forupstreamfuelsuppliersintheCarbonBorderAdjustment2035,countrysignatoriesintheBureauofEnergyEfficiency(BEE)2023b).(2028).Fueltaxationandeffective—FutureelectricitytaxationmodelMechanism(CBAM).AcceleratingtoZeroCoalition).planstoupdateitsbuildingsectorcarbontaxincreaseinregionswithfavourabletoelectrificationis—EVpurchaseincentivesvaryfromcode–EnergyConservationand—Energyefficiencymanagementfossil-fueltaxation,butwithfossil-expected(e.g.revisionoftheEU’s—China'sgradualenrollmentofinsignificantinsomeregionsSustainabilityBuildingCode–to(e.g.China'spolicyformandatedfuelsubsidiesprevailinginsomeEnergyTaxationDirective).energy-intensiveindustriesintocommencementofsubsidytargetreducedenergyconsump-energyintensityreductions,andregions.nationalemissionstradingsystem.declinesinmatureregions,suchastionandcarbonemissionsfor‘reuseandrecycle’rates–e.g.FiscalEurope.FeebatesloweringrunningbothcommercialandresidentialwastesteeltargettoreduceenergyMaritime&Aviation:—Governmentdirectedfundingcostsandbenefitstoownersarebuildings,andaddressingenergyconsumption).—Globalcarbonlevy(IMO(e.g.NationalGreenDevelopmentDemand-commonacrossregions.butalsoembodiedcarbon,wasteFund)anddiscountedlendingfrompull—Targetsandpurchaseincentivesmanagement,andwaterefficiency.—TheIRAprovidesUSD6bnfornegotiations);CarbonoffsettingthePeople'sBankofChina.forFCEVs(e.g.Japan,SouthdemonstrationanddeploymentofandreductionschemeforKorea,California).—Purchaseincentivesortaxcreditslow-carbonindustrialproductioninternationalaviation(CORSIA),—RelaxedStateaidrulestodecar-—Biofuelblendingmandates(e.g.forheatpumps,andelectrictechnologies.pilotingfrom2021.bonizeindustrialproductionIndia20%,Indonesia35%,cookingequipment.—AviationandshippinginEUETS.processes(EU’sTemporaryCrisisMalaysia20%in2025).—TheEUGreenDealIndustrialPlanandTransitionFramework,TCTF).—Higherretrofittingratesof(2023)foratleast40%domesticMaritime&Aviation:buildingsandenvelopesbasedoncapacity,andrecyclingatleast—Increasinglystringentlimitsbansonfossilboilers(e.g.Europe),15%ofcriticalrawmaterial.andtaxcreditsforinsulationandRoad:—Energy-efficiencyimprovements—Pilotanddemonstrationsupport(FuelEUMaritime)andreductionweatherizationofbuildings.—Tighteningoffueleconomyandthroughenergy-efficiency(e.g.Hybritgreensteelsupportedtargets(IMO)forcarbonintensitystandardsforappliances,asforbySwedishEnergyAgency,EUofenergyuse.tailpipeCO2standards.renewableenergyuse.InnovationFund).—Bindingtargetsforsale,purchase,—InvestmentsupporttochargingandblendingmandatesexpectedTechnology-—2030nationalinvestmentplanfornon-conventionalfuelspushandrefuellinginfrastructure.(EUR5.6bn)toreduceemissions(e.g.ReFuelEU).ofheavyindustries(France).PleaseseeDNV’sTransportinTransitionreport(2023a)foradeepdiveonthetransportpolicylandscape.z113CONTENTSDEMANDELECTRICITYRENEWABLESFOSSILFUELSFINANCEPOLICYEMISSIONSREGIONSAPPENDIXDNVEnergyTransitionOutlook2023to20yearsanddependsonpoliticalwillingnesstoforecasters,andconversationwithexpertsinadjustschemeswithincreasinglystringentcapsandacademia,wederiveabestestimateofthetrendsphasingoutexemptions.Inmostjurisdictions,carbonandfuturepricelevelsinexistingschemesforpricesareinsufficienttodrivedecarbonization,butinclusionintheanalysis(Figure6.3).aregraduallygainingmomentumalongwithotherdecarbonizationefforts.However,thereisinsufficient23%ofglobalemissionsarecoveredmomentumtodriveanyoftheworldregionsclosebycarbonpricing(taxesandemissionstothelevelsofcarbonpricingweexpecttoseeintradingsystems).Europeby2050.Basedonresearchincludingrecentpolicydevelop-ments,reviewofstatusreportsfromleadingorganizations,estimatesfromcarbonpricemarketHowwillcarbonpricesdevelop?—23%ofglobalemissionsarecoveredbycarbonpricing(taxesandemissionstradingsystems)Therationaleforcarbonpricingistointroduceacomparedwithjust7%10yearsago.financialincentivetocutemissions.Thepotentialremainslargelyuntapped,andcarbonpricingwill—73carbon-pricinginstrumentshavebeenneedtobeexpandedinbothcoverageandpriceimplementedworldwide,5morethanin2022.levelifitistodrivetransformationalchangestomeettheParisAgreementgoals.Givenpressuresonpublic—USD100bnistherevenuethatETSandcarbonbudgets,therevenuepotentialfromcarbonpricingtaxinstrumentsareapproaching.schemesshouldbeamotivationalfactor.—Almost40%oftherevenueisearmarkedforgreenHighlightsfromannualglobalexpertreferencespending,and10%isusedtocompensatereports—theInternationalCarbonActionhouseholdsorbusinesses.Partnership(ICAP,2023)andtheWorldBank(WB,2023)—are:Maturingcarbonpricingsystemsisalengthyprocess.Forexample,reachingEuropeanETSlevelstakes10114CONTENTSDEMANDELECTRICITYRENEWABLESFOSSILFUELSFINANCEPOLICYEMISSIONSREGIONSAPPENDIXDNVEnergyTransitionOutlook2023Regionalcarbonprice(CP)highlights—NorthAmerica(NAM):Canadahasfederal,—MiddleEastandNorthAfrica(MEA):Net-zeroCBAMexposure.Aswitchtoanabsolutecapand—OECDPacific:(OPA)CPplananimportantroleeconomy-wideCPpolicywithapredictablepriceannouncementswitha2050timehorizonpresageauctioningisexpectedbytheearlytomid-2030s.innet-zeropolicymixandiswellestablishedwithincrease.IntheUS,CPisdecidedatthestatelevelsomelevelofCP.AnnouncementsoncarboncreditAcarbontaxisbeingdiscussedforsmalleremitters,extensivesectorcoverage,andtightenedbyreformandnotassumedtoexpandtoadditionalstates.market(SaudiArabia)andpilotETS(Turkey).outsidenationalETS.Industryabatementmeasures(NewZealand,SouthKorea).JapandecarbonizationVariationinstateandsectorcoverageandfreeManufacturingexposuretoEUCBAM.Theregionalwillincreasinglybeprice-settingafter2040tostrategyincludesseveralcarbonpricingschemes,allocationisreflected.TheregionalaveragecarbonaveragecarbonpricelevelisUSD10/tCO2(2030),achieve2060carbonneutrality.Theregionale.g.amandatoryETSfrom2026onwards.AustraliapricelevelisUSD25/tCO2(2030),USD43/tCO2USD20/tCO2(2040),andUSD30/tCO2(2050).averagecarbonpricelevelisUSD20/tCO2(2030),isstrengtheningitsCPinstrument.Theregional(2040),andUSD56/tCO2(2050).TheeffectiveCPUSD40/tCO2(2040),andUSD90/tCO2(2050).averagecarbonpricelevelisUSD40/tCO2(2030),onindustrialemissionsissome50%lower.—NorthEastEurasia(NEE):Russia,thelargest90/tCO2(2040),andUSD130/tCO2(2050).economyintheregion,hastradeshiftingawayfrom—IndianSubcontinent(IND):Net-zero—LatinAmerica(LAM):SomecountrieshavecarbonEurope,whichlessensCPintroductionpressure.announcement(India2070).IndiaplansacarbonAtCOP26(Glasgow2021),CanadalaunchedtheGlobaltaxesbutatlowlevels,exceptUruguay.SomeplanExistingschemes(e.g.Kazakhstan)remainatlowcredittradingsystem,tradeabledomesticallyandCarbonPricingChallengeaimingfor60%ofglobalGHGtointroduceETSschemes.Forexample,inMexicoCPlevels.Theregionalaveragecarbonpricelevelsuggestedtobeoperationalinthelate2020s,emissionstobecoveredbyacarbonpriceby2030.Chile,thetotransitionitspilottoanoperationalphase.ThereisUSD6/tCO2(2030),USD10/tCO2(2040),andUSDcovering40%ofemissions,butwithnoabsoluteRepublicofKorea,NewZealand,theUK,andGermanyhaveismentionofETSinBrazilandColombia,butlittle20/tCO2(2050).cap.CPdriversareexposuretocarbon-borderjoinedasofmid-2023.clarityontimingandimplementation.Theregionaltariffs/CBAMandrevenuepotential.TheregionalaveragecarbonpricelevelisUSD10/tCO2(2030),—Sub-SaharanAfrica(SSA):DomesticCPinitiativesaveragecarbonpricelevelisUSD10/tCO2(2030),USD25/tCO2(2040),andUSD40/tCO2(2050).areexpectedfrom2035onwards.SouthAfricaUSD25/tCO2(2040),andUSD45/tCO2(2050).proposedtograduallyincreaseitscarbontaxto—Europe(EUR):CPisakeyinstrumenttofundthe2050.Nigeria’sannouncedETShaslittleclarityon—SouthEastAsia(SEA):Therearenet-zeroannounce-greentransition.HigherburdenonEUETSsectorstimingandimplementation.TheregionalaveragementsandemergingCPschemes.Singaporewith(62%emissionsreductiontargetby2030).ExpansioncarbonpricelevelisUSD2/tCO2(2030),USD10/steadyCPincreasethroughto2030.Indonesiahasinscope(ETS1includingmaritime;ETS2buildingstCO2(2040),andUSD20/tCO2(2050).begunitsfirstETSstageforpower(2023).Malaysiaandtransportfrom2028).FreeallocationsarephasedplansavoluntaryETSscheme.Exposuretocarbon-outin2034,andthereisadecliningcaptrajectoryto—GreaterChina(CHN):ThenationalETS,targetingbordertariffs/CBAMaffectingexportactivitiesandzeroaround2040.Industryabatementmeasureswilllargeemitters,evolvesslowly.Expansionofscope,net-zerosupply-chainattentionarekeyCPdrivers.Theincreasinglybeprice-setting.Theregionalaverageeventuallycoveringeighthigh-emittingindustries,regionalaveragecarbonpricelevelisUSD10/tCO2carbonpricelevelisUSD150/tCO2(2030),USD220/willhappengraduallyto2030,likelymirroringEU(2030),USD30/tCO2(2040),andUSD50/tCO2(2050).tCO2(2040),andUSD250/tCO2(2050).115CONTENTSDEMANDELECTRICITYRENEWABLESFOSSILFUELSFINANCEPOLICYEMISSIONSREGIONSAPPENDIXDNVEnergyTransitionOutlook20236.4SYNOPSISONTHESTATEOFPOLICYINETOREGIONScountry-specificmodalities,andtechnicalstandardsinvestments,aspartoftheBeltandRoadInitiative,aredevelopedseparately,riskjeopardizinganeffective,extendingintoAsia,Africa,theMiddleEast,andLatinThesummaryoftransitionpolicyintheOutlookregionspresentedbelowsuggestsharmonized,andglobalresponsetoaddressclimateAmerica.thathigh-incomeregionsarepushingforwardtotransitionanddecarbonizeallenergychange.Araceamongthedeepestsubsidypocketssubsectors.TheseregionsarealsoincreasinglytakingchargeinindustrydecarbonizationcoupledwithprotectionismisonethatemergingInLatinAmerica,majoreconomieshaveadoptedtoprogresstechnologiessuchasCCSandlow-carbonhydrogen.Otherregionscontinueeconomieswithindustrializationaspirationscannotcarbon-neutralityambitionsby2050(Argentina,Chile,tofocuspredominantlyonpowersectortransitionswhilealsopositioningthemselvesforcompetein(FT,2023).Thereisariskthatnew,protec-Colombia,andBrazil).Somecountrieshavepolicyhydrogenenergy.TheenergytransitionofeachOutlookregioniscoveredinChapter8.tionistindustrialpolicieswillservetoshiftdecarboni-focusedonhigherrenewablepowerpenetration,zationresourcestothefewratherthanexpandingthemexport-focusedhydrogenproductionwithexpandingPolicydevelopmentsamonghigh-incomeregionsandrevisionoftheEnergyTaxDirective.Concernedforthemany.Whileunderstandablethattransitionco-financingpartnerships(e.g.Europe,Japan,andTheNorthAmerica,Europe,andOECDPacificregionsaboutenergyindustryrelocation,theEUlaunchedspendingaimstoaccrueprimarilydomesticbenefits,SouthKorea),andontransportelectrification.Othershavemid-centurynet-zeroambitions,andtheirenergyitsGreenDealIndustrialPlan(February2023)tothedownsideisthatsubsidypackagesareperceivedashavenoconsistentpublicpolicytowardsthetransition,demandsarestable.Animmensescaleofgovernmentcomplementexistinginitiatives(EUGreenDeal,Fitthreatstootherregions’competitiveness.Forexample,andareinfactreversingpolicytofavourfossilfuelsinterventioninenergysystems,andcompetitioninfor55package,REPowerEU)andenableasupportivetheEUGreenDealIndustrialPlanandrelaxed(e.g.Mexico,Venezuela).cleantechsupportandinvestmentstimulus,areinenvironmentforEuropeanmanufacturingcapacity.Stateaidrules,aredirectresponsestotheUSIRAplaywithcomprehensivepolicypackagesaimingtoInOECDPacific,SouthKorea’s2050CarbonNeutral(seeDNV’sseparatereportonEnergyTransitionNorthInSouthEastAsia,Singaporeisagreeneconomysteereconomy-widedecarbonization.TherearelargeStrategyandGreenNewDealcompriseUSD135bnAmerica(DNV,2023c).Furthermore,protectionismpolicypioneer.Regionalrenewablepowerpoliciesdiscrepanciesintermsoffiscalpoliciessuchastheininvestmentsinbothgreenanddigitaltechnol-andretractionfrommultilateraltradejeopardizesarecommon,inwhichVietnamisaleader.Countriesinclusionofcarbonpricinginthepolicymix,asseeninogies.WithitsSixthStrategicEnergyPlan,Japan’sthebenefitsofglobalcooperationintechnologywithplansforacoal-to-gasswitcharestrugglinggiventhepreviouscarbonpricehighlight.governmentplanstoinvestmorethanUSD1trn(JPYdevelopment,productionandtransfer,andalackLNGcostvolatilityfromtheinternationalgrabforgas.150trn)indecarbonization(GreenTransformation(GX)ofcooperationislikelytopushuptechnologycosts,Ingeneral,nationalenergytransitionframeworkslackInNorthAmerica,Canada’s2030EmissionReductionBasicPolicy).Australia’sgovernmentwillinvestaroundmakingthetransitionmorecostlyforeveryone.concreteimplementationplans(Fallinetal.,2023).Planhasaccompanyingmeasurestoachievesector-USD17bn(AUD24.9bn)indecarbonizationoverthisToacceleratethetransitionfromunabatedcoalgener-by-sectordecarbonization.IntheUS,theInfrastructuredecade,andNewZealand’snet-zeroclimateplanisPolicydevelopmentsinmedium-incomeregionsationandconsidernet-zerocommitmentsamongInvestmentandJobsAct(IIJA)andtheInflationsupportedbytheClimateEmergencyResponseFund,GreaterChina,SouthEastAsia,LatinAmerica,themanyASEANcountries,bilateralandmultilateralReductionAct(IRA)arelandmarkbillstoaddressgeneratedfromemissionstrading,andearmarkedforMiddleEastandNorthAfrica–butnotNorthEastfinancingwillbeimportant,suchastheJustEnergyclimatechange.UnliketheUS,Canada’sdecar-climatespending.Eurasia—arecharacterizedbyhighannualgrowthinTransitionPartnershipswithIndonesiaandVietnam.bonizationregulationcombinesincentivesaswelldemandforpower.Amongtheseeconomies,Greaterasdisincentives(e.g.explicitcarbonpricing,ICETheraceforleadershipincleantech,inwhichcountryChinaisafront-runnerinthetransition.Long-termIntheMiddleEastandNorthAfrica,countriesarephase-outpolicy).Europehassteppedupitstransitionlegislationmergesindustrialanddecarbonizationplanningpermeatestheentireenergysystemwithsettingincreasinglyhighertargetsforrenewableeffortsandalltoolboxcategoriesareinplay.Plansareobjectives,clearlyaddsmomentumtothetransition.workingguidance,targets,andsupportmeasurespowerdeployment.HydrogenpoliciesfocusongreendetailedandfiscalmeasuresincludecarbonpricingHowever,tradeandpolicymeasuresspirallingintospecifiedinfive-yearplans(e.g.14thFYP2021–2025),andbluehydrogen,andderivativesproduction,alsosteeringforemissionspeakingin2030andcarbonwithambitionstocaptureglobalhydrogenmarkets.neutralityby2060.ItsoverseasenergyinfrastructurePoliciesfordomesticuseofhydrogendemandare116CONTENTSDEMANDELECTRICITYRENEWABLESFOSSILFUELSFINANCEPOLICYEMISSIONSREGIONSAPPENDIXDNVEnergyTransitionOutlook2023underdevelopment(e.g.intheUnitedArabEmiratesbutalsoforanysubstantialprogressinrenewableHowweareconsideringpledgesinouranalysisandOman).Majortransitionprojectsinvolvestate-energy.SouthAfricahasthemostextensivegridinownedenergycompaniesorsovereignwealthfunds.theregion,butarguablyoneofthemostproblematic2023seesthefirstglobalstocktakeasakeyInouranalysis,wecloselymonitorpledgesrelatedworldwide(Allen,2023).OfficialdevelopmentdeliverableofCOP28inDubai,intheUnitedArabtotheParisAgreementbutdonotpre-setourEETOInNorthEastEurasia,decarbonizationpolicyinassistanceandbilateralandmultilateralfinancingEmirates.TheprocesswaskickedoffatCOP26modeltoachievethem.AnnouncementsareinitialCentralAsiaisintheearlystages.TheongoinginstitutionsplaykeyrolesintheIndianSubcontinentGlasgow(2021).Itismeanttoassessthecollectivestepsinplanning,buttheirachievementdependsRussianwaronUkraineisputtingtheenergytran-andSub-SaharanAfricaregions,oneexamplebeingprogressofeffortstoaddressclimatechangeandentirelyonadequatepolicies.Mostcountrieshavesitionthereonhold.However,renewableenergywilltheJustEnergyTransitionPartnershiptohelpSouthmeetParisAgreementgoals.SimonStiell,Exec-inadequateshort-termpolicies,despitetheboldestplayakeyroleinUkraine’senergysectorrecovery,Africa’stransitionawayfromcoal.However,acrossutiveSecretaryoftheUnitedNationsFrameworkpledges.supportedbytheMulti-agencyDonorCoordinationtheseregion,Europe’sscrambletoreplaceRussianConventiononClimateChange(UNFCCC)Platform,unitingtheEU,G7countries,andinterna-gasisraisingpolicyinterestfordevelopingregionaldescribedtheprocessas“anexercisethatisWhatmattersforDNV’sforecastisthatpoliciesaretionalfinancialinstitutions.naturalgasresources,forexportanddomesticintendedtomakesureeveryPartyisholdingupbothenactedandimplemented.Inotherwords,itconsumption,aswellascoal.theirendofthebargain,knowswheretheyneedistarget-settingandplanscoupledwithsectoralPolicydevelopmentsamonglow-incomeregionstogonext,andhowrapidlytheyneedtomovepolicies,supportivemeasures,andalignedfinanceTheIndianSubcontinentandSub-SaharanAfricaStrenghteningandmodernizingAfrica'selectricitygridisakeytofulfilthegoalsoftheParisAgreement…itisaandinvestmentthatwillsetthedirection,scope,andregionshaveenergydeficits.Broaddevelopmentenablerofajusttransitionandshouldbeamajorpolicyfocus.momentforcoursecorrection”(UNFCCC,2023a).paceofthetransition.needsandpopulationgrowthmeantheseregionswillaccountformostoftheworld'senergydemandTheannualNationallyDeterminedContributionsInouranalysis,wecloselymonitorpledgesgrowthinthefuture.ThemainregionalagendaisSynthesisReportfromOctober2022(UNCC,relatedtotheParisAgreementbutdonotenergyadditionwhilecontrollingemissions.Themost2022)indicatedtheglobalcollectiveefforttopre-setourETOmodeltoachievethem.comprehensivepolicyapproachtoenergysystembegravelyoff-target.The"TechnicaldialogueofdecarbonizationisseenintheIndianSubcontinentwiththefirstglobalstocktake"report,publishedinIndiaprioritizingsubsectorsandenergyareasaccom-September(UNFCC,2023b),laysthescientificpaniedbysupportiveNationalMissionprogrammesandtechnicalbasefortheconclusionofthefirstfortechnologydevelopment.globalstocktake.Itsummarizes17keyfindingsandmakesclearthatthereisprogressbutmuchmoreSub-SaharanAfricacountrieshaveapredominantneedstobedone(keyfinding5)toreduceglobalpolicyfocusonthepowersystemandrenewableGHGemissionsby43%by2030,and60%by2035,energy,thoughgreenhydrogenpolicyisevolvingincomparedwith2019levels,andtoreachnet-zeroselectcountriesthroughfundingpartnershipswithCO2emissionsby2050globally(IPCC,2023).Europe(e.g.GermanyandNamibia).Ingeneralthereisapolicylacunaonstabilizingandbuildingoutpowergridsacrossthesubcontinent—aprerequisitenotonlyforbasicenergyaccessformillionsofpeople117CONTENTSDEMANDELECTRICITYRENEWABLESFOSSILFUELSFINANCEPOLICYEMISSIONSREGIONSAPPENDIXDNVEnergyTransitionOutlook20236.5POLICYFACTORSINTHEETO1.Renewablepowersupport—Renewableelectricitybuild-outisadvancedbygovernmentsinallregions,increasinglyOurforecastfactorsinpolicymeasuresspanningtheentirepolicytoolbox(Section6.3).12policyconsiderationsexertinfluenceinthreemainareas:throughmarket-ledapproachessuchastenderingprocessesandauctionsforcertainvolumesofrenewablepower.a)Supportingtechnologydevelopmentandexisting,enforceablepolicy/measuresandindicationsactivatingmarkets,thusclosingtheprofitabilityofplannedandfuturepolicydevelopmentstoassess—Supportmechanismsguaranteetheprofitabilityofrenewablegeneration,including:gapforlow-carbontechnologiescompetingwiththeirlikelyimpact.Model-specificpolicyfactorsare1)investmentorproductiontaxcredits(NorthAmerica)forafractionoflifetime,withconventionaltechnologies.thusderivedbasedonpolicymapping.supportremovedafter10to14yearsorwhentargetedemissions(powersector)havecomedown75%,and2)Contracts-for-Difference(CFDs;two-sidedorone-sided)b)ApplyingtechnologyrequirementsorstandardstoInderivinganETOmodel-specificpolicyfactorwedependingonregion,andreflectingregionalauctionstrikeprices.restricttheuseofinefficientorpollutingproducts/takethefollowingsteps:technologies.—Energysecurityconsiderationsarereflectedbyfavouringdomesticallyavailableenergy—consideranddifferentiateregionalwillingness/abilitysources(e.g.solarandwind,coalornaturalgas,nuclear).Weassumeincentivesinthec)Providingeconomicsignals(e.g.apriceincentive)toimplementsupport/subsidiesrangefrom6%to15%ofthelevelizedcostofelectricity,basedonexistingsupportlevelstoreducecarbon-intensivebehaviour.countriesprovideandinformationavailableonwillingnesstopayforenergysecurity.—translatecountry-leveldataintoexpectedpolicyTheenergysourcesandtechnologiesincentivizedareregiondependent,reflectiveofThepolicyanalysisinformingourOutlookensuresimpacts,thenweighandaggregatetoproduceresourceendowmentsandtechnologicalknow-how.Incentivesareprovidedtonucleardetailedcoverageonthelargesteconomiesthatregionalfiguresforinclusioninouranalysisandvariablerenewableenergysources(VRES)inEurope,OECDPacific,andGreatercombinedrepresent80%oftotalenergyuseofChina.InSub-SaharanAfrica,SouthEastAsia,andtheIndianSubcontinentincentiveseachOutlookregion.WemappolicydocumentsforNext,wedetailpolicyfactorsintheanalysis.areprovidedtocoalandVRES.IntheMiddleEastandNorthAfricaandNorthEastEurasiagasisincentivized.Conversely,theenergyresourcesonwhichthereisimport-dependenceareprovideddisincentives.—Carbonpricingandcostofcapitalincreasereducetheattractivenessoffossil-basedgeneration.2.Energystoragesupport(batteries)—Existingandplannedpolicysupportistranslatedtoanaveragesupportasapercentageofbatteryunitcostsforbattery-storagetechnologies.—Supportlevelsincreasewiththeshareofvariablerenewablesinregionalelectricitygeneration,incentivizinginvestmentinflexibilitywhilereflectingregionaldifferencesinwillingness/abilitytoimplementsupport.118CONTENTSDEMANDELECTRICITYRENEWABLESFOSSILFUELSFINANCEPOLICYEMISSIONSREGIONSAPPENDIXDNVEnergyTransitionOutlook20233.Zero-emissiontransport—Forroadtransport/vehicles,thespeedofhydrogenuptakeisdeterminedbya—OurmodelreflectsanaverageregionalEVsupportforbothbattery-electricvehicles(BEVs)hydrogen-policyfactorreflecting,amongotherparameters,FCEVCAPEXsupportincludingrefuellinginfrastructure.Examplesareincentivesdrivenbymunicipality-andfuel-cellelectricvehicles(FCEVs),basedonexistingsupportatthecountrylevel.basedCAPEXreductionpoliciesforhydrogen-fuelledpublicbuses.—Weaccountforsubsidies,taxexemptions,andreducedimportduties,andtranslate—Forshippingandaviation,fuel-mixshiftsaredrivenbyfuel-blendingmandatesandtheseintoanaverageCAPEXsupportperregionpervehicletype.carbonpricing.—Weassumeaslightinitialgrowthandadeclineinpreferentialtreatmentfromthe—CCSinlow-carbonhydrogenproductionismainlydrivenbyregionalcarbonprices.currentlevelsthereafter.ThesupportiscappedbytheEVcostdisadvantage.ThemaintriggerforCCSuptakewillbewherecarbonpricesarehigherthanthecostofCCS.Inaddition,regionalpoliciesprovidingspecificsupportforCCSareconsidered—WemappedCountry-leveltargetsforpublicfast-charging(greaterthan22kW)toenabletheinitialuptakeandreducecosts.Thispolicysupportwillbereducedwheninfrastructureroll-outtoidentifyEVuptakebarriers.Ascharginginfrastructureexpandscarbonpricesbecomehighenoughtosustaingrowth.FortheNorthAmericaregion,overthenextdecade,thisisincreasinglylikelytobeonmarketterms,andassociatedbluehydrogenissupportedviathe45Qtaxcredit(seeCCS)asthe45Vandthe45Qtaxgrid-infrastructurebuild-outwillfollowwithoutconstraints.creditscannotbestacked.4.Hydrogensupport5.Carboncaptureandstorage&directaircapturesupport—Onthesupply-side,hydrogeninfrastructureandproductionhaveprojectsreceiving—HistoricalCCSimplementations,andtheirfutureprojectpipelineofplantsandstoragesupporttoeitherCAPEXorOPEX,whicheverishigher:1)CAPEXsupportisestimatedarefullyincorporatedthrough2030,asreportedbytheGlobalCCSInstitute(2022).onthebasisoftotalannualgovernmentfundingprogrammesandreflectedasaTheseprojectsreceiveinvestmentandoperationalgovernmentsupport.percentagesubsidyforthecapitalcostoflow-carbonhydrogenproductionroutes,or2)OPEXsupport,e.g.inEuropereflectingtheCfDsexpectedfromtheHydrogen—RegionalcarbonpricesdeterminetheuptakeofCCSinpower,manufacturing,andBank,andinNorthAmericareflectingthetaxcredit45V(US)andCanada’sinvestmentindustrialprocessing.taxcredittogreenhydrogen.Thefullsubsidyremainsuntil2030andisgraduallyhalvedto2050unlessspecificend-dataisavailable.Thesupportonthesupply-side—RegionalpolicysupportforCCSbeyondthecarbonpriceisintegratedbasedonthegaphasspill-overeffectsforhydrogendemandinend-usesthroughreductionsinbetweenregularCCScostsandcarbonpricingtoaccountforthisgapandenableinitialhydrogenprice.CCSuptake.Projectsreceivesupportreflectinggovernmentfundingprogrammesasapercentagesubsidyforthecapitalcost,andintheNorthAmericaregionreflectingthetax—Forthedemand-side,ahydrogen-policyfactorreflectsCAPEXsupporttomanufacturingcredit45Q(US),whichalsodistinguishesbetweencapture-storageandcapture-utilization.andbuildingsbutvariesbyregionintermsofpolicyfocusandpercentagelevelofPolicysupportisreducedwhenthegapbetweencarbonpriceandCCScostsisclosed.CAPEX,accordingtogovernmentfundingprogrammes.Thefullsubsidyremainsuntil2030andisthengraduallyhalvedto2050.—DirectaircapturesupportreflectsrecentlyannouncedfundingintheNorthAmericaregion.IntheUS,theIRA(2022)increasedthe45QtaxcredittoUSD180/tCO2captured119CONTENTSDEMANDELECTRICITYRENEWABLESFOSSILFUELSFINANCEPOLICYEMISSIONSREGIONSAPPENDIXDNVEnergyTransitionOutlook2023forstorageviaDAC.Wehaveimplementedthisinourmodelassubsidiesintheregion.7.Bans,phase-outplansandmandatesAmuchlowerlevelofsubsidies(onesixthofthat)isalsoassumedforEuropetoreflectthe—BansonICEvehiclesarenotincorporatedintheforecast,butmodelresultsareEuropeanCommission’stargettostoreupto50MtCO2ayearby2030,includingfromDAC,aswellastheUK's2023announcedfundingofuptoGBP20billion(aroundUSD25comparedwithannouncedbans.billion)forCCUSapplications,includingforDAC.—Phase-outplansonnuclearpowerareincorporated.Forcoal-firedpowergeneration,our6.Standardsforenergyefficiencyforecastreferencesthephase-outplans.However,duetomarketeconomicsandreduced—Standardsandregulation(existingandplanned)forenergyuseandefficiencycost-competitiveness,shutdownsmighthappenearlierthanphase-outplanssuggest.improvementsinbuildings,transport,andindustrysectorsareincorporated.—Regionalbiofuel-blendmandatescurrentlyinplaceareconsideredandweforeseefurtherstrengtheningoftheseinfront-runnerregionssuchasEURandNAM.Mandates—Buildings:Standardsforinsulationagainstheatloss,heatgainandenergyusewilllikelybeenhancedinthefuturetoincludeothersustainableaviationfuels(SAFs).forappliancesandlightingareusedasguidesforsettingtheinputassumptions.However,thepolicyeffectsarenotquantifiedexplicitly.AdditionallyforNorth—Region-specificpushesbothfrombusinessandfromindividualsthatarewillingtopayAmericaandEuroperegions,higherretrofittingratesofbuildingsandenvelopesforsustainableaviationwillenableagradualincreaseinuptakeofuncompetitive(onbasedonsubsidiesand/ortaxcreditsforinsulationandweatherizationofbuildings.cost)aviationfuelssuchashydrogenandSAFs.—Vehicles:Efficiencyandemissionsstandardsperregionareincorporatedandtrans-8.Carbonpricingschemeslatedintonormalizedtest-cyclevalues(NewEuropeanDrivingCycle,NEDC).An—Ourcarbon-pricetrajectories(Figure6.3)arereflectedascostsforfossilfuelsinmanu-adjustmentfactorperregionisappliedtoderivereal-worldfuelconsumptionfromthetheoreticalNEDCvalues.Thefuel-efficiencytrajectoriestowards2050followthefacturingandbuildings,andinpower,hydrogen,ammonia,andmethanolproductiontrendsdeterminedbythesereal-world-adjustedstandards,correctedforEVuptake.whereprogressiveparticipationinthesameregionaland/orsectoralcarbon-pricingschemesisassumed.Someregions(CHN,EUR,NAM,OPA)areprojectedtoreach—Shipping:IMO2050GHGstrategy(IMO,2023)significantlystrengtheneditsambitionlevelscarbon-pricelevelsintherangeofUSD20to150/tCO2by2030andUSD56to250/in2023andnowaimsfornet-zeroemissionsfromships“atoraround2050”.EnforcementtCO2by2050.Acrossall10regions,carbonpricingbymid-centuryisprojectedtorangemechanismsareunderconsiderationforimplementationin2027.Inthemeantime,thebetweenUSD20/tCO2(NEEandSSA)andUSD250/tCO2(EUR).CarbonIntensityIndicator(CII),ShipEnergyEfficiencyManagementPlan(SEEMP),andEnergyEfficiencyExistingShipIndex(EEXI)arewellunderway,andtheinclusionofshipping—Carbon-priceexemptions:Wehavereflectedcarbon-priceexemptionsavailabletointheEUETSisencouragingafastdecarbonizationresponsefrompartoftheglobalfleet.manyindustriesandlackofcarbonpricesinjurisdictionsinsideourregions.ForEurope,Severalregionalandnationalpolicymeasuresaredrivingtheavailabilityoflow-orzero-weassumeexemptionstoberemovedby2034inlinewithEUpolicies.ForNorthemissionfuelsources,althoughmaritimewillbeinstrongcompetitionwithothersectorsAmerica,manufacturingsectorcarbonpricesapplyroughlyto50%industriesonaveragetoaccessthem.Hencetheimportanceofefficiencies,especiallythosethataredigitallythroughoutourforecasthorizon.enabled,atvesselandfleetlevelfortheindustrytomeettheIMOambitionlevels.120CONTENTSDEMANDELECTRICITYRENEWABLESFOSSILFUELSFINANCEPOLICYEMISSIONSREGIONSAPPENDIXDNVEnergyTransitionOutlook20239.Taxationoffuel,energy,carbonandgridconnections10.Airpollutionintervention—Fossilfuelsusedinroadtransportaretaxedattheconsumerlevel,labelledasfuelor—Policyinterventionsarereflectedbyanair-pollutioncostproxythattransferscostscarbontaxes.ofcontrolmeasurestoanoperatingcostperkWh,incorporatedinpowerandmanufacturingsectors.—Effectivefossil-carbonratesareincorporatedinfuelpricesforroadtransport,withtaxationhighestinEurope,andtherateshowingincreaseinregionswithtaxation.—Aregionallydependentramp-uprateisused,goingfrom0%to100%implementationRegionsNorthEastEurasia,SouthEastAsia,andtheMiddleEastandNorthAfrica,oftheoperatingcostoveracertainperiod,indicatingthatregulationswillbegraduallyareestimatedtohavefossil-fuelsubsidies.enforcedonmoreandmorepollutantsandplants.—Weassumethatthesetaxeswillincreaseinlinewitharegion’scarbon-priceregime,11.Plasticpollutioninterventionrisingataquarterofthecarbon-pricegrowthrate.—Policyinterventionsonplastics,suchasmandatedrecycling,taxesonunrecycled—Energytaxratesincorporatedforotherdemandsectors(buildings,manufacturing)plastic,traderestrictions,andextendedproducerresponsibilitiesareincorporatedinencourageswitchingfromfossilfuelstoelectricityandhydrogen.Electricitytaxationtheformofrecyclingratesandaneffectofreductionandsubstitutionondemand.declinesinhigh-taxregionstoenableelectrificationofend-usesectors.Inordertosupporthydrogenuptake,hydrogenisexpectedtobeexemptfromenergytaxation—Theprojectedrecyclingrates(mechanicalandchemical)andtheeffectofreductionthroughto2035inallregions.Inregionsprioritizingdomesticuseofhydrogen,theandsubstitutionbuildsontheReshapingPlasticsreportforPlasticsEurope(Systemiq,taxexemptionhasaphase-outprofile,withhydrogenincreasinglyfacingtaxlevels2022),assumingthatthemost-likelyfuturepolicyinterventionscorrespondtothoseinsimilartothoseappliedtotheregion’sfutureindustrialelectricitytoassureatheCircularityscenario(acombinationofthe'Recycling'andReduction&substitution'harmonizedenergytaxationsystem.scenarios).Amongtheregions,EURisexpectedtobeafront-runnerandtheotherETOregionsareassumedtofollowwithdelaysrangingfrom5to15years.—Taxesandgridtariffsforgrid-connectedelectrolysersareassumedtobea25%surchargeoverthewholesaleelectricityprice.12.Methaneintervention—Methaneinterventionandabatement,suchasthatwhichresultsfromtheGlobal—Taxesonelectricityfortransportarecalculatedfromtheshareofchargingtypesandtheirpricescomparedwiththeresidentialprice,andappliedinregions,exceptthoseMethanePledge(launchedatCOP26,2021,promisingatleast30%reductionfrom2020withnegativetaxationonfueluse(i.e.fossil-fuelsubsidies).levelsby2030)areincorporated.Partialenergy-sectorreductionsareachievedasaresultofcarbonpricesdeployedagainstmethaneabatementtechnologiesandtheirmarginalcosts.Additionally,forNorthAmerica,increasedmethanefeesinducegreatermethaneabatement.121CONTENTSDEMANDELECTRICITYRENEWABLESFOSSILFUELSFINANCEPOLICYEMISSIONSREGIONSAPPENDIXDNVEnergyTransitionOutlook2023Highlights7Thischapterpresentsaforecastofcumulativeenergy-cumulativeemissionsto2050andassumealinearEMISSIONSANDrelatedemissionsto2050.EnergyproductionandreductionfromthenuntilGHGemissionsreachCLIMATEIMPLICATIONSuserepresentsmorethan70%ofglobalgreenhousezeroin2100.Thatenablesustoestimatethelikelygas(GHG)emissions,ofwhichmostisCO2.warmingeffectoftheenergytransitionweforecast,7Emissionsandclimateimplications�123whichindicatesawarmingof2.2°Cby2100—whichWeforecastglobalenergy-relatedCO2emissionsholdsdireimplicationsforclimate-relateddamage.7.1Emissions�123willpeakin2024andwillbe4%lowerthantodayin2030,and46%lowerthantodayby2050.Thepaceofthetransitionisfarfromfastenough7.2Carboncaptureandremoval�126foranet-zeroenergysystemby2050.ThatwouldToestimatethewarmingtrajectoryassociatedwithrequireroughlyhalvingglobalemissionsby2030,7.3Climateimplications�131theselevels,wealsotakeintoaccountlikelydevel-butourforecastsuggeststhatambitionwillnotevenopmentsinagricultureandland-useemissions,beachievedby2050.LimitingglobalwarmingtoandIPCCestimatesofotherGHGs.Wecalculate1.5°Cisthereforelesslikelythanever.122CONTENTSDEMANDELECTRICITYRENEWABLESFOSSILFUELSFINANCEPOLICYEMISSIONSREGIONSAPPENDIXDNVEnergyTransitionOutlook20237EMISSIONSANDCLIMATEIMPLICATIONS7.1EMISSIONSstartedtogrowagain.TheeffectsofCOVID-19resultedinenergy-relatedCO2emissionsdroppingbyInthischapter,wecharthowenergy-relatedemissionswillalmosthalve(-46%)betweenEmissionsfromenergy-relatedactivitieshavegrownapproximately7%in2020,areversalunprecedentednowand2050,oncetheyhavepeakedin2024at34GtCO2.WethenestimatetheirclimateinstepwithagrowingpopulationandGDP.Oftheinrecenthistory.Butaseconomicactivitypickedup,impactinconjunctionwithothergreenhousegasemissions.Toarriveatderivedlevelsofcumulativeenergy-relatedemissionsaddedtothesotoodidenergyuseandemissions.globalwarmingby2100,wealsotakeintoaccountanextrapolationofremainingemissionsatmospheresincethestartoftheIndustrialRevolution,Theanticipatedbouncebackofemissionsaftertheafter2050—i.e.beyondourforecastwindow.Wefindthattheworldisontracktoexperiencearound1850,itisestimatedthat50%havebeenaddedpandemichasbeenquickerthanweoriginally2.2degreesofwarmingbytheendofthiscentury.totheatmosphereinthelast50years(Buis,2019).In2014,aplateauseeminglystartedwithemissions123stayingflatforseveralyears.However,in2018theyOver70%oftheannualgreenhousegas(GHG)Subsequently,weexaminethepotentialclimateemissionsrelatedtohumanactivitiescomefromtheramifications.Additionally,weshedlightonCH4energysector.Mostoftheseemissionsresultfromemissionsoriginatingfromtheenergysector,alongburningfossilfuels.Whilecarbondioxide(CO2)withprojectionsassociatedwithshiftsintheenergymakesupthebulkoftheseemissions,methaneinfrastructure.(CH4)isalsoasignificantGHG,particularlyinprojectionsoffutureclimateimpacts.Itshouldbenotedthatourassessmentdoesnotdelveintospecificclimateeffectssuchasflooding,Inthischapter,wepresentanestimationofglobaldroughts,orforestfires.Instead,ourfocusremainsCO2emissionslinkedtotheenergysectoruptoontheoverarchingaveragetemperaturerisecorre-2050,basedontheETOforecast.ByintegratinglatedwithourforecastedcumulativeCO2emissions.theseestimateswithnon-energy-relatedCO2emissions(e.g.thosestemmingfromindustrialTheeffectsofCOVID-19resultedinprocessesandland-use)andprojectedenergyenergy-relatedCO2emissionsdroppingemissionspost-2050,wecandeducethetotalbyapproximately7%in2020,areversalcumulativeemissions.WithCO2concentrationunprecedentedinrecenthistory.Butaslevelsthusderived,wecancalculatetheanticipatedeconomicactivitypickedup,sotoodidglobalclimateresponse,especiallyintermsofenergyuseandemissions.averageglobaltemperatureelevation.InadditiontoourprojectionsforCO2emissionsfromtheenergysector,wealsoincorporatepotentialtrendsinemissionsfromagricultureandland-use(signif-icantcontributorstobothCO2andCH4emissions).CONTENTSDEMANDELECTRICITYRENEWABLESFOSSILFUELSFINANCEPOLICYEMISSIONSREGIONSAPPENDIXDNVEnergyTransitionOutlook2023anticipatedandby2022theemissionswereatthegraduallyto32.1GtCO2in2030,onlyslightlylowerSectoremissionsEmissionsfrommanufacturingdeclineto4.2GtCO2samelevelsasthepreviouspeakyearin2019.Russia’sthan2019(i.e.pre-COVID-19).Bymid-century,energy-Thepowersectoriscurrentlythelargestcontributor(23%)asseeninFigure7.2.ThedynamicsbehindtheseinvasionofUkrainehasfurtherdisruptedtheenergyrelatedemissionsareexpectedtobe18.1GtCO2pertoenergy-relatedCO2emissions:13.4Gtin2022,40%emissionreductionsaresummarizedasfollows:transition,withtheneteffectofaslightincreaseyear,46%lessthanin2022(Figure7.1).ofallenergy-relatedemissionsthatyear.Thetransportinemissionsinthecomingyearsascountriesshiftsectormadeup25%(8.5GtCO2)ofthetotal,while—Thepowersectorshowsthefastestsectoraldecar-focusfromdecarbonizationtosecuringthesupplyFigure7.1showscoalistoday’smaincontributor(43%)manufacturingaccountedfor19%(6.3GtCO2).Thebonizationto2050.Solarandwindwillmakeuptheofenergy,whichinmanyregionsmeansincreasedofenergy-relatedCO2emissions,followedbyoil(31%)restismadeupofbuildingsemissionsandtheenergymajorityoftheaddedcapacitytowards2050.This,coaluseortemporarilyrunningoil-basedelectricityandnaturalgas(25%).EmissionsofCO2fromcoalwillsector’sownuse.combinedwithretirementoffossilthermalpowergeneration(aidedbythepossibilityofprice-cappedseethestrongestdecline(61%)between2022and2050.plantsandexpansionofnuclear,willreduceemis-ordiscountedRussianoilexports).BasedonglobalIn2050,thepowersectorwillremainthebiggestemittersionsfrompowergenerationsignificantly.Insomeenergydemand,annualenergy-relatedCO2emissionsEmissionsfromoilwilldecreaseby45%inthattime,(30%),butwithannualemissionsreducedto5.4GtCO2.regions,fossilplantswillbefittedwithCCSwhichroseto33.4GtCO2in2022andweexpectemissionswhereasthosefromnaturalgasgrowtowards2027Transport’ssharewillincreaseto26%bythen,butinwillalsocontributetoa60%reductioninpowertopeaknowby2024at34GtCO2beforedecliningandthendropto75%oftoday’semissionsby2050.absolutetermsitsemissionswillreduceto4.8GtCO2.sectoremissionsfromtodayto2050.124CONTENTSDEMANDELECTRICITYRENEWABLESFOSSILFUELSFINANCEPOLICYEMISSIONSREGIONSAPPENDIXDNVEnergyTransitionOutlook2023—Thetransportsectorsawasharpdeclineinemis-—Themanufacturingsectoremissionswilldeclinepercapitaat5.0tonnesin2050,followedbyNorthLand-useemissionssionsin2020duetotheCOVID-19pandemic.steadilyoverthewholeforecastperiodwithelec-AmericaandtheMiddleEastandNorthAfricaat3.3CO2emissionsfromAFOLU(agriculture,forestry,andInthelongerterm,thedefiningtrendofroadtrification,fuel-switching,and(CCS).However,tonnesperperson(seegraphiconEnergy,GDPandotherland-use)arenotincludedinourforecastandtransportelectrificationwillresultinemissionsreplacingfossilfuelsourcesforsomeapplications,population,Section8.12).Wedescriberegionalmodelling,butat4GtCO2peryeartheyaregreaterdeclining44%by2050.Theelectricitypoweringespeciallyforhighheatprocess,islikelytoproveemissionsinmoredetailinChapter8.thanEurope’semissions.Therefore,theseemissionsareEVswillincreasinglybecomingfromrenewables,toodifficultorexpensive—hencetotalemissionssubstantialenoughtowarrantinclusionofland-useenablingEVstooperateinazero-emissionwilldeclinebyonlythirdtowardsmid-century.Process-relatedemissionsemissionswhenconsideringglobalCO2emissions,mode.However,itisonlybythemid-2020sthatInadditiontoCO2emissionsfromcombustionofespeciallywhenconsideringtheclimateimplications.overalltransportemissionsstarttodecline.Thisis—Thebuildingssectordirectemissionsseeonlyafossilfuels,therearesignificantemissionsfromindus-Emissionsfromland-usehavebeengrowingslowlybecauseeventhoughthegrowingnumberofEVslimiteddeclineduetoasignificantgrowthinthetrialprocessesthateitherconsumefossilfuelsasrawoverthelast20years,historicallyaveraging5GtCO2reduceemissions,theeffectisinitiallycounterednumberofcommercialandresidentialbuildings.materialforfeedstock(e.g.plasticsandpetrochemicalperyear,butwithlargeannualfluctuations.MostbytransportgrowthandalackofemissionContinuousimprovementsinenergyefficiencyproducts)orthroughprocessesthatproduceCO2recentresearchhasadjustedland-useemissiondownreductionsinshippingandaviation.andswitchingtocleanersourcesoffuelforheatingthroughachemicalreaction(e.g.cementandotherslightlyfromthehistoricalaverage.Evenincorporating(e.g.electricitycombinedwithheatpumps)willbeindustrialprocesses).Theseprocess-relatedemissions,lastyear’sforestfires,thelatestsuchestimateshowsthemainreasonsbehindanoveralldeclineof12%togetherwithestimatesofthesubsequentcaptureofaslightdeclineto3.9GtCO2peryearin2021(Globaldespitealargegrowthinfloorspace.someoftheseprocessemissions,areincludedinourCarbonBudget,2022).analysisaspartofthemanufacturingsector.In2022,Regionalemissionstheseemissionswereanestimated3.8GtCO2,ofwhichThereiscurrentlyconsiderableuncertaintyaboutOur10Outlookregionshavedifferentstartingpointsalmosthalfwerefromcalcinationinthecement-pro-changesinfutureland-use,assomecountrieswithandverydifferentemissiontrajectoriesovertheductionprocess.Theremainderoftheemissionswerelargeforestareasarelosingthematdouble-digitforecastperiod.GreaterChina,currentlythelargestfromammoniaproductionandsmallsharesfromcokepercentageratescomparedwithpreviousyears,mostemitterbyfar,willreachpeakemissionsbefore2030;ovensandtheproductionoflimeorotherchemicals.ofthemduetonon-firerelatedlosses,butincreasinglyitsemissionswillthendeclinetomid-century,whenduetoforestfires(GlobalForestWatch,2022).Takingtheywillbe63%lessthanin2022.Weexpectaslightriseinconstructionandindustrialthisuncertaintyintoaccount,weexpectthatclimategrowth,whichlargelydrivesprocessemissions,overandsustainabilityconcernswilleventuallyaffectTheIndianSubcontinentwillcontinuetogrowitsthenext10years,andthenastabilization.However,policy,creatingpressuretocontrolland-usechanges.emissionstowards2050,initiallyveryrapidly,butwhileoutputmightstabilizeatahigherlevelthanThus,ourbestestimateisthatannualCO2emissionsthenplateauingbythemid-2030sandending32%today,improvementsinproductionandtechnicalfromland-usechangeswillslowlydeclinetowards3higherinmid-centurythanin2022.Sub-Saharanefficiencies,combinedwithincreasingsharesoftheseGtin2030,andthenreducelinearlyto2Gtin2050,Africawillshowanincreaseof33%comparedwithemissionsbeingcaptured,meanthattheresultingalmost40%lessthantoday’sannuallevels.2022.AsFigure7.3displays,allotherregionswillemissionslevelwilldeclinetowards2040,andfallreducetheirenergy-relatedemissions,ledbyEuropeevenmorequicklyinthedecadetoyear2050.In125(-83%),OECDPacific(-80%)andNorthAmerica(-75%).mid-century,process-relatedindustrialemissionswillNorthEastEurasiawillhavethehighestemissionsbe20%lessthantoday.CONTENTSDEMANDELECTRICITYRENEWABLESFOSSILFUELSFINANCEPOLICYEMISSIONSREGIONSAPPENDIXDNVEnergyTransitionOutlook20237.2CARBONCAPTUREANDREMOVALTheDraxPowerStationintheUKshowingbiomassstoragetanksandcarboncapturecapabilities.CarboncaptureandremovalcanhelpreduceCO2Foralltheexistingandannouncedpoliciesemissionsfromsectorsthatcontinuetousefossilfuels.onCCS,itsuptakewillbeverylimitedinthe126Carboncapturereferstotheseparatingandcapturingnear-tomedium-term,andeffectivelytooofCO2fromsourceswithhigh-concentration,suchaslateandtoolittleinthelongerterm.influegasesoffossil-fuelledstationsandheavyindus-tries(e.g.cementorpetrochemicals).Carbonremovalbecapturedinthesteammethanereforming(SMR)referstotheprocessofremovingCO2inlowconcentra-process,andweforeseecaptureofanincreasingtionsfromtheatmosphere.Inbothcases,thecapturedshareofemissionsassociatedwithhydrogenorremovedCO2canbeeitherutilizedforproducingproductionforfeedstock.Somecaptureisalsovalue-addedproducts(suchase-fuelsorfizzydrinks)1,expectedwhenflaringoccursduringnaturalgasortransportedandstoredingeologicalormarineprocessing.reservoirs.Thus,carboncaptureandstorage(CCS)isamethodofcounteringandreducingindustrialHowever,foralltheexistingandannouncedpolicyemissions,whereasdirectaircarboncaptureandonCCS,itsuptakewillbeverylimitedintheneartostorageisanegativeemissiontechnology.mediumterm,andeffectivelytoolateandtoolittleinthelongerterm.Itisonlyinthe2030s,whencarbonToday,CCSisprimarilyappliedaspartofenhancedpricesstarttoapproachthecostofCCS,thatuptakeoilrecovery,wherethereisaviablebusinesscase.acceleratesanddeploymentatscalebegins.In2050,TotalcommercialCCScapacitybySeptember2022wefindemissionscapturedbyCCStobe1.2GtCO2.was43MtCO2peryear,withanadditional200MtCO2peryeareitherinconstructionorinvariousstagesInthenearterm,thelargestcontributortoCCSofdevelopment(GCCSI,2022).Goingforward,wewillremainthenaturalgasprocessingindustry,withexpectthatoperatorsoflargepointsourcesintheashareofabout40%inglobalCCSby2025.powerandmanufacturingsectorswillincreasethecaptureofcarbonfromtheirprocessesandwastestreams.Additionally,weexpectallcarbonemissionsfromhydrogenproductionasanenergycarrierto1.IntheETO,weonlymodelcarboncapture,transportationandstorage.Utilizationofthecapturedcarbonliesoutsidetheboundariesofourmodel.CONTENTSDEMANDELECTRICITYRENEWABLESFOSSILFUELSFINANCEPOLICYEMISSIONSREGIONSAPPENDIXDNVEnergyTransitionOutlook2023Globally,weexpectonlyabout6%offornearlythree-quartersofCCSby2050,withtheproductionwillstillhavethelowestCCScosts(USDhappeningatsufficientspeedorscaletomakearemainingemissionstobecapturedby2050,restoriginatingfromvarioushighheatindustries.30and42/tCO2respectively),whilethecostsofmoresignificantimpactinreducingemissionsinthesedemonstratingtheneedforasignificantlyexpensiveapplicationsinmanufacturing(productionmajorcarbon-emittingregions.AttheotherendfasteruptakeofcarboncaptureandstorageWhichofthesectorsthatwilldemonstratemoreCCSofplastics,basematerials,cement,andconstructionofthespectrum,Europeisexpectedtocapturetogetusclosertonet-zeroemissionsby2050.deploymentisreflectiveofthecostsofthetechnologyandmining)ande-fuelsproductionwilldeclinenearly200milliontonnesoutofatotal700millionforagivenapplication.Today,thecostofCCSforalltowardsUSD75to150/tCO2globallyduetolearning.tonnes,orinotherwordsnearly30%,ofitsremainingInthenearterm,powergenerationwillalsoaccountapplicationsisprohibitivelyhigh,owingtoalargeemissionsby2050,enabledbythehighestcarbonforasignificantshareofCCS(12.5%in2025),butextenttotheenergypenaltyincurredbythecaptureBy2050,theregionswiththehighestremainingpricesexpectedamongourETOregions.Globally,thiswillcontinuallydecreaseinimportancewiththeprocess(Figure7.5),withnaturalgasprocessingandemissionsareexpectedtobeGreaterChinaandhowever,weexpectonlyabout6%ofremainingincreasinguptakeofrenewablesinpowergeneration.directheatproductionatthelowerend(USD36-67/theIndianSubcontinent,eachwithabout4billionemissionstobecapturedby2050,demonstratingtCO2avoided)andmostofmanufacturingprocessestonnesofCO2emissionsperyearremaining.ThesetheneedforasignificantlyfasteruptakeofCCStoGoingforward,CCSwillgrowmostrapidlyintheande-fuelsproductionatthehigherend(USDregions,however,areexpectedtocontributelittlegetusclosertonet-zeroemissionsby2050.productionofhydrogenanditsderivatives.By2050,190-230/tCO2avoided)ofthecostsrangeglobally.toCCS,eachcapturinglessthan2%oftheirtotalbyfarthelargestsinglecontributortoCCSuptakeBy2050,naturalgasprocessinganddirectheatremainingemissions.CCSdevelopmentisthusnot127willbeammoniaproduction.Ammoniasynthesisisthelargestcarbondioxideemittingchemicalindustryprocess,accountingforabout1.8%ofglobalcarbondioxideemissions(TheRoyalSociety,2020).Almostallthehydrogenusedinammoniaproductiontodayisproducedfromfossilfuels,primarilyfromsteammethanereforming(GCCSI,2022).By2050,weforecastthatnearlyhalfofallglobalCCS,around580MtCO2peryear,willbeinammoniaproduction.Similarly,theproductionofe-fuels,suchase-methanolasenergycarrier,willbethesecondmostimportantcontributortoCCSuptakewithashareof14%by2050,withtheproductionofhydrogenitselfcontributinganother10%.Intotal,theproductionofhydrogenanditsderivatives(includingammoniaande-fuels)accountCONTENTSDEMANDELECTRICITYRENEWABLESFOSSILFUELSFINANCEPOLICYEMISSIONSREGIONSAPPENDIXDNVEnergyTransitionOutlook2023DirectAirCaptureIntermsofthefutureprospectsforDAC,over130Asanemergingtechnology,itisexpectedthattheexpensive.InnovationinCO2use,includingsyntheticDACfacilitiesarenowatvarious,butmostlyveryearly,costsofDACwilldropsubstantiallyoverthecomingfuels,coulddrivedowncostsandprovideamarketDirectaircapture(DAC)referstotheprocessofstagesofdevelopment(IEA,2023d).Companiesdecades3asmorenationsandcorporateentitiesforDAC,andmajorcompaniessuchas1PointFiveareremovingCO2inlowconcentrationsfromtheoperatinginthisfieldhavemadeambitiousannounce-recognizethevitalroleofnegativeemissiontech-alreadyexploringtheseopportunities.atmosphere.TheCO2canbepermanentlystoredinments,suchasatargetofonemilliontonnesCO2nologiesinenablinganet-zerofuture.However,DACshowsgreatpromisefordecarbonizationdeepgeologicalformationsorusedincommercialremovalcapacityby2030setbythepioneeringgiventheprohibitivelyhighcostsatpresent,scalingafter2050butwillnotscalefastenoughtomakeaapplications.ThismeansthatDAC+S(directaircompanyClimeworks.Thecompanyisexpectedupattheraterequiredforthecostlearningcurvesmeaningfuldifferencetoemissionsbeforethen.captureplusstorage,alsoreferredtoasdirectairtooperationalizea0.036MtCO2/yrfacilitycalledtodrivecostsdowntocommerciallyviablelevelsItisneverthelessanexcitingnicheandverycarboncaptureandstorage—DACCS—orcarbonMammothby2024inIceland.IntheUS,thecompanystillneedssubstantialpolicysupportorvoluntarymeaningfulatthescaleofindividualcompanies.dioxideremoval,CDR)isanegativeemissiontech-CarbonEngineering(recentlyacquiredby1PointFive)corporatesocialresponsibility-motivatedsupport.Wenotethatanypathwaytonetzeroby2050willnologythatcanbeusedforoffsettingemissionsisdevelopingwhattheyexpecttobetheworld’sItisalsoworthnotingthatDACwillbeincompe-havetoaccelerateDACtechnologyenormouslytofromothersectors(suchasaviation).DAC,however,largestDACfacility,withanexpectedcapturecapacitytitionwithothernegativeemissionstechnologies,offsetremainingemissionsfromhardesttoabateisstillanemergingtechnologythatisprohibitivelyof0.5MtCO2/yrby2025,andplanstoscaleupto1chiefamongwhichisbioenergywithCCS(BECCS)sectors(e.g.aviation).expensivetobedeployedatscale.CapturingandMtCO2/yr.Variousregionsandcountries,includingwhich,whereavailable,ismoreestablishedandlessremovingCO2inlowconcentrationsintheatmos-theUS,Canada,theEU,theUK,andJapanhavesetDirectaircaptureshowsgreatpromiseforphere(over100timesmoredilutethaninthefluedifferenttargetsforcarboncaptureandremoval,decarbonizationafter2050butwillnotscalegasfromagas-firedpowerplant)isintrinsicallyincludingviaDAC.Consideringannouncedambi-fastenoughtomakeameaningfuldifferenceenergy-andequipment-intensive.Today,theonlytionsalongwithpresent-dayrealities,weforeseeCO2toemissionsbeforethen.commercialoperatingDACprojectsarethetwoemissionsremovedviaDACtoreachuptoabout12.5facilitiesbuiltbythecompanyClimeworksinmilliontonnesperyearby2030,focusedprimarilyin128SwitzerlandandinIceland,removingatotalofNorthAmerica(thankstothetaxcreditsupportenvi-about0.005MtCO2/yr—anegligibleshareofoversionedintheUSInflationReductionAct2)aswellasin33billiontonnesofglobalenergy-relatedemissionsEurope,theotherpioneeringregioninDAC.Asapointtoday.Otherpilotprojects,suchasonebyClimateofreference,thislevelofcarboncapturewasachievedThermostatintheUSoranotheronebyClimatein2010bythenowmoreestablishedCCStechnology,EngineeringinCanada,areinpartialoperation,butrepresentinga20-yearlagbetweenDACandCCS.IntheCO2removedfromtheairinthesefacilitiesisthelongerterm,weexpectthatDACwillcontributetonotalwaysstored.removingjustabove200MtCO2/yrby2050.2.SeeDNV’srecentlypublishedreportontheEnergyTransitionOutlookinNorthAmerica(DNV,2023c).3.IntheETOmodel,wehaveassumedacostlearningrateof4.5%forDAC,whichmeansthatweexpectthetechnologycoststodropby4.5%witheverydoublingofcumulativeglobalinstalledcapacity.Duetotheinherentlyenergy-andequipment-intensivenatureofthetechnology,thislearningrateissignificantlylowerthanwhatwehaveassumed,forinstance,forCCS(point-sourcecarboncapture)at13%.CONTENTSDEMANDELECTRICITYRENEWABLESFOSSILFUELSFINANCEPOLICYEMISSIONSREGIONSAPPENDIXDNVEnergyTransitionOutlook2023Methaneemissionsto10.6GtCO2eq,whichisalittlelessthanathirdoftheglobalCO2emissionsfromtheenergysector.ThisMethane(CH4)isthesecondlargestGHGcontributorisnotaninsignificantamount,especiallygiventhattoglobalwarmingafterCO2.30%oftheriseinmitigatinginvoluntaryCH4emissionsisfiscallyexpe-globaltemperaturessincetheIndustrialRevolutiondientasitmaybeusedasenergy,thusfractionallyisduetodoublingtheconcentrationofCH4inthereducingtheneedforextraction.Inthefirstquarteratmosphere.Twokeycharacteristicsdeterminetheof2023,preliminarynumbersfromGMLsuggestthatimpactofdifferentgreenhousegasesontheclimate:anthropogenicCH4emissionshaveincreasedin2023thelengthoftimetheyremainintheatmospherecomparedwith2022(March2023:1920.74ppbvsandtheirabilitytoabsorbenergy.MethanehasaMarch2022:1908.97ppb),ourresultsalsoshowamuchshorterhalf-life(12years)thancarbondioxide.3%increaseinenergy-relatedCH4emissionsfromHowever,methaneisamorepotentGHGthanCO2fossilfuels.pertonneofGHGemitted:29.8timesmorepotentoverthe100-yearGlobalWarmingPotential(GWP)timehorizonand82.5timessoina20-yearGWPperspective(IPCC,2021).AccordingtotheGlobalMonitoringLaboratory(GML),the2022methaneincreasewas14.0ppb,thefourth-largestannualincreaserecordedsinceNOAA’ssystematicmeasurementsbeganin1983,andfollowsrecordgrowthin2020and2021.AsshowninFigure7.1,onaverage,40%ofmethaneemissionsarefromnaturalsourcesandtherestfromanthropogenicemis-sions,drivenbytheagriculturalsector(40%),followedclosely(37%)bytheenergysectorandtherestfromwasteandburningbiomass(IEA,2023e).AccordingtotheIEAGlobalMethaneTracker,totalanthropogenicCH4emissionsin2022wereestimatedat356Mt(IEA,2023e).WhenconvertedtotheirCO2equivalentvalueusing100-yearGWP,thatamounts129CONTENTSDEMANDELECTRICITYRENEWABLESFOSSILFUELSFINANCEPOLICYEMISSIONSREGIONSAPPENDIXDNVEnergyTransitionOutlook2023GlobalMethanePledgeunconventional),andcoalproduction.Foroilandprimarilythankstothereductionindemandforcoal130TheGlobalMethanePledge(GMP)waslaunchedingasCH4emissions,wealsoseparatetheCH4andoil.In2022,CH4emissionsfromnaturalgas2021andsignedby149countrieswhoaccountforemissionmechanisms,namelyvented,fugitive,were40%ofthetotalemissions,withcoalandoil45%oftotalanthropogenicCH4emissions.Itaimsandincompleteflaring.havingrespectivelysharesof31%and29%,respec-toreduceglobalanthropogenicmethaneemissionstively(Figure7.8),butweestimatetheseshareswillby30%in2030comparedto2020levels.However,Ourprojectionindicatesthattheworldwillfailtochangegradually,withcoalCH4emissionsseeingathePledgedoesnotspecifythecontributionofmeettheGlobalMethanePledgeby2030,atleastverylargereductionduetothedemandreduction.countriesormethane-emittingsectors(fossilfuelintermsofCH4emissionsfromfossilfuels.TheCH4Bymid-century,halfofthemethaneemissionsfromproduction,agriculture,andwaste)toachievethisemissionsfromfossilfuelsare118Mtperyearinfossilfuelswillbeduetotheextraction,transmission,globalgoal(GlobalMethanePledge,2021).Despite2030,even3%morethanthe115Mtemittedin2020anddistributionofnaturalgas,withoilcontributingitsverygoodintentions,thePledgehasobvious(Figure7.7).WeprojectCH4emissionsof97Mtper28%,andcoal22%.drawbacks.Oneisthatseveralcountrieswithlargeyearin2040,16%lessthanin2020.Bymid-century,CH4emissions,suchastheRussianFederation,CH4emissionswillbehalfofwhattheywerein2020,WhyonlyCO2andCH4?China,Kazakhstan,andVenezuela,amongothers,Othergreenhousegases,suchasNOx,HFCs,andareconspicuouslyabsentfromit.Second,whileCFCs,aremorepotentclimategases(measuredintheGMPputsforwardaglobaltarget,itdoesnotGWPpertonneofgasemitted)andmorepersistentdisaggregatetheeasier-to-abatesectorsfromthethanbothCO2andCH4.However,wedonotconsidertotalemissions;suchsectorsinclude,amongothers,theseinourreport.Therearetwomainreasonsfossil-fuelextractionanduse,whereabatingCH4forthis.First,theenergysectorisnotasignificantemissionshasanegativecost,oranetmonetarycontributortotheseemissions.Second,thequantitiesbenefit.ofthesegasesarelowdespitetheirhighpotency.Thus,theseemissionscouldpotentiallybemuchmoreMethaneemissionsfromfossilfuelseasilyreducedthroughregulationandarenotcorre-InourOutlook,wepresenttheCH4emissionsfromlatedwithourenergysystemsmodel.thecoalminingprocessandfromoilandnaturalgasextraction,transmission,anddistribution.Bymid-century,CH4emissionswillbehalfofHistoricaldataonCH4emissionsfromallfossilfuelswhattheywerein2020,primarilythankstoareobtainedfromEDGAR,theEmissionsDatabasethereductionindemandforcoalandoil.forGlobalAtmosphericResearch(EC-JRC-PBL,2021).Theresultingemissionsareprojectedbasedonactivitylevelsofoilandnaturalgasproductionbyfieldtype(conventionalonshore,offshore,andCONTENTSDEMANDELECTRICITYRENEWABLESFOSSILFUELSFINANCEPOLICYEMISSIONSREGIONSAPPENDIXDNVEnergyTransitionOutlook20237.3CLIMATEIMPLICATIONS131OurforecastgivesfuturelevelsofCO2emissionsperaverageoxidizesafterapproximately12years(IPCC,yearandenablesustodeterminethecorresponding2001),ittakeshundredstothousandsofyearsforclimateresponseanditsassociatedtemperatureCO2todisappearnaturallyfromtheatmosphereincrease.Wefocusonlyonfirst-ordereffectsanddo(Archeretal.,2009).Thus,withthelengthypersis-notincludepossibletippingpointsandfeedbacktenceofCO2intheatmosphere,thecumulativeloops,suchasmeltingpermafrostandpeatfires,concentrationofCO2givesadirectindicationofwhichwouldaccelerateglobalwarming.Otherclimatelong-termglobalwarming.implications,includingthosedirectlyassociatedwithemissions(e.g.acidificationoftheoceans)andindirectAsthereisacausallinkbetweenconcentrationandconsequencessuchassea-levelrise,arenotdealtwithlong-termtemperatureincrease(IPCC,2021),itisinthisOutlookwhichconcentratesontheenergytran-possibletocalculatetheexpectedtemperaturesitionanditsassociatedCO2emissions.increasebasedonthecumulativenetglobalamountofCO2intheatmosphere.Similarly,limitingglobalCO2concentrationwarmingtoagivenlevelwithagivenprobability,TheconcentrationofCO2intheatmosphereistakingintoaccounttheeffectofotheranthropogenicmeasuredaspartspermillion(ppm).Pre-industrialGHGsandpollution,givesthemaximumamountoflevelswerearound280ppm(GlobalCarbonProject,cumulativenetglobalanthropogenicCO2emissions,2020),andemissionsrelatedtohumanactivities,oftenreferredtoastheglobalcarbonbudget.particularlyburningfossilfuels,haveresultedinasignificantincrease.Themostrecentreading,inJuneCarbonbudget2023wasagainanotherrecordlevelof419.51ppmThecarbonbudgetincludesseveraluncertainties.(NOAAGML,2023).Overthelast60years,therehasTheseincludetheaccuracyofdataonhistoricalbeenanincreaseintheconcentrationofover100emissions,theaccuracyoftheestimatedwarmingppm,whichisofthesamemagnitudeastheentiretytodate,theroleofotherGHGemissionsincurrentofshiftsobservedovertheprevious800,000yearswarming,Earthsystemfeedbacks,andthedelay(IPCC,2021).betweenemissionshavingreachednetzeroandtheadditionalamountofwarminginherentinthesystem.WeforecastacontinuationofCO2emissionstotheThecloserwegettothetemperatureincreasethatatmospherelinkedtohumanactivities,albeitatawewishtoavoid(i.e.increaseabove1.5°C),themoredecreasingrate.Incontrasttomethane,whichontheseparameterscontributetouncertainty.CONTENTSDEMANDELECTRICITYRENEWABLESFOSSILFUELSFINANCEPOLICYEMISSIONSREGIONSAPPENDIXDNVEnergyTransitionOutlook2023Despitetheseuncertainties,thecarbonbudgetTheIPCCcarbonbudgetshavetakenaccountof1.5°Cbudgetwillbeexhaustedin2029.Thecarbon(IPCC,2021)usingthe67%‘likely’overshootof328hasprovedtobeareasonablemethodtoindicateemissionsfromotherGHGs.Methaneemissionsbudgetassociatedwiththe2.0°CthresholdwillbeGtCO2comparedwiththe2.0°Cbudgetsuggestspotentialfuturewarminglevelsbasedondifferentfromfossilfuelsorchangesinagriculturalpractices,exhaustedin2054,outsidetheforecastperiod.Thethattheworldwillreachalevelofwarmingof2.2°Cscenariosforenergy-relatedemissions.Forourincludingfertilizeruseoraerosolemissions,canhaveCO2emissionsfromenergy-relatedactivitiesaswellabovepre-industriallevelsby2100.temperaturethresholds,wehaveusedthe‘likely’considerableinfluenceonthesizeofthecarbonasindustrialprocessandland-useemissionswillstill(meaning67%probability)carbonbudgetsfrombudget.WeusetheIPCCscenariosinlinewith‘verybeconsiderablepost-2050andwillcontinuemany132theIPCCSixthAssessmentReport(IPCC,2021).low’and‘low’non-CO2emissionsestimatesthatyearsthereafter.Thus,thequestionarises:‘WhatByselectinga67%chancetostaybelowthefollowasimilarpathtoourCO2emissiontrajectory.temperatureincreasedoesourforecastsuggest?’selectedtemperature,wehavechosentoincreaseIfemissionsfromnon-CO2GHGsarelarger,thenthecertaintyoflimitingwarmingtoourselectedthecarbonbudgetwillbesmallerandassociatedTemperatureincreaserespectivetemperaturethresholds.IPCCconcludestemperatureincreaselarger.OurforecastandassociatedCO2emissionsendinthattostaybelow1.5°C,wehavetolimitcumulative2050.Therefore,inordertousetheovershootofemissionsfrom2020onwardsto400GtCO2,andtoUsingtheIPCCcarbonbudgetsandthecumulativethecarbonbudgetstoevaluatealikelytemperature1,150GtCO2toremainbelow2.0°C.CO2emissionsfromourforecast,wefindthattheincrease,wemustassesstheemissionsforthelatterpartofthiscentury.By2050,theemissionstrajectoryshowsarelativelysteepdecline,withincreasingamountsofCO2capturedbyCCS.Beyond2050,ouranalysisassumeswewillarriveatnet-zeroCO2emissionsbeforeorattheendofthiscentury.ToestimatetheCO2emissionsandglobalwarmingbytheendofthecentury,weextrapolatethedevel-opmentofemissionsandtheircapturetowards2100.CaptureoccursonlywithinthesectorsshowninFigure7.4;so,forsectorssuchastransportorbuildingswherethereiszeroormarginalcapture,weextrapolateadeclineinlinewithourforecastbutendingatnetzerobeforeorby2100.Theapproachgivesusestimatedcumulativeemissionsof407GtCO2between2050and2100(Figure7.9).Thisestimatedoesnotincludeanylarge-scalenegative-emissionstechnologiesthatmaybeabletoreducetheatmosphericCO2concentrationssignificantly.WiththeupdatedclimateresponsefromIPCCAR6CONTENTSDEMANDELECTRICITYRENEWABLESFOSSILFUELSFINANCEPOLICYEMISSIONSREGIONSAPPENDIXDNVEnergyTransitionOutlook20238REGIONALTRANSITIONS8Analysisoftheregions�1348.7GreaterChina1688.1NorthAmerica�8.2LatinAmerica�1358.8IndianSubcontinent�1758.3Europe�8.4Sub-SaharanAfrica�1388.9SouthEastAsia1818.5MiddleEastandNorthAmerica�8.6NorthEastEurasia�1438.10OECDPacific1861518.11Regionalemissions�1911578.12Comparisonofregionaltransitions�192163133CONTENTSDEMANDELECTRICITYRENEWABLESFOSSILFUELSFINANCEPOLICYEMISSIONSREGIONSAPPENDIXDNVEnergyTransitionOutlook20238WEANALYSE10GLOBALREGIONSNorthEastEurasiaNorthAmericaKEYEuropeIndianSubcontinentSouthEastAsiaNaturalgaswillmeet50%ofprimaryShareofelectricityinfinalenergyenergydemandin2050.Renewablesdemanddoubles,reaching41%ShareofElectricitydemandissettodoublebyTogetherwindandsolarwillmakePrimaryenergytodaystemsfromwillaccountfor34%ofelectricityby2050.non-fossil2050duetoelectrificationofsectorsup50%oftheelectricitymixin2050.80%fossilfuels,butthiswilldecreasegeneration.primaryenergyliketransport.to51%by2050.CO2capturedbyDACreachessources2050SpacecoolingenergydemandinRussia’snaturalgasexportswillremainalmost50Mt/yrby2050.TransmissionanddistributionlineswillbuildingswillgrowthemostasGDPSolarandwindcombinedexpandlowerthanbeforetheinvasionofgrowby45%by2050,alongwithagrowsandthenumberofcooling-daysfromlessthan1%in2022toa22%Ukraine;oilexportsarereboundingbutSolargrows15-fold,windeight-fold,four-foldincreaseininterconnectionsincreases.sharein2050.deliveringlowerrevenues.andutility-scalestorage20-fold.withneighbouringregions.Coalwillhavea20%shareoftheElectricity'sshareinfinalenergyEmissionsdeclineby35%butaccountLatinAmericaEmissionstodeclineby86%fromprimaryenergymixin2050,thedemandgrowsfrom18%todaytoforthehighestemissionsperperson1990levels,butEuropelikelytofallhighestofallourregions.36%by2050.globally.Fossilfuelswillbemeethalfoffinalbehind2030targetsifstricterEUenergydemandin2050,dominatedShareoftargetsareimplemented.GreaterChinabyoil(27%)andnaturalgas(22%).fossilprimaryenergyMiddleEastandNorthAfricaElectricity'sshareofenergydemandSolarPVandwindpowergrowsources2050doublesto44%in2050,thehighestofsignificantlytoaccountfor62%ofElectricity’sshareoffinalenergydemandallregionswithmorethan90%frompowergenerationinmid-century.morethandoublesto32%in2050.renewableenergysources.23Mt/yrofhydrogenandderivativesWindandsolarprovide77%ofelectricity,Theshareofcoalinpowergenerationareexportedby2050,drivenbythesolarcontributing46%andaquarterof(current60%)reducesto24%in2040lowestlevelizedcostforsolar-thisinsolar+storageplants.and5%in2050.poweredhydrogenproduction.AnnualhydrogenproductionasanFrom2022to2050,Chineseenergyenergycarriergrowsfrom0.2Mtinintensitywillreduceby54%(from4.82030to9.3Mtin2050.to2.2MJ/USD)anditscarbonintensityofenergyusewillreduceby60%Sub-SaharanAfrica(from103to42gCO2/MJ).OilandgasexportswilldramaticallyOECDPacificdecreaseasproductiondeclinesandregionalconsumptionincreases.By2028,allnewpowergeneratingcapacityadditionswillbebasedonTogetherwindandsolarwillmakerenewablesornuclear.up70%oftheelectricitymixin2050.NuclearpowergenerationdoublesTransmissionanddistributionlinesfromtodayto2050.willtriple,butlessthan20%ofthepopulationwillhavegridaccessbyTheeconomyisdecouplingrapidly2050.fromemissionsandenergy,whichduetodecliningpopulationisacceleratingthisprocessfurther.134CONTENTSDEMANDELECTRICITYRENEWABLESFOSSILFUELSFINANCEPOLICYEMISSIONSREGIONSAPPENDIXDNVEnergyTransitionOutlook20238.1NORTHAMERICA(NAM)PopulationGDP(USDTrillion)Energyuse(EJ)Energy-relatedCO2emissions(GT)(Million)GDP/person(USD)Energyuse/person(GJ)Energy-relatedCO2emissions/ThisregionconsistsofCanadaperson(Tonnes)andtheUS281045.220223737400027913.8205041941771.3970001843AllGDPfiguresinthereportarebasedon2017purchasingpowerparityandin2022internationalUSD135CONTENTSDEMANDELECTRICITYRENEWABLESFOSSILFUELSFINANCEPOLICYEMISSIONSREGIONSAPPENDIXDNVEnergyTransitionOutlook20238.1NORTHAMERICA(NAM)Characteristicsandcurrentposition80%ofdomesticGHGemissionsinboththeUSandPointerstothefuture—However,ifunaddressed,permittingsnarl-upsandCanada.under-investmentingridscanjeopardizethedecar-Climatechangeaffectsweatherpatternsandcauses—NorthAmericaisatahistoricinflectionpointwithbonizationandthetransformationthatareintendedmorenaturaldisasterstouchingeverycornerofTheregion’spolicyfocusisoncleantechindustrialaconfluenceofforcesthatpromisestodrivethebypoliciesenactedintheregion.NorthAmerica,asseeninthe2023Canadianpositioning,carbon-freedomesticenergydevelop-energytransition:wildfires,record-breakingheatwaves(NOAA,2023),ments,andencouragingeconomicactivityincritical—Renewablesandotherlow-carbonenergywillbeandhurricaneIdaliaintroducingelevatedrisksandstrategicareasforsecuringsupplychainswhile•Policypackagesareamajorboostforcleancheapertoextract,produce,andtransmitthanincreasedpublicacknowledgementofextremeaddressingclimatechange.energyintheregion.Mountingandlong-termfossil-basedenergy,evenwithouttakingnegativeweatherhazards.incentivesofferedbytheIIJA,theIRAandexternalitiesintoaccount.Whilespending4%ofLandmarkbillspassedin2021and2022intheUSCanada’sBudget2023providinga10-yearregionGDPonenergyexpenditurein2022,thisIntheUSandCanada,bothfederalgovernmentsweretheInfrastructureInvestmentandJobsActwindowofcertaintyforinvestments.fractionofGDPwillreducetoaround2.5%byhavesetzeroGHGgoalsfor2050andhaveinter(IIJA),theCHIPSandScienceActandtheInflationmid-century.mediatereductiontargetsfor2030at50to52%ReductionAct(IRA).Similarly,Canada’sBudget•ESGinvestmentdisclosurerequirements,below2005levels(US)and40to45%(Canada).2023AMade-in-CanadaPlanemphasizesclimatedespitetheircontentiousnature,areadvancing—ThetransitionwillshrinkbothhouseholdenergyBothcountriesaimforzero-emissionelectricityinactionandagrowingcleaneconomyunderpinnedclimate-relatedriskreportingandinvestmentsbillsandexpenditures.2035,butdespitedecarbonizationambitions,therebyasupportivefederalpolicytoolkit.Unlikethedisproportionatelytargetedinfurtheranceoftheisadeep-seatedreluctancetostepawayfromfossilUS,Canada’sdecarbonizationregulationcombinesenergytransitionanddecarbonization.—Decarbonizationgoalswillbewithinreachwithfuelsandtheregion’sfossilfueladvantageinlightofincentivesaswellasdisincentivessuchasexplicitinvestmentsinrenewables,hydrogen,carbonglobalenergysecurityconcerns.economy-widecarbonpricing.•Compellingbenefitstolocalcommunitiesthatcaptureandstorage(CCS),anddirectaircapturehavebeenhistoricallyunder-served,orfossil-fuel(DAC)allbeingfront-loadedinthe2030sthanksThedecarbonizationchallengeisgrand.Theenergyfocused,ensuringajustenergytransition.toincentives.However,goalachievementwillmixesoftheregionarecurrentlydominatedbyfossilbehamperedbylackofdisincentives,suchasafuels,andenergy-relatedemissionsaccountforoverregion-widecostoncarbonemissions,whichalsoraisestheriskof‘carbonleakage’betweenUSstates.136CONTENTSDEMANDELECTRICITYRENEWABLESFOSSILFUELSFINANCEPOLICYEMISSIONSREGIONSAPPENDIXDNVEnergyTransitionOutlook2023Watt’sup,NorthAmerica2.5-foldbetween2022and2050,especiallysincethegridisseenasastrategicnecessityforthisAsacelebrationofDNV’s125thyearanniversaryintransformation.However,agreatdealhingesontheUS,wepublishedadedicateddeep-divereportthetimingofthisexpansion.ontheEnergyTransitionNorthAmericainSeptember2023(DNV,2023c).—Inkeepingwiththeboomofvariablerenewableenergysources(VRES),stand-alonegrid-connectedInthisOutlook,wesummarizethesalientaspectsenergystoragepresentsasignificantbusinessoftheNorthAmericanenergytransitionandinviteopportunityforpowerpricearbitrage,andwereaderstoexplorethesedevelopmentsingreaterexpectenergystoragecapacitytogrow20-folddepthinourfullNorthAmericareport.fromtodayto2050.—NorthAmerica’senergysystemundergoesavast—CO2emissionscapturedbyCCSprocessestransformation.Electricity’sshareinfinalenergyincreasesfrom17Mtin2022to242Mtby2050.demanddoublesfrom21%todayto41%by2050.DACincreasesfromvirtuallynothingtodaytoabout50Mtby2050.—Electricitymakessignificantinroadsintothekeydemandsectors:transport(25%),buildings(70%),Notfastenoughfornetzeroandmanufacturing(34%),leadingtolowerlossofTheenergytransitionweexpecttoseeunfoldinenergy,whichisinherentinfossil-fuelsuse,andNorthAmericaisnotfastenoughtoreachthehigherenergyefficiencies.climatetargetsoftheregion.Comparedwith1990emissionlevelsasacommonreferencepointforall—Hydrogenanditsderivativescombinedincreaseregions,NorthAmericaasaregionistargetingtotalfromvirtuallynothingtodayto10%by2050.reductionsof36.1%inenergy-relatedemissionsHydrogenproductionasenergygrowsfromveryby2030.Thistargetislowerthanstatednationallysmalllevelsto53Mtby2050.determinedcontributions(NDC)pledges,as1990emissionswerelessthanin2005.WeestimateCO2—Solarsees15-foldgrowthandwindeight-foldemissionswilldecreaseby37%comparedto2005growth,despitetheshort-termsupply-chainandlevels(24%comparedwith1990levels),meaningcostinflationarypressures.theregion’stargetwillnotbeachieved.By2050,ourestimatesindicatethattheregionwillhavereduced—Short-termdelaysingridcapacityexpansionitsenergy-relatedemissionsby75%comparedwiththreatenthisrenewablesboom.Despitethis,we2022levelsandwillstillbeemitting1.3GtCO2perforecastthetransmissiongridcapacitywillexpandyearin2050despitetheregion’snet-zeropledges.137CONTENTSDEMANDELECTRICITYRENEWABLESFOSSILFUELSFINANCEPOLICYEMISSIONSREGIONSAPPENDIXDNVEnergyTransitionOutlook20238.2LATINAMERICA(LAM)PopulationGDP(USDTrillion)Energyuse(EJ)Energy-relatedCO2emissions(GT)(Million)GDP/person(USD)Energyuse/person(GJ)Energy-relatedCO2emissions/ThisregionstretchesfromMexicotothesoutherntipofperson(Tonnes)SouthAmerica,includingtheCaribbeanislandnations12.3351.5202268818300522.3205074420.8391.127900521.5AllGDPfiguresinthereportarebasedon2017purchasingpowerparityandin2022internationalUSD138CONTENTSDEMANDELECTRICITYRENEWABLESFOSSILFUELSFINANCEPOLICYEMISSIONSREGIONSAPPENDIXDNVEnergyTransitionOutlook20238.2LATINAMERICA(LAM)Characteristicsandcurrentpositioncombined69GWofutility-scalesolarandwindPointerstothefuturerelyoninternationalcontributionssuchasfromthecapacity(GEM,2023).Therearecurtailmentrisks,EU(EEAS,2023).Chiletargets100%EVnewsalesAtpresent,renewablesaccountforathird(33%)andframeworkspromotingregionalelectricity—Argentina’slithiumexportsurged234%in2022by2035andindustrialdecarbonizationthroughofLatinAmerica’stotalenergysupply,morethaninterconnectionareinadequate(Levyetal.,2023).(Jones,2023).Amodestrenewablepowermixelectrificationandgreenhydrogen.doubletheglobalshareofrenewables(13%)(OECDtarget(20%by2025,fromaround12%inearlyetal.,2022).Withbiomass,geothermal,hydropower,Focusondistributedgenerationandfurtherrenew-2023)willhinder2030hydrogenambitions—Colombiapursues3GWelectrolysiscapacityandsolar,andwindresources,regionalcarbonintensityablespenetration(e.g.Chile,Colombia,andCostarequiringmorethan5GWelectrolysiscapacity.50kt/yrbluehydrogenby2030withinternationalisamongthelowestglobally.Rica’sRELACinitiativefor70%renewablesintheReducingnaturalgaspricesandimportsmotivatessupportsuchasGermany’sInternationalPtXHub.2030powermix)underpinshydrogenexportfurtherVacaMuertashaleinvestments,suchastheThegovernment(Decree1476,August2022)LatinAmericacantakeastrategicpositionintheaspirations.pipelinetoBuenosAires.providesregulatorycertainty.Anoffshorewindenergytransitionwithrawmaterials,low-carbontender(2023)isplanningfourtosixprojects,andfuels,andrenewableelectricity.ThispotentialisTheregionhasworld-classunconventionalfossil-fuel—BrazilaimstomaintainhydropowerinabsoluteitsNationalElectricVehicleLawwillpushsalesandexemplifiedbytheregionhaving:60%ofworldresources,andseveralcountrieshavesignificantterms(butlosingsharetowindandsolar).Windinfrastructure.lithiumreserves,40%ofthecopper,and30%oftheoilandgasproduction.BrazilandGuyanaareandsolarwillgrowrapidly,andbeingafirstmovernickel(OECDetal.,2022);highrenewableelectricitysurpassingMexicoandVenezuelatoleadinoil(withColombia)withinoffshorewindregulation—Mexico’sgovernmentfavoursfossilfuelsforenergyshares(Paraguayabout99%,Uruguayabout90%);production(Cardenasetal.,2023).willenablehydrogenenergy(NationalEnergysecurityreasons.Therenewables-focusedSonoraandBrazil’slongstandingbiofuelproductionandPlan2050).Adoublinginoilandgasproductionplan(BNAmericas,2022)lacksclarityandpoliticalhydropower.However,climatechangeisdisruptingAgriculture,forestry,andland-use(AFOLU)accountisplannedby2030,coupledwithcarbon-intensityriskhindersinvestment.Theforthcoming2024thewatercycleandtherebyimpactingregionalforaround40%oftheregion’sGHGemissions,withreductionefforts.federalelectionhastherenewablessectorhopinghydroelectricgeneration.another43%comingfromtheenergysector,wellformorefavourablepolicy.belowthe74%globalaverage(UNDP,2022).—Chiletargets25GWelectrolysiscapacityby2030.CompetitivetenderinghastriggeredimpressiveAUSD1bnbudgetedgreenhydrogenandderiva-growthinnon-hydrorenewablestotoday’stivesfund(ChileMinistryofFinance,June2023)will139CONTENTSDEMANDELECTRICITYRENEWABLESFOSSILFUELSFINANCEPOLICYEMISSIONSREGIONSAPPENDIXDNVEnergyTransitionOutlook2023Energytransition:stronggrowthofsegments,drivenbyacombinedeffectofrisinghighestamongalltheETOregions.Also,LatinallSouthAmerica’scoastlinefeaturesconditionssolarandwinddomesticallyandamajorlivingstandardsandgrowingpopulation,andAmericaiscurrentlytheonlyregionwheremorethanfavourableforwindpower.Brazilrankedthirdintheexporterofrenewablehydrogengloballypoweredpredominantlybyelectricity.Energyhalftheelectricityisgeneratedfromrenewables.Theworldfornewwindcapacityinstallationsin2022demandinmanufacturingwillgrowmodestlyby35%largestrenewablesourceishydropowersupplying(GWEC2023).LatinAmerica’sfinalenergydemandhastrackedastheeffectsofincomepercapitaandpopulation46%oftotalpowerproduction.relativelyflatinthepastdecade,reflectingonlywillbepacedbyefficiencygainsandgreateruseofRenewablesarealreadytwo-thirds(66%)ofmarginalimprovementinstandardsofliving.Onlyelectricity.Inthetransportsector,increasingelectri-However,thereissubstantialpotentialforgrowththepowermixinLatinAmerica,thehighestafter2025doesincomepercapitariseagain,leadingficationwillalmostcompletelycounteractthevehicleofotherrenewablesourcesofpowerintheamongalltheETOregions,butthereisstilltoamoderate23%increaseintheregion’sfinalfleetexpansion:energydemandwillpeakinthelateregion,whichisalreadybeingreflectedinrecentsubstantialroomforgrowthinrenewableenergydemandbetween2022and2050(Figure2030sandthendecreasetoroughlyitscurrentlevelinvestmentinnewcapacity.Giventhenear-perfectsources.8.2.1).Anoverwhelming87%ofthisincreasewillby2050.conditionsforsolarpowerintheAtacamaDesertbemetbyelectricitygeneration,whichwillmoreandelsewhereinotherpartsoftheLatinAmerica140thandouble.TheshareofelectricityinfinalenergyRenewablesregion,countriessuchasChile,Argentinaand,todemandwillthereforeincreasefrom18%to31%Today,renewablesalreadyhaveatwo-thirds(66%)someextent,Brazilareinvestinginsolarpowerinthesameperiod.RenewableswillbecomeevenshareinpowergenerationinLatinAmerica,thetodecarbonizeenergyandothersectors.Almostmorepotentintheregionalenergymix;theirshareinprimaryenergydemandwillincreasefromaround30%todaytoalmostahalf(48%)in2050(Figure8.2.2).Whilebiomassandhydropower,thecurrentleadersinthesupplyofrenewableenergyinLatinAmerica,willretaintheirshares,mostgrowthinrenewableswillcomefromsolarPVandwind.Despitethisimpressivegrowthincleanenergy,halfofthefinalenergydemandwillstillbemetfromfossilsources.Oilandnaturalgaswilldominatethefossilenergy,meeting27%and22%ofthefinalenergydemand,respectively.Coalandnuclearfuelswillremaininsignificantenergysourcesintheregion.EnergydemandAmongLatinAmerica’senergydemandsectors(Figure8.2.3),buildings’energyusewillincreasemost–by42%.SuchanincreasereflectsthespreadingofheatingandcoolingservicestonewCONTENTSDEMANDELECTRICITYRENEWABLESFOSSILFUELSFINANCEPOLICYEMISSIONSREGIONSAPPENDIXDNVEnergyTransitionOutlook2023Owingtothesedevelopments,andwhilehydropowerHydrogenregion’ssolar-basedhydrogenischeaperthanmostthatabout23MtH2ofhydrogenanditsderivativeswillincreaseslightlyinabsoluteterms,theincreasingWhilestrongelectrificationthroughsolarandwindofitscompetitors,suchaswind-basedhydrogenwillbeexportedannuallyfromLatinAmericaby2050.demandforelectricitywillbemetbysolarandwind.powergrowthisthemaindriveroftheregion’senergy(Figure8.2.5).Fromthelate2040son,solar-basedAlmostallofthiswillbeexportedasammoniaandWeforecastthatsolarandwindwillgrowsignificantlytransition,LatinAmericancountriesarealsoinvestinghydrogenproductionwillbecompetitivewithnaturalforenergypurposes(93%),withhalfoftheammoniainthecomingdecades,respectivelyprovidingaboutheavilyinrenewablehydrogen.Today,LatinAmericagas-basedhydrogenproductionatjustaboveUSDshippedtoNorthAmericatosupportitsIRA-super-16%and21%ofpowergenerationin2030,andproducesonlyabout5%oftheworld’shydrogen2/kg.Wind-basedhydrogenproductionwillremainchargedhydrogendemand;theremainderwillgotoalmost32%and30%by2050(Figure8.2.4).Theoutput,almostentirelyfromunabatedfossilfuels,slightlycostlierthansolar-basedonaverageinAsiaandEurope.shareofhydropowerwillthereforedeclineto28%fortheregion’smanufacturingsector.Itsroleinthetheregion.Atpromisingwindsites,however,theinmid-century.TheincreasingroleofrenewablesglobalhydrogenmarketwillchangesignificantlyinthelevelizedcostofhydrogenmightbeevenlowerthanTorealizetheseprojections,theregionmustproperlyinpowerwillbeaccompaniedbyacorrespondingnextthreedecades.Sinceelectricitywilldrivedecar-forsolar-basedhydrogen.planthechallengingpartofthisundertaking:hydrogendeclineintheshareoffossilfuelsfrom32%currentlybonizationofsectorsfitforelectrification,theregion’stransport.Itappearsthatitwilldoso,includingtoonly8%in2050.Almostalltheremainingfossil-abundantrenewableresourcesgiveittheopportunityGiventhelowlevelizedcostofhydrogenproductionpipelinesforintraregionaldistributionofhydrogen,andfuelledpowergenerationwillbeprovidedbynaturaltobecomeanexporterofhydrogentoEurope,Northandthevastpotentialforsolarpowerexploitationexportterminalsforhydrogenconversiontoammonia.gas-firedplants.America,Asiaand,toalesserextent,aproducerofandpromisingwindresources,LatinAmericawillinLatinAmerica’sstrongnaturalgaspipelinenetworkwillhydrogenfordomesticdecarbonization.However,factbecomeamajorhydrogenexporter.Weforecastberepurposedforhydrogentosupporttheambitions.significantuptakeofhydrogenproductionisonlyenvisagedtostartinthenextdecade,ascostswillneedBiofuelstocontinuetheirdeclineandgovernmentsneedtimeBesidesbeinginagoodpositiontosupplyothertoestablishthemanyframeworksenablinghydrogenregionswithgreenhydrogenfromsolarandwind,production,export,andpotentialdomesticuse.LatinAmericahasgreatpotentialtofurtherdisplaceimportedfuelsdomesticallywithbiofuelslikeFromtheearly2030s,hydrogenproducedbybioethanol,biodiesel,andbiogas/biomethane.electrolysispoweredbydedicatedrenewableswillstarttakingoffmorerapidly,reachingaround19%Brazil`ssugarcaneethanolprogramme,launchedoftotalhydrogenproductionin2050.Thissharein1975,Argentina’ssoyabiodiesel,andColombianisdramaticallyhigherthantoday,butlowerthanpalmoilbiodieselareprimeexamplesoftheregion’sthatofhydrogenproducedfromfossilfuelsabatedsuccessinprovidingrenewablealternativestofossilwithCCS.Thelatterwillaccountforaroundhalfoffuels.LatinAmericancountriesarepromotingtotalhydrogenoutputin2050.Onlyabout11%ofbiofuelusethroughstrongmandateswithhighhydrogenwillbeproducedfromunabatedfossilfuels.blendratesofethanolandbiodiesel.Theregion’sshareinupgradingitsbiogastobiomethane,whichThankstohighcapacityfactors,LatinAmericawillhasabetteroverallsupply-chainfootprint,isverybeamongtheregionswiththelowestlevelizedcosthigh.Currently,about35%ofLatinAmerica’sbiogasforsolar-poweredhydrogenproduction.Infact,theproductionisfurtherrefinedtobiomethane(IEA,141CONTENTSDEMANDELECTRICITYRENEWABLESFOSSILFUELSFINANCEPOLICYEMISSIONSREGIONSAPPENDIXDNVEnergyTransitionOutlook20232020).By2050,biomethanewillreplace4%of30%from2022levelsby2050,reaching1.1GtCO2/yrinIndiaandSouthEastAsia,andare37%lowerthan142domesticmethanedemandintheregion.(netofDAC)asshowninFigure8.2.6,and1.23Gtifcurrentlyintheregion.Itshouldalsobenotedthatincludingnon-energyprocessemissions.ThedeclinesomeLatinAmericancountries,includingBrazil,Asaresultofthoseambitionsandtheassociatedwillbemorepronouncedintransportandmanufac-Argentina,Colombia,andChilehaveindicated—orenergytransitiongoingforwardinLatinAmerica,turing,drivenbyefficiencygains,achangingenergyhavealreadyadopted—carbon-neutralitytargetsbyuseofoilforenergy,theregion’slargestsuchsourcemix,andtoasmallerextentbycarboncapture.Today2050.However,thesetargetsoftentakeintoaccounttoday,willdeclinebyaquarter.Inaddition,growthinandinthefuture,oilcontributesmosttoemissionsthelandandforestrysector,whichmeansCO2uptaketheuseofnaturalgasforenergywillstallsoonand(almost50%),andismainlyusedinLatinAmerica’sfromrainforestareasareincluded.willnotovertakeoilasthelargestprimaryenergytransportsector.Thenatural-gasdominatedmanu-sourcewithintheforecastperiod(Figure8.2.2).facturingandbuildingssectorstogethercontributeEnergy-relatedCO2emissionsdecreasebyBiomass,intheformofliquidbiofuelsintransport,asanotherthirdtoLatinAmerica’semissionsin2050.30%from2022levelsby2050.agaseousenergycarriersubstitutingnaturalgasandBythen,CCSwillreduceCO2emissionsby108Mt/assolidbiomassinthebuildingssector,willretainitsyrinmid-century,equivalenttoaround9%ofthe18%shareinprimaryenergymixtowards2050andregion’semissionsbythen.supportLatinAmerica’senergytransition.Inthecontextofglobalclimatepolicy,countryNDCEmissionspledgesindicateanincreaseintheregionaltargetofTheregion’saveragecarbon-pricelevelisprojectedlimitingincreasesinemissionstoabout61%by2030,toincreasetoUSD10/tCO2in2030,andUSD40/tCO2relativeto1990.OurOutlookshowsenergy-relatedemis-by2050.Therearecarbon-pricingschemes,suchassionsrisingaround53%overthesame40-yearperiod.taxationinArgentina,Chile,Colombia,andinsomeThissuggeststhattheregionaltargetwillbeachievedbyMexicanstates.Pricingispresentlylowbutadditionalagoodmargin,indicatingalowlevelofambition.pricinginstrumentsareunderconsideration,suchasinBrazil(seeSection6.3).Itshouldbenotedthatthereareuncertaintiesincomparingtargetsandforecasts.SomecountriesareHigherpricingcouldalsocometoavoidcarbon-borderunclearaboutwhethertargetsinNDCsalsoincludeadjustmentmechanismsfromlargetradingpartnersnon-energy-relatedCO2emissions.EspeciallyinLatinsuchasChinaandEurope,bothofwhichhavecarbonAmerica,thereisalargedifferencebetweentargetspricinginplaceandareseenaspossibletradepartnersincludingandexcludingLULUCF(landuse,land-usefor,amongotherproducts,low-carbonhydrogen.change,andforestry)duetotheinfluenceoftherainforestonthetotalemissions.LatinAmerica’senergy-relatedCO2emissionspeakedaroundyear2015.TheywilldeclinefurtherthroughOnapercapitabasis,LatinAmerica's1.6tCO2perthe2020s,stabilizeinthe2030s,thendecreasebypersonemissionsin2050arecomparabletothoseCONTENTSDEMANDELECTRICITYRENEWABLESFOSSILFUELSFINANCEPOLICYEMISSIONSREGIONSAPPENDIXDNVEnergyTransitionOutlook20238.3EUROPE(EUR)PopulationGDP(USDTrillion)Energyuse(EJ)Energy-relatedCO2emissions(GT)(Million)GDP/person(USD)Energyuse/person(GJ)Energy-relatedCO2emissions/ThisregioncomprisesallEuropeancountries,includingperson(Tonnes)theBaltics,butexcludingRussia,alltheotherformerSovietUnionRepublics,andTurkey28.8673.12022543530001245.6205054240.0600.5740001110.8AllGDPfiguresinthereportarebasedon2017purchasingpowerparityandin2022internationalUSD143CONTENTSDEMANDELECTRICITYRENEWABLESFOSSILFUELSFINANCEPOLICYEMISSIONSREGIONSAPPENDIXDNVEnergyTransitionOutlook20238.3EUROPE(EUR)Characteristicsandcurrentpositionpermittingofstrategicnet-zeroprojects,andthePointerstothefuture—RegulatorycertaintyforgreenhydrogenCriticalRawMaterialsActtosecurethesupplyandaccelerationincludes:delegatedactsdefiningTheEUsenergyimportdependencystoodat55.5%supplychainsofstrategicrawmaterialstonet-zero—Europeangovernmentsarespeedingupenergywhatcountsasrenewablehydrogen(oritsin2021(Eurostat,2023).Russia’sinvasionofUkrainetransitioning(40%ofannualdeploymentneedsbysystem-widetransformation.derivativesRFNBO)andmethodologytocalculateputsindependenceandsecurityontopofthe2030).GHGemissions(EC,2023c);andtheEuropeanenergyagenda.—TheEnergyEfficiencyDirectivetargetsa11.7%HydrogenBanktoprovideproducerswithfixedTheEU’sTemporaryCrisisandTransitionFrameworkreductionoffinalenergyconsumptionby2030.10-yeargreensubsidies(DGCA,2023).Thegasdemandreductionregulationhascausedan(TCTF)loosensStateaidrulesthrough2025to18%dropinconsumption(August2022—May2023)supportstrategicsectors(e.g.batteries,solarpanels,—TheRenewableEnergyDirective(REDIII),—RenewablepowerandgridswillbethebackboneandisextendedtoMarch2024(DG-Energy,2023a).windturbines,heatpumps,electrolysers,andCCSincreasingambitionsfrom32%toabinding42.5%toreachtargets.ImplementingtheREPowerEUplanTheEUhasestablishedgasallianceswithsuppliersinequipment)withaidupto45%or100%ifcompetitiveofenergyconsumptionin2030,strivingfor45%,meanstherenewableelectricitysharegrowstotheUS,theMiddleEast,Africa,andSouthAmerica,bidding,andallows‘matchingaid’incaseofrelocationwillmeanroughlydoublingtheexpansionof69%in2030(592GWsolarPVand510GWwind)whilealsoincreasingitsLNGimportcapacity.risks.renewables(about22%in2021).(DG-Energy,2023b).MorevariablerenewableswillrequiresignificantgridreinforcementanddemandPromptedbyotherregions’cleantechspending,theTheelectricitymarketreformproposal(March2023)—REDIIIwillcreateamarketramp-upfore-fuelsresponsesolutions.EUlaunchedtheGreenDealIndustrialPlan(GDIP)forfocusesonprotectingconsumersagainstprice(renewablefuelofnon-biologicalorigin—RFNBO).asupportiveenvironmenttoscaleEuropeannet-zerovolatilitythroughpowerpurchaseagreements(PPAs)Intransport,aimingfora29%renewablefuel—Permittingreform,includingdesignatingprojects/capacity(technologiesandproducts).ThePlanandboostingrenewablestomakeenergycheapersupply(2030)withbinding5.5.%sub-targetsforareasofoverridingpublicinterestandswiftercomplementsexistinginitiatives(i.e.EuropeanGreen(EC,2023b).advancedbiofuelsandRFNBO.Inbuildings,thepermittingdeadlineswillneedimplementation,Deal,Fitfor55package,theREPowerEUplan).indicativerenewabletargetis49%.Industry’swhileensuringpublicsupportintheprocess.indicativetargetisa1.6%annualincreaseto2030,PartoftheGDIPistheNet-ZeroIndustryActtoand42%ofhydrogenusefromRFNBOsby2030increasedomesticmanufacturingcapacityandfasterand60%by2035.144CONTENTSDEMANDELECTRICITYRENEWABLESFOSSILFUELSFINANCEPOLICYEMISSIONSREGIONSAPPENDIXDNVEnergyTransitionOutlook2023Energytransition:front-runnerstrivingforinroadsintotheenergyscene.By2020,solarhadProjectingforward,theshareofrenewablesincontributionrates.Theanticipatedshifttowardsenergyindependencegrownto0.7EJ,whilewindenergy,startingfromEurope’sprimaryenergyconsumptionisanticipatedrenewables,coupledwithwidespreadelectrificationzero,reached1.7EJ.Moreover,coalconsumptiontorisefrom18.5%in2022to29%in2030,reachingandastrategictransitionfromfossilfuels,willleadtoToday,asthecontinenttargetsa2050horizonfordramaticallydeclinedfromitspeakof21EJin198062%by2050.Factoringintheaforementionedadeclineinprimaryenergyconsumption:from67EJclimateneutrality,itsleadershipinclimatepoliciestojust7EJin2022.definitionaldiscrepancies,butalsoacknowledgingin2022to60EJby2050.resonatesglobally.TheEuropeanGreenDeal,angeographicalvariationsbetweenourEuroperegionemblematicinitiative,underscoresthiscommitment,Buildingontheachievementofthe20%renewableandtheEU,ourassessmentsuggeststhattheEU'sEnergyindependenceofferingablueprintforsustainablefuturegrowth.targetin2019,ayearaheadofits2020deadline,binding32%renewablestargetingrossavailableEurope'squestforenergyindependenceisintricatelyEurope'sinterconnectedness–bothintermsoftheRenewableEnergyDirective2018/2001/EUenergymaybebarelyattainable.Theloftiergoalofwovenintoitshistorical,geopolitical,andeconomicenergygridsandsharedpolicyambitions–issetanewbindingtargetfortheEU:aminimumofa42.5%shareislikelytobereachedonlyby2035.narratives.Traditionallyanchoredtoexternalenergypivotal.Itnotonlyfacilitatescross-borderenergy32%renewableenergyby2030.On14July2021,supplies,notablyRussiangasandMiddleEasternoil,exchangesbutalsofosterscollaborativepolicy-undertheEuropeanGreenDeal,theEuropeanBy2050,solarenergyispredictedtodominatetheEuropehasexperiencedvulnerabilityinitsenergymaking.Thistranscontinentalunity,however,doesCommissionintroducedtheFitfor55legislativeenergycomposition,accountingfor23%,closelysecurity.Thisfragilitywasevidentduringeventsnotdiminishtheregion'sdiversity.Eachnation,package,proposinganincreaseinthistargetto40%.trailedbywindat21%.Nuclearenergy,bioenergy,likethe1973oilcrisisandmorerecently,the2022withitsuniqueenergymatrixandchallenges,However,inMay2022,theREPowerEUplanproposedandhydropowerareexpectedtosustaintheircurrentRussianinvasionofUkraine.Suchepisodesunder-contributestoaholisticEuropeanapproachthatafurtherincreaseto45%by2030.Regrettably,neitherscoredEurope'sneednotjusttosecureconsistentisbothinclusiveandtailored.Itisthisblendofproposalwaslegallyratified.InMarch2023,aprovi-energysupplies,butalsotodiminishgeopoliticalsharedpurpose,combinedwithrespectforregionalsionalagreementwasmadebetweentheEuropeanthreatsandfosterstrategicautonomy.nuances,thatsetsEuropeapart.AsthecontinentParliamentandtheCounciltoelevatethebindingmarchesahead,itsenergytransitionstory–rootedrenewableenergytargettoaminimumof42.5%Perspectivesonenergyindependencedivergeinitspast,informedbyitspresent,andvisionaryinby2030.Thisagreementwillcomeintoforceonceacrossthecontinent.EasternEuropeancountries,itsoutlook–offersinvaluableinsightsfortheworldformallyadoptedbyboththeEuropeanParliamentinfluencedbytheirhistoricalcontextsandatlarge.andtheCouncil.geographicalclosenesstoRussia,remaincautiousaboutrelyingheavilyonasingleenergysource.InPrimaryenergyuseandrenewabletargetsItisessentialtounderstandhowtheEUdefinesitscontrast,WesternEuropeannationsbalancetheirOverthepastfewdecades,Europe'sprimaryenergyrenewableshare.Therenewablepercentageencom-strategies,takingintoaccountenvironmentalconsumptionhasundergonesignificantchangespasseshydropower,geothermal,wind,solar,andimperatives,thedesireforadiversifiedenergy(seeFigure8.3.1).Inthe1980s,fossilfuelsaccountedtheambientheatutilizedinheatpumpsforheatingportfolio,andeconomicconsiderations.foradominant92%oftheenergymix.However,byandhotwater(excludingcooling).Grossavailable2022,thishadreducedtoaround70%.Thisdecreaseenergyisusedtomeasurethis,excludingenergylostDespitetheseaspirations,Europe'senergylandscapewasprimarilyduetoasharpfallincoalconsumption,infossil-firedpowerstationsandfrominternationalrevealsasubstantialdependenceonimports.Incomplementedbythegrowthofnuclearenergyaviationandmaritimeactivities.Thus,theEU's2022,theEuropeanUnion,positionedastheworld'sandnaturalgas.The2000smarkedaturningpoint,definitiondeviatesfromthecalculationofrenewablesprimaryenergyimporter,drew69%ofitsoiland57%assolarandwindenergybeganmakingnotableinprimaryenergyconsumption.ofitsnaturalgasfromexternalsources.145CONTENTSDEMANDELECTRICITYRENEWABLESFOSSILFUELSFINANCEPOLICYEMISSIONSREGIONSAPPENDIXDNVEnergyTransitionOutlook2023In2022,theEuropeanUnion,positionedasunderscorestheimportanceofrenewableenergy,TheroleofnuclearenergyandhydropowerinthisFinalenergydemandtheworld'sprimaryenergyimporter,drewprioritizingenergyefficiency,andmoderatingenergyenergytapestrycannotbeunderstated,thoughFinalenergydemandinEuropewillchange69%ofitsoiland57%ofitsnaturalgasfromconsumption.AfterRussiainvadedUkrainein2022,opinionsontheiradoptiondifferacrossEurope.profoundlyinthenextthreedecades,asillustratedinexternalsources.Europediversifieditsenergysuppliers,increasingCountrieslikeFranceandSwedenviewnuclearpowerFigure8.3.3.PopulationinEuropewillremainstable,itsproductionincountrieslikeNorwayandampli-aspivotalforenergyautonomyandcarbonreduction,around540millioninhabitants,andGDPpercapitaInitsmissiontoenhanceenergyautonomy,Europe'sfyingitsLNGprocurementfromNorthAmerica,thewiththeformersourcingasubstantialsegmentofitswillincreaseby39%.Incontrast,finalenergydemandstrategiesencompassdiversifyingitsenergyMiddleEast,andelsewhere(seeFigure8.3.2).electricityfromnuclearfacilities.Meanwhile,theUKwilldecreaseby21%asthecombinedresultofsupplysources,fortifyinginfrastructureresilience,aimstotransitionfromlarge-scalenuclearsetupstodemandreductionduetobetterinsulation,improvedandamplifyingdomesticenergyproduction.However,apivottorenewablesintroducesitsownsmallmodularreactors.Ontheotherhand,Germany,publictransport,measurestoreducedemandsuchTheEuropeanGreenDeal,whichseekstopositionsetofchallenges,especiallyconcerningsupply-stillinfluencedbytheFukushimadisaster'saftermath,ascongestioncharging,otherbehaviouralchanges,Europeasthefirstclimate-neutralcontinentby2050,chaindynamicsforcrucialmineralssuchaslithium,haschosenapathawayfromnuclear,focusingmoreaswellasenergy-efficiencygainsandrapidelectrifi-cobalt,andrareearthelements.Forinstance,China'sonrenewables.Richinwaterresources,nationslikecation.Fossil-fuelusewillbeincreasinglyconfinedtosubstantialinvestmentsinsolarPVequipmentNorwayandSwitzerlandchampionhydropower,afewsectors.Oildemandwilldecreasefrom22EJoverthelastdecadeoutpaceEurope'sby10-fold.consideringitbothasustainableenergysolutionandin2022to7.7EJin2050andwillmainlycomefromWithChinaaccountingfor75%oftheEU'ssolarPVastrategiclinchpinforenergyindependence.non-energyuseinthepetrochemicalindustry(52%)imports,thenatureofthisdependenceisshifting.andtransport(34%).Inthemeantime,demandforAlthoughthevalueofthesesolarimportsin2020naturalgaswilldecreasefrom18EJto6.9EJ,withwasconsiderablybelowfossil-fuelexpenses,theastrongremainingdemandforcooking,spaceandshifttodomesticproductionisanticipatedtoelevatewaterheating(75%),andmanufacturing(15%)toathecostsofsolarpanelsinEurope.Policiesaimedatlesserextent.Theuseofbioenergyinend-useswillhomeshoringarepredictedtoaddroughly10%togrowuntil2030andwillstarttobereplacedbythesolarPVCAPEXuntiltheearly2030s.electricityandhydrogenassustainabilityconcernsleadtostricterregulationofbioenergyuse.Peeringinto2050,advancementsintechnology,resolutepoliciesfavouringrenewables,andEurope'sElectrificationcollectivedeterminationforstrategicautonomyElectrificationiscrucialforenergyefficiency,suggestamoreself-reliantenergyscenario.Still,decarbonization,andensuringenergyindependence.achievingabsoluteindependenceappearsunlikely.By2050,Europe'selectricitydemandispredictedtoTheapproachwillprobablymovetowardsablendsurgefrom3.4PWhin2022to6.6PWh.Oneoftheoflocalenergyproduction,diversifiedimports,andmostprominentchangeswewillseeinourdailylivesrobustinternationalpartnerships.Thisstrategy,istheelectrificationofroadtransport.coupledwithananticipateddeclineindemand,portendsasubstantialdecreaseinimports:59%forMotivatedbystringentregulations,suchastheEU'soiland66%fornaturalgasfrom2022levelsby2050.prohibitiononthesaleofnewinternalcombustion146CONTENTSDEMANDELECTRICITYRENEWABLESFOSSILFUELSFINANCEPOLICYEMISSIONSREGIONSAPPENDIXDNVEnergyTransitionOutlook2023engine(ICE)passengervehiclesby2035,thereisaOverthenextdecade,theremainingincreaseinThebackboneofthiselectrificationanddecarbonizationneckslikepermittingdelaysandgridconnectionforecastedshifttowardsbattery-electricvehicles.electricitydemandwilllargelystemfromconventionalwillbepowersourcedfromrenewables,bolsteredbyavailabilityhavehamperedrenewablegrowth.ToExcludingplug-inhybrids,thesevehiclesareend-uses:buildings,roadtransport,andmanufac-accelerationpolicieslikethosefromREPowerEU.Navi-overcomethesechallenges,theCouncilandtheexpectedtorisefrom1.5%ofthetotalpassengerturing.Bythelate2030s,hydrogenproductionfromgatingthisgrowthwilldemandstrategicapproachesCommissionagreedinMarch2023toexpeditevehiclefleetin2022to23%by2030andangrid-connectedelectrolyserswillemergeasatopowergenerationandgridmanagement.Whilepermitsforrenewableprojects.Asynchronizedimpressive93%by2050.CountrieslikeNorwayaresignificantconsumerofelectricity.Europehasestablishedsharedguidelines,suchastheplanningapproachbetweencountries,focusingonspearheadingthistransition,targetinga46%EVfleetEUgreentaxonomyandcarbonpricing,individualsimultaneousgridandrenewabledevelopments,canshareby2030.CommercialvehiclesposeadifferentTheshiftinroadtransportalonewillresultinnationswillapplydiversestrategiesbasedontheirfurtherstreamlinetheprocess.By2050,weantic-setofchallenges,withtheirelectricsharecurrentlyanadditional900TWhofannualelectricityresources,incentives,andindustrialpolicies.ipatea45%growthintransmissionanddistributionnegligible.However,thissegmentispredictedtodemandby2050–equivalenttoone-thirdoflinesandafour-foldincreaseininterconnectionswithachieve9%by2030andaverymuchhigher75%byEurope'scurrentelectricityconsumption.Forinstance,theIberianPeninsulaaspirestoharnessadjacentregions,ensuringbothgridstabilityand2050.Thisshiftinroadtransportalonewillresultinitssolarandwindresources,positioningitselfdependablepowersupply.anadditional900TWhofannualelectricitydemandasEurope'srenewablepowerhouse.Incontrast,by2050–equivalenttoone-thirdofEurope'scurrentNorthernEurope,withitsimmensewindpotentialTowardsaflexiblepowersystemelectricityconsumption.andlimitedsolarcapability,islookingtoheavilyAsEuropeforgesaheadtowards2050,theregioninvestinwindenergy,particularlyintheNorthSeaisexperiencingatransformativeshiftinbothpowerregionforbothfixedandfloatingwindturbines.demandandsupply.Beingattheforefrontofinte-Whilenuclearenergyremainsacontentioustopic,gratingvariablerenewables,Europe'spowersystemitwilllikelypersistasastapleincountrieswithaisencounteringunprecedentedchallengesthathistoricalreliancelikeFrance,theUK,andsomenecessitateenhancedflexibility.ThisflexibilityisEasternEuropeannations.paramounttoensurethatpowersupplycanreliablymeetdemandamidsttheinherentlyintermittentLookingaheadto2050,thepowerlandscapeisnatureofrenewablesourceslikesolarandwind.anticipatedtobediversebutnearlycompletelyStoragesolutionsarepivotalinthisregard;theydecarbonized.Windpowerwillemergeastheactasabuffer,capturingexcessenergyduringleadingrenewablesource,contributingalmosthalfperiodsofhighgenerationandreleasingitduring(43%)ofthetotalelectricitygeneration,followedlulls.Interconnectionsbetweennationsplayacloselybysolarpower.criticalrole,allowingregionstobalancesurplusesanddeficits,effectivelyturningneighboursintoTosupportthisburgeoningelectricitydemand,Europebackupproviders.Meanwhile,conventionalgener-mustbolsteritsinterconnectedpowernetworks.Thisationsources,althoughgraduallydiminishinginwillnecessitateconsistentinvestmentsinexpanding,prominence,stillofferinvaluablestabilizingeffects,reinforcing,andoptimizingpowergrids.DespitesupplyingpowerduringextendedperiodsoflowEurope'sextensiveinterconnectednetworks,bottle-renewableoutput.147CONTENTSDEMANDELECTRICITYRENEWABLESFOSSILFUELSFINANCEPOLICYEMISSIONSREGIONSAPPENDIXDNVEnergyTransitionOutlook2023EuropestandstoreapenormousbenefitsfromAnotherinterestingtrendistheriseofstorageInterconnectionshaveemergedasanotheressentialcaterto4%ofthecontinent'sfinalenergydemandpoliciesthatadvancedemand-sideflexibilitytechnologies,includinglong-durationstorage,aspectinenhancingflexibility,particularlyinmoreby2035andasubstantial12%by2050,hydrogen's(DSF)–i.e.theabilityofcustomerstochangetheirLi-ionbatterystorage,andpumpedhydrostorage.recentyears.Ascountriesdiversifytheirenergyroleisindisputable.consumptionandgenerationpatternsbasedonThegrowingimportanceofthesetechnologiesportfoliosanddevelopcomplementarystrengthsThemanufacturingsector,oftenperceivedasaexternalsignals.Ina2022studyconductedwithindicatesashifttowardsamoreadaptableandandneeds,cross-borderenergytradecouldofferbastionoftraditionalenergyconsumption,ispoisedSmartEnergyEurope,DNVincludedascenariowithresilientpowersystemthatcanbetteraccommodateanotherlayerofsystemrobustnessandflexibility.towitnessaprofoundtransformation.By2050,itisthefullactivationofflexibilityfrombuildings,EV,andtheintermittentnatureofrenewableenergyThiswillbeincreasinglyimportantasEuropeseeksanticipatedthatamonumental17.9Mtofhydrogenindustryin2030.Theresultsindicatedconsumerssources.Vehicle-to-gridhasalsoshownpromise,tobalancethevariableoutputfromrenewablewilladdress20%ofEurope'smanufacturingenergywoulddirectlysaveEUR71bnannually,withfurtheralbeitfromaverylowbase,andgiventheprojectedsourcesacrossacontinentwithdiversegeographicrequirements,significantlyoutstrippingtheglobaltensofbillionsofbenefitsinavoidedpeakgener-surgeinEVadoption,thiscouldbecomeakeyandclimaticconditions.averageof6%.Thisisnotmerelyashiftinenergyationcapacity,lesscurtailmentofrenewables,lowerflexibilityproviderby2050.Power-to-hydrogenalsosources,itisacompleteoverhaulofmethodologies.requirementsfordistributiongridinvestments,and—offersafascinatingavenueforflexibility,potentiallyHydrogen,afuturemajorenergycarrierNotably,theironandsteelindustries,whichhavemostimportantly–37.5milliontonnessavedannuallyservingasamulti-sectoralenergyvectorthatcouldAsEuropestridestowardsasustainablefuture,beenhistoricallydependentoncoal,willundergoinGHGemissions.integratetheelectricity,heating,andtransporthydrogenisemergingasthelinchpininitsgreenradicalchange.Theapplicationofcoalinthesesectors.energymatrix.WithprojectionssuggestingitwillFigure8.3.6showsawaytoquantifyflexibility.By148measuringthechangeinstandarddeviationwithandwithoutaparticulartechnologyinthesystem,wemeasurehowmuchthevariabilityisreducedbyinclusionofthattechnologyinthepowersystem.Oneprominentobservationistherisingimpor-tanceofrenewableandsustainableoptions,suchasbiomass,geothermal,andsolar+storag,whichshowanincreaseinstandarddeviationimpactovertheyears.Aswemovetowardsacleanerenergyfuture,thesetechnologieswilllikelyplayanincreasinglyimportantroleinreducingvariabilityandenhancingsystemflexibility.Atthesametime,fossil-fueloptionslikecoal-firedandgas-firedtechnologies,stillholdsubstantialweightinprovidingsystemflexibility.However,giventheglobalpushtowardsdecarbon-ization,thesearemorelikelytobephasedoutorcomplementedbycarboncapturetechnologiesinthecomingyears.CONTENTSDEMANDELECTRICITYRENEWABLESFOSSILFUELSFINANCEPOLICYEMISSIONSREGIONSAPPENDIXDNVEnergyTransitionOutlook2023industrieswilldwindle,largelysupplantedbyinno-2030s,wecanexpecthouseholdstoincreasinglytapTheelectricitygenerationlandscapewillalsobethepowersectorandinotherapplicationsacrossvativehydrogen-basedtechniques,suchasdirectintopurehydrogenfortheirheatingneeds,althoughreshapedbyhydrogen'sascendance.Despitethedepictedregion.By2050,hydrogen'sroleinthereducediron(DRI).PioneerslikeHybrithavealreadytraditionalsourceswillretaintheirprimacyintheinherentinefficienciesinitstransformationbacktopowersectorbecomesmorepronounced.Duringtakentheleapwithpilotproductions,withothersbroaderenergymosaic.electricity,thepromiseofhydrogenasalong-termsun-richsummermonths,electrolysersfedbygridlikeArcelorplottingambitiouscourses.Come2050,storagesolution—especiallyduringextendedelectricityoperateatpeakcapacity.However,whenhydrogenisprojectedtofulfilhalfofEurope'ssteelEurope'stransportationnarrativewillalsoberewrittenperiodsofrenewableexcessordeficit—cannotbesolarandwindoutputswaneduringcertaintimesofindustryenergydemand,echoingabroaderbyhydrogen.Asweventuredeeperintothe2030s,overlooked.Itisprojectedthatby2035,asignificanttheyear,thereisadipinthecapacityutilizationofcontinentalcommitmenttosustainableproduction.long-distancetruckstraversingthecontinent'shighways7.3Mt/yrofhydrogenwillbeharnessedtogenerateelectrolysers.Consequently,powerstationsincreasewillbepoweredincreasinglybyhydrogen,withelectricity,translatingto3.3%ofEurope'spowertheirrelianceonhydrogenasafuelsource.Yet,thehydrogenrevolutionisnotconfinedtoconsumptionestimatestouching4.6Mt/yrby2050.supply.Withtheeventualretirementofmanytraditionalindustrialjuggernauts.HomesacrossEuropewillSimilarly,themaritimeandaviationsectorswillnotgas-firedstations,hydrogenwillpersistasaresilientYet,itisworthnotingthatthepowersectorisnotsoonbebeneficiariesofthisversatileenergysource.beleftuntouched.Derivativesofhydrogen,includingandgreenpowermainstay.thesoleconsumerofhydrogen.ItsdemandinspaceThecontinent'ssprawlinggasnetworkisripeforaammoniaandothere-fuels,aresettobecometheheatingisparticularlyseasonal,accountingforhydrogen-centricretrofit,usheringinaneraofpreferredchoice,contributinganadditional12Mt/yrofInFigure8.3.8,wedelvedeepintotheproduction20%oftheannualhydrogenconsumptionin2050.sustainabledomesticenergy.Bythedawnofthehydrogenconsumptionbythehalf-centurymark.andconsumptionpatternsofhydrogen,bothwithinHydrogen'suseinsectorslikeaviationalsoexhibitsseasonalfluctuations.Tomaintainasteadyhydrogensupply,storagesolutionsbecomecrucial.PredictionsbasedonFigure8.3.8indicatethatby2050,atleast6.4Mtofhydrogenstoragewillbeneededtobalancethetemporalmisalignmentbetweensupplyanddemand.Thiscorrespondstoabout10weeks'worthofsupply.Giventheimportanceofmaintainingabuffer,thefinalstoragecapacityisexpectedtoexceedthisestimate.Europeannations,recognizingthestrategicandenvi-ronmentalsignificanceofhydrogen,arerallyingtoitscause.Individualcountriesaresettingambitioustargets,eachcontributingtoaunifiedcontinentalvision.Denmark,France,Italy,Germany,andSpainareleadingthechargewithboldproductiongoals,buoyedbysubstantialcapitalinvestments.Still,challengesloomlarge,withEuropepotentiallyfallingshortofitsREPowerEUplan'sobjectives.149CONTENTSDEMANDELECTRICITYRENEWABLESFOSSILFUELSFINANCEPOLICYEMISSIONSREGIONSAPPENDIXDNVEnergyTransitionOutlook2023Supplementinginternalproduction,EuropewillleanWhilesomemayarguefortheearlyadoptionofand68%,respectively,by2030whencomparedto150onexternalimports,anticipating4Mt/yrby2050.technologieslikesteammethane-reforming(SMR),1990levels.KeepinginmindthatourpredictionsKeyregionsliketheMiddleEastandNorthAfricawilltheirlong-termeconomicviabilityinEuroperemainsexcludecountry-specificandnon-energy-relatedplaycrucialroles,withpipelinesferryingin1.2Mt/questionable.emissions,andthatEurope'sdomainextendsyroftheprojectedimports.TheremainderwillbebeyondtheEU,ourforecastsuggestsa50%sourcedglobally,primarilyintheformofammoniaEmissionsreductioninEurope'senergy-relatedCO2emissionstransportedbyships.Figure8.3.9illustratesthatthesectorsoftransportby2030fromthe1990benchmark.ThisisanandmanufacturingareattheforefrontofreducingimprovementontheEU'soriginalParisAgreementTheunderpinningsofthisburgeoninghydrogenemissions.Inthemanufacturingsector,adeclineincommitmentof40%,yetitdoesnotreachthe55%economyarerenewables.Windisexpectedtocoalandgasusageplaysasignificantrole,withgreenmark.By2050,Europe'senergy-relatedCO2emissionscontributearound60%ofdedicatedproduction,electricity,moreaffordablethanever,fillingthegap.willhavedeclinedby83%from2022levels,resultingwithsolarchippinginwith40%.AsweapproachtheWhileemissionsfromcoalusagewillsharplydrop,inannualemissionsof0.51GtCO2,signifyingthat2040s,thefocuswillshifttowardsgrid-connectedalmostnearingextinctionasitsconsumptionEuropemightnotfullyachievetheprevalentnet-zeroelectrolysis,drivenbytheavailabilityofcopious,diminishes,thosefromoilwilltakelongertosubside.pledgesamongitsnations.affordableelectricityfromrenewablesources.Inthenextthreedecades,oil-basedemissionswillpersistentlymakeupapproximatelyhalfofCO2By2050,afterthesuccessfulcaptureandstorageemissions.However,by2050,theywillhavedecreasedof210MtCO2byCCSand110MtCO2byDAC,thetoaroundaquarteroftheircurrentlevels,primarilyoverallannualemissionsin2050willstandat530duetoreducedoilconsumption.MtCO2.ThismeansCCS,whilehavinglimitedtractioninEurope,willmanagetocapture25%oftheWeforeseearegionalaveragecarbonpriceofUSDcontinent'senergy-relatedemissionsbythatyear,the150/tCO2by2030,increasingtoUSD250/tCO2byhighestpercentageacrossallregions.Nonetheless,2050.Europe,havingalreadyintroducednationalandevenwithacarbonpricetagofUSD250/tCO2,CCSregionalcarbonpricingsystems,showcasesevidentwillencounterlimitationsinitssupplychainandpriceincrements.TheEUETSservesasapivotalcapacity,preventingitfromfullyneutralizingcarbonfinancingmechanismfortransitioningtogreeneremissions.Thisunderscoresthechallengesofalternatives.Although90%ofindustrialemissionstransportingandpermanentlystoringcarbon.currentlyenjoyexemptionsfromcarbonpricing,weanticipatethisprivilegebeingphasedoutby2034.Europe'semissionswilldeclineby83%fromConsequently,allindustrialemissionsacrossEurope2022to2050.willcomeunderthecarbonpricingumbrella.WhenconsideringtheEUandtheUK'scommitmentsinNDCs,theyaimforCO2emissionreductionsof55%CONTENTSDEMANDELECTRICITYRENEWABLESFOSSILFUELSFINANCEPOLICYEMISSIONSREGIONSAPPENDIXDNVEnergyTransitionOutlook20238.4SUB-SAHARANAFRICA(SSA)PopulationGDP(USDTrillion)Energyuse(EJ)Energy-relatedCO2emissions(GT)(Billion)GDP/person(USD)Energyuse/person(GJ)Energy-relatedCO2emissions/ThisregionconsistsofallAfricancountriesexceptperson(Tonnes)Morocco,Algeria,Tunisia,LibyaandEgypt,whichareincludedintheMiddleEastandNorthAfricaregion5.5281.120221.24600240.920502.120.2471.59400220.7AllGDPfiguresinthereportarebasedon2017purchasingpowerparityandin2022internationalUSD151CONTENTSDEMANDELECTRICITYRENEWABLESFOSSILFUELSFINANCEPOLICYEMISSIONSREGIONSAPPENDIXDNVEnergyTransitionOutlook20238.4SUB-SAHARANAFRICA(SSA)Characteristicsandcurrentpositionstructioncostsislimitedandhampersmuch-neededPointerstothefuture—Higherrenewableelectricitypenetrationistech-newinfrastructurebuild-out.nicallyandeconomicallyfeasibleandwillbetheTheregionsuffersfromlargeenergygeneration—Withunderdevelopedlegacyfossil-fuelbasedfastest-to-marketsolutioninmeetingenergyneeds.andaccessgaps.NearlyhalfofthepopulationlacksAconfluenceofchallengesaffecttheregion:theinfrastructureinmanyregioncountries,andtheButjust-transitionfinanceinitiatives,suchastheJustaccesstoelectricity(UNCTAD,2023).In2022,risingpost-pandemiceconomicenvironmentaggravatedcombinationoftechnologyprogressandrenewableEnergyTransitionPartnership(JTEPUSD8.5bn)toenergypricesfurtherslowedprogresstowardscleanbygeopoliticaltension,climate-relatedinvestmentsresourcepotential,theregionstandsonthecuspaccelerateSouthAfrica’sdecarbonization,willbeandaffordableenergyaccess(REN21,2023a).Unre-remaininginsufficient,andtighterglobalfinancingofadevelopmentpaththatleapfrogstocleaner,keytotransitionfossil-fuelreliantcountries.liablepowerisamajordragoneconomicactivity,andconditionsandratehikesbycentralbanksinresponseflexible,andmoreefficientenergysystems.resultsincostlyandoftenpollutingbackupsolutions.tosurginginflation.Manyverticallyintegratedpower—Concessionalfinanceandlossguarantees,fromutilitiesarestate-ownedwhichlimitscompetition—Furthernaturalgasinvestmentsinreserverichmultilateralfinanceinstitutions,areexpectedtoFossilfuelsdominateelectricitygeneration(66%).andprivatesectorinvolvement.HighindebtednessNigeria,Mozambique,theRepublicofCongo,helprenewableenergyprojectsandinfrastructureSolarPVaccountsforameagre2%despiteabundantofgovernmentsnegativelyimpactsthecapacitytoMauritania,andAngola.willbespurredbybuild-outgetoffthegroundandcrowdinprivaterenewableresourcepotential—oftenadjacenttofinanceenergyinvestments.Corruptiongenerallydomesticconsumptionandexportstohigh-sectorinvestors.severelyunderservedcommunities.Lessthan1.5%offavoursfossilenergysources(Sayne,2020;Burkhardt,demandmarkets,suchasEuropereplacingRussianrenewableenergyfinancinginvestedinternationally2023).supplies.ButEuropedecarbonizingtowards2050—Theavailabilityofabundantrenewableenergybetween2000and2020wenttoSub-SaharanAfricawillseeoilandgasimportsdeclining.Economicresourcesandlargequantitiesofmineralresources(IRENA,2023b).Theregion’senergytransitionprioritiesareenergydiversificationthroughreinvestmentofhydrocarbonprovideanopportunityforindustrialexpansion,andinfrastructureexpansion.TheAfricanUnionrevenueinrenewableenergywillbeaprecon-intermsofenergyprovisionandestablishmentThefrequencyofextremeweathereventsisCommissionconceivesofajustenergytransitionthatditionforseizingcleantransitionopportunitiesandoflocalenergytechnologyvaluechainsteps,andincreasing:e.g.tropicalcycloneFreddy(March2023)includesuniversalaccesstomodernenergy,industri-avoidinglock-intohighemissionsandpotentialforbreakingthetradepatternoflowvalue-addedhittingMozambiqueandneighbouringcountries,alization,jobcreation,anddeployingcleantechnostrandedassets.commodityexports.devastatingfloodsinNigeria(2022),HornofAfricalogiestodecarbonizeenergysystemsandputAfricadrought(2020-2023).Capacitytoshoulderrecon-ontrackforclimate-friendlydevelopment(AfricanUnion,2022).152CONTENTSDEMANDELECTRICITYRENEWABLESFOSSILFUELSFINANCEPOLICYEMISSIONSREGIONSAPPENDIXDNVEnergyTransitionOutlook2023Energytransition:agreentransitionforbetweenthosetwocountriesintermsofenergychange,althoughithashistoricallybeenresponsibleBy2050,Sub-SaharanAfricawillbehomeagrowingpoulationdemand,population,andGDPpercapita.foraverysmallamountofglobalemissions.Thecallto21%oftheglobalpopulationbutwillforglobalactioninhelpingtoaddressthispressingaccountforjust8%ofglobalenergySub-SaharanAfricaisoneoftheregionsthatwillAcrosstheregion,thepopulationwillalmostdoubleissuewasrepeatedattheAfricaClimateSummithelddemand.undergothemostimpressivetransformationinourwhiletheregion’seconomyquadruplesovertheinSeptember,whereanewfinancingarchitectureforforecastperiod.ItiscurrentlytheETOregionwithforecastperiod.By2050,21%oftheglobalpopu-developmentandenergytransitionwasproposed.theregion’slargesteconomy,earningsfromthesmallestenergydemand,accountingfor5%oflationwillbeinSub-SaharanAfricaandtheregion’spetroleumproductionmakeup50%ofgovernmentglobalenergydemand,whilerepresenting15%ofenergydemandgrowthisprojectedtoincreaseThereisrisinginterestinthesubcontinent’srichrevenue.Atthesametime,thereisahightheworldpopulation.by90%fromtoday’slevel,whilestillrepresentingendowmentofnaturalresources.Primarygoodsdependencetowardsimportedrefinedproductsonly8%ofglobalenergydemandbymid-century.(agriculturalproducts,minerals,metals,fossilfuels),(66billionUSDin2021),whichalmostoffsetsTheshapeofthetransitionwillbedecidedinaBy2050,weforecastthattwothirdsoftheenergycurrentlydominatetheregion'sexports.Chinarevenuesfrompetroleumexports(44billionUSD-handfulofcountries,asmostoftheenergydemanddemandfromtheregion’sfast-growingeconomieshasexpandedeconomicrelationstobecometheWorldBank,2022).iscurrentlyheavilyconcentratedlocally,withNigeriawillbemetbynon-fossilsources.Traditionalbiomassregion’slargesttradepartner,accountingfor20%ofandSouthAfricaaccountingforaboutahalfofthewillstillrepresentaboutahalfofthedemand,buttotaltradevalue(IMF,2019).TheenergytransitionTheopeningoftheverylargeDangoterefineryindemand(seeFigure8.4.1).Butthedynamicsdiffersolarandwindwilltogethergrowtoa13%share.willcontinuetoattractinteresttotheregion,withrecentmonthsisasteptowardsalleviatingNigeria’sforinstanceD.R.Congorepresentingmorethanfuelcrisis.ThecountryhashadalmostzerorefiningInternationalinteresttwothirdsofglobalproductionofcobalt,currentlycapacityforanumberofyearsduetotheft,vandalismTheregionisreceivingincreasedglobalattention,andusedinbatteries.InDecember2022,theUnitedandstructuralneglectofexistingrefineries.Tothedevelopmentofthesubcontinent’senergysystemStatessignedaMoUwiththeDRCandZambiatomaintainaffordablepricesforthelocalpopulation,willbeatthecrossroadsofseveralglobalforces.strengthenthesupplychainforEVbatteries.thegovernmenthadheavilysubsidizedgasoline.Asthisbecameunbearableforthestatebudget,theTheUSandChinaaretusslingforinfluenceacrossFossilfueldependencegovernmentscrappedthe10billionUSD/yrsubsidythecontinent.TheBRICSsummitinAugust2023ClosetohalfofSub-SaharanAfrica’sexportvalueinMay2023,leadingtolargestreetprotestsaspetroldemonstratedpoliticalalignmentwithChinaandaiscomposedoffossilfuels,eventhoughthesubpriceshavesoared.SimilarprotestsagainstfuelhikespushtoexpandtheBRICSmembershiptocountercontinenthasarelativelysmallroleinglobalfossilhavebeenobservedinAngolaandKenyain2023,Westerninfluence.However,givenitsowneconomicfuelproduction,withrespectivesharesof4%forshowingthevulnerabilityofthisfossil-fuelsubsidieswoes,China’scapacitytoinvestinAfricaappearscoal,5%forcrudeoiland2%fornaturalgas.Thereismodel.constrainedinthemediumterm.AfricaisreceivingalongstandingpresenceofinternationaloilandgasheighteneddiplomaticattentionfromtheUS,ascompanieswithSub-SaharanAfricacountriesrelyingOnaverage,oilandgasassetsinAfricaare15%todemonstratedbytheDecember2022US-Africaontheseplayersinthedevelopmentofhydrocarbon20%moreexpensiveandexhibit70%to80%higherLeaderssummitinWashington,DC(Jalata,2023).resources.Thelivedexperienceoftheregion’soil-producingcountriestellsastorywhereoilwealth153Intermsofclimatejustice,theregionwillprobablyhasnotbeensuccessfullyconvertedintodiversifiedexperiencethemostsevereeffectsfromclimateeconomies;inbothAngolaandNigeria,CONTENTSDEMANDELECTRICITYRENEWABLESFOSSILFUELSFINANCEPOLICYEMISSIONSREGIONSAPPENDIXDNVEnergyTransitionOutlook2023carbonintensitycomparedtoglobalcounterpartsOurforecastunderlinesthefurtherneedformix(86%ofallAfrica’scoal-firedgenerationcapacityandotherrenewableswillhave33%oftheon-grid(McKinsey,2022).Asaresult,weforecasttheregiondiversificationofrevenuestreams,aspetroleumisfoundinSouthAfrica).powermix,withsolarPV(withandwithoutstorage)tobecomelessattractiveforinvestors.Theresultingexportrevenueswilldeclinewhilethepopulationcombinedaccountingfor38%andwindpower32%.trendsareshowninFigure8.4.2:continuestogrow.ElectricityuptakeisrestrictedbyaslowincreaseindemandsectorssuchastransportandacrossUtility-scalegrid-connectednon-hydrorenewables—CrudeoilproductionwillcontinuetodeclinetoTheopportunityforleapfroggingthesubcontinentlastyearelectricityrepresented(likesolarPVandwind)willespeciallyscalefromaroundaquarteroftoday’slevelby2050.AttheElectrificationiskeytotheenergytransition,butonly6%offinalenergydemand,avaluethreetimesthelate2030sonwards,butpriortotheutility-scalesametime,consumptionwillincrease,andtheelectricitystillplaysaminorroleinSub-Saharanbelowtheglobalaverage.Thereare,however,expansion,therewillbesignificantoff-gridcapacityregionwillevenbecomeanetimporterofoilAfrica.Forinstance,France(144GW),hadmoretargetsfocusingonrenewablesexpansioninadditions,aswedetailedinthe2022Outlook(DNV,productsinthemid-2040s.installedelectricitycapacitythantheentirepowergeneration,e.g.Kenyafor100GWcapacity2022b).Sub-Saharanregion(143GW)in2022.by2040,andothersforrenewablepowershares—Naturalgasproductionwillontheotherhandaround30%to40%by2030,Tanzaniafor50%bySupportedbythisuniquedecarbonizedpowermix,increasebymorethan50%,butexportswillSouthAfricaaloneishometo58GWgeneration2030.Renewableenergyauctionshavebeenimple-Sub-Saharaneconomieswillhavetheopportunityonlyriseby20%,asregionalconsumptionalsocapacityfromallsources,withcoal-firedcapacitymentedinUganda,SouthAfricaandZambia;Ghana,toclosetheelectricityaccessgapwithoutgoingincreases.holdingbyfarthelargestshareinthenationalpowerTanzaniaandKenyaareadoptingsimilarpractice,throughthehigh-carbonphasethatindustrializedthatwillboosttheinstallationofnewcapacity.regionshaveexperienced,asshowninFigure8.4.4.Inotherwords,theregioncanandwillleapfrogAdramaticshiftispredictedfortheregion’spowerstraightontoagreenerpathwaywithlow-carbonsystems.Driversofsuchashiftwillprimarilycomeenergytechnologies.Thekeychallenge,however,fromglobalflowsofcapitalseekingdecarbonization,remainssufficientgenerationandtransmissionbothfrompublic(multilateraldevelopmentcapacitytomakeasubstantialdifferencetotheagenciesanddonorgovernmentinvestments)andsubcontinent’sdevelopmenttrajectory.privateinvestors.Thechangingon-gridelectricitymixissummarizedinFigure8.4.3.ThegridchallengeWhatmatterstoAfricaisnotsomuchtheSouthAfricawillbedecommissioningcoal-firedpercentageuptakeofrenewableinthepowermixplantsandbothcoalandoil-firedgenerationareasthescaleofelectricitygenerationandavailability.settodeclineacrosstheentireregion.Today,66%Sub-SaharanAfrica’sgrid-connectedelectricityofon-gridgenerationisfossil-fired,hydropowerdemandpercapitaisonlyatonethirdoftheIndianaccountsfor25%,andotherrenewableshaveminorSubcontinentlevelandwellbelowglobalaverage.shares.Overtheforecastperiod,thispicturewillflip.AboutahalfofthepopulationpresentlylacksBy2050,fossil-fuelledpowerwillonlymakeup9%accesstoelectricity.Infact,alargershareoftheofon-gridgeneration,inwhichcoal-firedplantswillpopulationcurrentlyhasaccesstooff-griddieselaccountfor5%.Hydropowerwillaccountfor18%generatorsthantotraditionalgrids(DNV,2022b).154CONTENTSDEMANDELECTRICITYRENEWABLESFOSSILFUELSFINANCEPOLICYEMISSIONSREGIONSAPPENDIXDNVEnergyTransitionOutlook2023ThereisinsufficientinterconnectionbetweentheOurforecast(Figure8.4.5)showsthatgridexpendituresgridsandoff-gridsystems,mostlysolarbased,willbedifferentcountriesintheregion,hinderingthewillgrowfour-foldto2050,withinvestments(CAPEX)themostviablesolutions.Thesesolutionsareeasierdevelopmentofnewutility-scalepowerplantsandgrowingfromUSD5bnin2022tomorethanUSDtoputinplace,astheyhavelowercost,requirelesstappingintothevastpotentialofvariablerenew-30bnin2050.Thiswillespeciallysupportthetriplingcentralplanning,andcanbeadaptedtolocalneeds.ables(windandsolarPV).Thesesourcesaremoreoftransmission(greaterthan37kV)powerlinelengthTheyareconsideredasessentialcomplementarytoolsvulnerabletopoorlydevelopedgridsthanfossil-firedacrosstheregion.Theregionwillhoweverbyfarretaintoclosetheenergyaccessgapasquicklyaspossiblepowerplants,astheirintegrationrequiresafinelythelowestgridlengthpercapitaglobally,with330km(WorldBank,2023d).However,wecautionthatbalancedandhighlyinterconnectedgrid.per100,000inhabitantsby2050.Thetwootherlowestoff-gridrenewableenergy-basedprojectsregularlyGDPpercapitaregions,IndianSubcontinentandLatinfailtotransitionfrompilot,donor-sponsoredprojects,Asdemonstratedinotherregionsoftheworld,Americawillreach1500kmand2200km,respectively.andrequirerobustfinancing,localskillsdevelopmentbuildinguptransmissionlinescanbedonequickly.andtargetedpolicies(Nyarkoetal.,2023).AlthoughForinstance,theworld’slongesttransmissionlineDespiteallthesedevelopments,westillforecastgrid-non-transmissionstrategies,includingoff-gridaccess–theHVDCBelMontelineinBrazil,completedinaccesstostaylow,withlessthan20%ofthepopulationandmini-grids,willbringbasicelectricityaccessto2019–tookjust18monthstobuild.Thechallengeinconnectedby2050(DNV,2022b).FortherestofthehundredsofmillionsofpeopleinAfricaandIndia,Sub-SaharanAfricaisnotreallyapermittingproblempopulation,especiallyinremoteruralareas,mini-industrialdevelopmentrequiresrobustgridbuild-out.thatisleadingtoabottleneckingridbuild-outForSub-SaharanAfrica,thegridremainskeyininhigher-incomeregionswithestablishedpowerunlockingthesubcontinent’seconomicpotential.systems.Sub-SaharanAfrica’slowgriddevelopmentisratheracombinationofalackoffinance,techno-By2050,fewerthan1in5peopleinlogicalknow-howandsuitablebusinessmodels.Sub-SaharanAfricawillhaveaccesstogrid-connectedelectricity.Thishasbeenclearlyacknowledged,andinternationalsupportisbuilding.Oneofthelatestexamplesbeing155theagreementbetweenIRENAandAUDA-NEPADtosupportamore“interconnected,flexibleandreliablepowergrid”(IRENA,2023c).ChinaisalsoactivethroughitsBeltandRoadInitiative,withseveralpower-linesalreadyfinancedalongsidenumerousrenewablepowerplants.RegionalinitiativesliketheAfricanSingleElectricityMarketinitiatedbytheAfricanUnionin2021arealsoimportanttobuildtheessentialcooperationforrenewablepowerexpansion.Inaddition,strategiesandtechnologiestocombatcabletheft,aparticularprobleminSouthAfrica,areurgentlyneeded.CONTENTSDEMANDELECTRICITYRENEWABLESFOSSILFUELSFINANCEPOLICYEMISSIONSREGIONSAPPENDIXDNVEnergyTransitionOutlook2023Sectoraldemandandfuelmixamoreprosperouspopulation,andimprovedin2040,andthoughthesalessharedeclinesto26%inFuelmixThebreakdownofenergydemandbysectorandtheirstandardsofliving/comfort(e.g.airconditioning).2050,thefleetisstill68%oildependentthen.EnergyOverall,ourforecastforenergydemand(FigurecorrespondingfuelmixisgiveninFigure8.4.6.Greaterenergyefficiencywillpartiallycounteractthisdemandfortransportpurposeswillmorethantriple.8.4.7)inSub-SaharanAfricaindicatessomepositiveasthetechnologiesmeetingtheexpandingenergySpecifically,oiluseinroadtransportwilldouble,andtrends:asteadyuseofbiomasshidesitsdecliningBuildingsneedswillchangesothatenergyuseofbuildingsoilwillstillrepresent87%shareofthesubsector’sshareintheenergymix(reducingfrom66%to40%),Withagrowingpopulation,buildingswillremaintheincreasesbyonly37%.Energyfrommostlyinefficientenergymix,withelectricityaccountingforjust12%.andamorethan300%riseinelectricityuseto2050biggestsourceoffinalenergydemand.Theypres-traditionalbiomass,supplying92%ofenergyforasitsshareincreasesfrom7%to15%.However,useentlyconstitute68%ofdemand,andweforeseethisuseinbuildingstoday,willdeclinetoaround70%byWhiletherearesomeinitiativesinelectricmobility,ofcoalandespeciallyoilexpands,bothretainingdecliningtoaccountfor49%in2050.Muchofthemid-century.Electricpower(on-gridelectricityandthereisalackofsupportingpolicies,andtheregion’smuchhighersharesthannaturalgas,withoil’sbuildingsstockexistingbytheendoftheforecastoff-gridsolarPV)willexpandtoaccountfor17%oftheelectricitydeficitalsohinderselectrificationofroadpersistencereflectingalackofgasinfrastructure.periodhasyettobebuilt,andweprojectthefloorenergyforbuildings.Anexpansioninoff-gridsolarPVtransport.Thereisalsouncertaintyabouttheroleofareaofresidentialandcommercialbuildingstomoresolutionswillfuelgrowthintheuseofappliancesandsecond-handEVscomingfromhigher-incomeregionsEmissionsthandoubleandtriple,respectively.lighting,accountingfor24%ofthissegment'sdemandinelectricuptake.Unlikepetrolcars,usedEVsmightOurprojectionfortheregionalaveragecarbon-in2030and45%bymid-century.notbeimportedinSub-SaharanAfrica,asregionswillpricelevelisUSD2/tCO2in2030andUSD20/tCO2Energydemandinthesectorwillbedrivenbyakeepaccesstovaluablebatterycomponents.by2050(seeSection6.3).Weexpectslowadoptioncombinationofmoreresidential/commercialspace,ManufacturingandlimitedexplicitcarbonpricinginstrumentsinThelevelofactivityintheregion’smanufacturingsectortheregionduetothepredominantdevelopmentispresentlysmall,withlowlevelsofindustrialization,focus.Futureschemeswillbemotivatedbyaccessanddominatedbyextractiveindustriesandexportoftoclimatefinanceandtoavoidcarbon-borderrawmaterialswithlittlefurthervalueadded.Theregionadjustmentmechanisms.isthemostcommodity-dependentregionintheworld(UNCTAD,2023)andin2019,Africa’smanufacturingInthecontextofglobalclimatepolicy,Sub-Sa-valueadded(MVA)percapitaofaboutUSD207washaranAfricancountrypledgesinNDCssuggesttheabout12%oftheglobalaverage(IRENA,2022).Manu-regionaltargetisforemissionstogrownomorefacturingwillgrowstrongly,anditsenergydemandthan68%by2030relativeto1990.Theseareuncon-willdouble,anditsshareinfinalenergydemandwillditionaltargets,andsomecountriesexpectfurtherdoublefromitspresent12%toreach24%by2050.reductionsprovidedthereisinternationalsupport.OurOutlookindicatesenergy-relatedCO2emissionsTransportrise114%overthatperiod,suggestingthattheambi-Transportenergydemandpresentlyis99%relianttionsarenotmet.Lookingaheadto2050,veryfewonoil.Inroadtransport,thenumberofvehicleswillSub-SaharanAfricancountrieshaveadoptedtargetsincreasealmostthree-foldovertheforecastperiod.toreduceCO2emissions.OurOutlookestimatesInternalcombustionenginepassengervehicles(ICEVs)energy-relatedemissionsof1.3GtCO2peryearinstillaccountformorethan90%ofsalesofnewvehiclesmid-century,33%above2022levels.156CONTENTSDEMANDELECTRICITYRENEWABLESFOSSILFUELSFINANCEPOLICYEMISSIONSREGIONSAPPENDIXDNVEnergyTransitionOutlook20238.5MIDDLEEASTANDPopulationGDP(USDTrillion)Energyuse(EJ)Energy-relatedCO2emissions(GT)NORTHAFRICA(MEA)(Million)GDP/person(USD)Energyuse/person(GJ)Energy-relatedCO2emissions/person(Tonnes)ThisregionstretchesfromMoroccotoIran,includingTurkeyandtheArabianPeninsula12.9542.9202253623000965.1205077028.9722.637000933.3AllGDPfiguresinthereportarebasedon2017purchasingpowerparityandin2022internationalUSD157CONTENTSDEMANDELECTRICITYRENEWABLESFOSSILFUELSFINANCEPOLICYEMISSIONSREGIONSAPPENDIXDNVEnergyTransitionOutlook20238.5MIDDLEEASTANDNORTHAFRICA(MEA)Characteristicsandcurrentpositionpositionbydevelopinglow-carbonsolutions,suchPointerstothefutureHydrogenprojectwithSiemens.InOman,Hydromashydrogenandcarboncapture,utilization,andrecentlyawardedUSD20bntothreeprojects,Theregionisacornerstoneoftheglobalenergystorage(CCUS),toguaranteefuturerevenues.The—Renewableelectricityisprimedforrapidexpansioncoveringrenewablegeneration,production,system,accountingformorethanhalf(57%)oftheGulfCooperationCouncil(GCC)countrieshavedrivenbycompetitivetenderingandcountriesderivativesconversion,andofftake(Hydrom,world’soilreservesandtwo-fifths(41%)ofitsgasjoinedseveralinternationalinitiatives,suchasthetargetingincreasingsharesofrenewablesinpower2023).KSAhasinitialagreementstodevelopareserves(Keltie,2022).In2022,itproducedmoreCarbonSequestrationLeadershipForum,theOilandgeneration.Tunisiaisaimingfor30%,Israel40%,USD5bngreenammoniaproductionfacilityasthanathird(36%)oftheworld'soilandnearlyaGasClimateInitiative,theNetZeroProducersForum,Morocco52%,andKSA50%by2030,whileEgyptispartoftheUSD500bnNEOMGreenHydrogenquarter(24%)ofitsgas.andtheGlobalMethanePledge.aimingfor40%by2035.TheUAEtargets14.2GWCompanydevelopment.renewablecapacityby2030(fromcurrent3.7GW).RecenthighoilpriceshavebroughtstrongeconomicState-ownedcompaniesandsovereignwealthfunds—Inroadtransport,policyisdeveloping.AGulfgrowthandrecordcompanyprofitstoGulfstates,aretransitioninvestmentvehicles.Forexample,—RenewableelectricitywillmeetsoaringdomesticCooperationCouncil(GCC)states’chargingbutalsoaspirallingliquiditycrisisamongenergytheKingdomofSaudiArabia(KSA)ispouringUSDelectricityconsumption,freeupoilandgasforcorridorisproposed(ETN,2023).UAEpromotesimporterssuchasEgypt.270bnintoitspowersectorbetweennowand2030,exports,andfacilitateelectrificationinextractiveEVsfora50%shareoftotalpassengervehicleswithinvestmentsinCCSandisalsoinvestinginindustries.TheGreece-Egypt(GREGY)intercon-in2050.IsraelaimsforfullyelectricpublicAmplesolarirradiationandareaswithsuitablewinddomesticEVmanufacturing.TheUAErenewablenectionprospect,currentlyinanacceleratedtransportby2030andinternalcombustionengineresourcesmakeconditionsfavourableforrenewables-energycompanyMasdar’sglobalportfolioofcleandevelopmentphase,wouldenablecleanelectricityphase-out(passengervehicles)by2035.Moroccobasedelectricitygeneration.RenewablecapacityenergyprojectswasvaluedatUSD30bninearlysupplytoEurope(EuroNews,2022).ispioneeringheavyelectrictrucks(Smith,2023).reachedarecordhigh12.8%(3.2GW)increasein2023(Zawya,2023).However,fuel-pricesubsidieswilldelaythe2022withIran,Israel,UnitedArabEmirates(UAE),—Inlow-carbonhydrogen,UAEisaimingfor25%transition.andJordanleadingintheregion(IRENA,2023b).oftheglobalmarketby2030withelectrolysiscapacitytoproduce15Mt/yrby2050,andis—UAEishostingCOP28in2023.SeveralregionTheregion’shydrocarbon-producingcountriespilotingusedomesticallythroughtheDubaicountrieshavenet-zerocommitments,buttheseaimtomaintaintheirworld-leadingenergy-exportElectricity&WaterAuthority(DEWA)Greenambitionsaredwarfedbyfossil-fuelexpansionplans.158CONTENTSDEMANDELECTRICITYRENEWABLESFOSSILFUELSFINANCEPOLICYEMISSIONSREGIONSAPPENDIXDNVEnergyTransitionOutlook2023Energytransition:oilforexportcarriers(11EJto23EJ).EnergysupplyfromoilandElectricitycapacityandfloatingoffshoreexpectedtobearoundandrenewablesathomegasdecreasesby20%(20EJto16EJ)and16%(38EJFigure8.5.2visualizestrendsinon-gridelectricity4%bymid-century.to32EJ),respectively.By2050,with27%renewablesgenerationbypowerstationtypefortheregion.FinalenergydemandAsoneofthemostfossil-fuel-richregions,theintheprimaryenergysupplymix,thisoil-andgas-richInthispicture,thetransitionismoremarkedthanFigure8.5.3depictsthegrowthintotalenergyMiddleEastandNorthAfricahasnotbeenattheregionwillstillrelypredominantlyonfossilfuelstoforoverallprimaryenergy.Between2022and2050,demandbydemandsectorfrom1990to2050.Totalforefrontoftheenergytransitionsofar.Thingsareprovideitsenergy,eventhoughtoday’ssharesofoilannualelectricitygenerationgrowsthree-fold,energydemandrisesbyhalf(50%)overthenextthreestartingtochange,however,withglobalzero-carbon(35%),gas(58%),andcoal(4%)inprimaryenergyarefrom2,135TWhtodayto6,310TWhby2050.Whiledecades,from37.5EJin2022to56.2EJin2050.targetspushingtheregion’scountriestowardsexpectedtofallto22%,45%,and2%,respectively,almostabsentfromthemixtoday,solarandwindareThegrowthratefor2037to2050ishalfthatseendevelopingtheirowncarbon-neutralitytargetsandbymid-century.Theoverallregionalpicturecanbeexpectedtoprovide46%and31%,respectively,ofthein2022to2037,duetotrendsintransport.Annuallow-carbonfuelstrategies.Egypt,forexample,isdescribedasoilgivingwaytosolartoasignificantregion’selectricityby2050.28%ofthissolarelectricitydemandfromroadtransportisexpectedtopeakaimingtoprovidethelowest-emissionnaturalgasdegree,naturalgaspersistingasa‘transitionfuel’,generationisexpectedtobeinsolar+storagepoweraround13.6EJbetween2037and2041,thereafterandisemergingasanexporteroflow-carbonLNG,andwindbeingslowtotakeoff;largeareasinthestations,atechnologyexpectedtostarttakingoffingraduallydecliningto13EJin2050duetoEVuptakeelectricpower,andgreenammoniatoEuropeandregionwithabundantlowaltitudewindresourcesandthemid-2040sintheregion.Mostofthewindpowerinthe2040s.Inmid-century,theshareofelectricitybeyond.Moroccoisontracktoachieveitsrenewableadvancesinwindturbinedesigntocoperobustlywithwillbeonshoreinourforecast,withfixedoffshoreintheroadtransportenergymixisexpectedtobeenergytargetswitha52%shareofrenewablesinitshot,sandyconditionswillenablethis.windfarmsconstituting22%oftotalgeneratingelectricitymix,exemplifiedbygenerating1.77GW159fromhydropower,1.43GWfromwind,and0.83GWfromsolar,allin2022.IntheGulf,KSA,UAE,andOmanhaveissuedambitioushydrogenstrategies,andaresettoexploitabundantaccesstosolarandwindpowerandtousenaturalgasreservesforbluehydrogen(DubaiFutureFoundation2022).Figure8.5.1showsdevelopmentsinprimaryenergysupplyfortheMiddleEastandNorthAfricaregion.Primaryenergyisexpectedtogrowbyathird(33%)overthenextthreedecades,from54EJin2022to72EJin2050.Nearlyathird(31%)ofthisgrowthhappensbefore2040asannualoilincreases8%from18.5EJto20EJ,andgassupplyrisesnearly23%from31EJto38EJ.Energysupplygrowsbyonlyabout2%between2040and2050duetogreaterelectrificationofvarioussectorsandadoublingintheenergythatcomesfromnon-fossilenergyCONTENTSDEMANDELECTRICITYRENEWABLESFOSSILFUELSFINANCEPOLICYEMISSIONSREGIONSAPPENDIXDNVEnergyTransitionOutlook2023nearlyafifth(19%)astheMiddleEastandNorththewarmingclimate,leadingtoa30%increaseinthemixdiminishesfrom37%to24%.Inparallel,theThiseventualdivergenceisadirectresultofdevelop-Africaismovingforwardwithimplementingpoliciesthenumberofcoolingdegreedaysby2050.Otherdemandfornaturalgasrisesfrom16EJto22EJ,yetmentsinthelevelizedcostofhydrogenproduction,asandregulationsaroundEVcharginginfrastructure.driversforincreasedspacecoolingdemandareaitssharedeclinesfrom42%to39%.demonstratedinFigure8.5.7forselectedproductionWhiletheregion'scurrentEVadoptionmightappeardoublingofGDPpercapitaintheregionandamorepathways.Thankstolowpricesforlocallyextractedmodest,anewdawnisemerging.TheUAE’scapitalthandoublingofbuildingfloorareareflectingFromhydrocarbontohydrogennaturalgas,bluehydrogenremainsthemosteconom-AbuDhabirecentlypublisheditsregulatorypolicypopulationgrowthandarisingstandardofliving.Figure8.5.6showsthetake-offinannualhydrogenicallyviableroutethroughouttheforecastperiod.forEVcharginginfrastructuretowarditstargetofproductionintheMiddleEastandNorthAfricaHowever,withtherapidgrowthinsolarelectricitycarbon-neutralityby2050.InMay2023,EinrideAB,Keyquestionsarewhichenergycarriersaregoingstartinginthe2030s.Itwillgrow50-foldintwogeneration(showninFigure8.5.2)andtheassociatedaSwedishfreightmobilitycompany,andtheUAEtomeetthe56.2EJofannualenergydemandinthedecades,fromaround0.2Mtin2030tonearly9Mtreductionincoststhankstocost-learningcurves,MinistryofEnergyandInfrastructurepartneredtoregionby2050andhowwillthecarriermixdifferfromin2050.Theratesofgrowthforbluehydrogen(fromdedicatedsolarandgrid-connectedelectrolysisdeployafreightmobilitygridrangingover480today.Figure8.5.5depictsdevelopmentsinenergymethanereformingofnaturalgaswithCCS)andbecomecompetitiveproductionpathwaysafter2045.kilometresacrossAbuDhabi,Dubai,andSharjah,anddemandbycarrier.Notetheremarkableneartriplinggreenhydrogen(viaelectrolysisusinggrid-connectedRecentmarketandpolicydevelopmentsintheregioncomprising2,000electrictrucks,200autonomousinelectricitydemandfrom6.2EJto17.8EJperyearelectricity)arealmostthesameformuchoftheindicateaclearpushforgreenandbluehydrogenandtrucks,andeightchargingstations(Einride2023).whiledoublingitsshareintotalenergydemand.forecastingperiod.However,towardtheendofthederivativeslikeammoniaande-methanol.TheregionSaudiArabiahasbeenworkingonitsownbrandofEvs,Oildemandremainsrelativelysteady,butitsshareinOutlook,greenhydrogensurpassesbluehydrogen.CEER,toproduceEVsfordomesticsalesandregional160exportsinadditiontoowningabout60%ofluxuryEVmakerLucidMotors(Goldberg,2023).InBahrain,GaussAutoGroup,anAmericanmanufacturingcorporation,partneredthisyearwithBahrainicompanyMARSONGrouptoopenanEVmanufacturingplantinthecountry(GaussAuto,2023).Thefastestgrowingdemandsectorisbuildings,withspacecoolinginturnthequickestgrowingsubsector(Figure8.5.4).Outofthetotal18.7EJgrowthinannualtotalenergydemandinallsectors,4.2EJ(23%)originatesfromasurgeindemandforspacecooling,whichgrowsmorethanfive-foldfrom0.9EJto5.1EJperyear.Thisisdespitea30%improvementintheaverageefficiencyofcoolingequipment,meaningthatusefulenergydemandforspacecoolingisexpectedtogrowevenmorerapidly.ThisspectacularriseindemandforspacecoolingisdueinparttoCONTENTSDEMANDELECTRICITYRENEWABLESFOSSILFUELSFINANCEPOLICYEMISSIONSREGIONSAPPENDIXDNVEnergyTransitionOutlook2023hasanabundanceoftheprerequisites.ForgreenexpectedtobeexportedviapipelineandseaborneInUAE,DubaiElectricity&WaterAuthority(DEWA),cargo,toJapanin2020(Benny,2023),andtoSouthhydrogen,therearehigh-yieldrenewableresourcestrade,mainlytoEuropeandOECDPacific(particu-incollaborationwithGermany’sSiemens,initiatedKoreain2022(AlMonitor,2022).KSAcompanyandlargeareasofunusedflatlandforrenewableslarlyJapanandSouthKorea),aswellasaroundtheregion’sfirstindustrial-scalegreenhydrogenNEOMGreenHydrogenCompany’sUSD8.4bnandelectrolysisplants.Forbluehydrogen,there21Mt/yrofammoniaviashippingtovariousotherpilotschemein2021.AccordingtoanenergyfacilitybeingbuiltinOxagonissettobetheareabundantcheapnaturalgasresources.Aselec-regions.Figures8.5.8and8.5.9showMiddleEastministryofficial,UAEaimstoproduce1.4Mt/yrworld’slargestcommercial-scalegreenhydrogentricityandnaturalgasarecheap,localdemandforandNorthAfricaammoniaexportstootherregions.hydrogen–1Mt/yrgreenhydrogenand0.4Mt/yrproductionfacilitywhencommissionedin2026.expensivegreenhydrogenisexpectedtoberela-TheMiddleEastandNorthAfricaisexpectedtobebluehydrogen—by2031anda10-foldincreasetoItwillproduce600tperdayofcleanhydrogenbytivelylow,atleastinthenearterm.ConsideringthethesoleexporterofpurehydrogentoEuropeto15Mt/yrby2050.Twohydrogenhubsforproductionelectrolysisusingthyssenkrupptechnology,nitrogenpotentialforcost-effectiveproductionoflow-carbonsupplycleanenergywithintheframeworkoftheEU’swillbeginintheRuwaisandtheKhalifaIndustrialbyairseparationusingAirProducts’technology,andhydrogenandderivativesalongsidetheregion’sREPowerEUplantoreducedependenceonRussianZoneAbuDhabi(KIZAD),andby2050therewouldupto1.2Mt/yrofgreenammonia(NEOM,2023;Bell,idealpositionatthenexusofgrowthmarketsacrossnaturalgas.beatotaloffivehubs(ElDahan,2023).2023).theeasternandwesternhemispheres,MiddleEastandNorthAfricacountriesaresettobecomekeyHence,exporthasemergedasthecentralfocalpointSaudiAramcoseekstomeetasignificantshareofOman’sstrategyongreenhydrogenaimstoincreaseglobalsuppliersintheemergingglobalhydrogenwithinthenationalhydrogenstrategiesunveiledbyglobalbluehydrogendemandby2025andhasproductiontoaround1Mt/yrby2030,about3.5market.By2050,about4.8Mt/yrofhydrogenistheUAE,KSA,Oman,andQatar.alreadyexportedtheworld’sfirstblueammoniaMt/yrby2040,andupto8.5Mt/yrby2050(IEA,2023f).In2022,QatarannounceditsintentionstobuildAmmonia-7,theworld’slargestblueammoniaplant.TheUSD1.1bnfacilitywouldproduce1.2Mt/yrofammoniaandshouldbelaunchedin2026(ArabNews,2022).InMarch2023,RabahSalami,directorofAlgerianpoliciesonhydrogen,announcedthatAlgeriaaimstosupplyEuropewith10%ofthelatter’scleanhydrogenrequirementsby2040(Kim,2023).AtagreenhydrogenroundtablehostedbyEgypt’sprimeministerMostafaMadboulyinAugust2023,hesaidthatthecountryhasaUSD83bnprojectpipelinethatwouldyieldupto15Mt/yrofgreenammoniaande-methane(Parkes,2023).Theracetobecomethemainlow-carbonhydrogenhubintheregionispushinggovernmentstoaccel-erateandincreaseeffortsinestablishingregulatoryframeworkstosupporttheseambitions.However,asrequirementsforgreenhydrogendifferfromone161CONTENTSDEMANDELECTRICITYRENEWABLESFOSSILFUELSFINANCEPOLICYEMISSIONSREGIONSAPPENDIXDNVEnergyTransitionOutlook2023importingregiontoanother,MiddleEastandNorthlookinginitiativesunderscoretheMiddleEastandaround11%comparedwith2022levels,to2.6GtCO2Energy-relatedCO2emissionswillpeakAfricacountriesarealsoactivelyexploringprivateNorthAfricaregion'sproactiveapproachtocarbonannualemissions(Figure8.5.11).atsome13%abovetoday’slevelintheandpubliccertificationschemesthatwouldallowcapture,butagreatdealmoreneedstobedoneasmid-2030sbeforefallingto11%below2022themtosatisfytherequirementsofimporters.thefollowingdiscussiononemissionsoutlines.Someoftheregion’scountrieshavenet-zerotargetslevelsby2050.byoraround2050.TheUAEledthewayamongtheCarboncaptureEmissionsregion’spetrostatesinannouncingacommitmentIn2022,theoperationalCCUSfacilitiesintheregionCarbonpricingispresentlylowornegativegiventoachievenet-zeroGHGemissionsby2050.Israelhadapproximately4.3MtCO2/yrofcapturecapacity.fossil-fuelsubsidies,andslowadoptionisexpected.andOmanalsohave2050net-zeroambitions,TurkeyProjectscontributingtothiscapacityincludethoseOurprojection(seeSection6.3)fortheregionalfor2053,andBahrain,Kuwait,andKSAfor2060.ToofAlReyadah/EmiratesSteelintheUAE(capacityaveragecarbon-pricelevelisUSD10/tCO2(2030),reachnet-zeroobjectives,itwillbeimperativetostep0.8MtCO2/yr),AramcoUthmaniyahCO2EORProjectUSD20/tCO2(2040)andUSD30/tCO2(2050).upcarbonpricingandemissionabatementpolicies.(0.8MtCO2/yr),SABICCarbonCapture&UtilisationProjectinSaudiArabia(0.5MtCO2/yr),andQatarGasInthecontextofglobalclimatepolicy,countryinQatar(1.2MtCO2/yr).ThesefacilitiesareimportantpledgesinNDCsindicatethattheMiddleEastandpillarsintheindustrialdiversificationstrategiesofNorthAfrica,viewedasaregion,hasaregionalthesecountriesandarethereforealsoincludedintargetforemissionstoincreasebynomorethantheirdecarbonizationdrivesaimingtofuture-proof244%by2030relativeto1990.OurOutlookthesesectors.suggeststhatenergy-relatedCO2emissionsafterCCS(CCSvolumesareshowninFigure8.5.10)willbeAshydrogendemandexpandsacrosstheregion,limitedtoa241%increasebythen,demonstratingprominententitieslikeAramco,ADNOC,andthatemissiontargetswillbemetandcouldbeQatarEnergyhaveteamedupwithglobalfirmstoenhanced.Therearehoweversomeuncertaintiesinjointlyexploreandcapitalizeontheburgeoningthecomparisonsoftargetsandforecasts,assomeopportunitieswithinbluehydrogenandCCUScountriesareunclearaboutwhetherthetargetsprojects.QatarhasambitiousplanstocaptureoverreportedinNDCsalsoincludenon-energy-related11MtCO2/yrby2025(Pradeep,2022),apivotalCO2emissions.MostMiddleEasternemissioninitiativeaimedatreducingthecarbonintensityoftargetsaregiveninrelationtoabusiness-as-usualthenation'sLNGfacilitiesby35%,alongwitha25%trajectory.reductioninthecarbonintensityofitsupstreamfacilities.TheUAEhassetitssightsonscalingupEnergy-relatedCO2emissionsareexpectedtokeepitscapturecapacityto5MtCO2/yrby2030,whilerisinguntilthemid-2030s,whentheypeakataroundKSAenvisionsachievinganambitious44MtCO2/3.3GtCO2/yr,approximately13%abovetoday’slevel.yrcaptureby2035(Mills,2023).Figure8.5.10showsIn2050,energy-relatedCO2emissions(afterCCStheramp-upofCCSandDAC.Theseforward-andnetofDAC)intheregionhavedecreasedby162CONTENTSDEMANDELECTRICITYRENEWABLESFOSSILFUELSFINANCEPOLICYEMISSIONSREGIONSAPPENDIXDNVEnergyTransitionOutlook20238.6NORTHEASTEURASIA(NEE)PopulationGDP(USDTrillion)Energyuse(EJ)Energy-relatedCO2emissions(GT)(Million)GDP/person(USD)Energyuse/person(GJ)Energy-relatedCO2emissions/ThisregionconsistsofRussia,Mongolia,NorthKorea,person(Tonnes)andalltheformerSovietUnionstates,includingUkrainebutnottheBaltics7.0452.42022320220001417.6205033410.8421.7320001265.0AllGDPfiguresinthereportarebasedon2017purchasingpowerparityandin2022internationalUSD163CONTENTSDEMANDELECTRICITYRENEWABLESFOSSILFUELSFINANCEPOLICYEMISSIONSREGIONSAPPENDIXDNVEnergyTransitionOutlook20238.6NORTHEASTEURASIA(NEE)CharacteristicsandcurrentpositionRussia’sexportcapacitytoEurope.GasexportsPointerstothefuture—InUkraine,renewableenergywillplayakeyrolein(outsidetheformerSovietUnion)fell46%in2022energysectorrecovery,alsoaidingdecarbonizationNorthEastEurasiaproduced20%oftheworld’s(Bloomberg,2022a)comparedto2021,atrendthat—DecarbonizationeffortsinCentralAsiaareinandintegrationwiththeEU.Reconstructioncostsnaturalgasand15%ofitscrudeoilin2022.Coalisiscontinuinginto2023.theirearlystages.ItremainstobeseenifclimateareestimatedtotopUSD411bn(WorldBank,alsoabundant.Regioncountrieshavehighenergygoalsarerealisticintermsofpoliciesandimple-2023c).G7leaders(G7,2023)announcedtheintentintensityofGDP,andthereisaheavydependenceRussia’soilexporthasmaintaineditsvolumes,butmentation.PromotionofrenewablesonlystartedtofreezeRussia’ssovereignassetsinG7jurisdictionsonfossilfuelexportrevenue.atmuchlowervaluesduetothepricecapsetbythein2018(Sabyrbekovetal.,2023).TheCentraluntilRussiapaysforthedamagecausedtoUkraine.US,EU,andallies.HoweverexportdestinationshaveAsiaEnergyTradeandInvestmentForum(2023),Russiadominatestheregioninsize,population,andchanged,andrecentsignspointtosomeclawbackconveninginternationalfinancialinstitutionsand—TheMulti-agencyDonorCoordinationPlatformeconomicoutput.Itistheworld’ssecond-largestinprices.policymakers,signalsemergingemphasisonsolar,forUkraine,launchedJanuary2023,unitestheEU,producerofhydrocarbons(13%ofglobalgasandwind,hydropower,andmodernizingelectricityG7countries,andinternationalfinancialinstitutions.secondonlytoKSAinoilexports).InCentralAsianEnvironmentaladvocacyorganizationshavebeengrids(WorldBank,2023b).Itwillaimtocoordinateeconomicsupportforcountries,ChinahasgrownitsupstreaminvestmentsclassifiedassubversiveactivityinRussia.AndagainstUkraine'simmediatefinancingneedsandfuturewithownershipstakesinoilandgasproductionthebackdropofenergytransition,theregionisatrisk—Russiawillcontinuetorerouteitsfossilenergyeconomicreconstruction,withenergyinfrastructureinKazakhstanandnaturalgaspipelinesfromoffallingbehindinlow-carbonenergytechnology.toalternativemarkets,suchasgasexportstobeingaprioritysector.TurkmenistantraversingUzbekistanandForRussia,thisriskismagnifiedbytheeffectofKazakhstanandUzbekistan,viaTurkmenistanKazakhstantoChina.sanctions,withdrawalofinternationalcapital,andpipelinesforindirectaccesstoChina,andaflightofskilledprofessionals.possiblepipelinecompletionthroughAfghanistanRussia’sinvasionofUkrainehashadfar-reachingandPakistan(TAPI)toexportgastoIndia.Theimpactsontheglobalenergysystem.EuropeaninitiativesRussiaistakinginCentralAsiacouldcountriesareplanningtophaseoutenergyimportspartiallycompensateforthelostexportvolumesfromRussia,andthesabotageoftheNordStreamtoEurope.andNordStream2pipelinessignificantlyreduced164CONTENTSDEMANDELECTRICITYRENEWABLESFOSSILFUELSFINANCEPOLICYEMISSIONSREGIONSAPPENDIXDNVEnergyTransitionOutlook2023Energytransition:hydrocarbonpower-8.6.1andFigure8.6.2).FossilenergyremainsatElectrificationspecificcountries,Kazakhstangenerated4.5%ofitshousewithrenewablesgrowthemergingcurrentlevels,thoughelectricitycreepsupprimarilyThe32%increaseinelectricityproductionto2050electricityfromrenewablesin2022,therebyslowlyattheexpenseofcoalasbuildings'ownersanduserswillmostlycomefromrenewables,butgaswillstillmovingtowardsitsambitioustargetsforrenewablesOurpreviousOutlookshaveunderlinedthattakeadvantageofelectricity’saddedconvenience.provideclosetoonethirdofpowerin2050(Figuretoreach15%ofthepowergenerationmixby2030,exportersoffossilfuelswillinvariablybethelaggards8.6.4).Lowdomesticgasprices–alsobenefittingfromand50%by2050(Satubaldina,2023).Someoftheoftheenergytransition.ThisappliestoNorthEastWeforeseesimilardevelopmentsinprimaryenergylostexportopportunitiesasaresultoftheUkrainewardescribedincreasesinrenewablepowerarelikelytoEurasiacountries,whicharegenerallyautocratic,withdemand,asportrayedbyFigure8.6.3.NaturalgasandcontinuedsanctionsevenafterthewareventuallyreflecttherebuildingoftheUkrainianenergysectorunempoweredelectorates,andarenotwillingtoinvestcontinuestodominate,constitutingslightlymorethanends—makecoallesscompetitiveanditsshareininthecomingyears,whererenewableenergywillinfundamentalchange.halfofthemix.Onthenon-combustionside,solarpowerproductionreducesfrom15%presentlybethekey.Specifically,Ukraineisaimingtoincreaseandwindwillgrowstronglyrelativetotheircurrentlyto3.5%in2050.Bymid-century,hydropoweroutputtheshareofrenewablesinitselectricitygenerationInourforecast,theregion’senergysystemgenerallynegligiblesharesreflectingambitioustargets(relativewillhaveincreasedby54%togeneratealmostatowards50%toboostenergysecurity(Drevesetal.,retainstoday’scharacteristicsthroughtomid-century.totherestoftheregion)forrenewablesinKazakhstanfifthoftheregion’selectricity.Growingfromvirtually2023).PotentialfutureintegrationofUkrainewiththeFinalenergydemandin2050isonlyabout10%lowerandUkraine.However,despitethegrowth,solarandnothingtoday,solarandwindpowerwilltogetherEUwillonlyreinforcetheincreasingroleofrenewablesrelativetocurrentlevels,withasimilarsectoralsplitwindwilleachprovideonlyabout3%ofprimarygenerate34%ofelectricityin2050,whichwillbeforthatcountry,whichwillcontributetosomeextentandlittlechangeinthemixofenergycarriers(Figureenergyin2050.72%higherthanhydropowergeneration.Lookingattotheenergymixoftheregion.165CONTENTSDEMANDELECTRICITYRENEWABLESFOSSILFUELSFINANCEPOLICYEMISSIONSREGIONSAPPENDIXDNVEnergyTransitionOutlook2023HydrocarbonsWethereforeforeseethatwithpotentialnewtypicallyrequiredtofollowsanctionsagainstRussia166Theregion’sexportsandenergyproductionfuturealternativeexportdestinationsforRussiangasestab-and,giventhedominantroleofwesterninsurers,hingeonthefutureofitsoil,gas,andcoalexports.lished,theregion’sgasexportswillpickupbytheevennon-westernshipswillfindithardtooperateMorethanonethirdofthefossilenergyproductionearly2030swhileremaininglowerthanpre-invasioninthistrade.Whileseaborneoilandcoalexportsisexportedtootherregions–51%ofcoal,48%ofoil,levels,andwillcomprise188billionm3by2050.fromtheregioncontinue,thiscanbeexplainedbyand24%ofgas.Europe(EU)wasthemainmarketforFurthermore,thesenaturalgasexportsre-routednon-westerninsurersincreasingtheirunderwritinggasexportstransportedmainlythroughpipelines.eastwardwouldmostlikelyneedtobesoldatamarketshareorshipstravellingwithoutinsurance.RussiahaltedtheseexportsindefinitelyinautumndiscountinordernottoharmtheenergybusinessEventhoughRussiaiscurrentlyfindingbuyersforits2022.EuropeisdeterminedtopivotawayfrominKazakhstan,Uzbekistan,andTurkmenistan.oil,itislikelytobesoldataheavydiscounttoBrentRussiangas,andthusimportsareassumedtobenchmarkprices.Moreover,Russia’saggressionbereplacedbyothersuppliersgoingforward.InDespitetheEU-imposedimportbanonseaborneagainstUkraineraisesconsiderablerisksfortheaddition,theEUhasimposedapricecaponnaturalcrudeoilimportsfromRussia,andabroaderG7economicfutureoftheregion.gastocurbthehighvolatilityofgasprices.Otheroil-pricecaponRussianoilproductstopreventcountriesintheregionwill,however,continuesomeitfromearningawartimepremium,Russiahasexports,butnotinsufficientquantitiestoinfluenceamanagedtoredirectitsoiltonewcustomers.IEA50%reductionintheregion’sglobalgasexportsover(2023g)estimatesthatChinaandIndiatogetherthenext30months(totalling157billionm3in2024).accountedfornearly80%ofthisredirectedoilinApril2023.Oilexportsarebacktopre-warlevelsInthelongerterm,Russiaislikelytobemoreinter-andwillevenincreaseby40%withinthecomingestedinsellingitsgastothehighestbidder,andfiveyears.Similarly,coalexportswillincrease42%thiswillnotbeEurope.Anincreasedbuild-upofby2035butdeclinetowards28%oftoday’slevelstransportinfrastructure—pipelinestotheeastandby2050.LNGterminalsinthenorth—willonlypartiallyreplacecurrentpipingofgastoEurope,sotheregion’sgasOilandcoalexportsaremucheasiertoredirectexportswilldecline(Figure8.6.5).Domesticdemandthannaturalgasastheycanbetransportedonkeelwillnottakeuptheslack.Regionalgasproductionmorereadily.Thoughmuchoiltransportisthroughpeakedin2021at1,047billionm3.Productionwillpipelines,trainsandtruckscanalsobeusedcostfallby15%to890billionm3in2031whileglobalgaseffectivelyoverlandwithouttheneedtoconverttoproductionisincreasingby7%.Thistrendisalreadyorfromsolidform.However,enablinglongdistanceevidentinNorthEastEurasia.Gazprom’sgasexportstransportfromtheregionrequiressignificantinfra-toChinamorethandoubledin2022comparedtothestructure.Anadditionalcomplicationariseswhenoilpreviousyear,butthecompany’stotalgasexportsstillandcoalareexportedoverseas:thisrequiresshipsdeclinedby45%,resultinginitstotalgasproductionandwesternshipownersaresubjecttosanctionfallingby20%overthesameperiod(Kardaś,2023).rulingsagainstRussia.Moreover,insurersareCONTENTSDEMANDELECTRICITYRENEWABLESFOSSILFUELSFINANCEPOLICYEMISSIONSREGIONSAPPENDIXDNVEnergyTransitionOutlook2023Emissionswillbe1.8GtCO2(includingnon-energyprocessNorthEastEurasiaseesthelowestreductioninachieved.Ontheotherhand,therecoveryeffortsOurprojectionfortheregionalaveragecarbon-priceemissions)in2050,representingthehighestemis-emissionsofanyindustrializedregion,withaaimedatrebuildingtheenergysectorofUkrainelevelisUSD6/tCO2in2030andUSD20/tCO2bysionsperpersonofanyregion.decreaseof31%ofemissionsbetween2022andwilllikelyemphasizetheroleofrenewablesasboth2050.Slowadoptionandlowcarbon-pricelevelsare2050.RussiaandKazakhstanhavesetnet-zeroacleanerandsecuresourceofenergy,whichwilltoexpected(seeSection6.3).Whileotherregionsexperiencebothstrongtargetsfor2060,andUkraineforcarbon-neutralitysomeextentbereflectedinhowgreentheenergyelectrificationandagreeningofelectricity,suchin2060,whichhaveaverylowprobabilityofbeingmixofthewholeregionwillbe.Energy-relatedCO2emissionswillfallby31%todevelopmentsareratherweakforNorthEastEurasia.mid-century,byasimilarfractioninbuildingsandElectricitydoesgrowcomparedtootherenergy167transport(27%and23%,respectively),andbyalmostcarriers,butonlyfrom12%nowto18%oftotalhalfinmanufacturing,asshowninfigure8.6.6.energydemandin2050.TheuseofnaturalgasinHigheremissionsreductionsinmanufacturingarepowerproductiondeclines30%butstillmaintainsduetoincreasingammoniaproductionviamethanethesinglelargestshareingeneration.CoalremainsreformingwithCCS.Theregion’stotalCO2emissionsinthepowermixbymid-century,butwithamuchlowersharethannow.ThelowcarbonpriceshindertheuptakeofCCS,andso,apartfromtheuseofCCSforammoniaandhydrogenproduction,lessthan1%ofmanufacturingorpowersectoremissionsarecapturedin2050.Inthecontextofglobalclimatepolicy,ourinterpre-tationofcountryNDCpledgesintheregionisthattheregiontargetsa26%reductioninenergy-relatedemissionsby2030,relativeto1990.Asenergy-relatedCO2emissionsafterCCSareforecasttobedownby39%,theregionasawholereachesitsclimategoalsbeforethetargetyear.However,astheSovietUnioncollapsedin1991,emissionstatisticsareproblematic;theyindicateemissionsfallingafull40%between1990and1997.Althoughindustrialproductionfellbyhalfinthesameperiod,emissionsreductionstatisticsmaywelloverstatetheextentofthedecline.However,thereportedriseinemissionsbetween1997and2020appearstobearobustobservation.CONTENTSDEMANDELECTRICITYRENEWABLESFOSSILFUELSFINANCEPOLICYEMISSIONSREGIONSAPPENDIXDNVEnergyTransitionOutlook20238.7GREATERCHINA(CHN)PopulationGDP(USDTrillion)Energyuse(EJ)Energy-relatedCO2emissions(GT)(Billion)GDP/person(USD)Energyuse/person(GJ)Energy-relatedCO2emissions/ThisregionconsistsofMainlandChina,HongKong,person(Tonnes)Macau,andTaiwan3315910.720221.45228001107.420501.34671464.0500001093.0AllGDPfiguresinthereportarebasedon2017purchasingpowerparityandin2022internationalUSD168CONTENTSDEMANDELECTRICITYRENEWABLESFOSSILFUELSFINANCEPOLICYEMISSIONSREGIONSAPPENDIXDNVEnergyTransitionOutlook20238.7GREATERCHINA(CHN)Characteristicsandcurrentpositiononshorewind360GW,andoffshorewind31GW.Pointerstothefuture—Energysecurityisthebasisforpromotingrenew-China’sbatterycompanieshavemorethan60%ables.Keytargetsare:1,200GWinstalledwindandPricestability,energysecurity,andeconomicgoalsglobalmarketshare,andChinaaloneaccountedfor—Chinaaimstorebalanceitseconomytowardsdomesticsolarcapacityby2030andincreasingthenon-fossilareoverridingobjectivesinChinesepolicies.35%ofglobalEVexportsin2022(NikkeiAsia,2023).consumptionandhigh-qualitygrowth,pivotingfromshareintheenergymixto25%in2030and80%byindustryandinvestmentspending(e.g.infrastructure,2060.China’scentralgovernmentprovidessteadfastState-ownedChinesecompaniesplayakeyroleinrealestate)toconsumptionandservices,therebyplanningtosteerthetransition.The‘1+N’policydecarbonization:followingpoliciestoadjusttheiradjustingtheeconomytolowerenergyintensity.—Asrenewableenergyresourcesareconcentratedinframework—1referringtothehigh-levelpolicyenergyproduction/consumptionstructures,meetingthenorthwestandconsumptioncentresintheeastframeworkandlong-termclimatechangestrategyemissionreductiontargets,andprogressing—Indecarbonization-relevanttechnologyareas,andsouth,transmissionwillexpand.Manufacturing(NDRC,2021)andNtoclimateactionimplementationtechnologiestechnicallyandcommercially.Forinnovationclusterswillbefacilitated,andscalingisrelocationtohighVRESareaswillbepursued.plansforkeyareasandsectors—istodeliveritsexample,Sinopecoperatestheworld'slargestexpectedtorelyonmandatesforuptake(e.g.CCS,pledgeofpeakingcarbonemissionsbefore2030solar-to-hydrogenproject(Xinjianregion)toproducehydrogen).TheNewenergyvehicle(NEV)policyis—Offshorewindwillreceiveprovincialsubsidies.andachievingcarbonneutralityby2060.20,000t/yrgreenhydrogen,poweredby300MWextendingincentivestofurtherpenetration.Tradeablegreencertificateswilladdvaluetosolar.grid-connectedrenewablepowerandareexpectedChina’sprovincesaretaskedtodevelop1+N—Thenationalemissionstradingschemewillcovertodrivegreenpowerdemand,suchasfromstrategiesfollowingthenationalframework.Chinaistakinganactiveroleinclimatediplomacyhigh-emissionsectors(70%ofemissions)withmultinational,export-oriented,andstate-ownedMosthavedevelopedlocalsectoralfive-yearplansandexpandingitsclimate-changecooperation(MEE,sectoralexpansionhappeninggraduallyto2030,enterprisesthathaverequirementsforgreenpower(2021–2025),buthaveyettodeveloproadmapsfor2022).Thefirsthalfof2023had55%oftheBeltandpressuredbytheEU’scarbonborderadjustmentconsumption(NEA,2023a).carbonneutrality(CCNT,2023)RoadInitiative’senergyspendgoingintorenewablesmechanism(CBAM).(GFDC,2023).—ChinareleasedtheBlueBookontheDevelopmentIn2022,nearlyhalfoftheworld'slow-carbon—China’sgovernmentbackscontroloffossil-fuelofNewPowerSystemsinJune2023(NEA,2023b).transitionspendingwasinChinaatUSD546bnconsumptionbutdrought-inflictedhydropowerBeyondpowersystemdevelopments,itenvisions(BNEF,2023b).Cumulativesolarcapacityis413GW,shortageshasitleaningoncoaltosecuresupply,CCUSuptakebetween2030and2045,andalbeitwithlowcoal-plantutilizationandtheacknowl-electricityandhydrogenasthemainbodyofedgedneedforanalternativelonger-termsolution.end-useconsumptionevolvingbetween2045and2060.169CONTENTSDEMANDELECTRICITYRENEWABLESFOSSILFUELSFINANCEPOLICYEMISSIONSREGIONSAPPENDIXDNVEnergyTransitionOutlook2023Energytransition:animmenseshiftSince2013,China’senergyusehasalsostartedtoChina’spopulationpeakedat1.426billionin2022vehicles.However,ahighlevelofurbanizationsulliedbycoaldiversifyintoalmostallotherenergysources,with(UNDESA,2023),andisexpectedtobeabout90andextensivebuild-outofpublictransportwillstronggrowthinnaturalgas,hydropower,nuclear,solarmillionlessin2050thantoday.ThereductioninmeanvehicledensityremainslowerthaninOECDIn2022,Chinaaccountedfor18%oftheworldpopu-PV,andwind.Coalandoilintheenergymixincreasetheworkforceisevengreater,andthisinfluencescountries.Inthe2040s,areductioninpopulationlationand20%ofglobalGDP.Energydemand,closelyslightly–worryinglysointhecaseofcoal–inthenextproductivityandeconomicgrowth.Withasmalleralongsidegreaterautomationandcarsharingwillcorrelatedwithbothpopulationandeconomicgrowth,coupleofyearsbeforetheygraduallydeclinetoaworkforce,salariesarelikelytogrowmorethaninreducevehiclenumbers.Aviationislikelytotriplehassoared—Chinanowaccountsfor26%ofglobalthirdandahalf,respectively,oftheircurrentvolumesneighbouringcountries.Evenwithincreasedauto-throughto2050asanincreasingnumberofChineseprimaryenergydemand.Itismorelikeacontinentby2050.In2050,theshareoffossilfuelwillreducetomation,asignificantshareofChina’smanufacturingbecomemiddleclass,includingmanypensionersthanacountry,andcomparisonslikeChinabeingtheabout10%inprimaryenergysupply.willmovetocountrieswithcheaperproduction.whowouldliketotravel.world’sbiggestproducerorconsumerofsomethingAstrongdomesticmarketandafocuson‘MadeTheurbanizationrateinChinaisgrowingrapidly;arethereforeoflessrelevancethanwhenmakingTheforecastenergysupplyanddemandtrendsininChina’protectingdomesticmanufacturersmaytoday,almosttwo-thirdsoftheChinesepopulationmanyothercountry-vs-countrycomparisons.Whatthecomingdecadesarecloselylinkedtothedemo-countersomeofthesetrends.livesincities.Mostofthemalsoliveinnewhigh-riseisimportantisthatChinaisresponsibleforathirdofgraphicandeconomicdevelopmentsoftheregion.buildings,asituationverydifferentfromurbanizationglobalenergy-relatedCO2emissions,sodevelopmentsTheyarealsostronglyinfluencedbygovernmentAverageannualeconomicgrowthhasbeenmoreinNorthAmerica,forexample.Smallfamilysizestherearecrucialtowhethertheworldwillmeetitsenergyandenvironmentalpolicy.than8%for30yearswhiletheGDPpercapitaemissionsreductiontargetandclimateobjectives.experienceda10-foldincreaseinthesameperiod.170Weexpectittoslowsignificantly,withanaverageThecentralgovernmentofChinaisverystrongandgrowthof2.3%forthenext30yearsduetopopu-setsadirectionthatthecountryislargelyfollowing.lationreductionanddemographicshifts,andtoThestabilityofthegovernmentalsomakesforChinabecomingamorematureeconomy,withmoreuniformdevelopmentsthaninmanycountriesfewerproductivitygainsinindustry.Overtime,itswheretherearefrequentchangesofgovernmentlong-termeconomicgrowthratewillmorecloselyandleadership.Hence,Chinaismorepredictableresemblethatofothermediumandhigh-incomefromaforecastingperspective.Still,evenChinesecountries.By2050,theGDPpercapitaisprojectedlong-termplanninghaslimitations;onegoodexampletobemorethandoubleitscurrentvalue,reachingisthecurrentdemographicshiftthatlookslikeithasUSD50,000peryear.resultedinamuchfasterpopulationandworkforcereductionthanforeseeninChinesegovernmentplans.EnergydemandThedemographicshiftandeconomicgrowthChina’sprimaryenergysupplyhasnearlytripledoverinfluencenotonlymanufacturingbutalsotransportthelasttwodecades,asillustratedinFigure8.7.1.Theandbuildings.Thedensityofpassengervehiclesstrongincreasecamefirstandforemostfromcoal,isexpectedtoundergosignificantgrowth,withawhichin2022accountedfor58%ofprimaryenergypotentialpeakaround2040,reachingapproximatelyuseinChinaand54%ofglobalcoalconsumption.90%morethanthe2022countofabout256millionCONTENTSDEMANDELECTRICITYRENEWABLESFOSSILFUELSFINANCEPOLICYEMISSIONSREGIONSAPPENDIXDNVEnergyTransitionOutlook2023andanincreasedstandardoflivingwillseebuildingclimatepoliciesarealsolinkedtoallotherprioritiesElectricitytakingholdindemandsectorswhichithada60%sharein2022(EVVolumes,2023).stockinChinagrow26%forresidentialbuildingsandofthegovernment,includingeconomicgrowth,ElectrificationofenergydemandsectorsisthekeyItisalsoaleaderindomesticEVuptake,thoughthe160%forcommercialbuildingsby2050.Fordetails,geopoliticsandnationalsecurity,nationalandsocialmeanstoreduceemissionsbecausepowergener-typicalChineseEVhasamuchsmallerbatterysizeseeFigures1.4and1.5inChapter1.Astrongfocusstability,andenergysecurity.ationiseffectiveandrelativelyeasilydecarbonized.onaveragethanEuropeanandUScounterparts.onenergyefficiencywilllimitgrowthinbuildings’AsillustratedinFigure8.7.3,electricitycurrentlyMostEVsproducedoutsideChinauseChineseenergyuse,whichisrelativelystablefrom2030AsChinausesmorethanhalf(54%)oftheworld’smeets25%offinalenergydemandinChina.Webatteries,illustratingthatforChina,EVsarenotjustonwards.Whileenergyneedsforheating,watercoalandemits32%ofenergy-relatedCO2,thereisforecastthiswillincreaseto44%in2050,whichaconsiderationwithinenergyandclimatepolicies.heating,andcookingwillberelativelystable,energypressurefromothercountriesforChinatoreducewouldbethehighestshareamongallourOutlookItisalsoindustrialpolicytoentertheglobalmarketneedsforcoolingincreasemorethansix-foldoveritsemissionsfaster.FromtheChineseauthorities’regions.Electricityusewillgrowinallmaindemandforvehicles,whichEurope,Japan,andtheUShavethenext20years,andby2050represent29%ofpointofview,abalanceisimportant,withemissionssectors—buildings,manufacturing,andtransport.dominatedfordecades.DNVexpectstheuptakeofChinesebuildings’energyuse,justbehindenergyreductionhavingtofinditswayamongalltheotherExtensiveprogrammesareunderwayinalltheseEVsinChinatobethefastestamongallregions,withneedsforheatingwitha34%share.prioritiesinthecountry.Asinallothernations,sectorstospeedupthistransition.EVsreachinghalfofnewvehiclesalesthereby2027sometimestheprioritiespullinthesamedirection,andEVsconstitutinghalftheentirefleetofvehiclesOverallfinalenergyusewillgrow9%fromtodayandsometimestheyareopposingforces.TheThemostvisibleimpactofelectrificationisonroadby2031.Thecountryisalsoleadingthetransitiontopeakin2033at122EJ,andwillthendeclinetoChinesegovernment’sstabilityenablespriority-transport.ChinadominatesglobalEVproduction,fortoEVsforcommercialvehiclesandtwo-andthree-106EJby2050,asshowninFigure8.7.2.Arapidbasedlong-termplanningtoagreaterextentthanwheelers.demographicshiftisaidingthisreduction,whichisinotherregions.However,geopolitical,economic,otherwisemainlydrivenbytherateofenergy-efficiencyandtechnologicaltrendsthatChina’sgovernmentisChinaalsohasgoalsforhydrogen-poweredpassengergainsbeinggreaterthanthatofeconomicgrowth.Byunabletoforeseewillalwaysinfluenceandaltertheandcommercialvehicles.AsdetailedinChapter1of2050,manufacturingwillstillbethelargestsectoroflong-termplans.ourOutlook,ourmodellingcurrentlyindicatesthatenergydemandwitha41%shareinthetotal,downhydrogencannotcompetewithEVsinthepassengerfrom51%today,whilebuildings’sharewillgrowfromChina’smostpronouncedclimatepolicyisitsvehiclesegmentandwillonlypowerabout3%of19%to28%.Transport’ssharewillinitiallygrowfromcommitmentforCO2emissionstopeakaroundcommercialvehiclesin2050,which,owingtohydro-16%nowto18%by2027,thendeclineto16%in205013GtCO2/yrbefore2030,andtoreachclimategen’sinefficienciesaddsupto13%ofthatsegment'saselectrificationofroadtransportscalesfromtheneutralityin2060(CCICED,2022).Onthe2030energydemandbythen.Thisislikelytobethepatternlate2020s.goal,thereisanarrayofsupportingtargets,goals,ofuptakeinChinatoo,withhydrogenactingasaandmeasures,bothinthepresent14thFive-Yearsupplementtoelectricityinheavydutytransport.Whileenergyconsumptionistoalargeextentinflu-Plan(FYP)to2025andthe15thFYPperiodto2030.encedbydemographicsandeconomics,ChineseOnthe2060goals,thereareveryfewsupportingDirectuseofcoalrepresentsathirdofChinesepolicyisthemostimportantfactorinfluencingthemeasuresyet.Althoughnotexplicitlystatedinofficialenergydemandtoday,andthefuelwillmaintainitsenergymix.Technologyandcostdevelopmentalsodocuments,recentinformationfromChina'sspecialshareforthenextfiveyearsbeforehalvingtocoverplayamajorroleinthetransitionfromafossiltoaenvoyforclimatechangeXieZhenhuathat206016%ofdemandin2050.Onesignificantdriverofthisrenewableenergysystem,butenergyandclimatecarbonneutralityincludesalltypesofGHGsisaveryreductionwillbeahalvingofcoaluseinmanufac-policyareinterwovenineverychange.Energyandimportantspecification(OIES,2022).turingasheavyindustrieslikeiron,steel,andcement171CONTENTSDEMANDELECTRICITYRENEWABLESFOSSILFUELSFINANCEPOLICYEMISSIONSREGIONSAPPENDIXDNVEnergyTransitionOutlook2023productiondeclineinsizeandchangeproductionElectricitygenerationdecades,China'snuclearcapacityandproductionare(to1.8PWh)overthenextdecadeandthereaftermethods.ThereductionofcoaluseinelectricityChina’sannualelectricityproductionwillalmostprojectedtogrow2.5times,reaching930TWh/yroverstabilize.Withashareof15%in2022and11%ingenerationwillbeevengreater,asdescribedbelow.doublefrom9.2PWhtoreach16.2PWhin2050.Asthenextfewdecades,constitutinga6%shareofthe2050ofthetotalelectricitymix,thisdispatchableshowninFigure8.7.4,coal’sshareoftheenergymixelectricitymixby2050.WhilenuclearpowerstationrenewableenergysourceiscrucialtobalancetheOil’sshareintheenergycarriermixwillreducefromhasalreadyreducedfrom73%adecadeagoto60%costsinChinaarelowerthanthoseinOECDcountries,variablerenewableproductionfromsolarPVand25%to15%asroadtransport(thebiggestuseroftodayandwillfurtherdeclineto47%in2030andtheyremainmorecapital-intensivecomparedwithwind,butitisalsosubjecttoclimaterisksintheformoilproducts)electrifies.Whilenon-energyuseofonly5%in2050.Gasmaintainsaminorshareof4%otherplanttypes.Nevertheless,drivenbyenergyofmoreextremerainfallvariabilityanddroughts.oilultimatelyreducestowardtheendofthe2030s,in2050,andoilisnegligiblebythen,meaningthatsecuritypolicies,Chinaiscommittedtofurtheroiluseinfeedstock(e.g.forchemicalsandfertilizeronly9%ofChina’selectricitywillbegeneratedfromenhancingitsnuclearshareinpowerproduction.IscoalpeakinginChina?production)willovertakeoiluseintransportasthefossilfuelsinmid-century.Theshortansweristhatcoalusewilleaseoffthislargestuserofoil.However,itisinrenewableswherethelion’ssharedecade,butnotbeforeahalf-decadeatsustainedNuclearinChinaisinteresting.Itpresentlyhas4%ofofgrowthoccurs,dictatedbyclimate,energy,andrecordlevelswhichthreatenChina’sreputationasaCoal-to-gasswitchingisaprominentpolicyinChinatheelectricitymix,375TWhperyear.Remarkably,industrialpolicies.Chinaalreadydominatesgloballeaderinthetransition.China’scoaluseincreasedforbuildingsandmanufacturing.DirectuseofChina'snuclearcapacityexpansionrivalsthatoftherestsolarPVproductionanduptakeandhasrecentlysteeplyuntil2013andhassincehoveredaroundthatgasgrowsoverthenextdecadebeforestartingtooftheworldcombined.Projectedacrossthecomingassumedthesameroleinwind.Theshareofyear’slevel.Coalconsumptionincreasedbetweendeclinefromtheendofthe2030sashydrogen,forwind-generatedelectricityinChinais8%in2022and2021and2022andsoaredfurtherin2023.Weexample,beginstoreplaceit.Ascoalisadomesticwillgrowto13%in2030and37%in2050.SolarPVprojectthatconsumptionwillplateauforthenextenergysourceandnaturalgasismostlyimported,hasahighergrowthratefroma5%sharein2022tofourtofiveyearsbeforegraduallyreducingtoathirdgeopoliticaldevelopmentsoverthepastyear15%in2030,and36%in2050.ofitscurrentlevelattheendofthedecade.In2022,mightslowthegovernmentalfocusoncoal-to-gas86.6GWofnewcoal-firedpowerplantcapacityswitching,whichismoreaboutlocalairqualitythanThe2025targetsforrenewableinstallationsinthewasapprovedcomparedwithonly18.6GWintheGHGemissionsandcost.14thFYPandthe2030solarandwindtarget(1.2TW)previousyear(EnergyFoundationChina,2023).arelikelytobeexceeded.Includingbothgrid-PresidentXi’scommitmentin2021thatcoaluseHydrogenisnegligibleasanenergycarriertoday,butconnectedandoff-grid(forgreenhydrogenwillpeakinChinain2025(Stanwayetal.,2021)willstarttoreplacesomecoalandgasuseinmanufac-production),weexpect1.4TWofinstalledsolarPVhasnotbeenrepeatedinthelasttwoyears,whichturinginthe2030s.Inthe2040s,wewillseetheuptakecapacityby2030,reaching5.1TWin2050.Similarly,increasesdoubtabouttheprioritythattheChineseofammoniainshippingande-fuelsinaviation.Intotal,installedwindcapacityincludingoff-gridisexpectedgovernmentisassigningtothis.hydrogenanditsderivativeswillhavea3%shareoftobe0.8TWby2030,with0.7TWbeingonshoreenergydemandin2050.ProductioninChinawillbewind.Thegrowthwillcontinue;weexpect2.5TWThepowergenerationandmanufacturingsectorspredominantlygreenhydrogenproducedviaelec-onshorebymid-century,430GWoffixedoffshore,arethemajorcoalconsumersinChina.Accordingtotrolysispoweredbydedicatedrenewables.Therewilland59GWoffloatingoffshore.ourOutlook(Figure8.7.5),coalconsumptioninbothalsobealargeshiftinhowhydrogenisproducedforwillcontinuegrowingforthenextfiveyears.There-useasindustrialfeedstock,fromcoalgasificationtodayHydropowerisalsolargeinChina,producing1.4after,Chinesemanufacturing'srapidelectrificationtogreenhydrogenfromelectrolysersinthefuture.PWhannuallytoday,afigurethatwillgrow25%willresultinitscurrentcoaldemandof30EJ/yr172CONTENTSDEMANDELECTRICITYRENEWABLESFOSSILFUELSFINANCEPOLICYEMISSIONSREGIONSAPPENDIXDNVEnergyTransitionOutlook2023halvingby2050.Asdescribedabove,coal’sshareinChinain2022hadfallen78-foldoutsideofChinasincetheoverallelectrificationratestillrises.Figure8.7.6,–nuclear,bioenergy,andrenewables–isalsoelectricitygenerationwillreducefrom60%todaytoitspeakatUSD39bnin2017(Hurleyetal.,2023).alsoexplainingthetrendsinprimaryenergy(Figuredevelopedmainlydomesticallywithfewforeign5%inmid-century.TowardstheendoftheOutlook8.7.1),showsaninterestingtransitioninacountrythatresourcesexceptsomemineralsandmetalsneededperiod,manufacturing(15EJ/yr)willovertakepowerIfChinesecoalusefollowsthepathinourforecast,thehasstrongenergy-efficiencygrowth,decliningGDP/formakingwindturbinesandsolarpanels.generation(10EJ/yr)asthelargestconsumerofcoalresultingannualemissionsfromcoalwillfallfrom8.1capitagrowth,anddecliningpopulation.inChina.Coaluseinbuildings,whichisrelativelyGtCO2todayto2.3GtCO2in2050,makingacrucialWedonotexpectanydramaticchangeinthissmall,willfallinthecomingyearstobelargelycontributiontoreducingglobalemissions,butwillstillEnergysecuritypicturewithintheforecastperiod.Thereareamplereplacedbynaturalgas.betoohighfortheworldtoreachnetzero.EnergysecurityisahighpriorityforChina.In2022,coalsuppliesdomestically,butitwillnotbepossiblePresidentXiJinpingsaidthenation’scarbongoalsforChinatoincreaseoilandgasproductiontolevelsIn2021,ChinaannounceditwouldstopfinancingandThecarbonintensityofChineseenergyusereducesshouldnotclashwithotherpriorities,whichincludeatwhichthecountryiswhollyself-supplied.Inoursupportingtechnologyforcoalplantsoverseas.Thisisfrom103to42gCO2/MJoverthecomingthreesecuringadequatesuppliesoffood,energy,andresults,thesharesofimportedoilandnaturalgasanimportantstepthatincreasesthecostsofnewcoal-decadesandisfirstandforemostcoupledwiththematerials“toensurethenormallifeofthemasses”neededtomeetdemandgrowuntil2030and2040,firedgenerationinotherregionsandhelpsthetran-reductioninChinesecoalconsumption.(Bloomberg,2022b).Coalispredominantlydomes-respectively,beforegraduallydecreasing.Chinaissitiontocleanertechnologies.AccordingtoGlobalticallysupplied,butin2022,58%ofnaturalgasandconstantlypositioningitselftowardsthelargeoilEnergyMonitor,overseascoalprojectfinancingbyEnergyefficiency76%ofoilwereimported.Thenon-fossilenergyandgasexportingnationsintheMiddleEasttohaveEnergyefficiencyisanotherkeyleverfortherela-suppliesavailable.RecentWesternsanctionsagainsttivelyfastenergytransitioninChina.UrbanizationandRussiafollowingtheinvasionofUkrainehasgivengeneraltechnologyimprovementbothcontributetoChinaanopportunitytofurtherstrengthenenergytheshift.However,thedoublingofelectricity’ssharecooperationwithRussia.Russianoilandgasnotintheenergymixisbyfarthebiggestcontributor,andbeingsoldtoEuropeisavailabletoChina,includingevenmoreimportantwhenelectricityalsobecomesthroughnewpipelinesthatwillbeconstructedrenewable.Theefficiencyimprovementscomeinalltocementlong-termimports.Figures8.7.7showsectors,asallelectrify,buttherearemanyotherinitia-thehistoricalandforecastedtrendforChina’sgastivestoimproveenergyefficiency.importviapipeline,dominatedbyNorthEastEurasia(mostlyRussia)orasLNGdominatedbytwosupplierEnergyintensity,measuredasMJofprimaryenergyregions:OECDPacificandtheMiddleEastandperunitofGDP,isakeymetricChinesepolicymakingNorthAfrica.isfocusingon.Wefindthatthepresentenergyintensityof4.8MJ/USDwillreduceto2.2MJ/USDinNevertheless,China’slong-termaimistobeenergy2050.Theannualreductionrateswillfallfromaroundindependent.Theswitchtorenewablesoverthe4%todaytolessthan2%towards2050,asshownincomingdecadeswillmakeChinalessandlessreliantfive-yearintervalsinFigure8.7.6.Themainreasonforonimportedenergyfromanyothercountry,thoughtheslowdownisthattheelectrificationgrowthrate–infullenergyindependenceisnotachievedinourroadtransport,forexample–willslowdown,thoughforecastperiod.173CONTENTSDEMANDELECTRICITYRENEWABLESFOSSILFUELSFINANCEPOLICYEMISSIONSREGIONSAPPENDIXDNVEnergyTransitionOutlook2023Emissionsshareofemissionsfastest,andelectricityimpactsOurprojectionforChina’saveragecarbon-priceyrin2050.AswellasCCS,theregiondevelopsIn2022,almostathird(32%)ofglobalenergy-relatedemissionsfromallthedemandsectors.AsshownlevelisUSD20/tCO2in2030,USD40/tCO2in2040,andincreasesDAC,reaching7MtCO2/yrin2050.CO2emissions–24%fromcoal,8%fromotherfuelsinFigure8.7.4,inmovingfromcoaltorenewables,increasingtoUSD90/tCO2by2050,alevelexceededInvestinginCCSprojectsisdrivenbyeconomic–werefromGreaterChina.Thissharehasincreasedthepowersector’sshareofenergy-relatedCO2onlybyEuropeandtheOECDPacificregions.Theconsideration,soaslongasstabilityandsecurityofsteadily,withthehighestgrowth(from14%to27%)emissionsreducesfromthecurrent51%to33%inupwardpricingtrendisunderpinnedbytheinclusionenergysupplyremainthehighestprioritiesinenergybeingintheperiodfrom2000to2010.Itisexpected2050,withanabsolutereductionfrom5.5GtCO2/ofmoresectorsandexpandingcoverageinChina’spolicy,mostinvestmentisdirectedtowardsrenew-toincreaseslightlyto34%bymid-2035,afterwhichyrto1.3GtCO2/yr.Manufacturing’ssectoralshareofnationalemissionstradingscheme(seeSection6.3).ables,nuclearpower,andgridinfrastructure.China’semissionswillfallmuchmorerapidlythanenergy-relatedCO2emissionsin2022,thesecondtheglobalaverage,withChinaaccountingfor22%largestamongmainenergydemandsectors,Weforecastthat71MtCO2willbecapturedbyCCSComparingtheDNVforecastwithofficialChineseofglobalenergy-relatedCO2emissionsin2050.increasesfrom27%todayto35%in2050,albeitby2040.Figure8.7.9showsthattheramp-upofCCSgoalsandotherChineseforecasts–fromChinawhilehalvinginabsoluteterms.TheCO2emissionwillbesteepduringthe2030sandplateausafterNationalPetroleumCorporation,forexample–weInabsoluteterms,China’semissions,shownbelowfrombuildingsstayalmostthesameastoday,but2047.CCSwillbelargestfromprocessemissionsfindthatthemaintargetofpeakingCO2emissionsinFigure8.7.8,arethebiggestintheworld,attransportemissionshalvethroughto2050,demon-(e-fuelandammoniaproduction),whichreach54before2030ismetunlessweseeahighlevelofaround10.7GtCO2ofenergy-relatedemissionsinstratingthatallsectorswillreduceCO2emissionsatMtCO2/yrin2040,andfrommanufacturing(ironChineseAFOLUemissions,whichisunlikely.The2022,anewrecordhigh.Thesectorthatreducesitsaboutthesamepace.andsteel),wherecaptureincreasesto14MtCO2/forecastCO2emissionspeak(energy-relatedandnon-energyprocessemissions)isin2026.RegardingtheChinesetargettoreducecarbonintensity(perunitofGDP)by65%from2005levelsby2030,ourOutlooksuggestsareductionof59%bythen,indicatingthatthistargetwillbemissed.China’shigh-levelgoalofcarbonneutralityby2060cannotbereadfromourforecast,whichstopsin2050.Energy-relatedCO2emissionsafterCCS(andnetofDAC)areexpectedtohavedecreased63%comparedwith2022levels,with3.9GtCO2/yrremainingin2050.Thedirectionin2050isclear,butthepresenttrajectorymakesitunlikelythatfullcarbonneutralitywillbeachievedby2060,unlessChinachangescoursetodecarbonize,andspecificallyde-coal,itseconomyevenmorerapidly.174CONTENTSDEMANDELECTRICITYRENEWABLESFOSSILFUELSFINANCEPOLICYEMISSIONSREGIONSAPPENDIXDNVEnergyTransitionOutlook20238.8INDIANSUBCONTINENT(IND)PopulationGDP(USDTrillion)Energyuse(EJ)Energy-relatedCO2emissions(GT)(Billion)GDP/person(USD)Energyuse/person(GJ)Energy-relatedCO2emissions/ThisregionconsistsofIndia,Pakistan,Afghanistan,person(Tonnes)Bangladesh,SriLanka,Nepal,Bhutan,andtheMaldives15.4513.020221.888000261.620502.3248.91013.921000431.7AllGDPfiguresinthereportarebasedon2017purchasingpowerparityandin2022internationalUSD175CONTENTSDEMANDELECTRICITYRENEWABLESFOSSILFUELSFINANCEPOLICYEMISSIONSREGIONSAPPENDIXDNVEnergyTransitionOutlook20238.8INDIANSUBCONTINENT(IND)CharacteristicsandcurrentpositionPakistan’scurrenteconomiccrisisistiedtofossil-fuelPointerstothefuture—Transportelectrificationtargets(2030)fornewimports,accountingfor40%ofitsprimaryenergyvehiclesalesare:30%forpassenger,70%forIn2023,IndiasurpassedChinaastheworld’smostsupply.Thegovernmenthasbacktrackedonits—Regionalemissionreductionambitionsaredependentpublic/commercial,and80%fortwo-andthree-populouscountry.PakistanandBangladeshrank5th2020moratoriumonbuildingcoalgeneration,andoninternationalfinanceandtechnologicalassistance.wheelers,withFAMEIIschemepurchaseandand8th,respectively.Akeychallengeinthisregionannouncedaquadruplingofpowerplantsfuelledinfrastructuresupport.Ablendingtargetaimsforistoachievehigherlevelsofhumanandeconomicwithdomesticcoal(Dunneetal.,2023).—Indiaisextendingdecarbonizationpolicies20%bioethanolby2025.developmentwhilecontrollingGHGemissions.beyondthepowersectorbutnet-zero2070India’sG20presidency(2023)focusesonbeingaInBangladeshnaturalgasis84%ofthepowermixsectoralstrategiesarescarce.TheAmendment—India’swindmanufacturingcapacity(greatervoiceoftheGlobalSouthtocatalysegreaterclimatewithLNGimportsincreasing.NuclearplantsareoftheEnergyConservationBill(2022)advancesthan10GW/yr)willseeincreasedutilizationgivenfinancing.underconstruction(WNA,2023).efficiencyanddecarbonizationmeasures,alsogovernmenttendervolumes.Solarmanufacturingpreparingforadomesticcarboncreditmarket.willexpandwithProductionLinkedIncentive(PLI)India’sshareoffossilfuelsingenerationcapacityisTheregionishitbysevereclimatechangeinten-support.Nationalstrategydevelopmenttosecure57%(49%coal,with41%fromrenewablesincludingsifiedimpacts,suchasscorchingtemperaturesand—India's2030targetsinclude:50%non-fossilpowercriticalmineralsupplychainswillbeinfocus(CSEP,hydropower,andabout2%nuclear)(Ministryofmassivefloodsfromheavierannualandsummerand500GWrenewablecapacity.Promotion2023).Power,2023).Coalcapacityadditionshavebeenmonsoonprecipitation(IPCC,2021).throughgovernmenttenders/long-termindecline.Renewablesaccountedfor84%ofnewcontracts,andamandateonnewcoalplantsto—Pakistan’sgoalof60%ofenergyfromrenewablepowercapacityin2022.Windcapacityisaround43install/purchaserenewablecapacityof40%oftheirsourcesincludinghydroby2030willdependonGW(March2023)andsolar62GW(November2022).thermalcapacityby2025.multilateralandbilateralpartnerships.Fossilfuelsandimportsdominatetheenergymixes—TheNationalHydrogenMissioncommitsabove—Bangladeshtargetsa40%shareofrenewableofSriLanka,Pakistan,andBangladesh.India’sUSD2bntoH2investment,emphasizingrenewa-electricitybyearly2040s,fromaround3%today.‘NeighbourhoodFirst’policyseekstosupportSribles-basedH2andinitialuseinfertilizerproductionThefirstcontributionfromnuclearpowersuppliesLanka’seconomicrecoveryandrenewableenergy.andrefineries,thensteel.isplannedbythemid-2020s(WNA,2023).176CONTENTSDEMANDELECTRICITYRENEWABLESFOSSILFUELSFINANCEPOLICYEMISSIONSREGIONSAPPENDIXDNVEnergyTransitionOutlook2023Energytransition:climatechangeloomingknownfortourism,isheavilydependentontheimportemissions,helpingtomitigateextremeweatherevents.sloweddownannualcapacityadditions,suggestingaofdieselforelectricityandisfocusingonsolarpowerOurOutlookseesthesubcontinentstilltetheredtophase-downapproach.Weseenosignsofphase-outTheIndianSubcontinentisthemostpopulousofour10generationtomakeelectricitycheaper,reducethecoalandcostlyimportedoilandgasin2050–andofcoal-firedpowerplants;thefuelwillstillberegions,with1.9billonpeoplein2022andheadingforimportbills,andprotectthelocalecosystem.responsiblefor21%ofglobalenergy-relatedemissionsheavilyusedinpowerstationsandmanufacturingin2.3billionby2050.Ithasfast-growingnationalecon-bythen(onaparwithChina).However,weseeagreatmid-century.omies.ItslargeimportsofoilandnaturalgasmakeitThetransitionisespeciallyimportanttotheregiongrowthinsolarandwindpower,andtheadditionofWithintheenergydemandmix(Figure8.8.1)—whichvulnerabletosupplyissuesandpriceshocks.Thesebecauseitisamongthosemostacutelyfeelingmorerenewablecapacitytodayandthroughoutthecountsthedirectuseofcoalinmanufacturing,directlycontributedtothecompletebreakdownoftheadverseeffectsofclimatechange–heatwaves,forecastperiodwillleadtorenewables’shareinitstransport,etc.—coalwillpeakin2031,decliningfromelectricpowerinPakistaninJanuary2023(Dunneetal.,droughts,floods,andtropicalstorms.Pakistanexpe-energymixsignificantlyincreasinglater.15%nowto8%inmid-century.Intheprimaryenergy2023).CoalhashistoricallybeenthedominantenergyriencedseverefloodinginOctober2022,whileIndiasupplymix(Figure8.8.2)—whichincludestheusesource,andrecenthighoilandgaspriceshavepushedwashitwithheatwavesinspring2023.OurforecastTopofthecoalpileofcoaltomakeelectricity—coalpeaksin2035andsomecountriestoconsiderareturntocoalpowerindicates,forexample,thatenergydemandforspaceDespiteallthepledges,thenear-termdevelopmentdeclinesfrom39%nowto20%in2050,thehighesttoensuredomesticenergysecurity,whileothersarecoolingwillskyrocket–aneight-foldincreaseacrosstheoftheenergysectorleavesmuchtobedesired.Wesuchpercentageamongourregions.Overhalf(52%)lookingtosolarandwindtofilltheneed.region.Developingrenewablesolarandwindpowerforeseecoalstillsupplyingmuchoftheenergyandoftheregion’selectricityin2030issourcedfromcanbringdomesticenergysecurityandreduceGHGremaininganimportantsourcein2050.IndiahasHowever,substantialdevelopmentofrenewables177ispossible,withgeographyandclimateespeciallyfavouringsolarpower.India,theregion’slargestcountry,hasenactedclimate-friendlylegislationtopushformoresolarandwindpower,EVs,andgreenhydrogen.PakistanandSriLankahavepledgedthat65%and70%oftheirelectricityrespectivelywillcomefromrenew-ablesincludinghydropowerby2030.Withscarcityofsparelandandalmostnoresourcesforonshorewind,Bangladeshaimstoachieve40%ofrenewableenergyusageby2041andwillrelyonsignificantimportofrenewablepowerfortheenergytransition.NepalandBhutanareself-sufficientinelectricityproductionwithmorethan99%oftotalgenerationfromhydropower.However,botharenowfocusingonutilizingtheuntappedhydropotentialtoplayasignificantroleinfuturerenewableenergysupplyinSouthAsia.TheMaldives,with1,192smallislandsandCONTENTSDEMANDELECTRICITYRENEWABLESFOSSILFUELSFINANCEPOLICYEMISSIONSREGIONSAPPENDIXDNVEnergyTransitionOutlook2023coal-firedplants,butonly18%by2050–withcoalconsumptionwillpeakintheearly2040sat7.272030and2040.Thisshifttowardsrenewablepowerwillcertainlyneedtodevelopsubstantialenergyuseinelectricitygenerationpeakingin2031(FigureMb/d,beforedecliningslightlybymid-century.willbekeyinreducingpowerdeficitsintheregiongenerationcapacityaspopulation,economicgrowth8.8.3).TheIndianSubcontinentwillmeetmostofthisNaturalgasconsumptiondoesnotpeakbefore2050.foritsgrowingpopulationandincreasingenergyandaccesstoelectricityrise,causingannualenergydemandforcoaldomestically,withonly8%importedsecurity.demandtoalmostdoublefrom37EJnowto73EJby2050.Thelimitedriseofrenewablesin2050,whenitwillbethesecondbiggestenergyTheIndianSubcontinentwillmakesomeprogressinThegrowthofrenewableenergywillchangetheconsumeramongour10regions.Today,theIndianSubcontinentlagsonlythetransitioningtorenewableenergy,butlaterthanindynamicsofenergyproductionintheIndianSubGreaterChinaregionincoalconsumption,butmanyotherregions,takingoffonlyinthe2030s.Bothcontinent.WhilethetraditionalproductionofcoalWhilethedemandmixwillremaindominatedthelatter’sconsumptionwillhavedecreasedsolarPVandsolar+storagewillgrowaspricesdrop.willstillremain,newjobswillbecreatedwiththebyfossilfuels—oil,gas,andcoalsupplying48%enoughby2050fortheIndianSubcontinenttoToday,theserenewablessharelessthan5%oftheneedtobuildandinstallwindandsolarpower,andofenergyin2050—withalltheaforementionedassumeaslight(unwanted)lead.Otherfossilfuelselectricitymix(Figure8.8.3),butthiswillriseto15%bynewskillsetswillalsobeneededintheseindustries.renewablecapacityadditions,electricity’ssharewillremainimportantintheIndianSubcontinent2030andalmost37%in2050.Windgeneratedelec-Theregionwillthereforeneedtoalsobuildaqual-doublesfrom16%todayto33%inmid-centuryuptomid-century,mostbeingimported(Figuretricitymorethantriplesfromunder3%todayto13%ifiedworkforcetomeettheseinstallationdemands,(Figure8.8.1).Continueddependenceonfossilfuels8.8.4).Theseimportswillbecostly,andrelianceonin2050.By2040,95%ofnewadditionstothegridwillwhichwillensurethattheIndianSubcontinentcanwillbecostlyanddamagingforenergysecurity,themwillweakentheregion’senergysecurity.Oilbesolarorwind,averaging76GWperyearbetweenmeetitsgrowingdemandforenergy.Theregionleavingtheregionopentosimilarpriceshocksand178CONTENTSDEMANDELECTRICITYRENEWABLESFOSSILFUELSFINANCEPOLICYEMISSIONSREGIONSAPPENDIXDNVEnergyTransitionOutlook2023supplyissuestothoseseentoday.Amongotherof26%electricityand18%coalin2050,withnaturalover20%inmid-centuryasclimatechangeincreaseswillseeamuchslowerandlateruptake,just7%ofenergycarriers,biomasswillmakeupasignificantgasat22%andbiomassat25%.thenumberofcooling-daysperyearandmoreallvehiclesinservicein2030,andonly66%by2050.15%sharewhilegeothermal,hydrogen,andnuclearpeopleaccessairconditioning(Figure8.8.6).Thesevehicleswillalsohavethesmallestaveragewillremainnegligible.Inbuildings,weseetheeffectsofeconomicgrowthElectricitywillbethemainenergycarrier,supplyingbatterycapacity(48kWh)ofallourregions.andenergyefficiencythroughelectrification.overhalfthepowerneededinthebuildingssector.SectorsseeenergychangesCookingisagoodexampleofthis;whilepopulationAsforotherenergycarriers,theregionhassomeIntermsofthedifferentsectors,manufacturingwillrises,energyusedforcookingdeclinesslightlyasIntransport,electricitywillgrowto23%oftheenergyinstallednuclearcapacity,andnuclearhasaplaceaccountfor42%ofenergydemandin2050asthemorepeoplehaveaccesstomoreefficientcookingmix,butoilwillstilldominateatover50%.IndiaitselfinIndian,Pakistani,andBangladeshiplansforaregioncontinuestobeamanufacturingpowerhouse,technology.ThepercentageofhouseswithoutispushingforamarketshareofEVs,especiallyelectricrenewableenergyfuture.By2050,nuclearwillwithmanufacturingenergydemandmorethanaccesstomoderncookingdecreasesdramaticallytwo-andthree-wheelers.Weseethisasachievable,makeupasmall3%ofboththeregion’sprimarydoublingfrom13EJ/yrto31EJ/yr.Theequivalentfrom42%todaytolessthan1%in2050,improvingwithan81%shareofnewsalesoftwo-andthree-energysupplyanditselectricitymix.Forhydrogensharesfortransportandbuildingsin2050willbelivingstandardsandrespiratoryhealth.Conse-wheelersbeingelectricby2030,andalmostall(98%)production,growthcomesmainlyafter2040.23%and22%,respectively(Figure8.8.5).Intermsofquently,theenergyneededforappliancesandin2050.SuchEVswillrepresent37%oftotaltwo-andFeedstockswillbethemainareaofproduction,energysourcesformanufacturing,coalwillbeover-lightingwillmorethandouble.Demandforenergythree-wheelervehiclesinservicein2030,and99%bymakingup86%ofthehydrogenproductionintakenbyelectricityin2043,producinganenergymixforspacecoolingrisesfrom3%ofthemixnowtomid-century(Figure8.8.7).Electricpassengervehicles2050,andmainlybeingblueorgrey.Theother14%,hydrogenasanenergycarrier,willbeover60%greenhydrogenproductionin2050.Overallhydrogenproductionwillincreasefrom8.5Mtin2030to27Mtin2050.However,somecountiesintheregionhavehighambitionsforhydrogencapacitybuild-outsanditispossiblethatwewillseehighercapacitysooner.Energyusepercapitaacrossthesubcontinenthashistoricallybeenamongthelowestintheworldduetovastnumbersofpeoplebeingenergy-deprived.Today’sannualenergyusepercapita(27GJ)willriseto32GJin2030and44GJin2050.Inmid-century,onlySub-SaharanAfricawillhavealowerenergyusepercapita.Theshareofrenewablesinenergyusepercapitawillincreasefromaquarter(25%)in2022to43%in2050(Figure8.8.8),apercentagethatwillbeonaparwithregionssuchasSouthEastAsiaandLatinAmerica.179CONTENTSDEMANDELECTRICITYRENEWABLESFOSSILFUELSFINANCEPOLICYEMISSIONSREGIONSAPPENDIXDNVEnergyTransitionOutlook2023Ourforecastindicatesthatenergydemandotherregions,includingGreaterChinaandNorthFigure8.9.10showsthechangesinfiveintensityalsoincludenon-energy-relatedCO2emissionsinforspacecoolingwillskyrocket—anAmerica.Thiswillchangehowever,astheIndianindicators,indexedto2010:GDPpercapita,carbontheirtargets.Indiaiscommittedtoreducecarboneight-foldincreaseacrosstheregion.Subcontinent’sannualemissionsareexpectedtointensityofenergy,carbonintensityoftheeconomy,intensityofGDPby45%between2005and2030,rise,reaching3.9GtCO2by2030andplateauingcarbonemissionspercapita,andenergyintensity.similartohowChinasetsitsreductiontarget.ThisEmissionsthroughoutthe2040s,reaching3.89GtCO2in2050GDPpercapitaisrisingwhileenergyintensityiscommitmentisnoteasilymeasuredinourforecastToday,theregion’sannualenergy-relatedcarbon(Figure8.8.9)toputitonparwithGreaterChinadecreasing,aresultofenergy-efficiencygainsandsincewepredominantlyfocusonenergy-relatedemissions(2.9GtCO2)aresimilartothatoftheinhavingthemostemissionsofour10regions.risingsharesofthesecondaryandtertiarysectorsinemissions,andbecauseourmodeldoesnotregion-MiddleEastandNorthAfrica.DespitebeingHowever,whiletheIndianSubcontinent’semissionstheeconomy.Thereisaslightriseincarbonemissionalizenon-energy-relatedCO2emissions.Ourresultsthemostpopulousregion,theIndianSubconti-growandplateau,China’semissionswillhavebeenpercapita–duetoinitiallowenergyusepercapitasuggestareductionof35%incarbonintensitybynent’saggregateemissionsremainbehindmanyonthedeclinefromthelate2020s.Thedominantandcontinuedrelianceonfossilfuels–butitpeaksin2030fortheIndianSubcontinent.sourceofemissionsintheIndianSubcontinentis2032.coal(45%in2050)andreflectsthereluctanceoftheIndiaannounceditsnet-zerocarbonemissionstargetregiontoabandonadomesticsourceofenergyandOurprojection(seeSection6.3)fortheregionalby2070atCOP26.OurETOforecastendsin2050,riskbeingoutcompetedbymoreprosperousregionsaveragecarbonpriceisUSD10/tCO2in2030,risingwhentheregionisexpectedtohave3.9GtCO2offorhigh-pricedoilandnaturalgas.toUSD45/tCO2in2050.Thereiscurrentlynoexplicitenergy-relatedemissions(netofDAC).Betweencarbonpricingintheregionandslowadoptionis2022and2050,theregionincreasesitsenergy-expected.India’semissionstradingschemeisnotrelatedCO2emissionsby32%,andhencedoesnotsettinganabsoluteemissionscapandwilltaketimeshowatrendtowardsnet-zerocarbonemissionsintomature.Thelowcarbonpriceexplainslimited2070.deploymentofCCSintheIndianSubcontinent,whichwillnotgrowmuchinthe2030s,takingoffOurOutlookindicatesenergy-relatedCO2onlyinthe2040sandrisingto81MtCO2/yrin2050.emissionsincreasing450%by2030relativeMostoftheseemissionswillbecapturedine-fuelsto1990levels.Between2022and2050,production,with18%fromelectricitygeneration,theregionincreasesitsenergy-relatedCO2whichisimportantascoaluseisstillsignificantinthisemissionsby32%.sectorin2050.180Inthecontextofglobalclimatepolicy,theIndianSubcontinent'scountryNDCpledgesaimtolimitgrowthinemissionstonomorethan320%by2030relativeto1990.OurOutlookindicatesenergy-re-latedCO2emissionsincreasingby450%overthisperiod.Thereareuncertaintiesincomparingourforecastwithpledges,assomemajorcountriesCONTENTSDEMANDELECTRICITYRENEWABLESFOSSILFUELSFINANCEPOLICYEMISSIONSREGIONSAPPENDIXDNVEnergyTransitionOutlook20238.9SOUTHEASTASIA(SEA)PopulationGDP(USDTrillion)Energyuse(EJ)Energy-relatedCO2emissions(GT)(Million)GDP/person(USD)Energyuse/person(GJ)Energy-relatedCO2emissions/ThisregionstretchesfromMyanmartoPapuaNewperson(Tonnes)Guinea,andincludesthePacificOceanStates9.5311.7202268814000452.5205077825.2461.432000591.8AllGDPfiguresinthereportarebasedon2017purchasingpowerparityandin2022internationalUSD181CONTENTSDEMANDELECTRICITYRENEWABLESFOSSILFUELSFINANCEPOLICYEMISSIONSREGIONSAPPENDIXDNVEnergyTransitionOutlook20238.9SOUTHEASTASIA(SEA)CharacteristicsandcurrentpositionASEANcountrieshavebeennetoilimporterssincePointerstothefuture—Policywillsupportrenewablepowerexpansions:before2005.EnergysecurityfocusismountingMalaysiatargeting70%inthepowermixby2050,TheeconomicpowerhousesoftheregionareIndo-withprospectsofincreasingrelianceonfossil-fuel—NineoftenASEANcountrieshavepledgedtoVietnamadvancingcompetitivetenderingproce-nesia,Malaysia,Philippines,Singapore,Thailand,andimportsandwithfuelmarketsbeingvolatileandachievenet-zerotargets–forexample,MalaysiaanddurestoalsoscaleoffshorewindwhiletheregionVietnam.Electricitydemandhasrisenaround6%sensitivetocrises,althoughimportsvaryamongstVietnamby2050,andIndonesiaby2060–butaretrendisfeed-intariffs(e.g.inThailand)coupledannuallyinthepastdecadeandisrisingwithincreas-countries(ACE,2022).atthebeginningofthejourneyintermsofpolicywithannualcapacityquotasandstorage(Chandak,inglyaffluentpopulations.clarity.Coal-to-gasswitchingplanswillneed2022),andSingaporesupportinghydrogenimportsArangeofrenewableresourcesareadvantageousreconsideringgivenhighgasprices.toeventuallysupply50%ofpowerneedsby2050.SouthEastAsia’senergysystemsareskewedtowardstorenewablepowerexpansion.Thereishighsolarfossilfuelswithcoalentrenchedinpowersystems.potentialacrosscountries.Thereisexploitationof—Balancingregulated(low)electricitypricesfor—TheASEANtaxonomyforsustainablefinanceTheregion’scoalfleetisyoung(lessthan15years)hydropowerine.g.Indonesia,LaoPDR,Malaysia,andaffordabilitywhilealsoattractingforeigninvestment(ASEAN,2023)willsteercleaninvestments.andexpanding.VietnamcommitstononewcoalVietnambeingthecountrieswiththemostinstalledforindustrializationwithlow-carboninvestmentsInternationalfundingwillupthepressureoncoalafter2030,andIndonesiatophaseoutcoalby2055.capacity,andCambodiaandMyanmarwithaboveinpowersystemswillbeachallenge(Zhengetal.,phase-downaidedbyconcessionalcapital,suchIndonesiais,afterAustralia,theworld’ssecond50%sharesinelectricitygeneration.ThePhilippines2023).astheEnergyTransitionMechanism(ADB,2023),largestcoalexporter.andIndonesiahaveextensivegeothermalresources.theJETPs,JustEnergyTransitionPartnerships,withVietnamandthePhilippinesaregainingtractionfor—StorageandmodernizationofgridswillbeIndonesia(USD20bn)andVietnam(USD15.5bn),Thefossil-fuelimpactonairqualityisimmenseinoffshorewinddevelopments.neededtoaccommodatetheriseinrenewablesandtheG7PartnershipforGlobalInfrastructuretermsofhazardousairborneparticles(PM2.5)whichandmaintainenergysecurity.TheInterconnectionandInvestment(PGII)mobilizingdecarbonizationonaveragefluctuatebetween19and22μg/m3ASEAN,attheregionallevel,aimsfor23%ofprimaryMasterplanStudyIIIsuggestsupto21.8GWinvestments.(AQLI,2021)whiletheWHOrecommendedlevelisenergysupplyfromrenewablesanda35%shareinextensionoftransmissioncapacity(Utamaetal.,5μg/m3.Theregionisvulnerabletoclimate-relatedthepowermix,by2025.2023)tooptimizecross-borderrenewablerisks,bothphysicalandtransitional(Pongpechetal.,electricitysharingamongotherwiseresource-2023).diversecountries.182CONTENTSDEMANDELECTRICITYRENEWABLESFOSSILFUELSFINANCEPOLICYEMISSIONSREGIONSAPPENDIXDNVEnergyTransitionOutlook2023Energytransition:tryingtobreakfossilgovernmentshadbetonLNGasacost-effectiveBroadlyspeaking,renewablesareeffec-Vietnam'sadoptionofrenewablepolicieslikefeed-independencebridgebetweentheircurrentrelianceoncoalandantivelysatisfyingnewenergydemandgrowthtariffshasplayedapivotalroleinpropellingtheeventualtransitiontorenewables(Fallinetal.,2023).inSouthEastAsia,andarenotdisplacingadoptionofrenewables(solar,wind)andfosteringSouthEastAsiainitiallyappearswellplacedforashiftHowever,volatilityinpricesfromtheconstrictionfossilsourcestoanysignificantdegreebyindustrygrowth(DNV,2021b).Despitechallengestowardsrenewableenergy,yettheactualtransitioninnaturalgassupplyfromNorthEastEurasialeadsmid-century.posedbygridlimitationshinderingvariablerenew-remainsunrealized(Weatherby,2020).Despiteampletoheighteneddemandfortheregion'scoalintheables'integration,investmentsinonshoreandsolarandwindpotential(NREL,2020),theregionfacesimmediatetimeframe.Thisgreaterdemandfostersprominenteconomiesoftheregion,suchasIndo-offshorewindpowerareflourishing.challengesinadvancingrenewableinfrastructure,theattractionandprofitabilityofcoalinvestment,thusnesia,Malaysia,Singapore,Thailand,andVietnam,Finalenergydemandincludinginterconnectorsandtransmissionfromescalatingthepotentialforcoal'sevendeeperinte-havegrappledwithestablishingconsistentandFigure8.9.2illustratesthecompositionoftheremoteareaswithhighsolarirradiationandwindgrationwithintheenergyframework.enduringpoliciestoendorserenewables.However,region'sfinalenergydemandbyenergycarrier.potentialtotheregion’shighlypopulouscities.Theindicationssuggestashiftinglandscape.Forinstance,Electricity's18%shareinfinalenergydemandinabundanceofcoalandnaturalgasresourcesperpet-Primaryenergyconsumption2022doublesto36%by2050.ThisconcurrentuatesarelianceontheseenergysourcesforbothTherelianceoncoalandfossilfuelsisapparentinexpansionalignswithanearfive-foldincreaseinpowergenerationandprimaryenergysupply.Notably,theregion’spatternofprimaryenergyconsumption.electricitygenerationovertheperiod.theregionhasemergedasaprimarycoalexporter,AsdepictedinFigure8.9.1,four-fifths(80%)of400Mtin2022,surpassingNorthEastEurasia's290Mt.primaryenergyconsumptionoriginatesfromfossil183fuels.WhilethisproportionisforecasttodecreaseThecoalsectorconvergeswithmining,processing,toahalf(51%)by2050,itwillstillexceedtheglobalenergy,andsteel,whicharedeeplyingrainedwithinmid-centuryaverageof48%amongallourregions.theregion’seconomies.ApertinentillustrationcomesWithinthe80%fossil-fuelsharein2022,oilaccountsfromIndonesia,thearea'smostpopulousnation,for33%,andcoalandnaturalgas24%and23%,wherecoalphase-outencountersstrongresistance.respectively.Ourforecastindicatescoal'ssharetobeParticularlywithinthiscontext,resourceholderswield10%by2050andareductionto18%inthenaturaldisproportionateswayoverpoliticaldeliberations,gasshare.Moreconcerningistheonlymarginalmakingwithdrawalfromcoalhighlyproblematic.declineofoil'ssignificancefroma30%sharein2022to24%in2050,withmoreorlessflatoilconsumptionConcernednationsandregionsunsettledbySouthoverthatperiod.Broadlyspeaking,renewablesareEastAsia'spersistentcoalutilizationstrategyareeffectivelysatisfyingnewenergydemandgrowthinseekingtostimulateashiftfromsuchdependencybySouthEastAsia,andarenotdisplacingfossilsourcesofferingsubstantialfinancialarrangementstofacil-toanysignificantdegreebymid-century.itatethetransformationofenergyandpowersectorstowardsenvironmentallyfriendlypractices(ListiyoriniSolarandwindsourcesexpandfromtheirpresentetal.,2022).However,thewarinUkrainehascastaminorstakeinprimaryenergyconsumption(lessthanshadowoverthistransitionfromcoal.Manyregional1%combinedin2022)toa22%shareby2050.TheCONTENTSDEMANDELECTRICITYRENEWABLESFOSSILFUELSFINANCEPOLICYEMISSIONSREGIONSAPPENDIXDNVEnergyTransitionOutlook2023RegardingelectricitygenerationwithinSouthEastanimporterofoil,andelevatedoilpriceshaveexertedgrowsfromabout300millionvehiclestomorethanMetropolitanareaswithinSouthEastAsia,includingAsia,adistinctshifttowardarenewablesgridisnotablepressuresonbothconsumersandthewider500millionoverthesameperiod.BangkokandJakarta,grapplewithnumerouschal-evident,asdisplayedinFigure8.9.2.Theshareofeconomy.Whileannualoilproductionstoodataboutlengesduetotrafficcongestionprimarilycausedbyfossilfuelsinthepowermixdwindlesfrom70%in1.7Mb/din2022,consumptionreached4.1Mb/d,SouthEastAsiaalsoboastsasubstantialfleetoftwo-passengervehicles.Theseissuesencompasssignificant2022to15%by2050,atwhichtimeasubstantialresultinginroughly2.4Mb/dofoilbeingimportedintoandthree-wheeledvehiclesalongsideitsfour-wheelers.localairpollution,productivitylossesincurredduringportionisattributedtonaturalgas.Notably,boththeregion,40%ofittoThailandandthePhilippinesThisfleetoftwo-andthree-wheelersisforecasttogrowtrafficdelays,andGHGemissionsduringidling.solarPVandsolar+storagewitnessasignificantcombined.Theseimportswereprimarilysourcedfromby43%from227millionvehiclesin2022to324millionupswingintheircontributionstoelectricitygener-theMiddleEastandNorthAfrica.Oilimportswillpeakby2050.Weestimatethatfewerthan2.5millionoftheWithoutbolderpoliciestopromoteEVation,escalatingmarkedlyfromthelate2030stoaround2045at4Mb/d.AlthoughSouthEastAsiais324millioninmid-centurywillbeinternalcombustionuptake,theregion’spathwaytowardsnetcollectivelyaccountfornearlytwo-thirds(63%)offorecasttoremainanetexporterofnaturalgas,someenginevehicles(ICEVs),implyingthatanimpressivezeroisverydifficulttodiscernthroughthetotalelectricitygenerationby2050.ofitscountriesalsoneedtoimportgasfromabroad,99%willbeelectrictwo-orthree-wheelers.smogofexhaustemissions.remainingsubjecttothevicissitudesofthemarket.Paralleltoelectricity,oilretainsaparamountroleinLikewise,inconjunctionwithrisingGDPpercapita,184fulfillingenergydemandinSouthEastAsia.WhileAwell-executedenergytransitionholdsthepromiseanincreasingnumberofpeoplewilltransitionfromoil'sshareinfinalenergydemanddiminishesfromofshieldingSouthEastAsiafromtherisksasso-two-wheelerstopassengervehicles,primarilyfor43%in2022to28%in2050,absoluteoildemandciatedwithvolatilefossil-fuelpricesandthekindofgreatercomfortandextendedrange.Consequently,increasesfrom9EJtoslightlyabove10EJannuallysupplyshocksassociatedwiththeglobal‘grabforwepredictatriplingofthepassengervehiclefleetfromacrossthesametimespan,withmostofthatoilusedgas’followingRussia’sinvasionofUkraine.Bydiver-58millionin2022to160millionbymid-century.Weintransport.sifyingtheenergymixandstrategicallyintegratingforecastthat,bythen,lessthanhalfthetotalpassengerrenewableslikesolar,wind,andpotentiallyemergingfleetwillbeEVs,withtheremainderbeingICEVs.Intermsofelectricitydemandgrowth,thebuildingstechnologiessuchasadvancedenergystoragesectortakestheleadinSouthEastAsia,accountingsystems,theregioncansignificantlyadvancebothitsEVadoptionwilllagregionssuchasGreaterChina,for2EJ(640TWh)in2022and8.5EJ(2,400TWh)byeconomicstabilityandenvironmentalsustainability.despiteSouthEastAsia'sstatureasanautomotive2050inourforecast.Amongend-usesinthesector,manufacturinghubanditsproximitytoChina.SeveralspacecoolingrequirementsareresponsiblefortheHowthetransportsectorcansupportthetransitionfactorscontributetoSouthEastAsia’ssluggishmostpronouncedsurgeinelectricitydemand.ThetransportsectorisinagreatpositiontoreduceembraceofEVs:higherinitialcostscomparedwithoildependencythroughrapidelectrificationofSouthICEVs,lackofsupportivepolicieslikeEVadoptionExposedtovolatilemarketsEastAsia’spassengervehiclefleet.Weforecastthattargetsandconsumerincentivesatpointofsale,regu-SouthEastAsia`sdependencyonfossilfuels(80%ofmostoftheregion’soildemandinmid-centurywill,latorydelaysanduncertaintiesfromgovernments,primaryenergyin2022)exposestheregiontotheasnow,comefromthetransportationsector,particu-andunderdevelopedrecharginginfrastructure.Noneinherentvolatilityoffossil-fuelprices,asusceptibilitylarlyfromroadtransport(72%)asdepictedinFigureofthesechallengesareinsurmountable,butwithoutfurtherheightenedbyexternalgeopoliticalfactors,such8.9.3.Thetransportsector'sannualoildemandwillbolderpoliciestopromoteEVuptake,theregion’sastheongoingwarinUkrainedisruptingthenaturalgasgrowto8EJintheearly2030s,thendeclinebacktopathwaytowardsnetzeroisverydifficulttodiscernsupply.Sincethemid-1990s,theregionhasremainedits2022valueof7EJwhiletheregion’svehiclefleetthroughthesmogofexhaustemissions.CONTENTSDEMANDELECTRICITYRENEWABLESFOSSILFUELSFINANCEPOLICYEMISSIONSREGIONSAPPENDIXDNVEnergyTransitionOutlook2023RecognizingthatEVsalonewillnotresolvetraffictation.Furthermore,thesupplementaryadvantagesongoingdependenceofthetransportationsectorlevels.Discrepanciesintargetsandforecastsariseduecongestion,urbangovernmentsintheregionhaveofalleviatingroadtrafficcongestion,mitigatingonoil.Whilemanufacturingcurrentlyclaimsthetouncertaintiesconcerningwhethertargetsincludeshiftedtheirfocustomasstransitsystems,particu-airpollution,andpreventingproductivitylosseslargestemissionsshareamongend-usesectors,thenon-energy-relatedCO2emissions.OurOutlookhaslarlywithindenselypopulatedurbanareas.Inthisallcontributetoanincreasedinclinationtowardstransportsectorisprojectedtocatchup,resultingenergy-relatedCO2emissionsincreasingby382%context,theterm'masstransit'encompassesvariousrailtransport,particularlyindenselypopulatedorinnearlyequalkeydemandsectorcontributionsby2030,suggestingthatpledgesfallshort,butareformsofcityandsuburbanrailsystems(FutureremoteareaswithinSouthEastAsia.tototalCO2emissionsby2050(Figure8.9.5).Thisclosetobeingmet.SoutheastAsia,2022).NoteworthyexamplesofcitiesdynamicstemsfromourprojectionsofacceleratedSouthEastAsianationshavesetnet-zeroemissioncurrentlyconstructingmasstransitnetworksincludeInsummary,concertedeffortsarebeingunder-electrificationinmanufacturingincontrasttotargetsaroundmid-century.Laos,Malaysia,andHoChiMinhCityandHanoiinVietnam,Vientianetakentoguidetheregionawayfromitsfossil-fueltransport.Vietnamfor2050,Indonesiafor2060,andThailandinLaos,andtheexpansionofurbanrailtransitindependence.However,theseeffortsnecessitatefor2065haveoutlinedlong-termtargets,thoughBangkok,Thailand.comprehensiveandsustainedpolicysupportInthecontextofglobalclimatepolicy,SouthEastcomprehensivepoliciesareyettobedeveloped.spanningawidespectrumofmeasures.Asia'scountrypledgesinNDCsimplyaregionalgoalEnergy-relatedCO2emissionsareat1.4GtCO2/yrinInourforecast,masstransitisnotconsideredaofrestrainingenergy-relatedCO2emissionincreases2050,18%below2022levels.distinctentity,butisincludedwithinrailtransport.Emissionstonomorethan378%by2030comparedto1990ForSouthEastAsia,weanticipatethattheenergyOuranalysisexpectstheaveragecarbonpricelevel185demandforrailtransportwillclimbfrom26PJ/yrfortheregionwillreachUSD10/tCO2in2030andin2022to44PJ/yrby2050.Notably,weforeseearisetoUSD50/tCO2by2050.Whileexplicitcarbongrowingelectrificationtrendwithinrailtransport,pricingmechanismsarepresentlylimitedwithinthewhichispoisedtoenhanceenergyefficiency.Inregion,severalcountriesareprogressivelytaking2022,onlyhalfoftheenergyutilizedforrailtransportmeasurestointroduceorexpandsuchschemesbywassourcedfromelectricity.By2050,weexpectmid-decade,aselaboratedinSection6.3.Annualalmostalltheenergyforrailtransporttobeelectric.energy-relatedCO2emissionsfromSouthEastAsiaareprojectedtopeakat2Gtaround2030beforeWhilerailtransport'sshareintotalenergydemandrecedingto1.4Gtby2050,equivalenttotheregion'sfromthetransportationsectorremainssteady2016emissions.Notably,emissionsweremeasuredbetween2022and2050inSouthEastAsia,itisat1.6Gtin2020,withareductionofnearly0.2GtcrucialtoemphasizethattheabsolutesurgeinstemmingfromtheCOVID-19-inducedeconomicenergyrequirementsforrailcorrespondstoaslowdownincomparisonto2019.notablygreaterreductioninenergydemandforroadtransport.Railtransportisinherentlylessener-Presently,coalconsumptionconstitutestheforemostgy-intensive,andtheprojected18PJ/yrupswingincontributortoemissions,thoughourforecastunder-railtransportenergybetween2022and2050trans-scoresthatoilemissionswillsurpassthosefromcoallatesintoasubstantiallymorepronounceddeclinein2029andcontinuetodominatethroughto2050inenergydemandforroadpassengertranspor-(Figure8.9.4).ThistrendisprimarilyattributedtotheCONTENTSDEMANDELECTRICITYRENEWABLESFOSSILFUELSFINANCEPOLICYEMISSIONSREGIONSAPPENDIXDNVEnergyTransitionOutlook20238.10OECDPACIFIC(OPA)PopulationGDP(USDTrillion)Energyuse(EJ)Energy-relatedCO2emissions(GT)(Million)GDP/person(USD)Energyuse/person(GJ)Energy-relatedCO2emissions/ThisregionconsistsofAustralia,person(Tonnes)NewZealand,JapanandSouthKorea10.835.222022207520001709.5205018913.825.0.4730001332AllGDPfiguresinthereportarebasedon2017purchasingpowerparityandin2022internationalUSD186CONTENTSDEMANDELECTRICITYRENEWABLESFOSSILFUELSFINANCEPOLICYEMISSIONSREGIONSAPPENDIXDNVEnergyTransitionOutlook20238.10OECDPACIFIC(OPA)CharacteristicsandcurrentpositionJapan’sprimaryenergymixis85%fossil-fuelreliant.Pointerstothefuture—NewZealandpublisheditsemissionsreductionSecuringalternativesuppliersotherthanRussiaisplaninMay2022,settingthedirectionforclimateThematureeconomiesinthisregionhavediverseamainpriority.Mostofitsgeothermalandhydro-—Australia'senergytransitionplansincludeactionforthenext15yearsandestablishingtheenergyuseandresources.TheAustralianFederalpowerpotentialisalreadydeployed.GeographicsubstantialinvestmentintransmissioninfrastructurepolicyforhowitsfirstemissionsbudgetshallGovernment(electedMay2022)committedtoanfactorsconstrainnewrenewablesandgridconnec-tounderpinsystem-widetransformations.Acollab-bemet.Itcomprisesactionacrosstheeconomyemissionsreductiontargetof43%by2030,relativetivity.Itplanstodevelopoffshorewindandanuclearorativeapproach,withstatesandterritories,intheincludingincreasingaccesstoEVs,improvingto2005levels,andisenshriningitsnetzero2050powerreturnwasapprovedinDecember2022newNationalEnergyTransformationPartnershipenergyefficiency,introducingemissionspricingcommitmentintolegislation.NewZealand,Japan,(Reynoldsetal.,2022).providesthebasisforenergymarketreform,devel-foragriculture,measurestoreducewaste,andandSouthKoreadependonenergyimportsandopmentofnet-zerotechnologiessuchasoffshoreestablishingnewforeststoactascarbonsinksashaveallcommittedtonetzeroby2050.RegionNewZealandreliesheavilyonrenewablesforwindandhydrogen,andmanufacturing.Anupdatewellasincreasebiodiversity.countrieshavejoinedtheGlobalMethanePledgeelectricity,particularlyhydropowerandgeothermal,isunderwaytotheNationalHydrogenStrategy,in(AustraliainOctober2022).andtoalesserextentwindandsolar.FossilfuelsstillparttorespondtotheattractiveIRAcreditsinthe—SouthKoreareleaseditsGreenNewDealinJulydominateenergysupplybutthereisacceleratedUS.2020toachieveitsGHGreductiongoals.TheAustraliahasexcellentrenewableenergyresources,interestinhydrogen.AlongstandingETSsystemisingovernmentintendstoincreasehydrogendemandparticularlywindandsolar,nowcontributingto35%place.—Japan’sgovernmenttargets30to40GWoffshoreinthetransportation,electricpower,andindustrialofelectricitygenerationandwithpotentialforfarwindcapacityby2040.TheGreenTransformationsectors,aimingfor30,000commercialFCEVsandmore.GHGemissionsinAustraliaremainhighwithSouthKoreawastheworld’sseventh-largestenergy(GX)BasicPolicyprovidesa10-year,JPY150trn,70hydrogenrefuellingstationsby2030,andforthecountrydeployingitsvastcoalandgasresourcesconsumerin2021anditsenergysystemisdomi-investmentroadmapforeconomy-widedecar-7%ofpowergenerationfromhydrogenby2036tomeetdomesticenergydemandaswellasfornatedbyfossilfuels(over80%),alsoresponsibleforbonization.Targetexamplesinclude:upto38%(Li,2022).The2030renewablepowertarget,export,withrecordvolumesofLNGexportedin66%ofelectricity.Renewablesmakeup7%ofelec-renewablepowerby2030,CCUSvaluechains,previously30%,isnowsetfor22%.2022.tricitygeneration(IEA,2023h).The10thBasicEnergyexpansionofgreensteelsupply,carbon-neutralPlanprioritizesashiftbacktonuclear(Tachev,2023).cement,and100%EVsandFCEVs(passenger)by2035(GRJapan,2023).187CONTENTSDEMANDELECTRICITYRENEWABLESFOSSILFUELSFINANCEPOLICYEMISSIONSREGIONSAPPENDIXDNVEnergyTransitionOutlook2023Energytransition:slowingwhilePowersector(11GW)willbededicatedtoproducehydrogen,TransportspeedingupTheregionwillseesignificantgrowthinrenewableammonia,ande-fuels.Bymid-2020,themajorityTheregionwilltransformitstransportsystemfromenergycapacity.Muchofthiscapacityisutili-ofadditionalcapacityforpowergenerationinthebeingbasedpurelyonoilandgastobeingonlyTheregionwedefineasOECDPacificisdifferentty-scalesolarPV,sometimesincludingstorage,regionisfromrenewableenergyornuclear,as41%fossil-fuelbasedwiththerestrunningonelec-comparedwithotherregionsinthatthecountrieswhichwillmainlybeinstalledinAustralia.RooftopshowninFigure8.10.2.By2050,72%ofon-gridtricity(27%),bioenergy(9%),and23%onhydrogenareallindustrializedbutdonotsharecommonsolarwillfindapplicationsinallcountriesintheelectricityisbasedonrenewableenergyandanditsderivatives(Figure8.10.3).Inaviation,bordersandconnectedgrids.Populationdensity,region,butinAustraliaandNewZealandtheflooranother15%comesfromnuclearpowergeneration.havingtheslowestsubsectortransition,mostofenergyresources,andinfrastructurevarygreatlyareaperhouseholdislargerthaninbothJapanTheregionwillseecontinuousadditionsofnuclearthefuelisstilloil-based(60%)in2050,andtherestfromJapan’snorthtoNewZealand’ssouth.andSouthKorea,whichlimitsrooftopavaila-capacitycomingonlineduringtheforecastperiod,willbebasedonbioenergyande-fuels.Allcoun-Commonalitiesareaccesstoabundantwindbilityforthenorth-easterncountries.Windwillbothexistingnuclearthathasbeentemporarilytriesintheregionhavelengthycoastlinesandareresourcesandplentyofcoastlinetocapitalizeongrowconsiderably,initiallyonshorewithoffshoreshutdownandnewcapacitythatwillbebuilt.dependentonshippingforimportsandexports.Inthegrowingoffshorewindmarket.However,tostartinginthemid-2020s.MuchofthewindNuclearsuppliedtheregion(JapanandSouth2050,themaritimefuelmixwillonlybe16%fossil-complementvariablewindandsolar,Japanandcapacity(167GW)willbeinstalledtosupplytheKorea)with220TWhofnuclearelectricityin2022basedwhereasammoniawilltakecentrestageandSouthKoreawillincreasetheshareofelectricitygrid,butaconsiderableshareofthecapacitywhichwillmorethandoubleto450TWhby2050.represent36%ofallshippingfuel,thoughuptakewillgenerationfromtheuseofnuclear,asaclearmeasureofincreasingtheirenergysecurity.Primaryenergyuseis29%lowerin2050comparedto2022levels,whichisequaltoabouta1.2%declineperyear.Thisdevelopmentpointstowardsaneconomylessdependentonprimaryenergy,butisalsoaneffectofdecliningpopulation.Totalenergyuseisdecliningfromtodaytowards2050,butelectricitybasedprimarilyonrenewableenergyandnuclearisincreasingitssharefrom25%to42%by2050.Thischange,togetherwithotherdecarbonizationeffortsandenergy-systemeffi-ciencies,createsanoticeablechangeinsomekeyparameters.Figure8.10.1showshowtheeconomyisdecouplingrapidlyfromemissionsandenergyuseintheeconomy,whichisacceleratingduetodecliningpopulation.188CONTENTSDEMANDELECTRICITYRENEWABLESFOSSILFUELSFINANCEPOLICYEMISSIONSREGIONSAPPENDIXDNVEnergyTransitionOutlook2023bemostprevalentafter2040.Road,representingHydrogendemandmorethandoublesfromless18958%offinalenergydemandfortransportpurposesthan8Mtin2020to18Mtin2050.Hydrogenin2050,willtransformtohavea40%:60%splitdemandandsupplylargelymatchfortheregionbetweenfossilandnon-fossil.Hereelectricity(39%)withasmallamount(0.6Mt/yr)importedmainlybyandsomehydrogen(18%)willbethemainmeansofpipelinefromGreaterChina,andsomeseabornedecarbonizingroadtransport.transportof1.5Mt.AmmoniaandmethanolwillseegrowthtrajectoriesequivalenttohydrogenandwillHydrogenanditsderivativesrepresentabout15Mtand13Mt/yr,respectively,OECDPacificcountriesareexpectedtobeatthefore-indemandby2050.Mostoftheuseisasanenergyfrontofhydrogenproductionanduseasanenergycarrier.However,productioncapacitywillbelimitedcarrier.HydrogenanditsderivativeswillrepresentandthusOECDPacificwillturntoimportstosatisfy10.4%ofthefinalenergydemandintheregionbygrowingdemand.Forammonia,thiswouldmean102050,thesecondhighestshareafterEurope.Initially,Mt/yrimportedby2050,asseeninFigure8.10.5.itisprimarilyinrefineriesthathydrogenwillplayaroleintheregion.By2050,themanufacturingsector(23%),syntheticfuelproduction(20%),androadtransport(18%)willrepresentthebiggestusersoftotalhydrogendemand.Whilewedonotmodelintrare-gionaltrade,itisfairtoassumemuchofthehydrogenproducedwillbefromdedicatedsolarPV-basedelec-trolysisplantsinAustralia,combinedwithproductionfromgrid-connectedelectricity.Muchofthederiv-ativessuchasammoniaande-fuelswillbetrans-portedtoSouthKoreaandJapanforuseintransport,manufacturing,andbuildings,andinsomeinstancesconvertedbacktohydrogenforelectricitygeneration.EnergyimportsandexportsNaturalgashasbeenandisingreatdemandbytheNorthAsiacountriesJapanandSouthKorea,whilstproductioncomesfromAustralia.Recentcapacityadditionsincreasetheregion'sgasproduction,whichmeansthattheregiongoesfromnetimportertonetexporterin2022(Figure8.10.4).CONTENTSDEMANDELECTRICITYRENEWABLESFOSSILFUELSFINANCEPOLICYEMISSIONSREGIONSAPPENDIXDNVEnergyTransitionOutlook2023Emissionsadoptedbyallcountriesintheregion(seeSection190TheOECDPacificcountrypledgesinNDCsindicate6.3).Theamountofcapturedemissionsfromindus-aregionaltargetofreducingenergy-relatedCO2trialprocessesamountsto71Mt/yror6%ofgloballyemissionsby12%by2030,relativeto1990.OurcapturedCO2emissions.Inaddition,weexpectforecastindicatesthatenergy-relatedCO2emissionsanother20Mt/yrtobecapturedfromtheatmospherewilldecrease16%by2030comparedto1990levels,throughnegativeemissionstechnologies.indicatingthatthetargetsaremet.NewZealandwasfirstintheregiontoenshrineinlawits2050net-zeroDecliningprimaryenergyusecombinedemissiontarget(non-agriculturalactivities)in2019,withdecliningpopulationwillleadtofollowedbyAustraliain2021.SouthKoreaandJapanemissionsfallingcontinuouslyduringthehavepledgedcarbonneutralityby2050.Fortheforecastperiod.region,energy-relatedCO2emissionsareexpectedtobe0.4GtCO2peryear(netofDAC)in2050,80%below2022levels,butstillnotmeetingthenet-zeroemissiontargets,seeFigure8.10.6.Decliningprimaryenergyusecombinedwithdecliningpopulationwillleadtoemissionsfallingcontinuouslyduringtheforecastperiod.Allsectorsreducetheiremissions,butthefastestratewillbefromcoaluseinthepowersectordeclining88%between2022and2050.Mostoftheremainingemis-sionswillbefoundinthemanufacturingsector(36%),thoughtheywilldeclineby62%to2050.Transportisthesecondlargestsourceofemissions(27%),thoughtheyfallbymorethanthree-quarters(78%)by2050.Overall,lookingattheenergycarriers,naturalgaswillrepresent40%oftheemissionsin2050,whileoilis33%andcoalwiththelargestdeclinegoesto25%.Ourprojectionfortheregionalaveragecarbon-pricelevelisUSD40/tCO2in2030andUSD130/tCO2by2050.Carbonpricingwillplayanimportantpartofthepolicymixtoachievenet-zero2050targetsCONTENTSDEMANDELECTRICITYRENEWABLESFOSSILFUELSFINANCEPOLICYEMISSIONSREGIONSAPPENDIXDNVEnergyTransitionOutlook20238.11ENERGY-RELATEDREGIONALEMISSIONSEuropeNorthEastEurasia2022202220503.1Gt20500.5Gt2.4Gt1.7Gt9%2%7%9%Totalenergy-relatedNorthAmericaCO2emissions20222050Shareofworldemissions5.2Gt1.3Gt5.6t0.8t7.6t5.0tEnergy-relatedper16%7%capitaemissionsGreaterChina2022205013.8t3.0t10.7Gt4.0Gt32%22%10worldregions.InthisOutlook,wehavedividedtheworldinto10geographicalregions.7.4t3.0tTheseregionsarechosenbasedongeographicallocation,extentofeconomicdevelopment,andenergycharacteristics.Eachregion’sinputandresultsarethesumofallcountriesinMiddleEast&NorthAfricaOECDPacifictheregion.Weuserelevant,weightedaverages,suchthatcountriesareassignedweights2022205020222050relativetopopulation,energyuse,orotherrelevantparameters.Distinctivecharacteristicsofcertaincountries—forexample,nucleardominanceinFrance—arethusaveragedoverthe2.9Gt2.6Gtentireregion.Inourmodelling,regionsinteractdirectly,throughtradeinenergycarriers,andindirectly,byaffectingandbeinginfluencedbyglobalparameters,suchasthecostof9%14%2.0Gt0.4Gtwindturbines,whichisafunctionofglobalcapacityadditions.PopulationEnergyuseGDPper6%2%(million)percapita(GJ)capita(USD)Region2022205020222050202220505.1t3.3tNorthAmerica(NAM)LatinAmerica(LAM)37341927918474000970009.5t2.0tEurope(EUR)6887441830027900Sub-SaharanAfrica(SSA)54354252525300074000MiddleEast&NorthAfrica(MEA)12002100NorthEastEurasia(NEE)53677012411146009400LatinAmericaSub-SaharanAfricaIndianSubcontinentSouthEastAsiaGreaterChina(CHN)320334230003700020222050202220502022205020222050IndianSubcontinent(IND)1450134024222200032000SouthEastAsia(SEA)188023202280050000OECDPacific(OPA)6887789693210001.5Gt1.1Gt1.0Gt1.3Gt3.0Gt3.9Gt1.7Gt1.4Gt20718980003200014112614000730005%6%520001101093%7%9%22%5%8%264345592.5t1.8t1701332.3t1.5t0.8t0.6t1.6t1.7t191CONTENTSDEMANDELECTRICITYRENEWABLESFOSSILFUELSFINANCEPOLICYEMISSIONSREGIONSAPPENDIXDNVEnergyTransitionOutlook20238.12COMPARISONOFREGIONALENERGYTRANSITIONSEnergyintensityismeasuredasprimaryenergy2050,NorthEastEurasiaremainstheregionwithhighestCarbonintensityismeasuredasgramsofCO2and13%).NorthEastEurasiawillbecomethemostconsumptionperunitofGDP.Allregionsexperienceaenergyintensityin2050.Europecontinuestorequirethepermegajouleofprimaryenergyconsumption.carbon-intensiveenergysystemin2050.Thespreaddeclineinthismeasureduemainlytoefficiencygainsleastamountofenergyperdollarofeconomicactivity,DecarbonizationismostrapidinEurope,OECDbetweentheleadingandlaggingregionremainsassociatedwiththesteadyelectrificationofenergyfollowedbySouthEastAsia,andOECDPacific.By2050,Pacific,andNorthAmericawiththeircarboninten-fairlyconsistentbetween2022and2050atsome30end-use,butalsototheincreasingshareofrenewablesregionaldifferencesare,however,minorasregionalsitiesdecliningby80%,67%,and65%,respectively.gCO2/MJ.inelectricitygeneration,reducinglossestoheat.Despiteenergyintensitiestrendtowards2MJ/USD,withtheNorthEastEurasiaandSub-SaharanAfricahavea40%declineinenergyintensitybetween2022andexceptionofNorthEastEurasia.theleastimprovementincarbonintensity(29%192CONTENTSDEMANDELECTRICITYRENEWABLESFOSSILFUELSFINANCEPOLICYEMISSIONSREGIONSAPPENDIXDNVEnergyTransitionOutlook2023Electrificationismeasuredastheshareofelectricityfinalenergy.In2050,GreaterChinaleadswithRenewablesincludebiomass,solar,wind,geothermal,itwillhavethesecond-lowestrenewablessharebyinthefinalenergydemandmix.Thisshareiselectrificationat44%,followedcloselybyEurope,andhydropower.Becauseofitshighshareoftradi-then.OECDPacificwillseethesecond-largestrelativeincreasingeverywhereandisfastestinSub-SaharanNorthAmericaandOECDPacific.Bythen,Northtionalbiomass,Sub-SaharanAfricaremainstheregionincrease,withitsshareofrenewablesgrowingfrom9%Africa,whereelectrificationwillmorethandouble,EastEurasiaandSub-SaharanAfricalagbehindthewiththehighestshareofrenewables.TheMiddleEastto48%.Mostoftheworldclustersbetween40%andfrom6%in2022to14%in2050.By2035,Greaterrestoftheworldbyalargemargin.andNorthAfricawillseethefastestrelativegrowth60%ofrenewablesinprimaryenergyconsumptionbyChinawillovertakeOECDPacificasthemost-rateinthismeasure,from2%in2022to27%in2050,2050,withonlyNorthEastEurasiaandtheMiddleEastelectrifiedregionwithelectricitymeeting33%ofbutbecausefossilfuelswillstillbedominantin2050,andNorthAfrica,havinglowershares.193CONTENTSDEMANDELECTRICITYRENEWABLESFOSSILFUELSFINANCEPOLICYEMISSIONSREGIONSAPPENDIXDNVEnergyTransitionOutlook2023HighlightsAPPENDIX195195ThisappendixcontainsdetailsonthekeyinputstoA.1Tenregions�196ourmodel,includingpopulation,economicgrowth,A.2Population�197andaconsiderationofresourcelimitations(intermsA.3ProductivityandGDP�200ofbothrawmaterialandlandorseaarearequiredbyA.4Resourcelimitations�thetransitionweforecast).A.5ETOmodel�194Wealsoprovideasummaryoftheworkingsofoursystemdynamics-basedmodelbehindtheforecastgiveninthisOutlookandlistnotablechangestoourmodeloverthelastyear.CONTENTSDEMANDELECTRICITYRENEWABLESFOSSILFUELSFINANCEPOLICYEMISSIONSREGIONSAPPENDIXDNVEnergyTransitionOutlook2023A.1TENREGIONSInafewplaces,wereferto‘OECDregions’;thatA.2POPULATIONfertilityrateisstillatabout4.5birthsperwoman,fallingcomprisesthethreeregionsNorthAmerica,Europe,byabout0.6birthsperwomanperdecade.However,InthisOutlook,wehavedividedtheworldinto10andOECDPacific.Wealsousetheterms‘highAtypicalenergyforecaststartsbyconsideringtheweassumethaturbanizationandimprovededucationgeographicalregions.Theseregionsarechosenincome’,‘mediumincome’and‘lowincome’countriesnumberofpeoplethatneedenergy.levelsamongwomenwill,eventually,alsoacceleratebasedongeographicallocation,extentofeconomicandregions,broadlyinlinewiththedefinitionestab-thedeclineinfertilityratesinAfrica.development,andenergycharacteristics.lishedbytheWorldBank(Prydzetal.,2019).ThesourcemostfrequentlyusedforpopulationdataandprojectionsistheUNDepartmentofEconomicTheWittgensteinCentreusesseveralscenariosEachregion’sinputandresultsarethesumofallDetaileddiscussions,results,andcharacteristicsoftheandSocialAffairs,whichpublishesitsWorldrelatedtotheSharedEconomicPathways(SSPs)countriesintheregion.Whererelevant,weightedregionalenergytransitionsareincludedinChapterPopulationProspects,normallyeveryotheryear.ThedevelopedbytheInter-governmentalPanelonaveragesareused,suchthatcountriesareassigned8ofthisOutlook,presentingregionalanalysesandforecastinthelatestupdate,publishedinJuly2022,ClimateChange,IPCC(vanVuurenetal.,2011).Inweightsrelativetopopulation,energyuse,orotherforecastenergytransitionsforeachofthe10worldrunsto2100.OtherentitiesthatseparatelyproducethisOutlook,wefollowthecentralscenario(SSP2)forrelevantparameters.Distinctivecharacteristicsofregions.populationforecastsincludetheUSCensusBureaupopulationanduseitasasourceofinspirationforcertaincountries—forexample,nucleardominanceinandtheWittgensteinCentreforDemographyandotherforecastinputs.France—arethusaveragedovertheentireregion.NorthAmerica(NAM)GlobalHumanCapitalinAustria,WIC(2023).LatinAmerica(LAM)UsingtheWittgensteinpopulationprojectionsforFIGUREA.1Europe(EUR)TheWittgensteinCentreplacesmoreemphasisthanSSP2,wearriveatour2050populationforecastofSub-SaharanAfrica(SSA)theUNdoesonconsideringhowfutureeducation9.6billion,whichisanincreaseof22%fromthemostMiddleEastandlevels,particularlyamongwomen,willinfluencerecentUN(2022b)populationestimateof7.9billion.NorthAfrica(MEA)fertility.AsnotedbyLutz(2014),urbanizationinNorthEastEurasia(NEE)developingcountrieswillresultinfertilityratesfalling;Our2050figureof9.6billionis1%lowerthantheGreaterChina(CHN)havingmanychildrenisagreatereconomicburdenlatestUNmedianestimateof9.7billion.HadweIndianSubcontinent(IND)andlessofanecessityincitiesthanintraditional,ruralusedtheUNmedianpopulationprojection,mostofSouthEastAsia(SEA)settings.Furthermore,evidenceindicatesthathigherourenergydemandfigureswouldhaveincreasedOECDPacific(OPA)levelsofeducationamongwomenareassociatedwithcommensurately,butwithregionalvariations.Thealowerfertilityrate(Canningetal.,2015).Sustainabledifferencewould,however,havebeenminor.TheDevelopmentGoal(SDG)#4QualityEducationmainuncertaintyliesinthelongterm(2100andandSDG#5GenderEqualityareprovidingfurtherbeyond)forecast,wheremostmainstreamforecasts,impetustoimprovingfemaleeducation.includingtheUN’s,nowindicateapeakinglobalpopulationbefore2100.FertilityislowinboththeOECDandChina,andinnon-OECDregionsitisfallingconsiderably.InSub-195SaharanAfrica,thereductioninfertilityhasbeenslowerthaninotherpartsoftheworld,andthetotalCONTENTSDEMANDELECTRICITYRENEWABLESFOSSILFUELSFINANCEPOLICYEMISSIONSREGIONSAPPENDIXDNVEnergyTransitionOutlook2023A.3PRODUCTIVITYANDGDPwhichwasbasedontheinverserelationshipbetweenwillreduceto1.1%/yrorlowerinthe2030–2050196GDPpercapitalevelanditsgrowthrate,tousingtheperiod.Theforecastbeyond2030doesnotincludeGDPpercapitaisameasureofthestandardoflivinginGDPpercapitagrowthratesimpliedbytheOECDanylargerchangesintherelativepositionsamongtheacountryandisamajordriverofenergyconsumption(2021)andInternationalInstituteforAppliedSystemsproductivityofthedifferentregions.inourmodel.Fromaproductionpointofview,itisalsoAnalysis(IIASA)projections.agoodproxyforlabourproductivity,asitreflectstheWorldGDPisexpectedtogrowfromUSD164trn/yramountofeconomicoutputperperson.Measuredinpurchasingpower-adjustedconstantin2022toUSD317trn/yrin2050.Thisneardoubling(2022)USD,historicalGDPpercapitadevelopmentsoverthe28-yearperiodisaresultofa22%increaseThisyear,wehaveintroducedtwochangesrelatedtofrom1990totoday,alongwithforecastdevelopmentsinpopulationanda60%increaseinaverageGDPourforecastofGDPpercapita.First,weupdatedthetowards2050,canbeseeninFigureA.2.percapita,withlargeregionaldifferences.FigurehistoricalGDPpercapitafrom2011to2017inter-A.3illustratesthecombinedeffectofpopulationnationalpurchasingpowerparitydollars,aspertheWiththeupdates,thegeneraltrendsinproductivitychange(x-axis)andGDPpercapitagrowth(y-axis);thelatestupdateoftheWorldEconomicOutlookbyIMFimprovementsandrelativepositionsamongthedecadalgrowthfiguresareincludedinTableA.1.(2022b).Second,weswitchedfromourownforecast,regionsremainsimilartotheonesinourforecastlastyear.ThefastestgrowthinGDPpercapita,between2022and2030,willstillbeinAsia,butalsoinSub-SaharanAfrica.TheIndianSubcontinentwillhavethehighestgrowthrate,atanaverageof6.0%/yr,followedbySub-SaharanAfricaat4.6%/yr,SouthEastAsiaat4.5%/yrandGreaterChinaat4.6%/yr,asshowninFigureA.2.Astheseeconomiesmature,growthinGDPpercapitawillslowdownafter2030.Theperiodbetween2030–2050willbecharacterizedbyamoreevenspreadofprosperityimprovementsglobally,withhighestgrowthinthelow-incomeregions.TheregionwiththefastestGDPpercapitagrowthwillbetheIndianSubcontinent,withaCAGR2.9%/yr,followedcloselybySub-SaharanAfricaat2.8%/yr.ImprovementsinthestandardoflivingineconomicallydevelopedregionsCONTENTSDEMANDELECTRICITYRENEWABLESFOSSILFUELSFINANCEPOLICYEMISSIONSREGIONSAPPENDIXDNVEnergyTransitionOutlook2023AsTableA.1shows,theworldexperienceda3.2%andOECDPacificwillgrowonaverageatthesameA.4RESOURCELIMITATIONSExpansionofexistingextractiveindustriescombinedcompoundannualGDPgrowthfrom2000to2020.rates.Therestoftheregionswillshowslightlylowerwithagility,technologyandmaterialschoices,andInthe2040s,thiswillgraduallyslowto1.9%/yr,averagegrowthratesbringingtheaverageannualOurforecastdescribestheenergytransitiontowardsgreaterrecyclingandreuseofresourceswillbecombiningtheeffectofslowdowninpopulationglobalGDPgrowthratefrom2.7to2.5%/yr.2050.Duringthecomingthreedecadestherewillbeimportantforensuringthatmajordisruptionsaregrowthwiththeeconomiesofmoreandmoreaprofoundshiftintheaddedcapacityandashiftinavoided.countriesbecomingserviceorientated.Nonetheless,WorldGDPisexpectedtogrowfromdemandforresources.HistoricallytheenergysystemmosteconomiesaroundtheworldwillcontinuetoUSD164trn/yrin2022toUSD317trn/yrhasreliedonfossilsourcessincetheIndustrialOurPathwaytoNetZero(seeseparatereport)isagrow,albeitatvaryingrates,withlikelyexceptionsin2050.Revolution,andisnowheadedforanenergymix‘backcast’designingafuturecompliantwiththeonlyinmatureeconomiesthatareexperiencingwhererenewablestakeaslightly-larger-than50%ParisAgreementandlimitingglobalwarmingto1.5°C.markedpopulationdecline,suchasJapan.Comparedshareby2050.Thepathwayisprescriptiveinthatitdescribesonetolastyear'sforecast,onlyGreaterChinawillgrowitspossiblepathway,andnotonethatisoptimallyeconomyatslightlyhigherrate,whileNorthAmericaThisshiftwillnotonlyimpactthestructureofthedesignedusingmulti-variantselectioncriteria.energysystembuttherewillbelargeshiftsindemandSuccessinimplementingthisorotherpathwaystoTABLEA.12020-20302030-20402040-20502020-2050forsurfaceareaandrawmaterialstosupportthenetzerorequireswar-footingpolicieswhichincludesCompoundannualGDPgrowthratebyregiontransition.Coalmineswillshutter,andnickelandtheextensiveuseoflandandsurfaceareasaswell1.9%1.3%1.3%1.5%lithiumminingboom;insteadofextractingoilandasintensifiedrawmaterialdemandextraction.Land,2000-20202.3%2.1%1.7%2.0%gasfromoffshoreplatformstherewillbesolarpanelssea,andminingpermits,financing,anddistribution1.9%1.0%1.0%1.3%andturbinesharvestingsunandwindresourcesofexistingresourceswouldneedtobemanagedNAMNorthAmerica1.8%4.5%5.0%4.6%4.7%forenergy.throughmultilateralcollaborationthattakesintoLAMLatinAmerica2.0%3.7%3.0%2.5%3.1%accountthecomplexchallengesfacingreachingEUREurope1.2%1.6%1.7%1.1%1.5%Onecentralfeatureofourforecastistheincreasing1.5°C,andwhichwouldhavetobefarmoreeffectiveSSASub-SaharanAfrica4.2%4.3%2.4%1.5%2.7%rateofelectrificationoftheworld’senergysystem.inresolvingresourceaccessandlimitationsthanMEAMiddleEastandNorthAfrica3.5%6.1%4.1%2.9%4.4%Roadtransportwillincreasinglybepoweredbyelec-marketforcesalone.HowsuchascenariocouldNEENorthEastEurasia3.3%4.5%3.2%2.5%3.4%tricityandenergystoredinbatteries.In2050,thereplayoutisthesubjectoffutureresearch.Atpresent,CHNGreaterChina8.0%1.5%0.8%0.6%1.0%willbe1.3billionEVsontheroadandtransitionsonourinvestigationofresourcelimitationshasbeenINDIndianSubcontinent6.1%3.2%2.4%1.9%2.5%thisscalerequiresufficientrawmaterialstobuildtheconfinedtoour‘mostlikely’forecast—themainSEASouthEastAsia4.8%infrastructureandend-usetechnology.Supplyofsubjectofthisreport.OPAOECDPacific1.4%naturalresourcesmustbecapableofexpandingat3.2%ratesthatcansupportdemand,bothsustainablyandLandandseaareastosupportrenewablegrowthWorldcumulatively.AlthoughweexpecttherewillbelocalWeforecasta16-foldincreaseinsolarPVcapacityresourcedemandchallengesandpricevolatilityin(incl.off-grid)by2050,withsufficientlandandthefuture,theoverallpictureisthatthereareenoughrawmaterialsandlandtosupportthetransition.197CONTENTSDEMANDELECTRICITYRENEWABLESFOSSILFUELSFINANCEPOLICYEMISSIONSREGIONSAPPENDIXDNVEnergyTransitionOutlook2023buildingareaasaprerequisitetosupportsuchsufficientwindspeeds,whileavoidingdenselypopu-offshorewindby2050.ThiswouldmeanthatGreaterCoffelandMankin(2021)findthatforeverydegreeexpansion.Inourmodel,solarPVisinstalledatlatedorultra-remotelocations.WiththeselimitationsChina(includingTaiwan)coastalareaswouldutilizeCelsiusofwarmerweather,curtailmentincreasesbyutilityscale,inmicrogrids,ontheroofsofresidentialandusinganestimatedareademandof5MW/km2almost30%ofitscoastlineforinstallingoffshore1percentagepoint.Onpeakdaysina2°Cfuture,orcommercialbuildings,oroff-gridascapacitygivingalmost1kmofspacebetweeneachturbine,wind.Growingconcernsconcerningbiodiversityandtheyfindthatcurtailment(forthisreason)inthermaltoproducehydrogen.Thefirsttwoofthesecate-thenallonshorewindfarmscover1,000,000km2.Thisotherusesoftheoceanwillneedtobemanagedtopowerplantswillincreaseby4.5%.Theycitethatthegoriescombinedwithoff-gridcapacitycompeteequatesgloballytolessthan1%ofavailableland,orsuccessfullyinstallsuchlargeamountsofoffshore2019heatwaveinFranceforced8%ofFrenchpowerwithotherusesofland.InourOutlook,weforecastincomparisonabout2.1%ofagriculturalland.Thewind.Offshoreenergyextraction,fishingaswellastheplantcapacity(mainlynuclear)tobecurtailed.Onthe14%ofallsolartobeinstalledonrooftopsandexpectedcapacityrepresents,atthemostextreme,growingareaofocean-basedfoodfarmingwillneedtocostside,LubegaandStillwell(2019)findthatcoolingcommercialbuildingsglobally.16%oftotalcapacity11.3%ofthetechnicalpotentialinSouthEastAsiaandcollaboratesuccessfully—andexploresynergies—towatercostsaresolowthatusinghigherwatercosts(2.9TW)isfurtherinstalledtosupporthydrogenmuchlowerintherestoftheregions.Thus,itisnotensureenoughareasforallpartiestothrive.asanincentiveforimprovingenergyefficiency(thusproduction.Applyinganestimatedaverage60MW/availabilityoflandthatwillbethelimitingfactor,butautomaticallyimpactingwateruse)willnotwork.km2fornon-rooftopsolar-PVinstallationsindicatesaratherpeoples’collectiveacceptanceofvisual,noise,WaterscarcityandtheenergytransitionWatercostsaresuchasmallfractionoftotalcoststhatrequirementoflessthan1%oftotallandareagloballyandotherenvironmentalimpactsassociatedwithWaterisascarceresourceandwaterstressisaglobaltoimpactplanteconomics,watercostswouldhavetoin2050.Evenforregionswithlargesharesofsolarland-basedwindpower.challenge,experiencedmoreacutelyinsomeregionsbemultiplesofmunicipalwatercostswhichhaslittlePVintheirpowermix,theland-arearequirementisthaninothers.Waterscarcityandstressisexpectedchanceofhappening.notunmanageable.Forexample,1.4%ofagriculturalIncontrast,offshorewindislocatedfarfrompopu-tobeexacerbatedbyclimatechange.AccesstoandlandinGreaterChinaand1.9%inSouthEastAsiawilllationsandprovidesplentifulenergyinourOutlook.additionalcostforwatercanhaveanimpactontheElectrolysisbasedhydrogenproductionin2050beusedforsolarPVinstallationsin2050.Co-useofOuranalysisandmodellingincludebothfixedenergytransition.Aspartofunderstandingtheeffect,representsover70%ofallhydrogenproduced.landforgrazingorforcertaintypesofagricultureisoffshorewindand,inwaterdepthsexceeding50wehaveidentifiedthreeareasoftheenergysystemHowever,whenreviewingthecostsofsuchproduction,alsopossible,andthereforeitseemsunlikelythatthem,floatingoffshorewind.Globally,therewillbewherewaterisofimportance.CoolinginpowerwatercostsarenegligibleincontrasttothecostofexpansionofsolarPVwillencounterland-arealimi-enoughseaareasandcoastlinetoaccommodateplants,electrolysisofwatertoproducehydrogen,andpowerforelectrolysers.Evenwhenwaterisassumedtationsoverall.Wearealsoseeingagrowinginteresttheforecastamountofoffshorewind.Europeandincreaseduseofwateraspartofcarboncaptureandtobeobtainedthroughdesalination,thecostforinanddevelopmentsinvolvingfloatingsolarPVwhichGreaterChinawillaccountfor57%ofglobalinstalledstorage(CCS)implementation.waterwillbearound2%oftotalcost(Blanco,2021).canalleviatepressureonavailableland.offshorewindcapacity.EuropeandtheNorth-SeaInenergyterms,wateruseisabout1%oftotalenergybasinareexpectedtoinstallmostlyfixed(85%)butThermalpowerplantsusewaterforcooling.Currently,consumptionwhenoperatinganelectrolyserplant.Wepredictanine-foldcapacityriseinwindenergy,alsofloatingoffshorewind.GreaterChinawillinstallheatwavescreateadoublechallengeasuseofairandthequestionarisesastowhethertherewillbethelargestamountofoffshorewind.ThemeanwaterconditioningpeakswhenbothambientairandwaterCCSuseswaterinpre-combustion(inpowerplants)sufficientlandandocean-surfacearea.Onshoredepthof44mofftheregion’scoastlineandinthetemperaturemakescoolinglesseffective.Insuchandpost-combustionSteamMethaneReformingwindhasarelativelysmallfootprint,effectivelyjustYellowSeaiswellsuitedforthispurpose,sothere,situations,curtailmentsmayberequiredtoprevent(SMR)processes.Inbothinstances,increasesofwaterthebaseofthetower,sotherewillbenolackofland88%willbebottomfixed.Whenconsideringtheoverheating.Additionally,warmertemperatureusecomparedtothenon-CCScase,anincreasearea.However,thesitingoftall,rotatingstructurestechnicalcapacity,onlyafractionoftheinstallationsleadstodryspellsandlessavailablewater.Suchof100%hasbeenobserved.Thus,inregionswithindenselypopulatedareasisagrowingsocietalwillbefloatingoffshorewind,butGreaterChinaasphenomenawillworseninthefuturewhereairgrowingpowergenerationormanufacturingsectorsconcern.Inouranalysis,wehavereviewedtheoverallwellastheIndianSubcontinentwillinstall31%andconditioningwillbemoreextensiveandcoolingwaterutilizingCCS,adoublingofwaterdemandcouldtechnicalpotentialandonlyincludedareaswith55%respectivelyofthetechnicalpotentialoffixedwillexperienceshortagesandlesscoolingeffect.impactsuchprojects.Forthisreason,futureCCS198CONTENTSDEMANDELECTRICITYRENEWABLESFOSSILFUELSFINANCEPOLICYEMISSIONSREGIONSAPPENDIXDNVEnergyTransitionOutlook2023processesareprojectedtoaddlessthanhalf,typicallynologyused.Yet,sincetheuptakeofCCScoincidesThetransitionwillnotbesignificantlyandperformancevehicles,theyuseacobalt-basedaquarter,ofaCCSprocess’waterconsumption.Yet,withdecreasinguseofcombustedenergy,post-constrainedgloballybytheavailabilityofbatterybutareworkingondevelopingacobalt-loworevenanincreasebyonequarterwillcomeontopofcombustionpowerplantswillnotleadtoincreasedeitherlandorseaarea,water,orrawmaterials.freehigh-performancebattery.increasedwaterconsumptionfromexpandedthermalwaterstressinmostregions.However,intheIndianenergyuseinmanufacturingaswellascombustingSubcontinent,MiddleEastandNorthAfrica,andSouthGrowthinthenumberofEVsandvehiclebatteryInourview,theenergytransitionweforecastwillnotpowerinstallations.Thus,precautionshouldbeEastAsia,wherethermalcombustionwillexpandatthesizeswilldrivea175-foldincreaseinglobalbatterybesignificantlyconstrainedgloballybytheavailabilityobservedinregionswithexpectedgrowthofCCSsametimeasCCSisadded,stressesmighthamperthecapacityby2050.Thiswillspurthedemandforofeitherlandorseaarea,water,orrawmaterials.combinedwithmanufacturingorpowergeneration,roll-outofCCSand/orincreasewatercosts.EspeciallymineralscurrentlyusedinLithium-ionbatteriesNarrowingtheperspective,someregionsmaysuchasinthecaseoftheMiddleEastandNorthinthecontextofapathwaytonetzero,CCSinstallationsunlessnewbatterychemistriesaredeveloped.ThestruggletofindrawmaterialsandsomelandandseaAfricaorSouthEastAsia.andelectrolysercapacityaresignificantlyhigher,andforecastgrowthinbatterycapacityisbyfartheareaswillbecontendingwithcompetinguses,whilethuslocationsshouldbeinvestigatedforwateravaila-largestdriverofdemandforminerals.Lithium,nickel,otherswillenjoyanabundance.Historically,suchInconclusion,awarmerfuturewillmakethermalbilitytodayandinthefuture.manganese,andcobaltusedinbatteryanodesandimbalanceswouldbesolvedbyglobalcollaborationpowerplantsmarginallylessfitthantodayaswatercathodesarewhereweexpectthebiggestsupplyandtrade.TheintensifiedfocusonenergysecurityshortagesandincreasedwatertemperatureswillbeDemandforrawmaterialchallenges.Batterymanufacturingcapacityisalsoincludessecurityofsupplyofcriticalresources,moreprevalent.ThecombinedeffectoflessthermalWehaveconsideredtheenergytransition’sfootprintgrowingexponentiallyandthereareseveralinitiativessomanyregionsarereviewingtheirstrategyandpoweroutput,andthemarginalcostcomponentondemandformaterials.Forexample,solarPVtoincreasesupplyforlithiumandnickel,whilefordependenceonotherregionsprovidingtherawprovidedbythermalplants’waterusageleadsustopanelsareexpectedtoconsistmainlyofcrystallinecobaltthesupplychainislessgearedfordemandmaterialsnecessaryforsecuringtheirenergysupplyconcludethatthepowersectorwillnotbesignificantlysiliconcells(DNV,2021a)wherethemaincomponentsurges,andwethereforeidentifycobaltasacriticalortransition.Theeffectwillfurtheraugmentexistingimpactedbywater-relatedchallenges.issilicon,whichisconsideredanabundantmaterialresourcefortheenergytransition.SeeourAppendiximbalancesandcouldaffectcostsintheshortto(USGS,2023)eventhoughtherearesomelimitationsinETO2020(DNV,2020b)foradetailedanalysisofmediumterm.Itwarrantscontinuousmonitoring.Thereisnoreasontomakewaterscarcityantoprocessingfacilitiestoenrichthesilicontoahighcobaltsupplyanddemand.Thepriceofcobalthaseconomicriskforelectrolysis.Ontheotherhand,enoughgradeneededforthephotovoltaicpanels.fluctuated,doublingincostbeforereducingovertheAlso,whenconsideringamoreambitiousenergyjustasforthermalpowerplants,electrolyserlocationNewthin-filmtechnologies,whicharenotyetprev-lastyear(LME,2023).Thereareclearsignsthatautotransitionfocusingonreducingemissionsinlinewithwillneedtotakewateravailabilityintoconsideration:alentbutareshowingpotential,willfurtherreducemanufacturersarediversifyingtheiruseofbatteryaPariscompliant1.5°Cfuture,therewillbeafurthertheremaybelocationswherelowerpowercoststheoveralldemandformaterial.Windturbinesusechemistries:BYD,abigChinesemanufacturer,strainonresourcedemands.Everynationalplancomeattheexpenseofwateravailability.However,commonbuildingmaterials,butthevastamountsoffocusessolelyonLFP(Mining,2021)and95%offorreachingnetzeroshouldincludeaplanfortheeven‘energyislands’willbeabletosolvethisthroughsteelandcementnecessarywillputpressureonthosecommercialvehiclesinChina,andmanyofthoseneedednaturalresourcesandhowtosecuresuchdesalinationofsurroundingsaltwater,asboththehard-to-abatesectorstoreducetheirembeddedexported,useLFPchemistry.Foritsstandard-rangesupply.ManyofthemineralsandmetalsrequiredcostsandtheenergyuseofprovidingsuchwaterwillcarbonfootprintduringproductiontoensurelowModel3vehicle,TeslahasdecidedtouseLFPareinlow-incomecountrieswhichwouldbenefitbedwarfedbypowerconsumptionandnon-waterlifecycleemissionsfromwind.Therecouldbesupply-batterieswithoutcobalt,whilefortheirlong-rangefromclimatefinancesupport,andthuscouldbeaninfrastructurecosts.chainchallengesforrareearthelements,whichareimportantaspectofnegotiationsaroundaccessingabundantbutexpensiveandresource-intensivetosuchresources.WeaimtorevisitthetopicofresourceCCStypicallyincreaseswateruseinapowerplantorextract,especiallyinthecaseofneodymiumusedforavailabilityandunderstandthepossiblelimitationsaanSMRfacilityby25to50%,dependingonthetech-permanentmagnetsintheturbines.net-zerofuturewouldentailinfutureresearch.199CONTENTSDEMANDELECTRICITYRENEWABLESFOSSILFUELSFINANCEPOLICYEMISSIONSREGIONSAPPENDIXDNVEnergyTransitionOutlook2023A.5ETOMODELFIGUREA.4POLICYPOPULATIONOurforecastisbasedontheETOmodel,whichisaGDPPERPERSONSourceofFinalenergyEnergyPrimarycomprehensivesystem-dynamicssimulationmodeldemanddemandtransformationenergysupplythatcapturestheinterrelationshipsbetweensupplyanddemandacrossvariousinterconnectedmodules.TRANSPORTTRANSPORTPOWERGENERATIONSolarInthismodel,eachfacetoftheenergysystem,asMeasuredintonne-RoadElectricityWinddepictedinFigureA.4,isrepresentedbyspecificmiles,passenger-MaritimeDirectheatHydropowermodules,encompassing:kilometres,andAviationNuclearvehiclesRailHYDROGEN—Finalenergydemand,includingbuildings,manu-PipelinesOILREFINERIESBioenergyfacturing,transport,non-energysectors,andothers.BUILDINGSGeothermalSpaceheatingBUILDINGSDIRECTUSE—Energysupply,coveringcoal,gas,andoil&cooling,waterResidentialFOSSILFUELEXTRACTIONproduction.heating,cooking,andCommercialCrudeoilappliances&lightingNaturalgas—Transformationprocesses,suchaspowerMANUFACTURINGCoalgeneration,oilrefineries,hydrogenproduction,MANUFACTURINGManufacturedgoodsandbiomethaneproduction.ProductionBasematerialsoutputmeasuredIronandsteelAdditionally,itincorporatesotherrelevantasManufacturingConstructionandminingdevelopmentslikeeconomicconditions,grids,ValueAddedpipelines,CCS,energymarkets,tradevolumes,NON-ENERGYandemissions.FeedstockENERGYEFFICIENCYThesemodulesinteractbyexchanginginformationonOTHERdemand,costs,tradevolumes,andvariousparameterstoproduceacoherentandcomprehensiveforecast.ENERGYSECTOR’SOWNUSEModellingprocessThemodel'sequationsandparametersdrawuponadiversearrayofsources,includingacademicpapers,externaldatabases,commercialreports,andthecollectiveexpertiseofindividualsbothwithinandbeyondDNV.Examplesofexternaldatabasesthat200CONTENTSDEMANDELECTRICITYRENEWABLESFOSSILFUELSFINANCEPOLICYEMISSIONSREGIONSAPPENDIXDNVEnergyTransitionOutlook2023havebeenutilizedincludetheIEAWorldEnergythattranspireoverthecourseofmonthsorafewdisparitiesbetweencountriesandsub-technologies.OurmodeldoesnotassumeoptimalityorrationalityBalances,IRENACapacity&GenerationDatabase,years,theOutlook'sreliabilitydiminisheswhenConsequently,themodelcanrecognizethatcertainasprerequisites.ItsmethodologyisnotablyinfluencedGlobalDataPowerDatabase,MarklinesAutomotiveexaminingshortertimeperiods.Forinstance,whilecountriesmightmakecapacityadditionsforagivenbybehaviouraleconomics,wheredecision-makingIndustryPortal,RystadUpstreamDatabase,UNwecanconfidentlycomparetheaveragegrowthratetechnology,eveniftheaveragecostforthattechnologycanbepredictedbasedonthespecificcircumstances,ComtradeDatabase,andClarksonsShippingofgasdemandover10-yearintervals,analyzingtheappearstobeprohibitivelyhigh.eventhoughthedecisionsthemselvesmaynotalwaysIntelligenceNetwork.growthrateforaspecificyearinisolationmightnotalignwithutility-maximizingrationality.Forinstance,weyieldmeaningfulinsights.ModellingprinciplesconsiderthefactthatprivatebuyersmayplacegreaterInordertoensurethereliabilityofourforecasting,weWhendesigningtheETOmodel,ourforemostemphasisontheinitialpurchasepriceofavehiclehaveconductednumerousworkshopsanddiscussionsNevertheless,wedeviatefromthisapproachtoobjectivesweretoincorporatethreefundamentalcomparedtocommercialpurchasers.Consequently,involvingDNVindustryexperts.Thiscollaborativeincorporatetheanticipatedshort-termimpacts,ascharacteristicsoftheglobalenergysystem:inter-privatebuyersmayoptforatechnologywithalowerefforthasengagednearly100individualswhohavewellaslong-termeffects,resultingfromeventssuchconnectedness,inertia,andnon-linearity.Theentireupfrontcost,evenifitturnsouttobemoreexpensiveplayedvariousroles,suchasservingasconduitsastheCOVID-19pandemicandRussia'sinvasionenergysupplychain,spanningfromdemandtointermsoftotalownershipcosts.tohistoricaldatasourcesacrossmultipledomains,ofUkraine.Theseeventsareexpectedtoinfluencesupply,constitutesavastandinterconnectedsystem.ensuringthequalityofmodelsectorsandtheirinter-socialbehaviour,economicactivity,andenergyWhathappensinsolarPVtechnologycanimpactOurETOmodelisdeterministicratherthanstochastic.relationships,andprovidingexpertassessmentsofconsumption,necessitatingconsiderationoftheirpowergenerationdemandforcoal,whichsubse-Wehavereliedonhistoricaldataandourbestthefinaloutcomes.effectsacrossbothshortandlongtimeframes.quentlyaffectsshippingvolumesforbulkcarriersandjudgmenttoprovideexpectedvaluesforallinputthedemandforoilinthemaritimesector.Inertiaisanparameters,andeachmodelrunyieldsanexactTimescaleGeographicalscale:inherentfeatureacrossallfacetsoftheenergysystem,outputsincethereisnorandomnessembeddedTheETOmodelcoverstheperiodfrom1980toThespatialresolutionofthemodelislimitedto10whetheritiswithinhouseholdappliancesoroilrefin-withinthemodel.Nevertheless,thereexistmultiple2050.Toassessthemodel'saccuracyinreproducingworldregions.Theseregionsengageindirectinter-eries,anditactsasadeceleratingforceonenergysourcesofuncertaintyintheoutputs,andthemodelhistoricaldevelopmentsandtherebyvalidateouractions,primarilythroughtheexchangeofenergytransitions.Furthermore,manyprocessesexhibitdoesnotprovideconfidencelevelsfortheseuncer-forecasts,wehaveemployedhistoricalsimulationcarriers,whilealsohavingindirectinteractionsbynon-linearbehaviour,whereaunitincreaseinonetainties.Topartiallyaddressthisissue,sensitivitytestsdata.Themodelisacontinuous-timemodel,withinfluencingandbeinginfluencedbyglobalvariables.factordoesnotconsistentlyproducethesameeffecthavebeenconductedtohelpuscomprehendhowyearsasthebasetimeunit.ItisspecificallydesignedAnexampleofthisindirectinteractionistheimpactofonanothervariable.Ourmodelisdesignedtomirrormodelresultschangewhenspecificinputparameterstocapturedynamicsthatoccuronanannualscaleglobalcapacityadditionsonthecostofwindturbines.thesekeycharacteristics.areadjusted.Ourintentionistopresentatransparentorlonger.Dynamicsofshorterduration,suchasAlthoughwedonotcreateexplicitmodelsforindi-modelratherthanablackbox.Thisapproachwithin-yearfluctuationsinoildemand,areindirectlyvidualcountriesorstateswithintheseregions,weWhilenumerousenergymodelsadoptaneconometricfacilitatesdiscussionsabouttheresultsandallowsforrepresentedthroughannualparametersandareaccommodatetheinherentvariabilitybyemployingapproachandassumeequilibriumconditions,ourtheexplorationofalternativeassumptionsorvaluesifnotexplicitlyintegratedintothemodel.Thepower-statisticaldistributionsforthemodelparameters.modeldivergesfromthisapproach.Instead,itsimu-thereisdisagreementwiththechosenones.Whilethemarketmodule,however,standsasanexception,aslatestheconsequencesthatarisefromitsunderlyingexactcalculationsemergingfromacomplexmodelitaddressessupplyanddemandimbalancesonanForinstance,theinvestmentcostassociatedwithgoals,parameters,andinterrelationships.Themodelmaynotbeeasilyverifiedusingasimplecalculator,wehourlybasis.aspecifictypeofpowerstationisrepresentedasexplicitlyrepresentsthetimedelaysinvolvedinaretransparentabouttheparametersusedandtheiraparameterfollowinganormaldistribution.Thisachievingdesiredstates,therebyenablingustoforecastrelationships.Byintentionallydisregardingshort-termfluctuationsstatisticalapproachallowsthemodeltoaccountforboththetrajectoryandpaceofenergytransitions.201CONTENTSDEMANDELECTRICITYRENEWABLESFOSSILFUELSFINANCEPOLICYEMISSIONSREGIONSAPPENDIXDNVEnergyTransitionOutlook2023Continuousimprovement—revisedwindcostandtechnologyparametersEnergydemandFornon-cargovessels,airtravel,railpassengers,and—restructuredcategoriesofmanufacturingend-Weassessenergydemandbyconsideringvariousfreightdemand,werelyonGDPastheprimarydriver.Themodel'sstructureandinputdataareupdatedto:factors,includingpolicyandbehaviouralinfluences.Inthebuildingssector,weestimateenergyrequire-useandelectrificationpotentialTheseeffectscanbeexplicit,likehowincreasedmentsforbothresidentialandcommercialbuildings—offeramorecomprehensiveandpreciseportrayal—detailednewbioenergysectormodelrecyclingaffectsthedemandforplastics,oracrossfiveenduses.Factorssuchasbuildingoftheglobalenergylandscape—improvedmodellingofinter-regionalpowertrade,implicit,suchastheimpactofexpectedelectricityinsulation,climate,andfloorareaplaysignificantrolespricesontheadoptionofelectricheating.Ourindeterminingregionalspaceheatingandcooling—generatenewoutputsthatholdsignificanceforourwithrestrictionsforcertainEuropeanregionsestimationofsectoralenergydemandfollowsademand.Hotwaterdemandisassociatedwithlivingstakeholders—enhancedpowerstationinvestmentlogictoensuretwo-stepprocess:standardsandpopulation,whilecookingenergyneedsareestimatedbasedonhouseholdsizeand—adapttothelatestdevelopmentsintheenergysectorconsistentavailabilityandclearermechanismsFirst,wecalculatetheenergyservicesprovided,suchpopulation.Commercialbuildings'energydemandforenergy,capacity,andflexibilityneedsaspassenger-kilometresintransportation,manufac-iscloselytiedtoGDPfromthetertiarysector,whichThemostsignificantchangestothemodelsinceour—improvedstoragecostformulasthatbetterturingoutputintonnes,ortheheatrequiredforwaterincreaseswithGDPpercapitaandinfluencesfloor2022Outlookare:differentiatebetweenenergystorageandheating.Subsequently,weemployparametersrelatedareaandenergyservicedemand.powercostcomponentstoenergyefficiencyandthedynamicsofenergy—incorporationofthenewpolicylandscape,—morerobustandlessambiguousCCScapacitysourcestopredictthefinalenergydemandbysectorInthemanufacturingsector,wegaugeenergyparticularlythecomprehensiveUSIRApackage,modellingandenergycarrier.RegionaldemandforenergyservicesusingthevalueaddedinUSD,consideringrenewablepowersupport,hydrogensupport,and—improvedcostmodellingfordirectaircaptureservicesisdeterminedusingnon-lineareconometricbasematerials,manufacturedgoods,andCCSsupport—revisedrepresentationofthe'other'sector,models,primarilydrivenbypopulationandGDPperconstructionandminingseparately.Forironandincludingagriculture,fishing,andmilitarycapita.However,wealsointegratevariousothersteelproduction,wemeasureoutputintonnes.The—revisedcarbonpricesenergyuse,reflectingefficiencyimprovementstechnological,economic,social,andenvironmentaltotalvalueaddedinmanufacturingwithineachworld—adjustmentstopowersectorinvestmentcosts,—updatedlogicforbuildinginsulationfactorsasneeded.regionisdrivenbytheGDPofthesecondarysector—newparametersforheatpumps’co-efficientofandisdividedintosubsectorsbasedonhistoricaltakingintoaccountregionalpreferencesfororperformance(COPs)Inthecontextofroadtransport,thenumberofshares.Demandforironandsteelislinkedtoactivitiesagainstspecificenergycarriersduetoenergy—explicitmodellingoffuel-cellvehiclesuptakeinvehiclesneededincreaseswithregionalGDPsuchasbuildingconstruction,vehiclemanufacturing,securityconsiderationsroadsectorgrowth,butthiseffectsaturatesatdifferentlevelsshipbuilding,andoveralleconomicactivity.We—representationoftheeffectofreshoring/onshoring—revisedparametersforautomatedvehicles,EVforeachregion,followinganon-linearpattern.differentiatebetweenprocessandnon-processoncosttrajectoriesuptake,batterysizes,andcharginginfrastructureVehicledemandisadditionallyinfluencedbyfactorsheating,machinesandappliances,ironorereduction,—updatedGDPdatafromtheIMF's2017ICPsurvey,—revisednaturalgastradeformulationsthatmorelikedrivingdistanceandvehiclelifespan,whichandon-sitevehiclesintermsofenergyservices.forupdatedaccuratepurchasingpowerparityaccuratelytakespricedifferentialsintoaccountareimpactedbytheadoptionofautonomousandcalculations—animproved,morerobustformulationforthesharedtransportationsolutions.WeexplicitlymodelOurchoiceofenergycarrierisinformedbylevelized—updatedpopulationandGDPprojections,includinggridsectortheconnectionbetweenmaritimetradeandthecostsinbuildings,manufacturing,andelectricvehicledetaileddataforsecondaryandtertiaryeconomic—updatedhistoricaldata,includingenergypricesproduction/consumptionbalanceofenergyandadoption.Forotherenduses,weprojectenergymixsectorsnon-energycommodities.202CONTENTSDEMANDELECTRICITYRENEWABLESFOSSILFUELSFINANCEPOLICYEMISSIONSREGIONSAPPENDIXDNVEnergyTransitionOutlook2023basedonhistoricaltrends,whichhavebeensubjecttosegmentsandallcomponentsexceptforvariableisdeterminedbycomparingthelevelizedcostofinresponsetoincreaseddemandandisboundedexpertevaluationinourworkshops,withadjustmentsrenewablegenerationandstoragetechnologieshydrogenfromvarioustechnologies.bythegeologicalavailabilityofreserves.Inthecasemadeasnecessary.respondtopricingsignals.ofbrowncoal,weassumethatmostregionsareExtractionoffossilfuelsself-sufficient.EnergycarriersIntermsofinvestmentsinpowerstationsandstorageInaddressingthesupplyofenergyfromprimaryWithinthe12energycarriersweconsiderinourfacilities,weemployaprofitability-drivenalgorithm.sources,ourmodelcentresitsattentionontheTrademodelling,sevenserveasprimaryenergysources.Ourassessmentofthenecessaryadditionalgenerationextractionofoil,naturalgas,andcoal.OurapproachTrade,particularlythemaritimetransportationofTheseprimaryenergysourcescanbeutilizeddirectlycapacityisgroundedintheanticipatedgrowthintodeterminingregionalproductiondynamicsforenergycarriers,representsacriticalelementwithinwithoutundergoinganyconversionortransformationelectricitydemandandtheestimatedretirementsoilandgasiscost-based.Regardingoilsupply,weourmodel.Inthecaseofcrudeoil,thedifferenceprocesses.Theremainingenergycarriersrepresentofexistingcapacity.Thecompositionofcapacitydepictproductioncapacityasagloballycompetitivebetweenaregion'sproductionandtheinputsecondaryformsofenergyderivedfromprimaryadditionsisdeterminedthroughaprobabilisticmodelprocessdrivenbycostconsiderationsacrossregionsrequiredbyitsrefineriesestablisheswhethertheresources.Primaryenergysourcesencompasscoalthatconsiderstheexpectedmarketpricesandtheandamongthreefieldcategories:offshore,onshoreisasurplusavailableforexportoradeficitneces-(includingpeatandderivedfuels),oil,naturalgaslevelizedcostofelectricity.Weexplicitlyconsiderconventional,andunconventional.Giventhattrans-sitatingimports.Theseimportsaretypicallytrans-(coveringmethane,ethane,propane,butane,theimpactofsupportmechanismsforrenewables,portationexpensestypicallyconstituteaminorportedviaseagoingvessels.Inthecontextofnaturalandbiomethane),geothermalenergy,bioenergycarbonpricing,andthecostassociatedwithCCS.fraction(lessthan10%)ofthefinalcrudeoilcost,gas,anyshortfallinfulfillingdemandfromregional(comprisingwood,charcoal,waste,biogases,andweutilizethetotalbreakevenpricesofpotentialproductionisdistributedtoexportingregionsbasedbiofuels),solarthermalenergy(thermalenergyRegardinginvestmentsinenergystorage,thesefieldstoestimatethefuturelocationandtypeofontheirexistingsharesastradingpartnersinthegeneratedbysolarwaterheaters),andoff-gridPVdecisionsareguidedbytheexpectedmarketpricesoilproduction.gastrade,aswellasanticipatedchangesinthecosts(electricitygeneratedbysolarpanelsnotconnectedandthelevelizedcostofstorage,bothofwhichareofimportinggasbetweenthesetradepartners.tothegrid).Secondaryenergysourcesconsistofinformedbyourhourlypowermarketmodule.TheOurapproachtomodellingregionalgasproductionIntra-regionaltradeisdeterminedasaconstantelectricity,directheat(thermalenergyproducedbyroleofdirectheatinouranalysisisdiminishing,andslightlydiffersfromthatofcrudeoil.Initially,wefactorofregionalgasdemand.Similartonaturalpowerstations),ammonia,e-fuels,andhydrogen.weemployastraightforwardextrapolationmethodtoassesstheproportionofgasdemandtobemetgas,whenitcomestocoal,wepresumeaconsistentestimateregionaldirectheatsupplymixes.fromaregion'sownsources,takingproductionandmixandtradingpartnershares.CoalfromexportingEnergytransformationstransportationcostsintoaccount.Subsequently,regionsisimportedbyregionsexperiencingWeplacespecialemphasisonelectricitygeneration.Hydrogencanbesuppliedthroughdifferentmeans,todeterminethedevelopmentofnewgasfieldsdomesticshortfalls.Wehaveconductedacomprehensiveanalysisencom-includingelectrolysisorfromfossilfuels,utilizingwhileconsideringresourcelimitations,weestablishpassingregionalequilibriumprices,supplydynamics,methodssuchasSMRorcoalgasification.Wediffer-competitionamongthreefieldtypesbasedonFurthermore,ourmodelincorporatesthemanufac-anddemandpatternsacrossaspectrumof12entiatebetweenhydrogenproducedviaelectrolysisregionalbreakevenprices.Themodelalsoincorpo-turingsectorasafundamentalreferencepointforpowergenerationtypes,fourstoragetechnologies,usinggridelectricityandhydrogengeneratedbyratesregionalrefinerycapacitiesandcapacitiesforthetradeofnon-energycommodities,encompassing12distinctloadsegments,andpower-to-hydrogenoff-griddedicatedrenewables-basedelectrolysers.gasliquefactionandLNGregasification.rawmaterialsandmanufacturedgoods.conversion.ThisanalysisspanshourlyintervalsoverOurmodelsdynamicallycalculateannualoperatinganentireyear.WhiletheprofilesofloadsegmentshoursandexpectedelectricitypricesforelectrolysisForcoalproduction,wedifferentiatebetweenhard203andvariablerenewablegenerationaredeterministic,withinthehourlypowermarketmodule.Thecoalandbrowncoal.Eachregion'shardcoalsupplytheyexhibitvariationsfromyeartoyear.Specificloadinvestmentmixinhydrogenproductioncapacityisdeterminedbyitsminingcapacity,whichexpandsCONTENTSDEMANDELECTRICITYRENEWABLESFOSSILFUELSFINANCEPOLICYEMISSIONSREGIONSAPPENDIXDNVEnergyTransitionOutlook2023REFERENCESAbuljadayel,F.(2023)‘HowtheGCCcountrieshavefaredontheirArcher,D.etal.(2009)‘AtmosphericLifetimeofFossilFuelCarbonBloomberg(2022b)China’sXisaysclimatetargetscan’tcompromiseCCICED–ChinaCouncilforInternationalCooperationonEnvironmentnet-zerocommitmentssofar’.ArabNews,November6.https://www.Dioxide’.AnnualReviewofEarthandPlanetarySciences,Vol.37.https://energysecurity.January26.https://www.bloomberg.com/news/arti-andDevelopment(2022)ImpressiveProgressinChina’s1+NPolicyarabnews.com/node/2194376/business-economydoi.org/10.1146/annurev.earth.031208.100206cles/2022-01-26/xi-jinping-says-climate-targets-can-t-compromise-ener-Framework.March11.By:DeBoer,D.,Danting,F.https://cciced.eco/gy-security?leadSource=uverify%20wall#xj4y7vzkgclimate-governance/how-is-progress-in-chinas-1n-policy-framework/ACE–ASEANCentreforEnergy(2022)The7thASEANEnergyOutlook.ASEAN(2023)ASEANTaxonomyforSustainableFinanceVersion2.https://aseanenergy.org/the-7th-asean-energy-outlook/https://asean.org/wp-content/uploads/2023/03/ASEAN-Taxonomy-Ver-BNEF–BloombergNewEnergyFinance(2023a)APowerGridLongCCNT–ChinaCarbonNeutralitytracker(2023)CCNTAnnualReportsion-2.pdfEnoughtoReachtheSunIsKeytotheClimateFight.March8.https://2022:ClosingtheemissionsgapthroughsubnationalclimateactionsinACER(2022)ACERpublishesitsFinalAssessmentoftheEUWholesaleabout.bnef.com/China.Beijing.InnovativeGreenDevelopmentProgram.February.ElectricityMarketDesign.April29.SloveniaAiyar,S.,etal.(2023)GeoeconomicFragmentationandtheFutureofblog/a-power-grid-long-enough-to-reach-the-sun-is-key-to-the-climate-https://ccnt.igdp.cn/iGDP-CCNT-Annual-Report-202308-EN.pdfMultilateralism.StaffDiscussionNoteSDN/2023/001.Internationalfight/ADB–AsianDevelopmentBank(2023)UpdateonADB’sEnergyTransi-MonetaryFund,Washington,DC.Cevik,S.,NinomiyaK.(2022)Chasingthesunandcatchingthewind:tionMechanism.April2023.https://www.adb.org/news/features/up-BNEF(2023b)Globallow-carbonenergytechnologyinvestmentsurgesenergytransitionandelectricitypricesinEurope.InternationalMonetarydate-energy-transition-mechanism-april-2023AQLI–AirQualityLifeIndex®(2021)SouthEastAsiaFactSheet.https://past$1trillionforthefirsttime.January26.https://about.bnef.com/blog/FundWorkingpaper.November.https://www.imf.org/-/media/Files/aqli.epic.uchicago.edu/wp-content/uploads/2021/09/SE-Asia-2022.pdfglobal-low-carbon-energy-technology-investment-surges-past-1-trillion-Publications/WP/2022/English/wpiea2022220-print-pdf.ashxAEMO–AustralianEnergyMarketOperator(2022)2022Integratedfor-the-first-time/SystemPlan(ISP).https://aemo.com.au/energy-systems/major-publica-Bell,J.(2023)‘NEOM’sgreenhydrogenplantwillsecureSaudiArabia’sChandak,P.(2022)‘Thailandlaunchesanewfeed-in-tariffschemefortions/integrated-system-plan-isp/2022-integrated-system-plan-ispcleanenergytransition:CEO’.Alarabiyanews.May25.https://english.BNAmericas(2022)Spotlight:Mexico'sUS$48bncleanenergyplanforsolarandstorage’.SolarQuarter.No-vember3.https://solarquarter.alarabiya.net/News/2023/05/25/Saudi-s-green-hydrogen-plant-will-put-Sonora.December20.https://www.bnamericas.com/en/analysis/spot-com/2022/11/03/thailand-launches-a-new-feed-in-tariff-scheme-for-so-AfricanUnion(2022)AfricaSpeakswithUnifiedVoiceasAUExecutiveKingdom-on-global-map-for-clean-energy-CEOlight-mexicos-us48bn-clean-energy-plan-for-sonoralar-solar-and-storage/CouncilAdoptsAfricanCommonPosi-tiononEnergyAccessandJustEnergyTransition.July22.https://au.int/en/pressreleases/20220722/Benny,John(2023)‘SaudiArabiashipslow-carbonammoniatoJapan‘.Buis,Alan(2019)TheAtmosphere:GettingaHandleonCarbonDioxide.ChileMinistryofFinance(2023)GovernmentpresentsFundforUS$africa-speaks-unified-voice-au-executive-council-adopts-african-commonTheNationalNews.April20.https://www.thenationalnews.com/business/https://climate.nasa.gov/news/2915/the-atmosphere-getting-a-han-1,000millionforthedevelopmentofgreenhydrogeninChile.June19.energy/2023/04/20/saudi-arabia-ships-low-carbon-ammonia-to-japan/dle-on-carbon-dioxidehttps://www.hacienda.cl/noticias-y-eventos/noticias/gobierno-presenta-Allen,Karen(2023)‘Communicationblackout:impactofpowergridfondo-por-us-1-000-millones-para-el-desarrollo-del-hidrogenocollapseonICT’.InstituteforSecurityStudies.July17.https://issafrica.Birol,Fatih(2023)‘Peakfossilfueldemandwillhappenthisdecade'.Buljan,A.(2022)‘Ørstedwillnotbidinfirstround3offshorewindauctionorg/iss-today/communication-blackout-impact-of-power-grid-col-FinancialTimes.September11.https://www.ft.com/content/f6155d7b-inTaiwan’.OffshoreWind.September30.https://www.offshorewind.ClimateAnalytics(2022)Renewableenergytransitioninsub-Saharanlapse-on-ict2ef7-4f62-a08a-b640b7e87fcabiz/2022/09/30/orsted-will-not-bid-in-first-round-3-offshore-wind-auc-Africa.November2022.https://climateanalytics.org/media/renewable_tion-in-taiwan/energy_transition_in_sub-saharan_africa.pdfAlMonitor(2022)SaudiArabiasendsblueammoniatoSouthKorea.Black,S.,Parry,I.,Vernon,N.(2023)'FossilfuelsubsidiessurgedtorecordDecember20.https://www.al-monitor.com/originals/2022/12/saudi-ara-$7trillion'.InternationalMonetaryFund.August23.https://www.imf.org/Burkhardt,P.(2023)‘RampantCorruptionatEnergyProviderDragsDownCoffelE.D.,MankinJ.S.(2021)‘Thermalpowergenerationisdisadvan-bia-sends-blue-ammonia-south-koreaen/Blogs/Articles/2023/08/24/fossil-fuel-subsidies-surged-to-record-7-SouthAfrica’.Bloomberg.May8.https://www.bloomberg.com/news/tagedinawarmingworld’.EnvironmentalResearchLetters.16.024043.trillionfeatures/2023-05-08/crime-corruption-are-dragging-down-south-afri-https://doi.org/10.1088/1748-9326/abd4a8Amy,J.etal.(2023)‘SecondnuclearreactorfueledinGeorgiadespiteca-s-energy-giant?embedded-checkout=true#xj4y7vzkgdelaysandbillionsoverbudget’.Fortune.August18.https://fortune.Blanco,Herib(2021)‘Hydrogenproductionin2050:howmuchwaterwillCrownhart,C.(2023)‘Wewerepromisedsmallernuclearreactors.Wherecom/2023/08/18/second-nuclear-reactor-fueled-in-georgia-despite-de-74EJneed?'.EnergyPost.July22.https://energypost.eu/hydrogen-pro-CanningD.etal.(2015)Africa'sdemographictransition:dividendorarethey?’.MITTechnologyReview.February8.https://www.technologyre-lays-and-billions-over-budget/duction-in-2050-how-much-water-will-74ej-need/disaster?AfricaDevelopmentForumseries.WashingtonD.C.,Worldview.com/2023/02/08/1067992/smaller-nuclear-reactors/BankGroupArabNews(2022)Qatartobuildworld’slargest‘blue’ammoniaplant.Bloomberg(2022a)GazpromexportsatlowestthiscenturyoncappedCSEP(2023)AssessingthecriticalityofmaterialsforIndia.https://csep.August31.https://www.arabnews.com/node/2153901/business-economyflowstoEU.December28.https://www.bloomberg.com/news/arti-Cardenas,Mauricio,Rivota,D.(2023)LatinAmerica’senduringnewoilorg/working-paper/critical-minerals-for-india-2023/cles/2022-12-28/gazprom-gas-exports-at-lowest-this-century-on-capped-landscape.CenterofGlobalEnergyPolicyatColumbia,SIPA.Februaryflows-to-eu21.https://www.energypolicy.columbia.edu/latin-americas-endur-DGCA–Directorate-GeneralforClimateAction(2023)UpcomingEUing-new-oil-landscape/HydrogenBankpilotauction:EuropeanCommissionpublishesTerms&204CONTENTSDEMANDELECTRICITYRENEWABLESFOSSILFUELSFINANCEPOLICYEMISSIONSREGIONSAPPENDIXDNVEnergyTransitionOutlook2023Conditions.https://climate.ec.europa.eu/news-your-voice/news/upcom-DNV(2021b)EnergyTransitionOutlook2021.https://www.dnv.com/EnergyFoundationChina(2023)ExpertsanalyzeChina’sexpansioninEuroNews(2022)This1373kmlongunderseacablewillbring'greening-eu-hydrogen-bank-pilot-auction-european-commission-publish-energy-transition-outlook/index.htmlcoalandpowerin2022.https://www.efchina.org/Taskforces-en/energy'fromEgypttoEurope'selectricitygrid.September17.https://es-terms-conditions-2023-08-30_enCoalTransition-en/Activities-en/programupdate-coal-20230531-en?set_www.euronews.com/2022/09/17/this-1373km-long-undersea-cable-will-DNV(2020a)ThePromiseofSeasonalStorage.https://www.dnv.com/language=enbring-green-energy-from-egypt-to-europes-electricity-DG-Energy–DirectorateGeneralforEnergy(2023a)EUreaches90%gaspublications/the-promise-of-seasonal-storage-168761storagetargetaheadofwinter.https://energy.ec.europa.eu/news/Eurelectric(2022)WhyelectricitynetworksarecriticalforEurope'sclimateEUParliament(2022)UrsulavonderLeyenSpeech.https://www.europarl.eu-reaches-90-gas-storage-target-ahead-winter-2023-08-18_enDNV(2020b)EnergyTransitionOutlook.https://www.dnv.com/ener-neutralityhttps://www.eurelectric.org/in-detail/electricity-networks/europa.eu/sedcms/speech/20220606/1654679961183_01_en.docxgy-transition-outlook/index.htmlDG-Energy–DirectorateGeneralforEnergy(2023b)JointStatementbyEC–EuropeanCommission(2023a)Reducingemissionsfromaviation.EVVolumes(2023)GlobalEVsales2022.https://www.ev-volumes.comtheDirector-GeneraloftheInternationalRenewableEnergyAgencyLaDNV(2019)Digitalizationinwindenergy:betterefficiencyanddecisionhttps://climate.ec.europa.eu/eu-action/transport-emis-sions/reduc-CameraandEUCommissionerSimson:‘Thetimeforspeedingupmakingwilldrivegrowth.September26.https://www.dnv.com/news/ing-emissions-aviation_enFallin,D.,Lee,K.,Poling,G.B(2023)CleanEnergyandDecarbonizationinrenewablesisnow’.https://energy.ec.europa.eu/news/joint-statement-di-digitalization-in-wind-energy-better-efficiency-and-decision-mak-SoutheastAsia:Overview,Obstacles,andOpportunities.May1.Centerrector-general-international-renewable-energy-agency-la-cam-ing-will-drive-growth-158164EC(2023b)Factsheet-RevisionoftheEUElectricityMarketDesignforStrategic&InternationalStudies(CSIS)era-and-eu-commissioner-2023-03-30_enhttps://ec.europa.eu/commission/presscorner/detail/en/fs_23_1594DNV(2018)Ispeakenergycomingsoon?https://www.dnv.com/ener-Friedlingstein,P.etal.(2022)’GlobalCarbonBudget2022’.EarthSystemDNV(2023a)Transportintransition–Adeepdiveintofuels,electricityandgy-transition-outlook/index.htmlEC(2023c)Renewablehydrogenproduction:newrulesformallyadopted.ScienceData.Vol.14,Issue11,Novemberhttps://doi.org/10.5194/infrastructure.https://www.dnv.com/energy-transition-outlook/index.htmlhttps://energy.ec.europa.eu/news/renewable-hydrogen-produc-essd-14-4811-2022Dreves,H.etal.(2023)‘Ukrainefightstobuildmoreresilient,renewabletion-new-rules-formally-adopted-2023-06-20_enDNV(2023b)MaritimeForecastto2050–edition2023.https://www.dnv.energysysteminmidstofwar’.NationalRenewableEnergyLaboratory.FutureSoutheastAsia(2022)UrbanRailTransitofSoutheastAsia.https://com/maritime/publications/maritime-forecast-2023/index.htmlJuly27.http://www.nrel.gov/news/features/2023/ukraine-fights-to-build-EC(2019)Regulation(eu)2019/631oftheEuropeanParliamentandoffuturesoutheastasia.com/urban-rail-tranist/a-more-resilient-renewable-energy-system-in-the-midst-of-war.htmltheCouncilof17April2019settingCO2emissionperformancestandardsDNV(2023c)EnergyTransitionNorthAmerica2023.https://www.dnv.fornewpassengercarsandfornewlightcommercialvehicles,andG7(2023)G7Leaders’StatementonUkraine.May19.https://www.com/energy-transition-outlook/index.htmlDubaiFutureFoundation(2022)DubaiFutureForumConcludes,SettingrepealingRegulations(EC)No443/2009and(EU)No510/2011.https://g7hiroshima.go.jp/documents/pdf/230519-01_g7_en.pdfPathwayforaPromisingFuture.October12.https://www.dubaifuture.ae/eur-lex.europa.eu/legal-content/EN/TXT/?uri=celex%3A32019R0631DNV(2023d)Biofuelsinshipping.Whitepaper.https://www.dnv.com/latest-news/dubai-future-forum-concludes-setting-pathway-for-a-promis-Garanovic,A.(2022)‘OceanOasisunveilswaveenergy-drivendesalina-maritime/publications/biofuels-in-shipping-white-paper-download.htmling-future/EC-JRC-PBL–EuropeanCommission,JointResearchCentre&Nether-tionprototype’.OffshoreEnergy.https://www.offshore-energy.biz/landsEnvironmentalAssessmentAgency(PBL)(2021)EmissionsData-ocean-oasis-unveils-wave-energy-driven-desalination-prototype/DNV(2023e)Whenthetablesturnforinvestorsinrenewables.https://Dunne,D.,Chandrasekhar,A.(2023)‘TheCarbonBriefprofile:Pakistan’.baseforGlobalAtmosphericResearch(EDGAR),EmissionsDataandwww.dnv.com/article/when-the-tables-turn-for-investors-in-renewa-CarbonBrief.May26.https://interactive.carbonbrief.org/the-car-Maps.GreenhouseGases.https://edgar.jrc.ec.europa.eu/emissions_GaussAuto(2023)EstablishmentofBahrain'sFirstElectricVehiclebles-240936bon-brief-profile-pakistan/data_and_mapsFactory.February23.http://gauss-auto.com/list_58/379.htmlDNV(2022a)HydrogenForecastto2050.https://www.dnv.com/ener-EEAS–EuropeanUnionExternalAction(2023)ChileanGovernmentandEinride(2023)EinrideandUAEMinistryofEnergyandInfrastructureGCCSI–GlobalCCSInstitute(2022)GlobalStatusofCCS2022.https://gy-transition-outlook/index.htmltheEuropeanUnionlaunchtwonewcooperationinitiativesonrenewablePartnertoDeployRegion'sLargestAuton-omousandElectricFleet.Maystatus22.globalccsinstitute.com/wp-content/uploads/2022/11/Global-hydrogenworth225millioneuros.June14.https://www.eeas.europa.eu/31.https://www.einride.tech/press/uae-grid-announcementStatus-of-CCS-2022_Download.pdfDNV(2022b)EnergyTransitionOutlook–Aglobalandregionalforecastdelegations/chile/chilean-government-and-european-un-to2050.https://www.dnv.com/energy-transition-outlook/index.htmlion-launch-two-new-cooperation-initiatives_en?s=192ETN(2023)UAE’snationalelectricvehiclespolicytargets50%EVsonGebrekal,T.(2023)‘WhatWorriestheWorld–May2023’.Ipsos.May25.roadby2050.July21.https://etn.news/buzz/uae-national-electric-vehi-https://www.ipsos.com/en/what-worries-world-may-2023DNV(2022c)MaritimeForecastto2050–edition2022.https://www.dnv.ElDahan,M.(2023)‘UAE'srevisedenergystrategyincludesbighydro-cle-policy-revised-ev-charging-stationscom/maritime/publications/maritime-forecast-2023/index.htmlgenplans‘.Reuters.July11.https://www.reuters.com/world/middle-east/GEM–GlobalEnergyMonitor(2023)ARacetotheTop:LatinAmericauaes-revised-energy-strategy-includes-big-hydrogen-plans-2023-07-11Eurostat(2023)Energystatistics–anoverview.DataextractedinMay2023.March.https://globalenergymonitor.org/wp-content/up-DNV(2021a)TechnologyProgressReport.https://www.dnv.com/Publica-2023.https://ec.europa.eu/eurostat/statistics-explained/index.php?ti-loads/2023/03/GEM-LATAM-report_v8.pdftions/technology-progress-report-211013tle=Energy_statistics_-_an_overview205CONTENTSDEMANDELECTRICITYRENEWABLESFOSSILFUELSFINANCEPOLICYEMISSIONSREGIONSAPPENDIXDNVEnergyTransitionOutlook2023GFDC–GreenFinance&DevelopmentCenter(2023)ChinaBeltandHPC–HeatPumpCenter(2023)IEAHPTAnnex58High-TemperatureIEA(2023g)Oilmarketreport.May16.https://www.iea.org/reports/IRENA(2023b)Globallandscapeofrenewablefinance2023.IRENA&RoadInitiative(BRI)investmentreport2023H1.August1.https://greenf-HeatPumps:Task1–Technologies.https://heatpumpingtechnologies.oil-market-report-may-2023ClimatePolicyInitiative.February.https://www.irena.org/Publica-dc.org/china-belt-and-road-initiative-bri-investment-report-2023-h1/#org/annex58/tions/2023/Feb/Global-landscape-of-renewable-energy-finance-2023IEA(2023h)TransitioninKorea.https://www.iea.org/reports/strate-GlobalData(2023)Power-DecodetheFutureofPower.https://www.Hurley,A.,Tate,R.D(2023)‘Coal-projectfinancingoutsideofChinahitsgies-for-coal-transition-in-koreaIRENA(2023c)IRENAandAUDA-NEPADJoinForcestoAdvanceRegion-globaldata.com/industries-we-cover/power/12-yearlow’.CarbonBrief.July10.https://www.carbonbrief.org/guest-alInterconnectionsinAfrica.September4.https://www.irena.org/News/post-coal-project-financing-outside-of-china-hits-12-year-lowIEA(2022)SolarPVGlobalSupplyChains.https://www.iea.org/reports/pressreleases/2023/Sep/IRENA-and-AUDA-NEPAD-Join-Forces-to-Ad-GlobalMethanePledge(2021)https://www.globalmethanepledge.org/solar-pv-global-supply-chainsvance-Regional-Interconnections-in-AfricaHydrom(2023)HydromsignsthreeagreementsawardingthefirstgreenGoldberg,N.R.(2023)‘HowtheMiddleEastispreparingforthepost-oil,hydrogenprojectsinOman.June1.https://hydrom.om/Media.aspx-IEA(2020)Outlookforbiogasandbiomethane:ProspectsfororganicIRENA(2022)RenewableEnergyMarketAnalysis:AfricaanditsRegions.EVeraoftransportation’.CNBC,July20.https://www.cnbc.?cms=iQRpheuphYtJ6pyXUGiNqgTGcqYTp6hSgrowth.https://www.iea.org/reports/outlook-for-biogas-and-biometh-https://www.irena.org/publications/2022/Jan/Renewable-Energy-Mar-com/2023/07/20/how-the-mideast-is-preparing-for-post-oil-ev-era-of-ane-prospects-for-organic-growth.ket-Analysis-Africatransportation.htmlICCT–InternationalCouncilonCleanTransportation(2018)Effectsofbatterymanufacturingonelectricvehiclelife-cyclegreenhousegasInfluenceMap(2022)BigOil'sRealAgendaonClimateChange2022.IRENA(2020)InnovationOutlook:OceanEnergyTechnologies.©Interna-Gordon,Oliver(2023)‘Howtoreformmultilateraldevelopmentbankstoemissions.BriefingDocument.https://theicct.org/wp-content/up-September.https://influencemap.org/report/Big-Oil-s-Agenda-on-Cli-tionalRenewableEnergyAgency,AbuDhabi.takeonclimatechange’.EnergyMonitor.April10.https://www.energy-loads/2021/06/EV-life-cycle-GHG_ICCT-Briefing_09022018_vF.pdfmate-Change-2022-19585monitor.ai/finance/sustainable-finance/how-to-reform-multilateral-devel-IRENA(2019)Innovationlandscapebrief:Flexibilityinconventionalopment-banks-to-take-on-climate-change/IEA–InternationalEnergyAgency(2023a)AVisionforCleanCookingforIMF–InternationalMonetaryFund(2022a)GlobalFinancialStabilitypowerplants.©InternationalRenewableEnergyAgency.AbuDhabi.all.IncollaborationwithWorldEnergyOutlookSpecialReport.www.iea.Report.October.https://www.imf.org/en/Publications/GFSR/Is-GRJapan(2023)OverviewofJapan’sGreenTransformation(GX).January.orgsues/2022/10/11/global-financial-stability-report-october-2022IRENA&AfDB(2022)RenewableEnergyMarketAnalysis:AfricaandItshttps://grjapan.com/sites/default/files/content/articles/files/gr_japan_Regions.©InternationalRenewableEnergyAgencyandAfricanDevelop-overview_of_gx_plans_january_2023.pdfIEA(2023b)EmissionsfromOilandGasOperationsinNetZeroTransi-IMF(2022b)WorldEconomicOutlookInternationalMonetaryFund.mentBank,AbuDhabiandAbidjan.tions,https://www.iea.org/reports/emissions-from-oil-and-gas-opera-October.Washington,DC.Guthridge,Greg(2023)‘Whywaveringconsumerconfidencecouldstalltions-in-net-zero-transitionsIRP–InternationalResourcePanel(2021)BuildingBiodiversity:Thetheenergytransition’.EYTheCEOImperativeseries.April24.https://IMF(2019)Sub-SaharanAfricaRegionalEconomicOutlook:RecoveryNaturalResourceManagementApproach.By:Potočnik,J.,Teixeira,I.Anwww.ey.com/en_no/power-utilities/why-wavering-consumer-confi-IEA(2023c)Cleanenergyinvestmentisextendingitsleadoverfossilfuels,AmidElevatedUncertainty.https://www.imf.org/en/Publications/REO/opinionpieceoftheInternationalResourcePanelCo-Chairs.dence-could-stall-the-energy-transitionboostedbyenergysecuritystrengths.https://www.iea.org/news/SSA/Issues/2019/04/01/sreo0419clean-energy-investment-is-extending-its-lead-over-fossil-fuels-boost-Jaffe,A.M.etal.(2022)'Greeninnovationofstate-ownedoilandgasGWEC–GlobalWindEnergyCouncil(2023)GlobalWindReport2023.ed-by-energy-security-strengthsIPCC–IntergovernmentalPanelonClimateChange(2023)ClimateenterprisesinBRICScountries:areviewofperformance'.ClimatePolicy.https://gwec.net/globalwindreport2023Change2023SynthesisReport–SummaryforPolicymakers.https://www.Taylor&Francis.IEA(2023d)TrackingDirectAirCapture.July11.https://www.iea.org/ipcc.ch/report/ar6/syr/downloads/report/IPCC_AR6_SYR_SPM.pdfHarfoot,MichaelB.J.etal.(2018)’Presentandfuturebiodiversityrisksenergy-system/carbon-capture-utilisation-and-storage/direct-air-captureJalata,A.(2023)‘AfricaisgettingrenewedattentionfromWashingtonfromfossilfuelexploitation’.ConservationLetters–AjournaloftheIPCC(2021)ClimateChange2021:ThePhysicalScienceBasis.Contribu-–andsomeAfricanstatesarecourtingAfricanAmericans’.TheConversa-SocietyforConservationBiology.Volume11,Issue4,July/August.Wiley.IEA(2023e)Understandingmethaneemissions.https://www.iea.org/tionofWorkingGroupItotheSixthAssessmentReportoftheIntergov-tion.May25.https://theconversation.com/africa-is-getting-renewed-at-reports/global-methane-tracker-2023/understanding-methane-emissionsernmentalPanelonClimateChange.https://www.ipcc.ch/report/ar6/tention-from-washington-and-some-african-states-are-courting-afri-Hernandezetal.(2023)‘TheNuclearAged’.Reuters.August22.https://wg1/resources/factsheets/can-americans-203882www.reuters.com/graphics/EUROPE-ENERGY/NUCLEARPOWER/IEA(2023f)Oman’shugerenewablehydrogenpotentialcanbringgdvzwweqkpw/multiplebenefitsinitsjourneytonetzeroemissions.June12.https://IPCC(2001)WorkingGroupI:TheScientificBasis.SourcesofGreenhouseJones,F.(2023)‘Argentinianlithiumexportssurge234%in2022’.Miningwww.iea.org/news/oman-s-huge-renewable-hydrogen-potential-can-Gases.https://archive.ipcc.ch/ipccreports/tar/wg1/130.htm#tab41aTechnology.March22.https://www.mining-technology.com/news/Holt,M.(2017)SmallModularNuclearReactors:StatusandIssues.bring-multiple-benefits-in-its-journey-to-net-zero-emissionsargentina-lithium-exports-234/#catfishAugust24.CongressionalResearchServiceIRENA(2023a)Geopoliticsoftheenergytransition:Criticalmaterials.InternationalRenewableEnergyAgency,AbuDhabi.206CONTENTSDEMANDELECTRICITYRENEWABLESFOSSILFUELSFINANCEPOLICYEMISSIONSREGIONSAPPENDIXDNVEnergyTransitionOutlook2023Kardaś,S.(2023)‘Owngoal:HowRussia’sgaswarhasbackfired’.Europe-McKinsey(2022)ThefutureofAfricanoilandgas:PositioningfortheNASAearthobservatory(2023)WorldofChange:GlobalTemperatures.OECD(2022)Fightingclimatechange:internationalattitudestowardanCouncilonForeignRelations.July27.https://ecfr.eu/article/own-goal-energytransition.https://www.mckinsey.com/industries/oil-and-gas/June23.https://earthobservatory.nasa.gov/world-of-change/global-tem-climatepolicies.OECDEconomicsDepartmentWorkingPapersNo.how-russias-gas-war-has-backfiredour-insights/the-future-of-african-oil-and-gas-positioning-for-the-energy-peratures1714.OECDPublishing,ParistransitionKeltie,I.(2022)‘MENA—Thelargestoil&gasholdingregionintheNDRC–NationalDevelopmentandReformCommission(2021)WorkingOECDetal.(2022)LatinAmericanEconomicOutlook2022:Towardsaworld’.OilfieldTechnology.December21.https://www.oilfieldtechnolo-MEE-MinistryofEcologyandEnvironment(2022)China’sPoliciesandGuidanceforCarbonDioxidePeakingandCarbonNeutralityinFullandGreenandJustTransition.OECDPublishing,Parisgy.com/digital-oilfield/21122022/the-latest-developments-in-the-me-Actionsforaddressingclimatechange(2022).November10.https://FaithfulImplementationoftheNewDevelopmentPhilosophy,Octoberna-region/english.mee.gov.cn/Resources/Reports/reports/202211/24.BeijingOECD(2021),"Long-termbaselineprojections,No.109(Edition2021)",P020221110605466439270.pdfOECDEconomicOutlook:StatisticsandProjections(database),https://Kim,S-M.(2023)‘RequirementsthatwillaffectAlgeria’sfuturegreenNEA–NationalEnergyAdministration(2023a)Relevantresponsibledoi.org/10.1787/cbdb49e6-enhydrogenexportstoEurope’.InternationalPtXHub.April11.https://Mercom(2022)Indiatoinvest2.8trillionintransmissionnetworktocomradesfromtheNationalDevelopmentandReformCommissionandptx-hub.org/requirements-that-will-affect-algerias-future-green-hydro-evacuaterenewableenergy.https://www.mercomindia.com/india-in-theNationalEnergyAdministration.August3.BeijingOECD(2019)TaxingEnergyUse2019:UsingTaxesforClimateAction.gen-exports-to-europe/vest-%E2%82%B92-8-trillion-evacuate-renewable-energyOECDPublishing,ParisNEA–NationalEnergyAdministration(2023b)TheNationalEnergyLevy,A.etal.(2023)‘PathwaystosustainableplanningforajustenergyMills,R.(2023)‘ScalingupcarboncaptureintheMenaregion‘.TheAdministrationorganizedthereleaseofthe"BlueBookontheDevelop-OECD(2016)Theeconomicconsequencesofoutdoorairpollution.transitioninLatinAmericaandtheCaribbean:ananalysisofbestpractic-NationalNews.January23.https://www.thenationalnews.com/business/mentofNewPowerSystems”.June2.BeijingOECDPublishing,Parisesinselectedcountries’.NaturalResourcesandDevelopmentseries,No.comment/2023/01/23/scaling-up-carbon-capture-in-the-mena-region/216(LC/TS.2023/4),Santiago,EconomicCommissionforLatinAmericaNEOM(2023)NEOMacceleratesprogresstowardsgreenhydrogenOIES–OxfordInstituteofEnergyStudies(2022)GuidetoChineseandtheCaribbean(ECLAC)Mining(2021)World’sno.2electriccarmakergoesnickel,cobaltfree.future.May2023,https://www.neom.com/en-us/newsroom/neom-accel-climatepolicy2022.https://chineseclimatepolicy.oxfordenergy.org/https://www.mining.com/world-no-2-electric-carmaker-goes-entirely-erates-green-hydrogen-futureLi,T.Y.(2022)‘SouthKoreaOutlinesHydrogenRoadmaptoBoostIndustry’.nickel-cobalt-free/O’Rourke,K.H.,Williamson,J.G.(2000)'Whendidglobalizationbegin?'.ArgusMedia.November10.https://www.argusmedia.com/en/NikkeiAsia(2023)BYDleadschargeasChina'sshareofEVexportsgrowsNationalBureauofEconomicResearch.April.https://www.nber.org/news/2389672-south-korea-outlines-hydrogen-roadmap-to-boost-industryMinistryofPower–GovernmentofIndia(2023)PowerSectorataGlanceeightfold.September3.https://asia.nikkei.com/Business/Automobiles/system/files/working_papers/w7632/w7632.pdfAllIndia.Ason31.5.2023.https://powermin.gov.in/en/content/power-BYD-leads-charge-as-China-s-share-of-EV-exports-grows-eightfoldListiyorini,E.,Dahrul,F.(2022)‘Indonesia’s$600BillionPlantoShutCoalsector-glance-all-indiaOwens,B.(2023)‘CorporateboardsshouldgearupformoreclimatePlantsStrugglesforSupport’.Bloomberg,September16.https://www.NOAAGML(2023)TrendsinAtmosphericCarbonDioxide.https://gml.litigation’.BloombergLaw.February28.https://news.bloomberglaw.com/bloomberg.com/news/articles/2022-09-15/indonesia-s-600-billion-plan-Munday,P.etal.(2022)‘WeatherWarning:AssessingCountries’Vulnera-noaa.gov/ccgg/trends/global.htmlus-law-week/corporate-boards-should-gear-up-for-more-climate-litigationto-curb-coal-struggles-for-support#xj4y7vzkgbilitytoEconomicLossesFromPhysicalClimateRisks’,S&PGlobal.April27.©Standard&Poor'sFinancialServicesLLCNoor,D.(2023)‘BlowtoBidenasoffshorewindauctioninGulfofMexicoOxfordMartinSchool(2022)Decarbonisingtheenergysystemby2050LME(2023)LMECobaltpricegraph.https://www.lme.com/Metals/failstostirinterest‘.TheGuardian.August29.https://www.theguardian.couldsavetrillions.September13.https://www.oxfordmartin.ox.ac.uk/Minor-metals/Cobalt#tabIndex=2MunichRE(2023a)ClimatechangeandLaNiñadrivinglosses:thenaturalcom/us-news/2023/aug/29/us-offshore-wind-lease-sale-gulf-of-mexiconews/decarbonise-energy-to-save-trillions/disasterfiguresfor2022.January10.https://www.munichre.com/en/LubegaW.,StillwellA.(2019)‘Analyzingtheeconomicvalueofthermalcompany/media-relations/media-information-and-corporate-news/Nyarko,K.,Whale,J.,Urmee,T.(2023)‘Driversandchallengesofoff-gridParkes,R.(2023)‘Egypthasan$83bnpipelineofgreenhydrogenpowerplantcoolingwaterconsumption’.WaterResourcesandEconomics,media-information/2023/natural-disaster-figures-2022.htmlrenewableenergy-basedprojectsinWestAfrica:Areview‘.Heliyon.projectsthatcouldproducemillionsoftonnesofgreenammonia’.Vol.27,JulyVol.9(6)June.https://doi.org/10.1016/j.heliyon.2023.e16710Hydrogeninsight.August3.https://www.hydrogeninsight.com/produc-MunichRE(2023b)Earthquakes,thunderstorms,floods:Naturaldisastertion/egypt-has-an-83bn-pipeline-of-green-hydrogen-projects-that-could-Lutz,W.(2014)'APopulationPolicyRationalefortheTwenty-FirstCentury'.figuresforthefirsthalfof2023.July27.https://www.munichre.com/en/NZT–NetZeroTracker(2023)NetZeroStocktake2023.NewClimateInsti-produce-millions-of-tonnes-of-green-ammonia/2-1-1495879PopulationandDevelopmentReview.Vol40(3).Septembercompany/media-relations/media-information-and-corporate-news/tute,OxfordNetZero,EnergyandClimateIntelligenceUnitandData-Drivenmedia-information/2023/natural-disaster-figures-first-half-2023.htmlEnviroLa.https://zerotracker.net/analysis/net-zero-stocktake-2023PIIE–PetersonInstituteforInternationalEconomics(2022)GlobalizationMcKay,D.etal.(2023)‘Exceeding1.5°CglobalwarmingcouldtriggerisinretreatforthefirsttimesincetheSecondWorldWar.https://www.multipleclimatetippingpoints’.Science.Vol.377,No.6611.https://www.Nakhle,C.(2023)‘Oilandgas:Theinvestmentgapdilemma’.GISEnergy.piie.com/research/piie-charts/globalization-retreat-first-time-second-science.org/doi/10.1126/science.abn7950February3.https://www.gisreportsonline.com/r/oil-gas-investment/world-war207CONTENTSDEMANDELECTRICITYRENEWABLESFOSSILFUELSFINANCEPOLICYEMISSIONSREGIONSAPPENDIXDNVEnergyTransitionOutlook2023Pongpech,S.,Volz,U.(2023)SustainableFinanceinSoutheastAsia.SatubaldinaA.(2023)‘KazakhstanPowersAhead,UnleashingPotentialofSupremeCourtofNorway(2021)LicencesforwindpowerdevelopmentUNDESA–UnitedNationsDepartmentofEconomicandSocialAffairsPIERDiscussionPapers197.PueyUngphakornInstituteforEconomicRenewableEnergyUnderCriticalChallenges’.TheAstanaTimes.June2.onFosenruledinvalidastheconstructionviolatesSamireindeerherders'(2023)IndiatoovertakeChinaasworld’smostpopulouscountryinAprilResearchhttp://astanatimes.com/2023/06/kazakhstan-powers-ahead-unleash-righttoenjoytheirownculture.https://www.domstol.no/en/supreme-2023,UnitedNationsprojects.April24ing-potential-of-renewable-energy-under-critical-challenges/court/rulings/2021/supreme-court-civil-cases/hr-2021-1975-s/Pradeep,A.(2022)‘CCUS:Thegamechangers’.Oil&GasMiddleEast.UNDP–UnitedNationsDevelopmentProgramme(2022)ThechallengesAugust17.https://www.oilandgasmiddleeast.com/news/ccus-in-menaSayne,A.(2020)‘TheProofisinthePolitics:FossilFuelInterestsandSYSTEMIQ(2022)ReShapingPlastics:PathwaystoaCircular,ClimateofclimatemitigationinLatinAmericaandtheCaribbean:SomeproposalsDomesticEnergyTransitions’.NaturalResourceGovernanceInstitute.MayNeutralPlasticsSysteminEurope.https://plasticseurope.org/changing-foraction.©UNDP2022.PublishedintheUnitedStatesofAmericaPrydz,E.,Wadhwa,D.(2019)Classifyingcountriesbyincome.WorldBank.21.https://resourcegovernance.org/articles/proof-politics-fossil-fuel-in-plasticsforgood/reshaping-plastics/September9.https://datatopics.worldbank.org/world-development-indi-terests-and-domestic-energy-transitions-0UNEP-FI–UNenvironmentprogramme,financeinitiative(2023)Thecators/stories/the-classification-of-countries-by-income.htmlTachev,Viktor(2023)‘SouthKorea’senergymixandits10thBasicEnergyGlobalBiodiversityFramework–what’snextforfinancialpolicyandSetzer,J.,Higham,C.(2022)GlobalTrendsinClimateChangeLitigation:Plan’.EnergyTrackerAsia.February13.https://energytracker.asia/regulation?February2.,Nature,News,PolicyReed,S.(2023)‘NobiddersinBritishoffshorewindauction’.NewYork2022Snapshot.London:GranthamResearchInstituteonClimateChangesouth-koreas-energy-mix-and-its-10th-basic-energy-plan/Times.September8.https://www.nytimes.com/2023/09/08/business/andtheEnvironmentandCentreforClimateChangeEconomicsandUNEP(2023)TurningofftheTap:Howtheworldcanendplasticpollutionno-bidders-in-british-offshore-wind-auction.htmlPolicy,LondonSchoolofEconomicsandPoliticalScienceTheEconomist(2023a)Thedestructivenewlogicthatthreatensglobaliza-andcreateacirculareconomy.https://www.unep.org/resources/turn-tion.https://www.economist.com/leaders/2023/01/12/the-destruc-ing-off-tap-end-plastic-pollution-create-circular-economyREN21(2023a)Renewables2023GlobalStatusReport.https://www.Sheldonetal.(2023)‘Electricvehiclesubsidies:Timetoaccelerateortive-new-logic-that-threatens-globalisationren21.net/gsr-2023/pumpthebrakes?.EnergyEconomics,Volume120.https://doi.UNEP(2022)AdaptationGapReport2022.https://www.unep.org/org/10.1016/j.eneco.2023.106641TheEconomist(2023b)Whoiskeepingcoalalive?Thefinancierssavingresources/adaptation-gap-report-2022REN21(2023b)Renewables2023GlobalStatusReport–EnergyDemandtheworld’sdirtiestfuelfromextinction.June4.Finance&Economics.Module.https://www.ren21.net/wp-content/uploads/2019/05/GSR2023_Sharples,B.(2023)‘ClimateInactionDrivesHeatWaveinSoutheastAsia,EmberalertUNFCCC–UnitedNationsFrameworkConventiononClimateChangeDemand_Modules.pdfReportSays’.Bloomberg.May17.https://www.bloomberg.com/news/(2023a)WhytheGlobalStocktakeisaCriticalMomentforClimateAction.articles/2023-05-17/climate-inaction-drives-heat-wave-in-southeast-asia-TheRoyalSociety(2020)Ammonia:zero-carbonfertilizer,fuelandenergyhttps://unfccc.int/topics/global-stocktake/about-the-global-stocktake/Reynolds,I.,Umekawa,T.(2022)‘Japanesepanelapprovesreturntoreport-says#xj4y7vzkgstore.PolicyBriefing.February.©TheRoyalSocietywhy-the-global-stocktake-is-a-critical-moment-for-climate-actionnuclearpowerasdisastermemoriesfade’.JapanTimes.December22.https://www.japantimes.co.jp/news/2022/12/22/national/japan-nucle-Smith,I.,Kenza,B.(2023)‘Lloyd’sandfivebiginsurersquitsector’sUN–UnitedNations(2022a)Integritymatters:netzerocommitmentsbyUNFCCC(2023b)Technicaldialogueofthefirstglobalstocktake.Synthe-ar-energy/net-zeroinitiative’.FinancialTimes.May26.https://www.ft.com/con-businesses,financialinstitutions,citiesandregions.Reportfromthesisreportbytheco-facilitatorsonthetechnicaldialogue.September8.tent/4940831b-72ec-459d-aaee-0d86fb7593dfHigh-levelExpertGrouponnetzeroemissioncommitmentsofnon-stateUNFCCC.Secretariat.https://unfccc.int/documents/631600Rockström,J.,Gupta,J.,Qin,D.etal.(2023)'SafeandjustEarthsystementities.boundaries'.Nature619,102–111.https://doi.org/10.1038/s41586-023-Smith,T.(2023)‘ElectrictruckfirststeptowardssustainabletransportinUSGS–U.S.GeologicalSurvey(2023)Mineralcommoditysummaries06083-8Morocco’.ESIAfrica.March20.https://www.esi-africa.com/energy-effi-UN(2022b)WorldPopulationProspects.DepartmentofEconomicand2023.https://pubs.usgs.gov/periodicals/mcs2023/mcs2023.pdfciency/electric-truck-first-step-towards-sustainable-transport-in-morocco/SocialAffairs,PopulationDivision.https://population.un.org/wpp/RoyalAcademyofEngineering(2017)Sustainabilityofliquidbiofuels.Utama,N.A.,Yurnaidi,Z.(2023)'UnearthingthecatalystforASEAN’shttps://raeng.org.uk/media/pk1k5mie/raeng-biofuels-report-1-1.pdfSongwe,V.,etal.(2022)Financeforclimateaction:ScalingupinvestmentUNCC–UnitedNationsClimateChange(2022)2022NDCSynthesisenergytransitionin2023'ASEANCentreforEnergy.January7.https://forclimateanddevelopment.London:GranthamResearchInstituteonReport.https://unfccc.int/ndc-synthesis-report-2022aseanenergy.org/unearthing-the-catalyst-for-aseans-energy-transi-Sabyrbekov,R.,Overland,I.Vakulchuk,R.(2023)ClimateChangeinClimateChangeandtheEnvironment,LondonSchoolofEconomicsandtion-in-2023/CentralAsia:Decarbonization,EnergyTransitionandClimatePolicy.PoliticalScienceUNCTAD–UnitedNationsConferenceonTradeandDevelopmentSpringerSwitzerland(2023)Commoditiesataglance:SpecialissueonaccesstoenergyinvanVuuren,D.etal.(2011)'Therepresentativeconcentrationpathways:Stanway,D.,Cadell,D.(2021)‘PresidentXisaysChinawillstartcuttingsub-SaharanAfrica.No.17.UnitedNationsGenevaanoverview'.ClimaticChange,Vol.109.August.https://link.springer.Sanderson,C.(2023)‘EUchiefvonderLeyenpledgesnewsupportforcoalconsumptionfrom2026’.Reuters.April22.https://www.reuters.com/article/10.1007/s10584-011-0148-zstrugglingwindpowerindustry’.Recharge.September13.https://www.com/world/china/chinas-xi-says-china-will-phase-down-coal-consump-UNECOSOC–UnitedNationsEconomicandSocialCouncil(2023)rechargenews.com/wind/eu-chief-von-der-leyen-pledges-new-support-tion-over-2026-2030-2021-04-22/ProgresstowardstheSustainableDevelopmentGoals:TowardsaRescue208for-struggling-wind-power-industry/2-1-1517552PlanforPeopleandPlanet.MayCONTENTSDEMANDELECTRICITYRENEWABLESFOSSILFUELSFINANCEPOLICYEMISSIONSREGIONSAPPENDIXDNVEnergyTransitionOutlook2023Way,Retal.(2022)‘EmpiricallygroundedtechnologyforecastsandtheWorldBank(2023d)MiniGridsforHalfaBillionPeople:MarketOutlookØrsted(2023)Targetstoday.Turbinestomorrow.Seven-pointplantoDownloadourforecastdataenergytransition’.Joule.Vol.6,Issue9.September21.https://doi.andHandbookforDecisionMakers.https://www.esmap.org/mini_overcomethestormfacingtheoffshorewindindustry.Version1.Septem-org/10.1016/j.joule.2022.08.009grids_for_half_a_billion_people_the_reportber.https://orstedcdn.azureedge.net/-/media/www/docs/corp/com/AlltheforecastdatainDNV’ssuiteofEnergyseven_point_plan_for_offshore_wind.pdf?rev=2797fda4e1c54a3fa-TransitionOutlookreports,andfurtherdetailfromWBCSD–WorldBusinessCouncilforSustainableDevelopment(2022)WorldBank(2022)WorldIntegratedTradeSolution–Sub-Saharan722d31ae46197e5ourmodel,isaccessibleonVeracity—DNV’ssecureIndustrialHeatPumps:It’stimetogoelectric.https://www.wbcsd.org/AfricaTrade.https://wits.worldbank.org/industrydataplatform.Pathways/Energy/Resources/Industrial-Heat-Pumps-it-s-time-to-go-electricHistoricaldatadnv.com/eto-dataWorldBank(2020)MineralsforClimateAction–thematerialintensityofThisworkispartlybasedontheWorldEnergyWeatherby,C.(2020)‘RenewableEnergyinSoutheastAsia’.InPoweringthecleanenergytransition.©2020InternationalBankforReconstruc-BalancesdatabasedevelopedbytheInternationalDesign:MinnesotaAgency.Images:Cover:Gettyimages,p.1,2,6,SoutheastAsia—MeetingtheRegion’sElectricityNeeds.TheNationaltionandDevelopment/TheWorldBank.EnergyAgency©OECD/IEA2023,buttheresulting18,63,72,82,84,135,167,:GettyImages,p.7,11,14,16,23,24,28,BureauofAsianResearch.SpecialReportno.89.workhasbeenpreparedbyDNVanddoesnot36,37,38,40,49,50,55,57,66,71,74,80,81,83,86,100,101,103,WNA–WorldNuclearAssociation(2023)NuclearPowerinBangladesh.necessarilyreflecttheviewsoftheInternational105,107,111,114,117,122,123,129,130,133,138,149,151,157,163,WEF–WorldEconomicForum(2023)SpeedinguprenewableenergyUpdateMay23.https://world-nuclear.org/information-library/coun-EnergyAgency.Forenergy-relatedcharts,historical166,181,186,189,190:Shutterstock,p.8,26,52,53,64,75,85,87,–bottlenecksandhowyouresolvethem.January5.By:Dosanjh,M.,try-profiles/countries-a-f/bangladesh.aspx(uptoandincluding2022)numericaldataismainly89,96,97,102,106,110,131,132,137,142,143,150,168,175,194:Zeller,R.,DeLasMorenasMoneo,E.,Sinha,V.https://www.weforum.org/basedonIEAdatafromWorldEnergyBalances©Unsplash,p.12,118:Pexels,p.67:iStocPhoto,p.126:Adobestockagenda/2023/01/speeding-up-sustainable-energy-bottlenecks-and-how-WMO–WorldMeteorologicalOrganization(2023)EconomiccostsofOECD/IEA2023,www.iea.org/statistics,License:you-resolve-them-davos2023/weather-relateddisasterssoarsbutearlywarningssavelives.May22.www.iea.org/t&c;asmodifiedbyDNV.209https://public.wmo.int/en/media/press-release/economic-costs-of-WEF(2020)Cleanskiesfortomorrow,Sustainableaviationfuelsasaweather-related-disasters-soars-early-warnings-save-livespathwaytonetzeroaviation.November.©2020WorldEconomicForumXu,C.,Bell-Hammer,L.(2023)‘Oil,gasproducerscontinuetorampupWest,D.(2022)‘Sixwaystoimproveglobalsupplychains’.Brookings.Julycapitalspendingin2023’.Oil&GasJournal.April3.https://www.ogj.12.https://www.brookings.edu/articles/six-ways-to-improve-global-sup-com/general-interest/economics-markets/article/14292115/oil-gas-pro-ply-chains/ducers-continue-to-ramp-up-capital-spending-in-2023WIC(2023)'WittgensteinCenter(WIC)PopulationandHumanCapitalYergin,Daniel(2020)TheNewMap:Energy,Climate,andtheClashofProjections'(WIC3.002(Beta)),https://doi.org/10.5281/zenodo.7921989Nations.September15.PenguinPublishingGroup.WorldBank(2023a)GlobalGasFlaringTrackerReport.https://www.Zawya(2023)Masdar’scleanenergyprojectsportfoliovaluedatmoreworldbank.org/en/topic/extractiveindustries/publication/2023-glob-than$30blninQ12023.March6.https://www.zawya.com/en/projects/al-gas-flaring-tracker-reportutilities/masdars-clean-energy-projects-portfolio-valued-at-more-than-30bln-in-q1-2023-yxf8i6amWorldBank(2023b)CentralAsiaEnergyForumDiscussesProspectsfortheRegionalElectricityMarketDevel-opmentandCleanEnergyTransi-Zhang,L.(2022)‘CoalnosolutionforChina'sdrought-drivenfactorytion.https://www.worldbank.org/en/news/press-release/2023/03/03/shutdowns’.NIKKEIAsia.September5.https://asia.nikkei.com/Opinion/central-asia-energy-forum-discusses-prospects-for-regional-electrici-Coal-no-solution-for-China-s-drought-driven-factory-shutdownsty-market-development-and-clean-energy-transitionZheng,C.,GekKhoo,C.(2023)‘BalancingaffordabilityandthepowerWorldBank(2023c)UpdatedUkraineRecoveryandReconstructionsectorenergytransitioninSoutheastAsia'.S&PGlobal.January6.NeedsAssessment.https://www.worldbank.org/en/news/press-re-https://www.spglobal.com/commodityinsights/en/ci/research-analysis/lease/2023/03/23/updated-ukraine-recovery-and-reconstruc-balancing-affordability-and-the-power-sector-energy-transition.htmltion-needs-assessmentCONTENTSDEMANDELECTRICITYRENEWABLESFOSSILFUELSFINANCEPOLICYEMISSIONSREGIONSAPPENDIXDNVEnergyTransitionOutlook2023THEPROJECTTEAMThisreporthasbeenpreparedbyDNVasacross-disciplinaryexercisebetweentheDNVGroupandourMaritime:EirikOvrum(Projectmanager,MaritimeFoundationChina),YanQin(LondonStockExchangebusinessareasofEnergySystemsandMaritimeacross20countries.ThecoremodeldevelopmentandForecast),ChristofferBøhmer,MagnusS.Eide,ØyvindGroup),KCSamir(WittgensteinCentreforDemog-researchhavebeenconductedbyadedicatedteaminourEnergyTransitionOutlookresearchunit,partofEndresen,KristianHammer,MariusLesiner,ToreraphyandGlobalHumanCapital),JonBirgertheGroupResearch&Developmentdivision,basedinOslo,Norway.Inaddition,wehavebeenassistedbyLongva,AnneSofieSagbakkenNess,EirikNyhus,Skjærseth(FNI),IselinStensdal(FNI),IngvildSørhusinternalandexternalenergytransitionexperts,withthecorenameslistedbelow:OlaGundersenSkåre,HansAntonTvedte,Jakub(Veyt),MagnusThomassen(Hystar),EinarTyssenWalenkiewicz(Removr),JørgenWettestad(FNI)YiananXin(EnergyDNVcoreteamEnergySystems:JørgAarnes,MarioA.Acevedo,FoundationChina),JianyuZhang(BRIInternationalCarlosAlbero,AastaAndreassen,ThomasAnil,GroupTechnologyandResearch:EdwinAalders,GreenDevelopmentCoalition).Steeringcommittee:RemiEriksen,DitlevEngel,MohammedAtif,AlirezaBayat,SarahBarber,FridaHendrikBrinks,ErikAndreasHektor,ErikStensrudUlrikeHaugen,TrondHodne,LivHovem,JinJamesBerglund,JørgenBjørndalen,SantiagoBlanco,InadditiontotheindividualexpertsaboveDNVHuangHeddaP.Blomhoff,AndreBoulet,PeterBrun,JamieGroupGovernmentandPublicAffairs:LarsAlmklov,wouldliketothankthefollowingcompanies,Burrows,BenChilvers,NicholasCole,KoraDreffs,JeromeColombe,RobCoveney,MagnusDahlen,institutesandorganizationsforvaluableinputandProjectdirector:SverreAlvik(sverre.alvik@dnv.com)JerusD'Silva,JoeyYiZhongFan,YerúnFernández,JoyceDalgarno,ThomasFries,CarolineKamerbeek,exchangeofinformationontopicsofcommonJakeFrye,KarinaGalicia,LornaYuqingGao,RobPeterLovegrove,ChristianParker,StevenSawhill,interestduringtheresearchphasefortheETO2023:Modellingresponsible:OnurÖzgünvanGerwen,JasonGoodhand,AmitGoyal,SverreJeanetteSchäfer,LaureSimonnot,NeilSlater,ThereseGravdahl,TobiasGrandeHansen,StevenHe,Sanni,DagThorstensen,AnneVandbakk,RosADNOC,InstituteofEnergyBeijingUniversity,CNPC,Coremodelling-andresearchteamandcontrib-SimenLoeHeggen,ChristianHewicker,TchiarlesWilliamson,CharlotteZwickCNOOCCNInstitute,DaxingInternationalHydrogenutingauthors:KavehDianati,IngeborgHutchesonCoutinhoHilbig,EckhardHinrichsen,AlexandreEnergyDemonstrationZone,HuanengGroupFiskvik,MahnazHadizadeh,ThomasHorschig,AnneImperial,MagnusKillingland,ThomasKoller,AlokOurexternalcontributorsforour2023OutlookCarbonNeutralityResearchInstitute,InternationalLouiseKoefoed,EricaMcConnell,HennaNarula,Kumar,JamesThorntonLaybourn,ThomasLeonard,includes:GuriBang(NMBU),AndreaBonzanni(IETA),RenewableEnergyAgency(IRENA),RockyMountainMatsRinaldo,EduardRomanenko,SujeethaSelvak-MattLockwood,JoseManuelMarco,NicholasOlaBrevig(INEOS),PerChristianEriksen(HydroInstitute(RMI),RollsRoyceSMR,Shellscenarioteam,kumaran,AdrienZambon,RoelJoukeZwartMarquet,JenniferMcWilliams,RobertNicol,DanaHavrand),HægeFjellheim(Veyt),YangFuqiang,SinopecEnergyInstitute,VestasOlson,DarshakParikh,SanduniPathiraja,Kevin(InstituteforGlobalDecarbonizationProgress),PabloEditor:MarkIrvine(mark.irvine@dnv.com)DavePeiris,MorganPutnam,GerardoRodriguez,Gonzalez(Iberdrola),AnneGoujon(Wittgenstein210MitchellRosenberg,JonathanScafidi,AntonioSeijas,CentreforDemographyandGlobalHumanCapital),Referencegroup:PeterBjerager,TheoBosma,PerCharikleiaSidiropoulou,GrahamSlack,BartStoffer,GørildM.Heggelund(FNI)SteffenKallbekkenBuskChristiansen,LucyCraig,Al-KarimGovindji,JanYukinobuUchida,AnjaMyhreWaitz,YongtaoYang,(CICERO),FranciscoLaverón(Iberdrola),AlisonLizinKvålsvold,AstridKristoffersen,RuneTorhaugWenQianZhou,JanZschommler(Eurelectric),JinlongMa(TianjinUniversity),RobvanderMeer(CEMBUREAU),QiMeng(EnergyOtherEnergyTransitionOutlook2023reportsSubscribetothelatestEnergyTransitioninsightsfromDNVdnv.com/energy-transition/subscribe.htmlDon’tmissthelaunchofourPathwaytoNetZeroreportaheadofCOP28inNovember2023AboutDNVHeadquarters:DNVASDNVisaglobalqualityassuranceandriskmanagementcompany.DrivenbyourpurposeofsafeguardingNO-1322Høvik,Norwaylife,propertyandtheenvironment,weenableorganizationstoadvancethesafetyandsustainabilityoftheirTel:+4767579900business.Weprovideclassification,technicalassurance,softwareandindependentexpertadvisoryservicestowww.dnv.comthemaritime,oil&gas,powerandrenewablesindustries.Wealsoprovidecertification,supplychainanddatamanagementservicestocustomersacrossawiderangeofindustries.ThetrademarksDNV®andDetNorskeVeritas®arethepropertiesofCombiningtechnical,digitalandoperationalexpertise,riskmethodologyandin-depthindustryknowledge,companiesintheDetNorskeVeritasweempowerourcustomers’decisionsandactionswithtrustandconfidence.Wecontinuouslyinvestinresearchgroup.Allrightsreserved.andcollaborativeinnovationtoprovidecustomersandsocietywithoperationalandtechnologicalforesight.Withoriginsstretchingbackto1864andoperationsinmorethan100countries,ourexpertsarededicated211tohelpingcustomersmaketheworldsafer,smarterandgreener.dnv.com
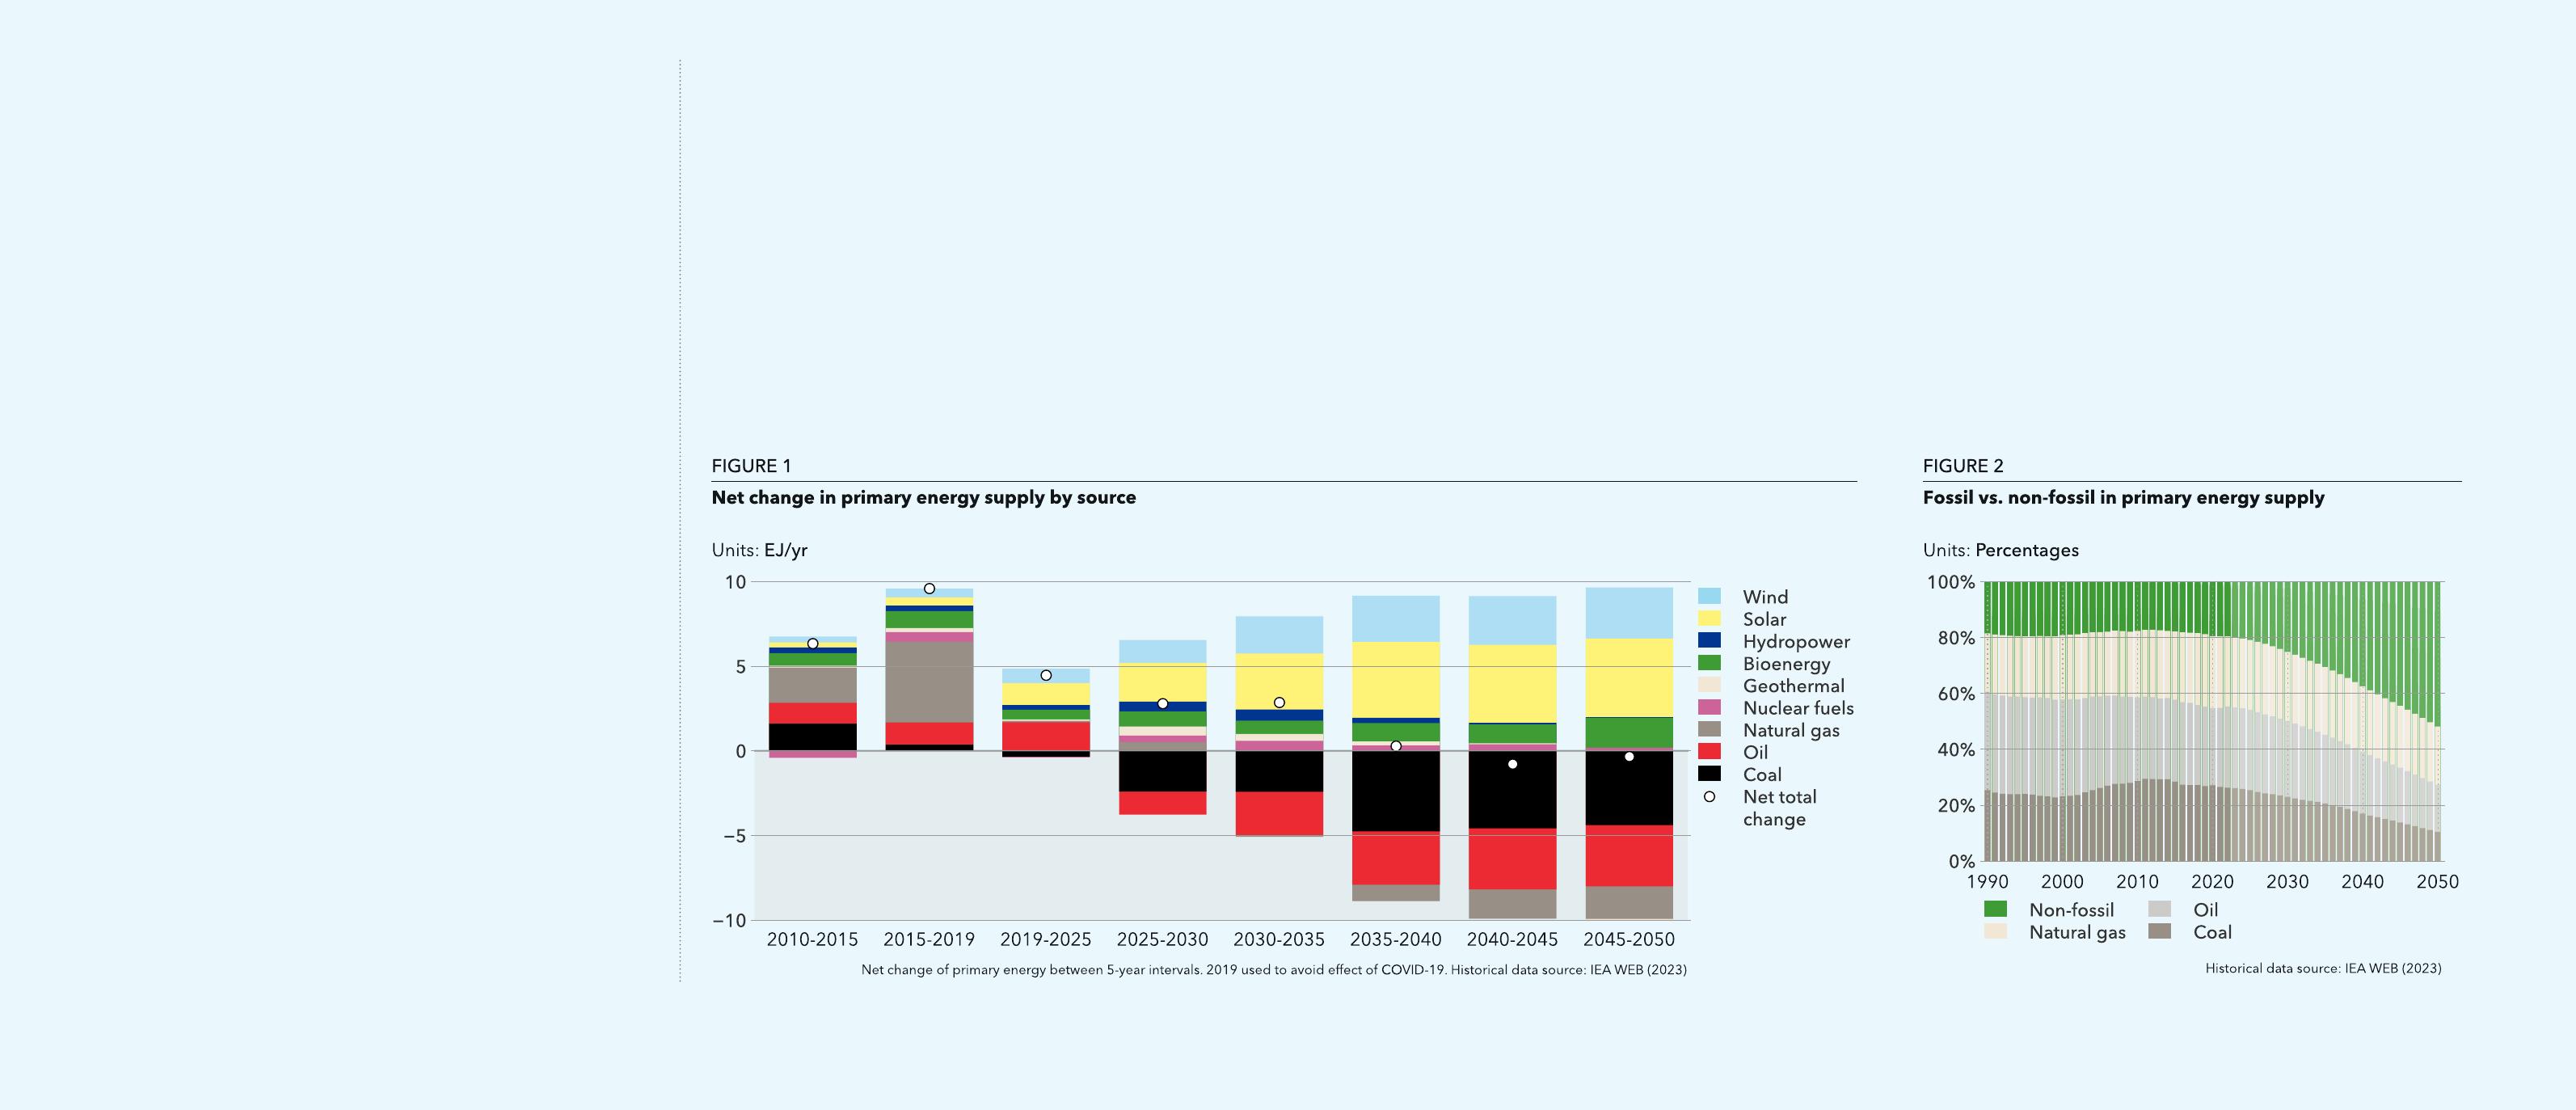
 VIP
VIP


