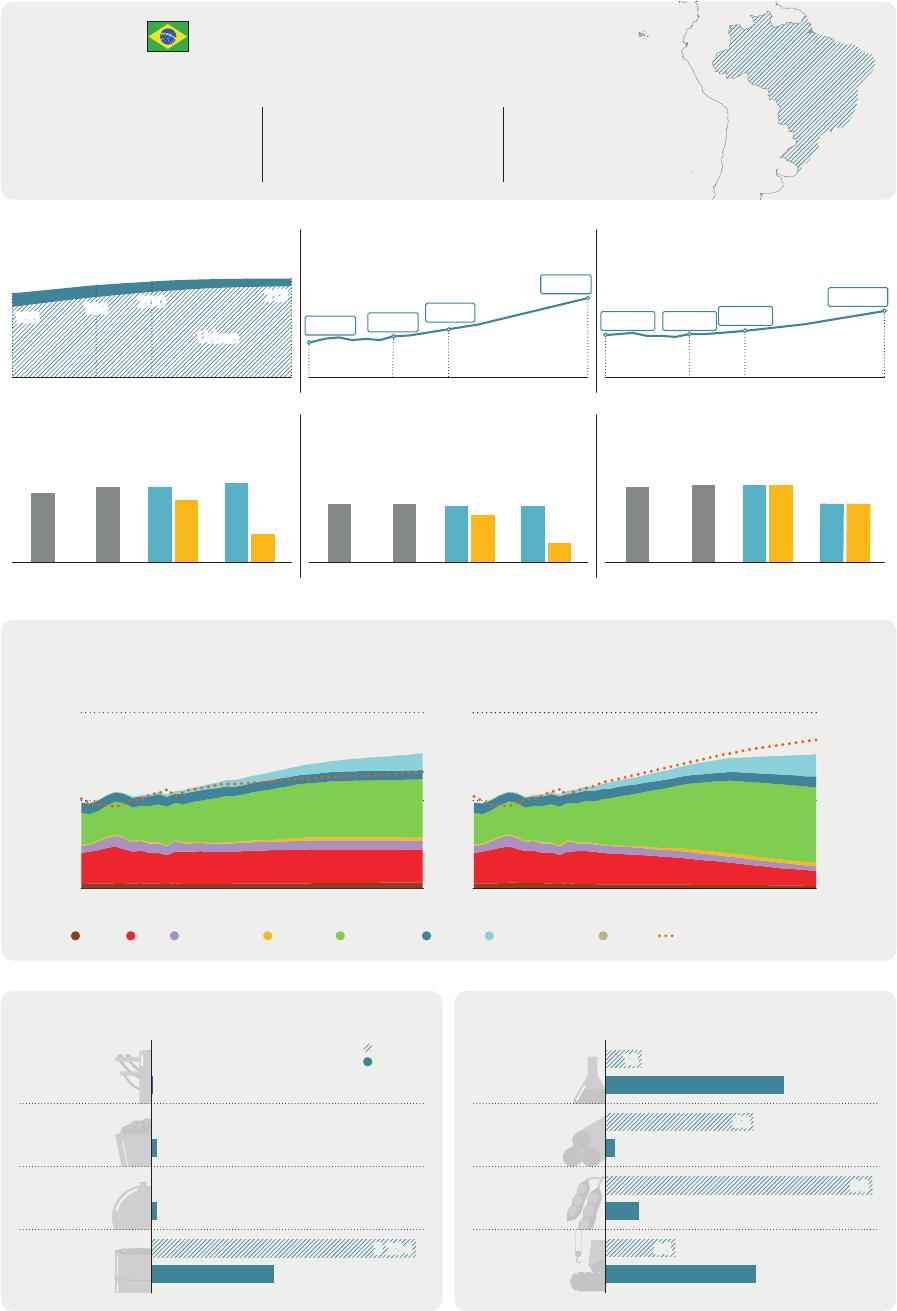
LatinAmericaEnergyOutlookOverview:BrazilWorldEnergyOutlookSpecialReportINTERNATIONALENERGYAGENCYTheIEAexaminestheIEAmemberIEAassociationfullspectrumcountries:countries:ofenergyissuesincludingoil,gasAustraliaArgentinaandcoalsupplyandAustriaBrazildemand,renewableBelgiumChinaenergytechnologies,CanadaEgyptelectricitymarkets,CzechRepublicIndiaenergyefficiency,DenmarkIndonesiaaccesstoenergy,EstoniaKenyademandsideFinlandMoroccomanagementandFranceSenegalmuchmore.ThroughGermanySingaporeitswork,theIEAGreeceSouthAfricaadvocatespoliciesHungaryThailandthatwillenhancetheIrelandUkrainereliability,affordabilityItalyandsustainabilityofJapanenergyinitsKorea31membercountries,Lithuania13associationLuxembourgcountriesandMexicobeyond.NetherlandsNewZealandThispublicationandanyNorwaymapincludedhereinarePolandwithoutprejudicetothePortugalstatusoforsovereigntyoverSlovakRepublicanyterritory,totheSpaindelimitationofinternationalSwedenfrontiersandboundariesSwitzerlandandtothenameofanyRepublicofTürkiyeterritory,cityorarea.UnitedKingdomUnitedStatesTheEuropeanCommissionalsoparticipatesintheworkoftheIEASource:IEA.InternationalEnergyAgencyWebsite:www.iea.orgBrazillargest2nd2ndeconomyinLatinAmericalargestbiofuelsproducerlargesthydropowerproducerandtheCaribbeanintheworldintheworldPopulationMillionpeopleGDPBillionUSD(2022,PPP)GDPpercapitaUSDpercapita(2022,PPP)3400312724Rural1720018921369001750017800197003000016638004400Urban201020222030205020102022203020502010202220302050CO2emissionsMtCO2CO2emissionspercapitatCO2/capitaEnergyintensityGJperthousandUSD411452448374(2022,PPP)2010202220304733.53.63.63.61722.12.12.01.72.02.82.80.7EJSTEPS205020102022203020502010202220302050APSPrimaryenergysupplyandshareoflow-emissionssourcesAPSSTEPS100%2512.550%2010205020102050Shareoflow-emissions(rightaxis)CoalOilNaturalgasNuclearBioenergyHydroWindandsolarOtherTradeofmainenergyproducts(2021)PJTradeofnon-energyproducts(2021)BillionUSDExports96Electricity83Imports1364Coal603Chemicals53Gas6213234OilOresandmetals3Foodproducts121491Machinery25andtransport54equipmentTable1⊳RecentpolicydevelopmentsinBrazilPolicyPublicationyearEconomy-wide•NDC:50%reductionofGHGemissionsby2030from2005levels.2022measures•Netzeroemissionsby2050target.2022•GuidelinesforaNationalStrategyforClimateNeutrality:between45%and2022Justtransitionpolicies50%ofrenewableenergyinthenationalenergymixby2030.2023•DecennialEnergyExpansionPlan2032(PDEE2032)(indicative).AFOLUEnvironment•AmazonDecarbonisationProgramme:Reducedieselpowerplant2023andwatergenerationintheAmazonregionby40%by2026,USD1billion.2023resourcesHydrogen•Luzparatodosprogramme(initiallylaunchedin2003):TobringelectricityPowerto500000familiesthatlackaccessby2026.IndustryTransport•NovoPAC:USD105billionfortheenergytransitionandenergysecurity.2023•ActionPlan:Zerodeforestationby2030(5thphase).2023•MetanoZeroprogramme:25newbiomethaneplants(2.3mcm/din2027).2022•HydropowerReservoirRecoveryPlan:Improvewatermanagement.2022•2023-2025WorkingPlanoftheNationalHydrogenProgramme.2023•Revisedsubsidiesfordistributedgeneration(netbillingscheme).2022•EnergyEfficiencyProgramme:Publicfunds(aboutUSD117millionin2020).2020•RenovaBioProgramme-NationalBiofuelPolicy.2017•NationalBioKeroseneProgramme:PromotesR&Dforbiofuelforaviation.2021•CombustíveldoFuturoprogramme:Targets30%bioethanoland15%2021biodieselblendingrate.Table2⊳MajorinfrastructureprojectsinBrazilProjectSizeDateonlineStatusDescriptionPre-salt+0.5mb/d2027OilandgasOilandgas(Etapa3&4)(target2.2mb/d)2025DedicatedhydroPortofPecem-Base600ktH2/year2023DedicatedwindHydrogen/(production)2028NuclearreactorammoniaOne10ktH2/year2030(capacity)2028BECCSNuclearUnigel,phaseI1405MWe1440kmCCUSTransmission,Angra30.4MtCO2/yearinterconnectionsLucasdoRioVerde,800kVFSBioenergiaGraçaAranha–Silvânia(HVDC)IEA.CCBY4.0.BrazilenergyprofileFigure1⊳FinalenergyconsumptionbyscenarioinBrazil18STEPSAPS15EJLever122010Avoideddemand2022Electrification9ActivityEnergyefficiency6TransportFuelswitching3IndustrySectorBuildingsOther2050Transport2022BuildingsActivityIndustryTransportIndustryBuildings2050IEA.CCBY4.0.Today,transportandindustryaccountfor75%offinalenergyconsumptioninBrazil.IntheSTEPS,totalfinalconsumptionincreasesover30%by2050,withthemostgrowthcomingfromindustry.IntheAPS,energyefficiencygainsandavoideddemandmeanthatfinalconsumptiongrowsnearly15%lessthanintheSTEPS.Figure2⊳FuelconsumptioninindustrybytypeandscenarioinBrazilEnergy-intensiveindustriesOtherindustryActivitydrivers4220EJIndex(2022=100)31902160113020101002050202220302030Crudesteel2050ChemicalsLAC2030IndustryVA2050IEA.CCBY4.0.201020222030205020302050STEPSAPSSTEPSAPSCoalOilNaturalgasBioenergyElectricityOtherIEA.CCBY4.0.Brazilistheregion’sindustryheavyweight,especiallyforethylene,steelandaluminiumproduction.Energy-intensiveindustriesmakeup65%oftotalindustryenergydemand.Bioenergymeets40%ofindustrialenergyconsumptiontoday:by2050,itsshareexpandsto42%intheSTEPSandnearly50%intheAPS.InternationalEnergyAgencyLatinAmericaEnergyOutlookFigure3⊳FuelconsumptionintransportbytypeandscenarioinBrazilRoadNon-roadActivitydrivers5225EJIndex(2022=100)420031752150112520101002050202220302030205020302050201020222030205020302050STEPSAPSSTEPSAPSOilNaturalgasBioenergyElectricityOtherPassengercarsTrucksLACIEA.CCBY4.0.Today,oilaccountsfor75%ofenergyconsumptionintransport.Theshareofoildeclinesinbothscenarios,withbioenergybeingthedominantfuelintheAPSbytheearly2040s.By2050,roadfreightactivityincreasesbyaround90%fromtoday’slevel;passengercarsactivityincreasesbyover60%.Figure4⊳FuelconsumptioninbuildingsbytypeandscenarioinBrazilHeatingandSpacecoolingandActivitydriversappliances7003cookingEJIndex(2022=100)2500130020101002050202220302030205020302050201020222030205020302050STEPSAPSSTEPSAPSAirconditionerstockFloorspaceLACOilNaturalgasBioenergyElectricityOtherIEA.CCBY4.0.IEA.CCBY4.0.Heatingandcookingneedscurrentlyaremetbybioenergy(40%)andoil(36%).Higheraccesstocleancookingandelectrificationreducesthetraditionaluseofbiomass.Electricitydemandforcoolingalmosttriplesby2050intheSTEPS.IntheAPS,minimumenergyperformancestandardsandmoreefficientbuildingscutthisgrowthby35%.BrazilenergyprofileFigure5⊳AverageelectricitydailyloadprofilebyscenarioinBrazil2002022STEPS2050APS2050GW150100500h24h0h24h0h24hIndustryBuildingsTransportIEA.CCBY4.0.Peakelectricitydemandrisesbymorethan75%intheSTEPSby2050andmorethandoublesintheAPS,wherepeakincreasesmuchfasterthanaverageelectricitydemand.Theincreaseindailypeakdemandismainlydrivenbyhigheruseofelectricityinbuildings.Demand-responseandloadshiftingmeasurescouldflattentheloadcurve.Figure6⊳ElectricitygenerationandcapacitybyfuelandscenarioinBrazil1500STEPSAPS600STEPSAPSTWh2050GW1000400202250020302002050201020502030202220222050CoalOilNaturalgasBioenergyNuclearHydroWindSolarPVBatteryOtherDedicatedrenewablesforhydrogenIEA.CCBY4.0.IEA.CCBY4.0.Hydropowerdominatesthecurrentpowermix,butitsexpansioninbothscenariosisconstrainedbyinherentresourcelimitsandsocialacceptanceconcerns.WindandsolarPVmeetnearlyallelectricitydemandgrowth.IntheAPS,theyaccountfornearly60%ofelectricitygenerationin2050comparedwith17%today.InternationalEnergyAgencyLatinAmericaEnergyOutlookFigure7⊳FueldemandandproductionbyscenarioinBrazilOil(mb/d)Naturalgas(bcm)Low-emissionshydrogen(Mt)55054404330322021101202220302050203020502022203020502030205020222030205020302050STEPSAPSSTEPSAPSSTEPSAPSDemandProductionIEA.CCBY4.0.OilproductionintheSTEPSincreasesfrom3mb/dtojustover4mb/dby2030;naturalgasproductiongrowsinresponsetorisingdemandintheSTEPSbutdeclinesintheAPS.IntheAPS,hydrogenproductionreaches4Mtin2050boostedbythenationalstrategy.Figure8⊳AnnualinvestmentinenergysupplybytypeandscenarioinBrazil2022STEPS2030CleanenergyAPSHydroSTEPS2050Non-hydrorenewablesAPSNuclearBatterystorageElectricitygridsCleanfuelsOtherlow-emissionsUnabatedfossilfuelsOilCoalNaturalgasOtherfossilfuels20406080BillionUSD(2022,MER)IEA.CCBY4.0.IEA.CCBY4.0.Investmentincleanenergysupplyaccountsfor1.4%ofBrazil’sGDPintheSTEPSin2050and1.8%intheAPS.By2050,investmentincleanenergysupplyismorethandoublethelevelofinvestmentforfossilfuelsintheSTEPSandmorethanfive-timestheirlevelintheAPS.BrazilenergyprofileNoteshahectaresUnitskmkilometreAreaDistanceGtCO2gigatonnesofcarbondioxideEmissionsMtCO2milliontonnesofcarbondioxideMtCO2-eqmilliontonnesofcarbon-dioxideequivalent(using100‐EnergyyearglobalwarmingpotentialsfordifferentgreenhousetCO2-eqgases)Gastonnesofcarbon-dioxideequivalentEJMassPJexajoule(1joulex1018)MonetaryTWhpetajoule(1joulex1015)OilTcalterawatt-hourPowerteracalorie(1caloriex1012)bcmbcm/dbillioncubicmetresmcm/dbillioncubicmetresperdaymillioncubicmetresperdaykgktkilogrammekilotonnes(1tonne=1000kg)USDmillionUSDbillion1USdollarx1061USdollarx109mb/db/dmillionbarrelsperdaybarrelsperdayGWMWgigawattkVmegawattkilovoltIEA.CCBY4.0.TermsActivitydriversforindustryincludeproductionlevels(Mt)andvalueadded(USD2022,PPP);fortransport,vehicle-kilometres(km)forpassengercarsandtonne-kmfortrucks;forbuildings,airconditioning(millionunits)andfloorspace(millionsquaremetres).TheactivitynumberspresentedcorrespondtotheStatedPoliciesScenario(STEPS)indexedonthe2022value.Bioenergyreferstobioenergyandwaste.Cleanfuelsreferstobiofuels,hydrogenandhydrogen-relatedfuels.InternationalEnergyAgencyLatinAmericaEnergyOutlookIEA.CCBY4.0.Dailyaverageelectricityloadprofilesdonotfactorinelectricitydemandgeneratedbydedicatedrenewablesourcesconnectedtoelectrolysers,andtheyalsodonotconsidertheinfluenceofdemand-responsemechanisms.Energy-intensiveindustriesincludechemicals,ironandsteel,non-metallicminerals(cementandother),non-ferrousmetals(aluminiumandother)andpulp,paperandprinting.Heatingandcookinginbuildingsreferstoenergydemandforspaceandwaterheating,andcooking.Hydrogendemandexcludesbothhydrogenexportsandthehydrogenusedforproducinghydrogen-basedfuelswhichareexported.Investmentdataarepresentedinrealtermsinyear-2022USdollars.Large-scaleCCUSprojectsreferonlytofacilitieswithaplannedcapturecapacityhigherthan100000tonnesofCO2peryear.Low-emissionshydrogenprojectsconsideredarethosewithanannouncedcapacityfor2030.Non-roadtransportincludesrail,domesticnavigation,domesticaviation,pipelineandothernon-specifiedtransport.Otherforpowergenerationandcapacityreferstogeothermal,concentratedsolarpower,marine,non-renewablewasteandothernon-specifiedsources.Otherforfinalconsumptioninsectorsreferstonon-renewablewaste,hydrogen,solarthermalandgeothermal.Otherinasectorcategoryreferstoagricultureandothernon-energyuses.Otherfossilfuelsinenergysupplyinvestmentrefertonon-renewablewasteandothersupplysources.Otherfuelshiftsincludebioenergy,nuclear,solarthermal,geothermalandnaturalgas.Otherindustryreferstotheconstruction,foodandtobacco,machinery,miningandquarrying,textileandleather,transportequipment,woodindustrybranchesandremainingindustry.Otherlow-emissionsinenergysupplyinvestmentincludeheatpumps,CCUS,electricitygenerationfromhydrogen,electricitygenerationfromammoniaanddirectaircapture.Roadtransportincludessixvehiclecategories(passengercars,buses,two/three-wheelers,light-dutyvansandtrucks,andmediumandheavytrucks).SDG7referstoSustainableDevelopmentGoal(SDG)7:“ensureaccesstoaffordable,reliable,sustainableandmodernenergyforall”,adoptedbytheUnitedNationsin2015.Solarpotentialdataiscalculatedbasedontheaveragepotentialatnationallevelassessedinkilowatt-hourperkilowattpeakperday(2020).BrazilenergyprofileTotalfinalconsumptionincludesconsumptionbythevariousend‐usesectors(industry,transport,buildings,agriculture,andothernon‐energyuse).Itexcludesinternationalmarineandaviationbunkers,exceptatworldlevelwhereitisincludedinthetransportsector.AcronymsScenarios:STEPS=StatedPoliciesScenario;APS=AnnouncedPledgesScenario.AFOLUagriculture,forestryandotherlanduseBECCSbioenergywithcarboncaptureandstorageCCUScarboncapture,utilisationandstorageCNGcompressednaturalgasEVelectricvehicleGDPgrossdomesticproductGHGgreenhousegasesH2hydrogenHVDChighvoltagedirectcurrentICEinternalcombustionengineMEPSminimumenergyperformancestandardsMERmarketexchangerateNDCNationallyDeterminedContributionPPPpurchasingpowerparityPVphotovoltaicsSDGSustainableDevelopmentGoalsVAvalueaddedZEVzeroemissionsvehicleThepolicytablesincludeexistingpoliciesandannouncementsasoftheendofSeptember2023.Thesameappliestothetablesofexistingandannouncedprojects.TheIEAdoesnotusecolourstorefertothevarioushydrogenproductionroutes.However,whenreferringtospecificpolicyannouncements,programmes,regulationsandprojectswhereanauthorityusescolourtodefineahydrogenproductionroute,e.g.greenhydrogen,weusethatterminologytoreportdevelopmentsinthisreview.IEA.CCBY4.0.InternationalEnergyAgencyLatinAmericaEnergyOutlookInternationalEnergyAgency(IEA)ThisworkreflectstheviewsoftheIEASecretariatbutdoesnotnecessarilyreflectthoseoftheIEA’sindividualmembercountriesorofanyparticularfunderorcollaborator.Theworkdoesnotconstituteprofessionaladviceonanyspecificissueorsituation.TheIEAmakesnorepresentationorwarranty,expressorimplied,inrespectofthework’scontents(includingitscompletenessoraccuracy)andshallnotberesponsibleforanyuseof,orrelianceon,thework.SubjecttotheIEA’sNoticeforCC-licencedContent,thisworkislicencedunderaCreativeCommonsAttribution4.0InternationalLicence.Thisdocumentandanymapincludedhereinarewithoutprejudicetothestatusoforsovereigntyoveranyterritory,tothedelimitationofinternationalfrontiersandboundariesandtothenameofanyterritory,cityorarea.Unlessotherwiseindicated,allmaterialpresentedinfiguresandtablesisderivedfromIEAdataandanalysis.IEAPublicationsInternationalEnergyAgencyWebsite:www.iea.orgContactinformation:www.iea.org/contactTypesetinFrancebyIEA-November2023Coverdesign:IEAPhotocredits:©GettyImages


 VIP
VIP VIP
VIP VIP
VIP VIP
VIP VIP
VIP VIP
VIP VIP
VIP VIP
VIP VIP
VIP VIP
VIP