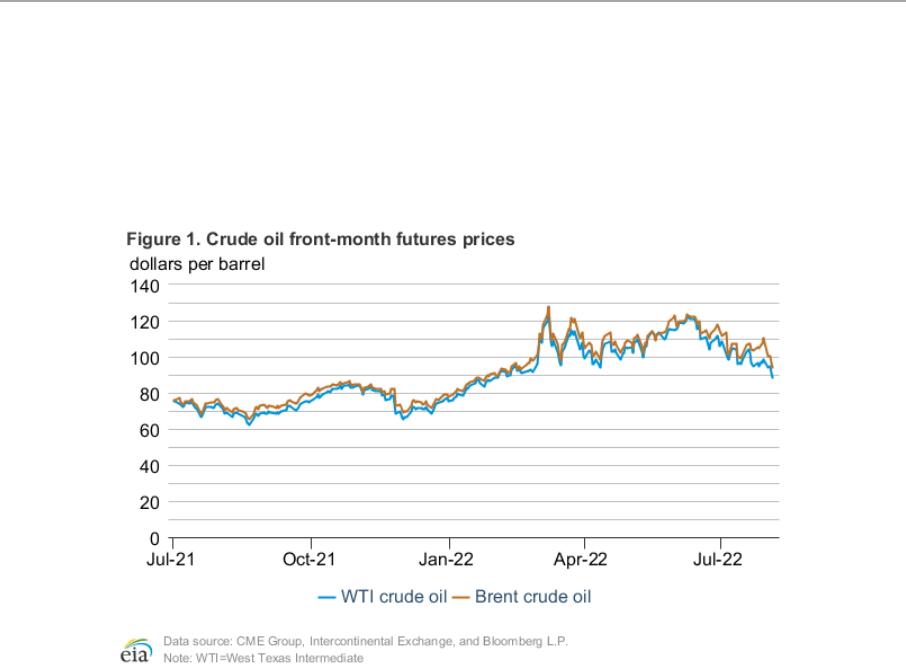
U.S.EnergyInformationAdministrationShort-TermEnergyOutlookAugust20221Note:EIAcompletedmodelingandanalysisforthisreportonThursday,August4,2022August2022Short-TermEnergyOutlookForecasthighlightsGloballiquidfuels•TheAugustShort-TermEnergyOutlook(STEO)issubjecttoheighteneduncertaintyresultingfromRussia’sfull-scaleinvasionofUkraine,howsanctionsaffectRussia’soilproduction,theproductiondecisionsofOPEC+,therateatwhichU.S.oilandnaturalgasproductionrises,andothercontributingfactors.Lessrobusteconomicactivityinourforecastcouldresultinlower-than-forecastenergyconsumption.•WeforecastthespotpriceofBrentcrudeoilwillaverage$105perbarrel(b)in2022and$95/bin2023.•U.S.crudeoilproductioninourforecastaverages11.9millionbarrelsperday(b/d)in2022and12.7millionb/din2023,whichwouldsetarecordformostU.S.crudeoilproductioninayear.Thecurrentrecordis12.3millionb/d,setin2019.•Weestimatethat98.8millionb/dofpetroleumandliquidfuelswasconsumedgloballyinJuly2022,anincreaseof0.9millionb/dfromJuly2021.Weforecastthatglobalconsumptionofpetroleumandliquidfuelswillaverage99.4millionb/dforallof2022,whichisa2.1millionb/dincreasefrom2021.Weforecastthatglobalconsumptionofpetroleumandliquidfuelswillincreasebyanother2.1millionb/din2023toaverage101.5millionb/d.•TheU.S.retailpriceforregulargradegasolineaveraged$4.56pergallon(gal)inJuly,andtheaverageretaildieselpricewas$5.49/gal.Weexpectretailgasolinepricestoaverage$4.29/galinthethirdquarterof2022(3Q22)andfalltoanaverageof$3.78/galin4Q22.Retaildieselpricesinourforecastaverage$5.02/galin3Q22and$4.39/galin4Q22.•U.S.refineriesaverage93%utilizationin3Q22inourforecast,asaresultofhighwholesaleproductmargins.Elevatedpricesforgasolineanddieselreflectrefiningmarginsforthoseproductsthatareatornearrecordhighsamidlowinventorylevels.Naturalgas•InJuly,theHenryHubspotpriceaveraged$7.28permillionBritishthermalunits(MMBtu),downfrom$7.70/MMBtuinJuneand$8.14/MMBtuinMay.AveragenaturalU.S.EnergyInformationAdministrationShort-TermEnergyOutlookAugust20222gaspricesfelloverthelasttwomonthsprimarilybecauseofadditionalsupplyinthedomesticmarketfollowingtheshutdownoftheFreeportLNGexportterminalonJune8.However,pricesincreasedbyalmost50%,from$5.73/MMBtuonJuly1to$8.37/MMBtuonJuly29,becauseofcontinuedhighdemandfornaturalgasfromtheelectricpowersector.WeexpecttheHenryHubpricetoaverage$7.54/MMBtuinthesecondhalfof2022andthenfalltoanaverageof$5.10/MMBtuin2023amidrisingnaturalgasproduction.•U.S.naturalgasinventoriesendedJulyat2.5trillioncubicfeet(Tcf),whichwas12%belowthe2017–2021average.Weforecastthatnaturalgasinventorieswillendthe2022injectionseason(endofOctober)atcloseto3.5Tcf,whichwouldbe6%belowthefive-yearaverage.•WeforecastthatU.S.LNGexportswillaverage10.0Bcf/din3Q22and11.2Bcf/dforallof2022,a14%increasefrom2021.ThisincreaseistheresultofadditionalU.S.LNGexportcapacitythathascomeonlineandFreeportLNGresumingoperationssoonerthanwehadinitiallyexpected.Inthefirsthalfof2022,theUnitedStatesbecamethelargestLNGexporterintheworld.WeforecastLNGexportswillaverage12.7Bcf/din2023.•U.S.consumptionofnaturalgasinourforecastaverages85.2Bcf/din2022,up3%from2021.Consumptionintheelectricpowersectorcontinuestoincreaseasaresultoflimitedswitchingfromnaturalgas-firedgeneratorstocoal-firedgeneratorsforpowergeneration,despiteelevatednaturalgasprices.Inaddition,risingU.S.naturalgasconsumptionreflectsincreasedconsumptionintheresidentialandcommercialsectorsasaresultofcoldertemperaturesonaveragein2022thanin2021.Weforecastthatnaturalgasconsumptionwillaverage83.8Bcf/din2023,about1.3Bcf/d(2%)lowerthanin2022.•WeforecastU.S.drynaturalgasproductiontoaverage97.1Bcf/dinAugustand96.6Bcf/dduringallof2022,whichwouldbe3.0Bcf/d(3%)morethanin2021.Weexpectdrynaturalgasproductiontoaverage100.0Bcf/din2023.Electricity,coal,renewables,andemissions•WeexpectU.S.salesofelectricitytoultimatecustomerstoincreaseintheforecastby2.5%in2022,mostlybecauseofrisingeconomicactivitybutalsobecauseofhotsummerweatherinmuchofthecountry.ForecastU.S.salesofelectricitydeclineby0.3%in2023.•ThelargestincreasesinU.S.electricitygenerationinourforecastcomefromrenewableenergysources,mostlysolarandwind.Weexpectrenewablesourceswillprovide22%ofU.S.generationin2022and24%in2023,upfrom20%in2021.U.S.EnergyInformationAdministrationShort-TermEnergyOutlookAugust20223•WeforecasttheU.S.residentialelectricitypricewillaverage14.6centsperkilowatthour(kWh)in2022,up6.1%from2021.Higherretailelectricitypriceslargelyreflectanincreaseinwholesalepowerpricesdrivenbyrisingnaturalgasprices.Annualaveragewholesalepricesfor2022rangefromanaverageof$62permegawatthour(MWh)inFloridato$95/MWhintheISONewEnglandandNewYorkISOmarkets.•TheU.S.electricpowersectoradded13gigawatts(GW)ofutility-scalesolarphotovoltaic(PV)capacityin2021.Solarcapacityadditionsintheforecastperiodtotal20GWfor2022and24GWfor2023,andtheyrepresentanadditionof31billionkWhofelectricpowergenerationin2022and41billionkWhin2023.•U.S.coalproductionisforecasttoincreaseby21millionshorttons(MMst)to599MMstin2022andto601MMstin2023.Weexpectcoalconsumptiontobeslightlylowerin2022at541MMst,relativeto546MMstin2021.Thisforecastdeclineisaresultofconstraintsoncoalgenerationandmineshutdownsaswellascoaltransportationlimitations.Ascoalplantshutdownscontinueandnaturalgaspricesfall,coalconsumptionisexpectedtodeclineby9%to493MMstin2023.Coalexportsincreasefrom85MMstin2021to87MMstin2022andto98MMstin2023.PetroleumandNaturalGasMarketsReviewCrudeoilPrices:Thefront-monthfuturespriceforBrentcrudeoilsettledat$94.12perbarrel(b)onAugust4,adecreaseof$17.51/bfromtheJuly1priceof$111.63/b.Thefront-monthfuturespriceforWestTexasIntermediate(WTI)crudeoilfordeliveryatCushing,Oklahoma,decreasedby$19.89/bduringthesameperiod,settlingat$88.54/bonAugust4(Figure1).U.S.EnergyInformationAdministrationShort-TermEnergyOutlookAugust20224CrudeoilpricesgenerallydecreasedinJuly,andthepriceofWTIdecreasedbymorethanBrent.ThepricespreadbetweenBrentandWTIincreasedtoahighof$13.26/bonJuly29,thehighestpricespreadsinceJanuary14,2014(Figure2).ThiswideBrent-WTIspread,whichreflectssupplyanddemanddynamicsinNorthwestEurope,hascomedowninthefirstfewtradingdaysofAugustbutremainshigh.Russia’sfull-scaleinvasionofUkrainehasresultedinshiftingtradepatterns,leavingEuropetofindsubstitutesforRussia’soil.ThischangehasdrivenupthepriceofBrentcontractstoalevelhighenoughtoreduceAsia’simportsofBrentcrudeoilandtoretainmoreoilinEurope.TheBrent-WTIspreadhasalsoincreasedenoughtoattractmoreimportsofcrudeoilfromtheUnitedStatesintoEurope.FromMarchthroughJuly,theBrent-WTIspreadaveraged$6.05/b,analmost$2.50/bincreasefromthefirsttwomonthsoftheyear.WeforecasttheBrent-WTIspreadwillaverage$6/bin2023,up$2/bfromtheJulySTEO.ThishighspreadwillkeepexportsfromEuropetoAsiasubduedandencouragehigherimportsfromtheUnitedStates,bothofwhichwilllikelybenecessaryastheEUreducescrudeoilimportsfromRussiaby90%bytheendoftheyear.Althoughsupplydisruptionshavekeptcrudeoilpricesaround$100/b,crudeoilpriceshavecomedownslightlyinJulyasconcernsofslowereconomicgrowthorarecessionbecomemoreprevalent.TheseconcernsarereflectedintheUniversityofMichigan’ssurveyofconsumersentiment,whichrecordeditslowestreadingonrecordinJune,withdatagoingbacktoNovember1952(Figure3).Likewise,consumersentimentintheEuroAreahasdecreased,reachingrecordlowsinJuly.U.S.EnergyInformationAdministrationShort-TermEnergyOutlookAugust20225Consumersentimenthasbeendecreasingasinflationcontinuestobestrong,borrowingcostsincreasewithhigherinterestrates,andeconomicgrowthshowssignsofslowing.Datapointsreflectingthesetrendsinclude:•TheBureauofLaborStatistics’ConsumerPriceIndexinJuneshowedyear-over-yearinflationof9.1%,itsfastestratesince1981.•InflationaryconcernshaveledtotheFederalReserveincreasinginterestrates,whichincreasesborrowingcostsandcouldalsobeaffectingconsumersentiment.•Aspriceshaverisen,U.S.manufacturing,asmeasuredbythemanufacturingPurchasingManagerIndex(PMI),decreasedinJulytoitslowestlevelssinceJuly2020.•TheBureauofEconomicAnalysis'sgrossdomesticproductreportreleasedinJulyshowedU.S.realgrossdomesticproductcontractingbyanestimated0.9%in2Q22,makingitthesecondconsecutivequarterofeconomiccontraction.Consumersentimenthasoftendeclinedinresponsetohighcrudeoilprices.Thistrendlikelyreflectstheeffectsofhighercrudeoilpricesonconsumerbudgets.Highercrudeoilpricesleaddirectlytoincreasedcostsforfuelthatconsumerspurchasefortransportation.Additionally,risingcrudeoilpricescancreateinflationarypressuresthroughouttheeconomybyraisinginputcostsofgoods.Becauseinflationhasbeenaffectingconsumers’budgetsforanextendedtimenow,itislikelythatsomeconsumershavebeguntomakelifestyleadjustmentsthatarereducingpetroleumproductconsumptioninthethirdquarter,whichwehavereflectedasreductionsinourforecast.PriceofBrentcrudeoilinU.S.dollarsandeuros:AsU.S.interestratesriseandconcernsofarecessionincrease,demandforU.S.dollarshasincreased,strengtheningitsvaluerelativetoothercurrencies.ForcountriesusingacurrencyotherthantheU.S.dollar,astrengtheningU.S.EnergyInformationAdministrationShort-TermEnergyOutlookAugust20226dollarcouldmaketheimportedcostofabarrelofcrudeoilmoreexpensive.Forexample,recentlythedollarhasbeentradingclosetotheeuroforthefirsttimesince2002.Whereastheinflation-adjustedpriceofabarrelofcrudeoilinU.S.dollarsisnotashighasthelevelsseenfrom2011–2014orin2008,therealpriceofabarrelofcrudeoilineuroshassurpassedthosehighs(Figure4).Therelativelyhigherpriceshavefurthercontributedtoslowinggrowthinpetroleumandotherliquidsconsumptioninthesecondhalfof2022(2H22).PetroleumproductsGasolineprices:Thefront-monthfuturespriceofRBOB(thepetroleumcomponentofgasolineusedinmanypartsofthecountry)settledat$2.79pergallon(gal)onAugust4,down89cents/galfromJuly1(Figure5).TheRBOB-Brentcrackspread(thedifferencebetweenthepriceofRBOBandthepriceofBrentcrudeoil)settledat$0.55/galonAugust4,down48cents/galduringthesameperiod.U.S.EnergyInformationAdministrationShort-TermEnergyOutlookAugust20227LowercrudeoilpricesandanarrowinggasolinecrackspreadbothcontributedtoanoveralldecreaseinRBOBpricesinJuly.ThemonthlyaverageRBOBpriceinJulywas$3.34/gal,adecreaseof65cents/galcomparedwithJune.Justoverhalfofthisdecreasewasinthegasolinecrackspread,whichdecreasedtoamonthlyaverageof85cents/gal,down34cents/galcomparedwithJune.Thegasolinecrackspreadhasremainedbelow$1/galsinceJuly1.GasolineinventoriesintheUnitedStatesincreasedby7.8millionbarrelsinJulycomparedwithJune.Increasedgasolineproductionasaresultofhighrefineryutilizationhasfilledinventoriesamidrelativelylowergasolinedemandcomparedwith2021.WeestimatethatrefineryutilizationandgasolineproductionwillriseinAugustbeforedecreasinginSeptember,inlinewithnormalseasonaltrendsforfallmaintenance.Weestimatethatlessgasolinedemandinthefallandwinterwillpartiallyoffsetlowerrefineryproductionduringthefallmaintenanceseason,thoughthiswillleadtonormalseasonaldrawsoninventoriesuntilNovember.FromSeptemberthroughtheendof2022,weexpectend-of-monthmotorgasolineinventoriestobewithin10millionbarrelsofthefive-yearaverage.Asinventoriesgrowclosertotypicalseasonallevels,weexpectmonthlyaveragegasolinepricestocontinuedecreasing.However,unexpectedreductionsinrefineryoperationsbecauseofunplannedoutages—particularlythoserelatedtohurricanesontheGulfCoast—aswellaspotentialincreasesindrivingactivityinresponsetolowerretailgasolinepricesbothpresentupsideriskstogasolinepricesandcrackspreads.NewYorkHarbor-GulfCoastpricedifferential:ThepricedifferentialforconventionalgasolinebetweentheNewYorkHarborandU.S.GulfCoastspotmarketsincreasedsubstantiallyinJuly.OnJuly29,thepricespreadwidenedto59cents/gal,thewidestspreadinrealtermssinceSeptember2012(Figure6).TheaveragepricespreadinJulywas27cents/gal,thewidestmonthlyaveragepricespreadinrealtermssince2014.U.S.EnergyInformationAdministrationShort-TermEnergyOutlookAugust20228ThewidepricespreadreflectssubstantiallylowergasolineinventoriesatNewYorkHarborandalongtheEastCoastthanontheGulfCoast.EastCoastweeklymotorgasolineinventorieshaveaveraged21%lessthanthefive-yearaveragesinceMay.Incontrast,GulfCoastweeklymotorgasolineinventorieshaveaveragedslightlymorethanthefive-yearaveragesinceMay.EastCoastrefineriesproducearelativelysmallshareoftheoverallvolumeofgasolinethatisconsumedintheregion.TheEastCoasthashistoricallyimportedgasolinefromEuropeandCanadaandreceivedtransfersfromtheU.S.GulfCoasttomeetitsconsumptionneeds.LowergasolineinventoriesalongtheEastCoastreflecttheimpactofnotonlyreducedimportsofgasolinefromEuropebutalsotheclosureofwhathadbeentheEastCoast’slargestrefineryin2019,aswellastheclosureoftheexport-orientedCanadianCome-by-Chancerefineryin2020.Withtheselostsourcesofsupply,GulfCoastrefinershaveincreasedrefineryutilizationandgasolineproductioninresponsetothehighprices,butlogisticalcapacityconstraintslimitthevolumeofgasolinethatcanbemovedtoEastCoastmarkets,accountingforthewideregionaldiscrepancyininventorylevels.TradepressreportshavesuggestedthatlinespacealongtheColonialPipeline(thelargestpetroleumproductpipelineconnectingtheGulfCoasttotheEastCoast),whichistradedonsecondarymarkets,waspricingatitshighestpremiumtothepipeline’stariffratesince2015.GasolinethatcannotbemovedalongtheColonialPipelineorthesmallerProductsSEPipelinemustinsteadbemovedfromtheGulfCoasttotheEastCoastbyrailorJonesActcomplianttanker.ThecurrentleveloftheregionalpricespreadsuggeststhatevencapacityonmoreexpensivemodesoftransitbetweentheGulfCoasttotheEastCoast,suchasrailortanker,arebeingusedtotheircurrentcapacity.Increasedtankertraffic,moreavailablespaceonraillines,orevenincreasedlongdistancetruckingtraffictocertainregionsmaybecometemporarilyviableatcurrentpricespreadsifmarketparticipantsbelievethepricespreadswilllastlongenoughtojustifythediversionofresources.U.S.EnergyInformationAdministrationShort-TermEnergyOutlookAugust20229Ultra-lowsulfurdieselprices:Thefront-monthfuturespriceforultra-lowsulfurdiesel(ULSD)fordeliveryinNewYorkHarborsettledat$3.34/galonAugust4,a60cents/galdecreasefromJuly1(Figure7).TheULSD-Brentcrackspread(thedifferencebetweenthepriceofULSDandthepriceofBrentcrudeoil)decreased18cents/galduringthesameperiodandsettledat$1.10/galonAugust4.ULSDpricesandcrackspreadsdecreasedthismonthtolevelsnotseensinceearlyApril,asconcernsaboutapotentialrecessionweighedontheeconomicoutlook.ComparedwithJune,JulyULSDpriceswere15%lower,andcrackspreadswere24%narrower,markingthefirstdeclineinULSDpricessincethebeginningoftheyear.However,ULSDpricesinJulywerestill71%higherthaninJuly2021,andULSDcrackspreadsforJulywerethreetimeswiderthaninJuly2021.Decliningcrudeoilpricesandlessdomesticconsumptionofdistillatecontributedtolowerdistillateprices.Weestimatedistillateconsumptiondecreasedby0.2millionb/d(4%)fromJuneto3.7millionb/dinJuly.ConsumptiontypicallydeclinesinJulyasstocksrebuildtoprepareforhigherdemandduringthefallharvestseasonandwinterheatingseason.However,weestimateU.S.distillateinventoriesdecreased1.8millionbarrels(2%)inJulytoreach109millionbarrels,or26%belowthefive-yearaverage.WeestimateU.S.distillateproductionaveraged5.1millionb/dinJuly,slightlybelowJune,whichhadseenthemostproductionsinceDecember2019.Strongglobaldistillatedemandcontinuestosupporthigherproductionand,withlowerdomesticconsumption,higher-than-averageexportsinJuly.Weforecastproductionwillremainabove2021levelsthroughtherestoftheyear.Internationaldistillateinventories:WesternsanctionsagainstRussia’spetroleumproductexportsfollowingitsfull-scaleinvasionofUkraineinFebruaryhavebeenamajordriverofglobaldistillatepricesthisyear.Evenbeforethesanctions,however,distillateinventoriesatallthreeU.S.EnergyInformationAdministrationShort-TermEnergyOutlookAugust202210majortradinghubs(NewYorkHarbor,Amsterdam-Rotterdam-Antwerp,andSingapore)startedtheyearbelowtheirrespectivefive-yearaverages(Figure8).U.S.distillateinventoriesincreasedtorecordhighsin2020whentheCOVID-19pandemicresultedinhistoricallylowconsumptionofpetroleumproducts.Asdemandreturned,inventorydrawdownsbeganintheUnitedStatesandfollowedoverseasbythebeginningof2021.AsofJuly29,2022,combineddistillateinventoriesintheEastCoastandtheGulfCoast(PADD1andPADD3)were31%belowthefive-yearaverage,andinventoriesatAmsterdam-Rotterdam-AntwerpandSingaporewerearound40%belowtheirfive-yearaverages.InadditiontosanctionsonRussia’sexports,reducedrefinerycapacityintheUnitedStatesandlowerquotasforexportsfromChinacontributedtodistillateinventorydraws.Lowinventoriesgloballyhaveputsustainedupwardpressureondistillateprices.Weforecasthigher-than-averagedomesticdistillateproductionwillbegincontributingtobuildinginventoriesinAugustwithoveralldomesticstocksreaching119millionbarrels,or17%shortofthefive-yearaverage,bytheendofthisyear.NaturalgasPrices:Thefront-monthnaturalgasfuturescontractfordeliveryattheHenryHubsettledat$8.12permillionBritishthermalunits(MMBtu)onAugust4,up$2.39/MMBtufromJuly1,2022(Figure9).Theaveragepriceforfront-monthnaturalgasfuturescontractsinJulywas$7.19/MMBtu,down41cents/MMBtufromJune’saverageof$7.60/MMBtuwhenthefront-monthnaturalgasfuturespricetopped$9.00/MMBtuontwodays.U.S.EnergyInformationAdministrationShort-TermEnergyOutlookAugust202211NaturalgasinjectionsintostorageinJunewere2%higherthanthefive-year(2017–2021)average.ThattrendreversedinJulyas10%lessnaturalgaswasinjectedintostoragethanthefive-yearaverage.WeestimatethatstorageinventoriesendedJulyat2,493billioncubicfeet(Bcf),12%lessthanthefive-yearaveragelevel.Thefront-monthHenryHubfuturespricefellfrom$9.29/MMBtuonJune7,thedaybeforetheoutageatFreeportLNG,to$5.42/MMBtuonJune30,likelybecauseofmarketanticipationthatthedecreaseinnaturalgasavailableforexportwouldleadtoanincreaseinnaturalgassupplyavailableintheU.S.market.Withmorenaturalgassupplyavailable,marketparticipantsmayhaveanticipatedmorenaturalgasinjectionsintostorage.However,higher-than-normaltemperaturesinJulyincreasedconsumptionofnaturalgasforelectricpowergenerationtomeetair-conditioningdemand.Weestimatethatanaverageof41.8billioncubicfeetperday(Bcf/d)ofnaturalgaswasconsumedintheelectricpowersectorduringJuly,2.2Bcf/dmorethanthefive-yearaverageand5.0Bcf/dmorethaninJune.Atthesametime,weestimatethatdrynaturalgasproductionaveraged96.4Bcf/dinJuly,down0.6Bcf/dfromJune.Summerspacecooling:DuringMay,June,andJuly,theUnitedStatesexperienced800cumulativecoolingdegreedays(CDD),or69(9%)morethantheprior10-year(2011–2020)average(Figure10),andthemostCDDsforthistimeperiodsince2018.Higher-than-normaltemperaturesledtomoreconsumptionofnaturalgasforelectricpowergenerationtomeetair-conditioningdemand.Weestimatethatnaturalgasconsumptionintheelectricpowersectoraveraged36.2Bcf/dfromMaythroughJuly,2.1Bcf/dmorethanthesametimeperiodin2021and3.4Bcf/dmorethanthefive-yearaverage.Thestrongdemandhasledtolower-than-averageinjectionsintonaturalgasstorageforthreeofthefourmonthssofarduringthisinjectionseason(April–October)andhascontributedtothedeficitinthestorageinventorycomparedwiththefive-yearaverage.Thesustainedlower-than-averagestorageinventorieshaveputupwardpressureontheHenryHubspotnaturalgasprice.U.S.EnergyInformationAdministrationShort-TermEnergyOutlookAugust202212Naturalgasshareofelectricitygeneration:Inrecentyears,theelectricpowersectorsubstitutednaturalgas-firedgenerationwithcoal-firedgenerationwhennaturalgaspricesrose.However,inrecentmonths,coalpowerplantshaverespondedlesstopricethaninthepast,mostlikelyasaresultofcontinuedcoalcapacityretirements,constraintsinfueldeliverytocoalplants,andlower-than-averagestocksatcoalplants.Additionally,growthinelectricitygenerationcapacityfromrenewablesourcesislimitingthedispatchofbothcoalandnaturalgas.TheHenryHubspotnaturalgaspricehasremainedelevatedsincethebeginningoftheyear,butnaturalgashasmaintainedamorethan60%shareoffossil-fuelsourcedelectricitygeneration(Figure11).TheHenryHubspotpriceincreased$3.76/MMBtufromJanuarytoMay,butthenaturalgasshareoffossil-fuelsourcedelectricitygenerationalsoincreasedfrom60%inJanuaryto67%inMaydespitethehigherfuelcost.U.S.EnergyInformationAdministrationShort-TermEnergyOutlookAugust202213Notableforecastchanges•ThisSTEOincorporatesourchangedforecastfortheBrentandWTIcrudeoilpricespread.ChangestosourcesofEurope’scrudeoilimportsfollowingRussia’sfull-scaleinvasionofUkraineandtheEU’ssubsequentpetroleumimportbanhavecontributedtoredirectionsinoiltradeflows.EuropeancountriesareimportingmorecrudeoilfromtheUnitedStatesandexportinglesscrudeoiltocountriesinAsia,contributingtothedevelopmentofacrudeoilimportpricepremiuminEurope.Asaresult,weanticipatethistrendwillmaintainawiderpricespreadbetweenBrentandWTIcrudeoilof$6/bin2023,whichis$2/bwiderthanintheJulySTEO.•Naturalgaspriceshaveriseninrecentweeksinresponsetothesooner-than-expectedre-openingoftheFreeportLNGexportterminalandongoinghotweather.Asaresult,wehaveincreasedourforecastfornaturalgasprices.WenowforecastthattheHenryHubpricewillaverage$7.54/MMBtuduringthesecondhalfof2022comparedwithaforecastof$5.97/MMBtuinthelastSTEO.Wehavealsoraisedourforecastaveragepricefor2023from$4.76/MMBtuto$5.10/MMBtu.•Wehaverevisedourmodelingofelectricitysupplytobetterreflectregionaldifferencesinfuelcosts.Thischange,alongwithahigherforecastnaturalgasprice,hascontributedtosomesignificantincreasesinourforecastforwholesaleelectricityprices,particularlyintheNortheast.InthecurrentSTEO,weforecastwinterwholesalepricesinISONewEnglandwillaverage$176permegawatthour(MWh)betweenDecemberandFebruarycomparedwith$57/MWhinthepreviousSTEO.Thelargeincreaseinforecastpricesreflectsupdatestoourassumptionaboutthatregion’snaturalgascostsforthiswinter.WealsoraisedourforecastelectricitypricesinTexas’sERCOTmarket.•Youcanfindmoreinformationinthedetailedtableofforecastchanges.ThisreportwaspreparedbytheU.S.EnergyInformationAdministration(EIA),thestatisticalandanalyticalagencywithintheU.S.DepartmentofEnergy.Bylaw,EIA'sdata,analyses,andforecastsareindependentofapprovalbyanyotherofficeroremployeeoftheU.S.Government.TheviewsinthisreportthereforeshouldnotbeconstruedasrepresentingthoseoftheU.S.DepartmentofEnergyorotherfederalagencies.www.eia.govU.S.EnergyInformationAdministrationIndependentStatistics&AnalysisShort-TermEnergyOutlookChartGalleryAugust9,20220204060801001201401601802002202017201820192020202120222023Sources:U.S.EnergyInformationAdministration,Short-TermEnergyOutlook,August2022,CMEGroup,Bloomberg,L.P.,andRefinitivanLSEGBusinessNote:ConfidenceintervalderivedfromoptionsmarketinformationforthefivetradingdaysendingAug4,2022.Intervalsnotcalculatedformonthswithsparsetradinginnear-the-moneyoptionscontracts.WestTexasIntermediate(WTI)crudeoilpriceandNYMEXconfidenceintervalsdollarsperbarrelWestTexasIntermediate(WTI)spotpriceWestTexasIntermediate(WTI)crudeoilpriceandNYMEXconfidenceintervalsdollarsperbarrel95%NYMEXfuturespriceconfidenceintervalupperboundSTEOforecastNYMEXfuturesprice95%NYMEXfuturespriceconfidenceinterval-0.420.841.05-0.48-1.00-0.75-0.50-0.250.000.250.500.751.001.252020202120222023ComponentsofannualgasolinepricechangesdollarspergallonBrentcrudeoilpricewholesalemarginovercruderetailmarginoverwholesalenetchangeforecast0.000.501.001.502.002.503.003.504.004.505.005.506.0020192020202120222023monthlyretailregulargasolineannualaveragegasolinemonthlyBrentcrudeoilannualaverageBrentU.S.gasolineandcrudeoilpricesdollarspergallonforecastSource:U.S.EnergyInformationAdministration,Short-TermEnergyOutlook,August2022,andRefinitivanLSEGBusiness-0.420.841.05-0.48-1.00-0.75-0.50-0.250.000.250.500.751.001.252020202120222023ComponentsofannualgasolinepricechangesdollarspergallonBrentcrudeoilpricewholesalemarginovercruderetailmarginoverwholesalenetchangeforecast0.000.501.001.502.002.503.003.504.004.505.005.506.0020192020202120222023monthlyretailregulargasolineannualaveragegasolinemonthlyBrentcrudeoilannualaverageBrentU.S.gasolineandcrudeoilpricesdollarspergallonforecastSource:U.S.EnergyInformationAdministration,Short-TermEnergyOutlook,August2022,andRefinitivanLSEGBusiness-0.500.731.52-0.67-1.50-1.25-1.00-0.75-0.50-0.250.000.250.500.751.001.251.501.752020202120222023ComponentsofannualdieselpriceschangesdollarspergallonBrentcrudeoilpricewholesalemarginovercruderetailmarginoverwholesalenetchangeforecast0.000.501.001.502.002.503.003.504.004.505.005.506.006.507.0020192020202120222023monthlyretaildieselannualaveragedieselmonthlyBrentcrudeoilBrentannualaverageU.S.dieselandcrudeoilpricesdollarspergallonforecastSource:U.S.EnergyInformationAdministration,Short-TermEnergyOutlook,August2022,andRefinitivanLSEGBusiness-0.500.731.52-0.67-1.50-1.25-1.00-0.75-0.50-0.250.000.250.500.751.001.251.501.752020202120222023ComponentsofannualdieselpriceschangesdollarspergallonBrentcrudeoilpricewholesalemarginovercruderetailmarginoverwholesalenetchangeforecast0.000.501.001.502.002.503.003.504.004.505.005.506.006.507.0020192020202120222023monthlyretaildieselannualaveragedieselmonthlyBrentcrudeoilBrentannualaverageU.S.dieselandcrudeoilpricesdollarspergallonforecastSource:U.S.EnergyInformationAdministration,Short-TermEnergyOutlook,August2022,andRefinitivanLSEGBusiness051015202530352017201820192020202120222023HenryHubnaturalgaspriceandNYMEXconfidenceintervalsdollarspermillionBtuSources:U.S.EnergyInformationAdministration,Short-TermEnergyOutlook,August2022,CMEGroup,andRefinitivanLSEGBusinessNote:ConfidenceintervalderivedfromoptionsmarketinformationforthefivetradingdaysendingAug4,2022.Intervalsnotcalculatedformonthswithsparsetradinginnear-the-moneyoptionscontracts.95%NYMEXfuturespriceconfidenceintervalupperboundSTEOforecastNYMEXfuturesprice95%NYMEXfuturespriceconfidenceintervallowerboundHenryHubspotprice0510152025201820192020202120222023monthlyresidentialpriceannualaverageresidentialmonthlyHenryHubspotpriceHenryHubannualaverageU.S.naturalgaspricesdollarsperthousandcubicfeetforecastSources:U.S.EnergyInformationAdministration,Short-TermEnergyOutlook,August2022,andRefinitivanLSEGBusinessforecast80859095100105Q1Q2Q3Q4Q1Q2Q3Q4Q1Q2Q3Q4Q1Q2Q3Q4Q1Q2Q3Q4Q1Q2Q3Q4Q1Q2Q3Q42017201820192020202120222023Worldliquidfuelsproductionandconsumptionbalancemillionbarrelsperdayworldproductionworldconsumption//0-4-202468Source:U.S.EnergyInformationAdministration,Short-TermEnergyOutlook,August2022impliedstockbuildimpliedstockdrawforecast80859095100105Q1Q2Q3Q4Q1Q2Q3Q4Q1Q2Q3Q4Q1Q2Q3Q4Q1Q2Q3Q4Q1Q2Q3Q4Q1Q2Q3Q42017201820192020202120222023Worldliquidfuelsproductionandconsumptionbalancemillionbarrelsperdayworldproductionworldconsumption//0-4-202468Source:U.S.EnergyInformationAdministration,Short-TermEnergyOutlook,August2022impliedstockbuildimpliedstockdraw0123456Jan2020Jan2021Jan2022EstimatedunplannedliquidfuelsproductionoutagesamongOPECandnon-OPECproducersmillionbarrelsperdaySource:U.S.EnergyInformationAdministration,Short-TermEnergyOutlook,August2022non-OPECotherUnitedStatesCanadaRussiaOPECVenezuelaSaudiArabiaIranKuwaitIraqNigeria-9.05.52.12.1-10-8-6-4-202468102020202120222023ComponentsofannualchangemillionbarrelsperdayworldchangeOrganizationofEconomicCooperationandDevelopment(OECD)non-OECDforecast7075808590951001052020202120222023monthlyhistorymonthlyforecastannualaverageWorldliquidfuelsconsumptionmillionbarrelsperday//0Source:U.S.EnergyInformationAdministration,Short-TermEnergyOutlook,August2022-9.05.52.12.1-10-8-6-4-202468102020202120222023ComponentsofannualchangemillionbarrelsperdayworldchangeOrganizationofEconomicCooperationandDevelopment(OECD)non-OECDforecast7075808590951001052020202120222023monthlyhistorymonthlyforecastannualaverageWorldliquidfuelsconsumptionmillionbarrelsperday//0Source:U.S.EnergyInformationAdministration,Short-TermEnergyOutlook,August2022-9.05.52.12.1-12-10-8-6-4-2024682020202120222023AnnualchangeinworldliquidfuelsconsumptionmillionbarrelsperdaySource:U.S.EnergyInformationAdministration,Short-TermEnergyOutlook,August2022forecastworldothernon-OECDMiddleEastIndiaChinaotherOECDUnitedStates-6.41.84.41.2-8-6-4-2024682020202120222023ComponentsofannualchangemillionbarrelsperdayforecastOPECcountriesnon-OPECEurasiaNorthAmericaLatinAmericaothernon-OPEC808590951001052020202120222023monthlyhistorymonthlyforecastannualaverageWorldcrudeoilandliquidfuelsproductionmillionbarrelsperday//Source:U.S.EnergyInformationAdministration,Short-TermEnergyOutlook,August2022-6.41.84.41.2-8-6-4-2024682020202120222023ComponentsofannualchangemillionbarrelsperdayforecastOPECcountriesnon-OPECEurasiaNorthAmericaLatinAmericaothernon-OPECnetchange808590951001052020202120222023monthlyhistorymonthlyforecastannualaverageWorldcrudeoilandliquidfuelsproductionmillionbarrelsperday//0Source:U.S.EnergyInformationAdministration,Short-TermEnergyOutlook,August202230204060801001202020202120222023Worldliquidfuelsconsumptionmillionbarrelsperdaynon-OECDOrganizationforEconomicCooperationandDevelopment(OECD)0204060801001202020202120222023Worldliquidfuelsproductionmillionbarrelsperdaynon-OPECOrganizationofthePetroleumExportingforecastSource:U.S.EnergyInformationAdministration,Short-TermEnergyOutlook,August2022forecast0204060801001202020202120222023Worldliquidfuelsconsumptionmillionbarrelsperdaynon-OECDOrganizationforEconomicCooperationandDevelopment(OECD)0204060801001202020202120222023Worldliquidfuelsproductionmillionbarrelsperdaynon-OPECOrganizationofthePetroleumExportingCountries(OPEC)forecastSource:U.S.EnergyInformationAdministration,Short-TermEnergyOutlook,August2022forecast0123456201220132014201520162017201820192020202120222023Source:U.S.EnergyInformationAdministration,Short-TermEnergyOutlook,August2022Note:Blacklinerepresents2012-2021average(2.8millionbarrelsperday).forecast2012-2021averageOrganizationofthePetroleumExportingCountries(OPEC)surpluscrudeoilproductioncapacitymillionbarrelsperdayforecast30405060708090100Jan2017Jan2018Jan2019Jan2020Jan2021Jan2022Jan2023Source:U.S.EnergyInformationAdministration,Short-TermEnergyOutlook,August2022OrganizationforEconomicCooperationandDevelopment(OECD)commercialinventoriesofcrudeoilandotherliquidsdaysofsupplymonthlyrangefromJanuary2017-December2021//0-0.97-0.060.610.84-2.0-1.5-1.0-0.50.00.51.01.52.02020202120222023ComponentsofannualchangemillionbarrelsperdayFederalGulfofMexico(GOM)Lower48excludingGOMAlaskanetchangeforecast024681012142020202120222023monthlyhistorymonthlyforecastannualaverageU.S.crudeoilproductionmillionbarrelsperdaySource:U.S.EnergyInformationAdministration,Short-TermEnergyOutlook,August2022-0.97-0.060.610.84-2.0-1.5-1.0-0.50.00.51.01.52.02020202120222023ComponentsofannualchangemillionbarrelsperdayFederalGulfofMexico(GOM)Lower48excludingGOMAlaskanetchangeforecast024681012142020202120222023monthlyhistorymonthlyforecastannualaverageU.S.crudeoilproductionmillionbarrelsperdaySource:U.S.EnergyInformationAdministration,Short-TermEnergyOutlook,August202223forecast275300325350375400425450475500525550575600Jan2017Jan2018Jan2019Jan2020Jan2021Jan2022Jan2023Source:U.S.EnergyInformationAdministration,Short-TermEnergyOutlook,August2022U.S.commercialcrudeoilinventoriesmillionbarrels//monthlyrangefromJanuary2017-December2021-0.890.321.371.17-2.00-1.50-1.00-0.500.000.501.001.502.002020202120222023Componentsofannualchangemillionbarrelsperdaybiofuelsnaturalgasplantliquidscrudeoilothernetchangeforecast05101520252020202120222023totalmonthlyproductionforecastannualaverageU.S.crudeoilandliquidfuelsproductionmillionbarrelsperdaySource:U.S.EnergyInformationAdministration,Short-TermEnergyOutlook,August2022-0.890.321.371.17-2.00-1.50-1.00-0.500.000.501.001.502.002020202120222023Componentsofannualchangemillionbarrelsperdaybiofuelsnaturalgasplantliquidscrudeoilothernetchangeforecast05101520252020202120222023totalmonthlyproductionforecastannualaverageU.S.crudeoilandliquidfuelsproductionmillionbarrelsperdaySource:U.S.EnergyInformationAdministration,Short-TermEnergyOutlook,August-2.361.600.550.41-3.00-2.00-1.000.001.002.002020202120222023Componentsofannualchangemotorgasolinedistillatefueljetfuelhydrocarbongasliquidsotherfuelsforecast05101520252020202120222023monthlyhistorymonthlyforecastannualaverageU.S.liquidfuelsproductsupplied(consumption)millionbarrelsperdaySource:U.S.EnergyInformationAdministration,Short-TermEnergyOutlook,August2022-2.361.600.550.41-3.00-2.00-1.000.001.002.002020202120222023Componentsofannualchangemillionbarrelsperdaymotorgasolinedistillatefueljetfuelhydrocarbongasliquidsotherfuelsforecast05101520252020202120222023monthlyhistorymonthlyforecastannualaverageU.S.liquidfuelsproductsupplied(consumption)millionbarrelsperdaySource:U.S.EnergyInformationAdministration,Short-TermEnergyOutlook,August20220233333333forecast6080100120140160180200220240260280Jan2017Jan2018Jan2019Jan2020Jan2021Jan2022Jan2023U.S.gasolineanddistillateinventoriesmillionbarrelsSource:U.S.EnergyInformationAdministration,Short-TermEnergyOutlook,August2022monthlyrangefromJanuary2017-December2021totalmotorgasolineinventorytotaldistillatefuelinventoryforecast-6-4-20246810Jan2016Jan2017Jan2018Jan2019Jan2020Jan2021Jan2022Jan2023Note:Petroleumproductandotherliquidsinclude:gasoline,distillatefuels,hydrocarbongasliquids,jetfuel,residualfueloil,unfinishedoils,otherhydrocarbons/oxygenates,andotheroils.Source:U.S.EnergyInformationAdministration,Short-TermEnergyOutlook,August2022U.S.netimportsofcrudeoilandliquidfuelsmillionbarrelsperdaycrudeoilnetimportstotalnetimportspetroleumproductandotherliquidsnetimports0.350.220.590.34-0.50-0.250.000.250.500.752020202120222023Componentsofannualchangemillionbarrelsperdaynetchangenaturalgasolinebutanespropaneethaneforecast2345672020202120222023monthlyproductionmonthlyforecastannualaverageU.S.naturalgasplantliquidsproductionmillionbarrelsperday//0Source:U.S.EnergyInformationAdministration,Short-TermEnergyOutlook,August20220.350.220.590.34-0.50-0.250.000.250.500.752020202120222023Componentsofannualchangemillionbarrelsperdaynetchangenaturalgasolinebutanespropaneethaneforecast2345672020202120222023monthlyproductionmonthlyforecastannualaverageU.S.naturalgasplantliquidsproductionmillionbarrelsperday//0Source:U.S.EnergyInformationAdministration,Short-TermEnergyOutlook,August20220230.090.180.270.08-0.50-0.250.000.250.502020202120222023Componentsofannualchangemillionbarrelsperdaynetchangenaturalgasolineethanepropanebutanesforecast0123452020202120222023monthlyhistorymonthlyforecastannualaverageU.S.hydrocarbongasliquidsproductsupplied(consumption)millionbarrelsperdaySource:U.S.EnergyInformationAdministration,Short-TermEnergyOutlook,August20220.090.180.270.08-0.50-0.250.000.250.502020202120222023Componentsofannualchangemillionbarrelsperdaynetchangenaturalgasolineethanepropanebutanesforecast0123452020202120222023monthlyhistorymonthlyforecastannualaverageU.S.hydrocarbongasliquidsproductsupplied(consumption)millionbarrelsperdaySource:U.S.EnergyInformationAdministration,Short-TermEnergyOutlook,August2022-3.0-2.5-2.0-1.5-1.0-0.50.00.520022004200620082010201220142016201820202022U.S.nettradeofhydrocarbongasliquids(HGL)millionbarrelsperdaynettradepropaneethanenaturalgasolinebutanesforecastSource:U.S.EnergyInformationAdministration,Short-TermEnergyOutlook,August2022netimportsnetexportsforecast0255075100125Jan2017Jan2018Jan2019Jan2020Jan2021Jan2022Jan2023monthlyrangefromJanuary2017-December2021Source:U.S.EnergyInformationAdministration,Short-TermEnergyOutlook,August2022U.S.commercialpropaneinventoriesmillionbarrelsNote:Excludespropylene.-1.02.43.83.8-2-10123452020202120222023ComponentsofannualchangebillioncubicfeetperdayU.S.non-GulfofMexicoU.S.GulfofMexiconetchangeforecast75808590951001051101152020202120222023monthlyhistorymonthlyforecastannualaverageU.S.marketednaturalgasproductionbillioncubicfeetperdaySource:U.S.EnergyInformationAdministration,Short-TermEnergyOutlook,August2022//0-1.02.43.83.8-2-10123452020202120222023ComponentsofannualchangebillioncubicfeetperdayU.S.non-GulfofMexicoU.S.GulfofMexiconetchangeforecast75808590951001051101152020202120222023monthlyhistorymonthlyforecastannualaverageU.S.marketednaturalgasproductionbillioncubicfeetperdaySource:U.S.EnergyInformationAdministration,Short-TermEnergyOutlook,August2022-2.0-0.32.2-1.3-4-3-2-101232020202120222023Componentsofannualchangebillioncubicfeetperdaynetchangeindustrialelectricpowerresidentialandcommercialotherforecast01020304050607080901001101202020202120222023monthlyhistorymonthlyforecastannualaverageU.S.naturalgasconsumptionbillioncubicfeetperdaySource:U.S.EnergyInformationAdministration,Short-TermEnergyOutlook,August2022-2.0-0.32.2-1.3-4-3-2-101232020202120222023Componentsofannualchangebillioncubicfeetperdaynetchangeindustrialelectricpowerresidentialandcommercialotherforecast01020304050607080901001101202020202120222023monthlyhistorymonthlyforecastannualaverageU.S.naturalgasconsumptionbillioncubicfeetperdaySource:U.S.EnergyInformationAdministration,Short-TermEnergyOutlook,August202223-30-20-100102030netstoragebuildsnetstoragewithdrawalsSource:U.S.EnergyInformationAdministration,Short-TermEnergyOutlook,August2022forecast-250255075100125Q1Q2Q3Q4Q1Q2Q3Q4Q1Q2Q3Q4Q1Q2Q3Q4Q1Q2Q3Q4Q1Q2Q3Q4Q1Q2Q3Q42017201820192020202120222023U.S.naturalgasproduction,consumption,andnetimportsbillioncubicfeetperdayconsumptionproductionnettrade(importsminusexports)-30-20-100102030netstoragebuildsnetstoragewithdrawalsSource:U.S.EnergyInformationAdministration,Short-TermEnergyOutlook,August2022forecast-250255075100125Q1Q2Q3Q4Q1Q2Q3Q4Q1Q2Q3Q4Q1Q2Q3Q4Q1Q2Q3Q4Q1Q2Q3Q4Q1Q2Q3Q42017201820192020202120222023U.S.naturalgasproduction,consumption,andnetimportsbillioncubicfeetperdayconsumptionproductionnettrade(importsminusexports)-5.3-7.5-10.5-12.5-14.9-25-20-15-10-5051020192020202120222023U.S.annualnaturalgastradebillioncubicfeetperdaygrossimportsasliquefiednaturalgasbypipelinenettradegrossexportsbypipelineasliquefiednaturalgasforecastSource:U.S.EnergyInformationAdministration,Short-TermEnergyOutlook,August2022forecast-50%-25%0%25%50%Source:U.S.EnergyInformationAdministration,Short-TermEnergyOutlook,August2022Percentdeviationfrom2017-2021average01,0002,0003,0004,0005,000Jan2017Jan2018Jan2019Jan2020Jan2021Jan2022Jan2023U.S.workingnaturalgasinstoragebillioncubicfeetstoragelevelforecastmonthlyrangefromJanuary2017-December2021forecast-50%-25%0%25%50%Source:U.S.EnergyInformationAdministration,Short-TermEnergyOutlook,August2022Percentdeviationfrom2017-2021average01,0002,0003,0004,0005,000Jan2017Jan2018Jan2019Jan2020Jan2021Jan2022Jan2023U.S.workingnaturalgasinstoragebillioncubicfeetstoragelevelforecastmonthlyrangefromJanuary2017-December2021-17143212-250-200-150-100-500501002020202120222023ComponentsofannualchangemillionshorttonsWesternregionAppalachianregionInteriorregionnetchangeforecast01020304050607020192020202120222023monthlyhistorymonthlyforecastannualaverageU.S.coalproductionmillionshorttonsSource:U.S.EnergyInformationAdministration,Short-TermEnergyOutlook,August2022-17143212-250-200-150-100-500501002020202120222023ComponentsofannualchangemillionshorttonsWesternregionAppalachianregionInteriorregionnetchangeforecast01020304050607020192020202120222023monthlyhistorymonthlyforecastannualaverageU.S.coalproductionmillionshorttonsSource:U.S.EnergyInformationAdministration,Short-TermEnergyOutlook,August2022-11069-5-48-125-100-75-50-2502550751001252020202120222023Componentsofannualchangemillionshorttonscokeplantselectricpowerretailandotherindustrynetchangeforecast01020304050607020192020202120222023monthlyhistorymonthlyforecastannualaverageU.S.coalconsumptionmillionshorttonsSource:U.S.EnergyInformationAdministration,Short-TermEnergyOutlook,August2022-11069-5-48-125-100-75-50-2502550751001252020202120222023Componentsofannualchangemillionshorttonscokeplantselectricpowerretailandotherindustrynetchangeforecast01020304050607020192020202120222023monthlyhistorymonthlyforecastannualaverageU.S.coalconsumptionmillionshorttonsSource:U.S.EnergyInformationAdministration,Short-TermEnergyOutlook,August2022forecast0255075100125150175200Jan2017Jan2018Jan2019Jan2020Jan2021Jan2022Jan2023U.S.electricpowercoalinventoriesmillionshorttonsmonthlyrangefromJanuary2017-December2021Source:U.S.EnergyInformationAdministration,Short-TermEnergyOutlook,August2022-987496-8-200-150-100-500501001502020202120222023Componentsofannualchangebillionkilowatthoursresidentialsalesindustrialsalescommercialandtransportationsalesdirectusenetchangeforecast20022525027530032535037540042520192020202120222023monthlyhistorymonthlyforecastU.S.electricityconsumptionbillionkilowatthours//0Source:U.S.EnergyInformationAdministration,Short-TermEnergyOutlook,August2022-987496-8-200-150-100-500501001502020202120222023Componentsofannualchangebillionkilowatthoursresidentialsalesindustrialsalescommercialandtransportationsalesdirectusenetchangeforecast20022525027530032535037540042520192020202120222023monthlyhistorymonthlyforecastU.S.electricityconsumptionbillionkilowatthours//0Source:U.S.EnergyInformationAdministration,Short-TermEnergyOutlook,August2022-0.8%2.7%-0.1%1.1%1.1%4.3%6.1%2.5%-2%-1%0%1%2%3%4%5%6%7%20162017201820192020202120222023Annualgrowthinnominalresidentialelectricitypricespercentforecast0123456789101112131415161720162017201820192020202120222023U.S.monthlynominalresidentialelectricitypricecentsperkilowatthourhistoryforecastSource:U.S.EnergyInformationAdministration,Short-TermEnergyOutlook,August2022-0.8%2.7%-0.1%1.1%1.1%4.3%6.1%2.5%-2%-1%0%1%2%3%4%5%6%7%20162017201820192020202120222023Annualgrowthinnominalresidentialelectricitypricespercentforecast0123456789101112131415161720162017201820192020202120222023U.S.monthlynominalresidentialelectricitypricecentsperkilowatthourhistoryforecastSource:U.S.EnergyInformationAdministration,Short-TermEnergyOutlook,August20220%5%10%15%20%25%30%35%40%45%50%201220132014201520162017201820192020202120222023percentshareforecast01,0002,0003,0004,000201220132014201520162017201820192020202120222023U.S.electricitygenerationbysource,allsectorsbillionkilowatthoursforecastSource:U.S.EnergyInformationAdministration,Short-TermEnergyOutlook,August2022naturalgascoalnuclearrenewables(non-hydro)hydropowerothersources0%5%10%15%20%25%30%35%40%45%50%201220132014201520162017201820192020202120222023percentshareforecast01,0002,0003,0004,000201220132014201520162017201820192020202120222023U.S.electricitygenerationbysource,allsectorsbillionkilowatthoursforecastSource:U.S.EnergyInformationAdministration,Short-TermEnergyOutlook,August2022naturalgascoalnuclearrenewables(non-hydro)hydropowerothersource0.110.641.210.92forecast-0.75-0.50-0.250.000.250.500.751.001.251.502020202120222023ComponentsofannualchangequadrillionBritishthermalunitsnetchangesolarwindhydropowerliquidbiofuelsgeothermalwoodbiomasswastebiomassforecast024681012141620192020202120222023U.S.renewableenergysupplyquadrillionBritishthermalunitsNote:Hydropowerexcludespumpedstoragegeneration.Liquidsincludeethanol,biodiesel,renewablediesel,otherbiofuels,andbiofuellossesandcoproducts.WastebiomassincludesmunicipalwastefrombiogenicSource:U.S.EnergyInformationAdministration,Short-TermEnergyOutlook,August20220.110.641.210.92forecast-0.75-0.50-0.250.000.250.500.751.001.251.502020202120222023ComponentsofannualchangequadrillionBritishthermalunitsnetchangesolarwindhydropowerliquidbiofuelsgeothermalwoodbiomasswastebiomassforecast024681012141620192020202120222023U.S.renewableenergysupplyquadrillionBritishthermalunitsNote:Hydropowerexcludespumpedstoragegeneration.Liquidsincludeethanol,biodiesel,renewablediesel,otherbiofuels,andbiofuellossesandcoproducts.Wastebiomassincludesmunicipalwastefrombiogenicsources,landfillgas,andnon-woodwaste.Source:U.S.EnergyInformationAdministration,Short-TermEnergyOutlook,August2022-57029671-80forecast-700-600-500-400-300-200-10001002003004005006002020202120222023Componentsofannualchangemillionmetrictonsnaturalgaspetroleumcoalnetchangeforecast05001,0001,5002,0002,5003,0003,5004,0004,5005,0005,5006,00020192020202120222023totalenergypetroleumnaturalgascoalU.S.annualCO2emissionsbysourcemillionmetrictonsSource:U.S.EnergyInformationAdministration,Short-TermEnergyOutlook,August2022-57029671-80forecast-700-600-500-400-300-200-10001002003004005006002020202120222023Componentsofannualchangemillionmetrictonsnaturalgaspetroleumcoalnetchangeforecast05001,0001,5002,0002,5003,0003,5004,0004,5005,0005,5006,00020192020202120222023totalenergypetroleumnaturalgascoalU.S.annualCO2emissionsbysourcemillionmetrictonsSource:U.S.EnergyInformationAdministration,Short-TermEnergyOutlook,August20220%1%2%3%4%5%6%7%8%9%10%20032005200720092011201320152017201920212023U.S.annualenergyexpendituresshareofgrossdomesticproductSource:U.S.EnergyInformationAdministration,Short-TermEnergyOutlook,August2022forecast02004006008001,0001,2001,4001,600totalsummer050100150200250300350400AprilMayJuneJulyAugustSeptemberU.S.summercoolingdegreedayspopulation-weighted20202021202220232012-2021averagewarmercoolerNote:EIAcalculationsbasedonNationalOceanicandAtmosphericAdministration(NOAA)data.ProjectionsreflectNOAA's14-16monthoutlook.Source:U.S.EnergyInformationAdministration,Short-TermEnergyOutlook,August202202004006008001,0001,2001,4001,600totalsummer050100150200250300350400AprilMayJuneJulyAugustSeptemberU.S.summercoolingdegreedayspopulation-weighted20202021202220232012-2021averagewarmercoolerNote:EIAcalculationsbasedonNationalOceanicandAtmosphericAdministration(NOAA)data.ProjectionsreflectNOAA's14-16monthoutlook.Source:U.S.EnergyInformationAdministration,Short-TermEnergyOutlook,August202201,0002,0003,0004,000totalwinter02505007501,000OctoberNovemberDecemberJanuaryFebruaryMarch2019/202020/212021/222022/23previous10-winteraverageU.S.winterheatingdegreedayspopulation-weightedcoolerwarmerNote:EIAcalculationsbasedonNationalOceanicandAtmosphericAdministration(NOAA)data.ProjectionsreflectNOAA's14-16monthoutlook.Source:U.S.EnergyInformationAdministration,Short-TermEnergyOutlook,August202201,0002,0003,0004,000totalwinter02505007501,000OctoberNovemberDecemberJanuaryFebruaryMarch2019/202020/212021/222022/23previous10-winteraverageU.S.winterheatingdegreedayspopulation-weightedcoolerwarmerNote:EIAcalculationsbasedonNationalOceanicandAtmosphericAdministration(NOAA)data.ProjectionsreflectNOAA's14-16monthoutlook.Source:U.S.EnergyInformationAdministration,Short-TermEnergyOutlook,August2022Q1Q2Q3Q4Q1Q2Q3Q4Q1Q2Q3Q4202120222023EnergyProductionCrudeOilProduction(a)(millionbarrelsperday).............................10.8211.3411.1811.6611.4611.6912.0112.2812.3912.5012.8213.1011.2511.8612.70DryNaturalGasProduction(billioncubicfeetperday)..........................90.5993.1593.8696.5294.6096.6197.0298.0998.90100.13100.52100.5193.5596.59100.02CoalProduction(millionshorttons).....................................140143148147149142152156151144157149578599601EnergyConsumptionLiquidFuels(millionbarrelsperday).............................18.4520.0320.2120.4120.2220.0620.2120.8520.3520.7420.8621.0319.7820.3420.75NaturalGas(billioncubicfeetperday)..........................99.4471.9575.1085.62104.3074.9074.8186.9399.3471.9975.8088.4482.9785.1683.84Coal(b)(millionshorttons).....................................139125168114134122163123126108148112546541493Electricity(billionkilowatthoursperday)...................10.5110.2312.2210.1010.8710.6512.3310.2610.9310.5512.2210.3310.7711.0311.01Renewables(c)(quadrillionBtu)..........................................2.953.162.953.143.353.523.233.313.533.863.443.5112.2113.4114.34TotalEnergyConsumption(d)(quadrillionBtu)..........................................25.0523.1624.5424.5726.4823.4924.6025.1125.9723.7424.9325.3797.3399.67100.01EnergyPricesCrudeOilWestTexasIntermediateSpot(dollarsperbarrel)......................................58.0966.1970.6177.2795.18108.9398.4892.3090.5089.5088.5088.0068.2198.7189.13NaturalGasHenryHubSpot(dollarspermillionBtu)..............................3.562.944.364.774.667.487.487.597.264.284.404.453.916.805.10Coal(dollarspermillionBtu)..............................1.911.932.032.052.192.222.222.202.212.202.182.151.982.212.19MacroeconomicRealGrossDomesticProduct(billionchained2012dollars-SAAR)........19,05619,36819,47919,80619,72819,61619,68519,81419,90620,01520,12920,24419,42719,71120,074Percentchangefromprioryear.................0.512.24.95.53.51.31.10.00.92.02.32.25.71.51.8GDPImplicitPriceDeflator(Index,2012=100)......................................115.8117.5119.3121.3123.7125.9127.3128.4129.3130.0130.8131.7118.5126.3130.4Percentchangefromprioryear.................2.14.14.65.96.87.16.75.84.53.32.82.64.26.63.3RealDisposablePersonalIncome(billionchained2012dollars-SAAR)........17,21915,80715,64115,46215,15215,13115,14115,26215,40615,64515,87216,08216,03215,17215,751Percentchangefromprioryear.................15.1-4.3-0.90.1-12.0-4.3-3.2-1.31.73.44.85.42.3-5.43.8ManufacturingProductionIndex(Index,2017=100)......................................96.998.399.2100.6101.6102.7103.0103.9103.8104.3104.9105.398.8102.8104.6Percentchangefromprioryear.................-0.815.85.14.54.84.53.83.22.11.61.91.45.84.11.8WeatherU.S.HeatingDegree-Days........................2,107472511,3072,149493701,5242,106488771,5273,9364,2354,198U.S.CoolingDegree-Days........................50411902127464668909544392843941,4901,4971,373Consequently,thehistoricaldatamaynotpreciselymatchthosepublishedintheMERortheAnnualEnergyReview(AER).Table1.U.S.EnergyMarketsSummaryU.S.EnergyInformationAdministrationShort-TermEnergyOutlook-August2022202120222023Year(a)Includesleasecondensate.(b)TotalconsumptionincludesIndependentPowerProducer(IPP)consumption.(c)Renewableenergyincludesminorcomponentsofnon-marketedrenewableenergythatisneitherboughtnorsold,eitherdirectlyorindirectly,asinputstomarketedenergy.EIAdoesnotestimateorprojectend-useconsumptionofnon-marketedrenewableenergy.(d)TheconversionfromphysicalunitstoBtuiscalculatedusingasubsetofconversionfactorsusedinthecalculationsofgrossenergyconsumptioninEIA’sMonthlyEnergyReview(MER).(e)Referstotherefineraverageacquisitioncost(RAC)ofcrudeoil.-=nodataavailableNotes:EIAcompletedmodelingandanalysisforthisreportonAugust4,2022.Theapproximatebreakbetweenhistoricalandforecastvaluesisshownwithhistoricaldataprintedinbold;estimatesandforecastsinitalics.Pricesarenotadjustedforinflation.Historicaldata:LatestdataavailablefromEnergyInformationAdministrationdatabasessupportingthefollowingreports:PetroleumSupplyMonthly,DOE/EIA-0109;PetroleumSupplyAnnual,DOE/EIA-0340/2;WeeklyPetroleumStatusReport,DOE/EIA-0208;PetroleumMarketingMonthly,DOE/EIA-0380;NaturalGasMonthly,DOE/EIA-0130;ElectricPowerMonthly,DOE/EIA-0226;QuarterlyCoalReport,DOE/EIA-0121;andInternationalPetroleumMonthly,DOE/EIA-0520.Minordiscrepancieswithpublishedhistoricaldataareduetoindependentrounding.Forecasts:EIAShort-TermIntegratedForecastingSystem.U.S.macroeconomicforecastsarebasedontheS&PGlobalmodeloftheU.S.Economy.WeatherforecastsfromNationalOceanicandAtmosphericAdministration.Q1Q2Q3Q4Q1Q2Q3Q4Q1Q2Q3Q4202120222023CrudeOil(dollarsperbarrel)WestTexasIntermediateSpotAverage..............................58.0966.1970.6177.2795.18108.9398.4892.3090.5089.5088.5088.0068.2198.7189.13BrentSpotAverage.............................................................61.1268.9173.4579.42101.17113.84105.8298.3096.5095.5094.5094.0070.89104.7895.13U.S.ImportedAverage........................................................55.3364.8168.4173.6789.85107.8095.9989.4587.7586.7585.7585.2565.9195.5886.47U.S.RefinerAverageAcquisitionCost................................57.1466.1170.3176.3792.62109.5896.9990.5488.7587.7586.7586.2567.8397.4787.36U.S.LiquidFuels(centspergallon)RefinerPricesforResaleGasoline..........................................................................180216232243278376319288276286281270219316278DieselFuel.......................................................................178204219241301418350324296291290292211348292FuelOil............................................................................162180197222284419338311287275275281188333282RefinerPricestoEndUsersJetFuel............................................................................163182199226283400339307290281281284195333284No.6ResidualFuelOil(a)...............................................162181194211252260238218226223222221190242223RetailPricesIncludingTaxesGasolineRegularGrade(b)..............................................256297316333371450429378356366363352302407359GasolineAllGrades(b)....................................................265306325343380460440391369379376366311418373On-highwayDieselFuel...................................................290321336366432549502439422413407414329481414HeatingOil.......................................................................272283297346415554496449417390374378300452396NaturalGasHenryHubSpot(dollarsperthousandcubicfeet)................3.703.064.534.964.847.777.787.897.544.454.574.624.067.075.29HenryHubSpot(dollarspermillionBtu).............................3.562.944.364.774.667.487.487.597.264.284.404.453.916.805.10U.S.RetailPrices(dollarsperthousandcubicfeet)IndustrialSector...............................................................5.734.095.116.866.827.968.569.049.226.275.535.835.508.036.73CommercialSector...........................................................7.548.8510.1210.279.9811.4212.9212.2112.1711.8810.989.568.8211.1511.25ResidentialSector............................................................9.7513.8720.3813.8112.3215.9122.4115.7714.9016.5520.4813.0012.2714.5614.95U.S.ElectricityPowerGenerationFuelCosts(dollarspermillionBtu)Coal.................................................................................1.911.932.032.052.192.222.222.202.212.202.182.151.982.212.19NaturalGas.....................................................................7.243.264.365.425.687.197.487.947.814.474.574.794.977.115.33ResidualFuelOil(c).........................................................11.2813.0914.2216.1016.9125.6321.9519.0818.2818.4617.5817.3013.6620.2317.90DistillateFuelOil..............................................................13.5415.2016.1918.0321.1130.3827.2224.7722.9622.2322.0622.3015.5024.7622.48PricestoUltimateCustomers(centsperkilowatthour)IndustrialSector...............................................................7.096.927.627.387.428.188.257.667.687.958.027.447.267.897.78CommercialSector...........................................................10.9911.0711.5911.3711.6312.0212.1911.9812.2512.4212.3711.8511.2711.9712.23ResidentialSector............................................................13.1013.8413.9913.9713.9814.8014.8014.6614.6615.4215.0414.6013.7214.5614.93Table2.EnergyPricesU.S.EnergyInformationAdministrationShort-TermEnergyOutlook-August2022202120222023YearForecasts:EIAShort-TermIntegratedForecastingSystem.(a)Averageforallsulfurcontents.(b)Averageself-servicecashprice.(c)IncludesfueloilsNo.4,No.5,No.6,andtoppedcrude.-=nodataavailableNotes:EIAcompletedmodelingandanalysisforthisreportonAugust4,2022.Theapproximatebreakbetweenhistoricalandforecastvaluesisshownwithhistoricaldataprintedinbold;estimatesandforecastsinitalics.Pricesarenotadjustedforinflation;pricesexcludetaxesunlessotherwisenoted.Historicaldata:LatestdataavailablefromEnergyInformationAdministrationdatabasessupportingthefollowingreports:PetroleumMarketingMonthly,DOE/EIA-0380;WeeklyPetroleumStatusReport,DOE/EIA-0208;NaturalGasMonthly,DOE/EIA-0130;ElectricPowerMonthly,DOE/EIA-0226;andMonthlyEnergyReview,DOE/EIA-0035.NaturalgasHenryHubandWTIcrudeoilspotpricesfromReuter'sNewsService(http://www.reuters.com).Minordiscrepancieswithpublishedhistoricaldataareduetoindependentrounding.Q1Q2Q3Q4Q1Q2Q3Q4Q1Q2Q3Q4202120222023Production(millionbarrelsperday)(a)OECD................................................30.2130.7931.1132.2231.6632.1332.8433.5633.8233.9334.1234.7031.0932.5534.14U.S.(50States)..............................17.7419.1119.0019.9019.4420.1820.5521.0521.1121.2621.5521.9718.9420.3121.48Canada...........................................5.625.375.495.685.665.715.745.855.925.885.905.915.545.745.90Mexico............................................1.931.951.901.921.911.891.891.861.901.871.831.791.921.891.85OtherOECD...................................4.924.374.734.714.654.344.664.794.884.924.845.024.684.614.91Non-OECD........................................62.5863.9965.6266.1367.2166.9868.3867.6866.9167.3367.5267.0164.5967.5767.19OPEC..............................................30.3430.8832.2833.1033.7533.7734.1134.2334.5834.5334.5334.5131.6633.9734.54CrudeOilPortion.........................25.0825.4926.8427.6728.1928.3428.6328.7129.0229.1029.0528.9926.2828.4729.04OtherLiquids(b)..........................5.265.395.445.445.565.435.485.525.565.435.485.525.385.505.50Eurasia............................................13.4213.6613.6314.2714.3913.4313.9213.4812.6612.3312.2712.2713.7513.8012.38China...............................................4.995.035.014.935.185.195.145.185.225.255.245.284.995.175.25OtherNon-OECD...........................13.8214.4214.7013.8213.9014.5915.2114.7814.4515.2215.4814.9414.1914.6215.03TotalWorldProduction......................92.7994.7996.7398.3598.8799.11101.21101.24100.72101.26101.64101.7195.68100.12101.33Non-OPECProduction......................62.4563.9164.4565.2465.1365.3467.1067.0166.1466.7367.1167.1964.0266.1566.80Consumption(millionbarrelsperday)(c)OECD................................................42.4544.0845.8246.8145.8945.0545.7846.6146.1445.6546.3346.7044.8145.8346.21U.S.(50States)..............................18.4520.0320.2120.4120.2220.0620.2120.8520.3520.7420.8621.0319.7820.3420.75U.S.Territories...............................0.210.190.190.200.220.200.200.220.220.200.210.220.200.210.21Canada...........................................2.262.242.502.402.332.362.482.482.442.392.492.472.352.412.45Europe............................................11.9112.6213.8313.8913.0813.3513.6713.3613.1313.1513.5513.3213.0713.3713.29Japan..............................................3.733.083.183.673.733.113.213.533.773.113.143.443.423.393.36OtherOECD...................................5.895.925.906.236.305.976.016.186.236.066.096.235.996.126.15Non-OECD........................................51.7852.2152.5353.6453.1353.3153.7854.1655.2355.6655.3054.9452.5453.6055.28Eurasia............................................4.664.735.094.954.484.334.694.624.284.434.754.664.864.534.53Europe............................................0.740.740.740.760.750.750.760.760.750.770.770.770.750.760.76China...............................................15.2715.4814.9915.3315.2515.2415.2415.7816.5216.4115.7815.7015.2715.3816.10OtherAsia.......................................13.4312.9812.8413.6913.8213.7913.4913.9114.4814.4513.8714.1713.2313.7514.24OtherNon-OECD...........................17.6818.2718.8718.9118.8319.1919.6119.0919.2119.5920.1319.6418.4419.1819.64TotalWorldConsumption..................94.2396.2998.36100.4599.0298.3699.56100.76101.37101.30101.63101.6497.3599.43101.49TotalCrudeOilandOtherLiquidsInventoryNetWithdrawals(millionbarrelsperday)U.S.(50States).................................0.470.510.370.770.750.380.450.64-0.01-0.44-0.110.400.530.56-0.04OtherOECD......................................0.870.150.970.67-0.23-0.36-0.68-0.360.210.150.03-0.150.66-0.410.06OtherStockDrawsandBalance.......0.110.840.280.66-0.38-0.77-1.42-0.760.450.330.07-0.320.47-0.840.13TotalStockDraw............................1.441.501.622.100.15-0.75-1.65-0.470.650.04-0.01-0.061.67-0.690.15End-of-periodCommercialCrudeOilandOtherLiquidsInventories(millionbarrels)U.S.CommercialInventory...............1,3021,2711,2411,1941,1541,1931,2401,2181,2231,2711,2831,2571,1941,2181,257OECDCommercialInventory............2,9082,8642,7452,6362,6162,6882,7982,8102,7952,8292,8392,8262,6362,8102,826OECD=OrganizationforEconomicCooperationandDevelopment:Australia,Austria,Belgium,Canada,Chile,theCzechRepublic,Denmark,Estonia,Finland,Table3a.InternationalPetroleumandOtherLiquidsProduction,Consumption,andInventoriesU.S.EnergyInformationAdministrationShort-TermEnergyOutlook-August2022202120222023Year(a)Supplyincludesproductionofcrudeoil(includingleasecondensates),naturalgasplantliquids,biofuels,otherliquids,andrefineryprocessinggains.(b)Includesleasecondensate,naturalgasplantliquids,otherliquids,andrefineryprocessinggain.Includesotherunaccounted-forliquids.(c)ConsumptionofpetroleumbytheOECDcountriesissynonymouswith"petroleumproductsupplied,"definedintheglossaryoftheEIAPetroleumSupplyMonthly,DOE/EIA-0109.Consumptionofpetroleumbythenon-OECDcountriesis"apparentconsumption,"whichincludesinternalconsumption,refineryfuelandloss,andbunkering.-=nodataavailableHistoricaldata:LatestdataavailablefromEnergyInformationAdministrationinternationalenergystatistics.Minordiscrepancieswithpublishedhistoricaldataareduetoindependentrounding.Forecasts:EIAShort-TermIntegratedForecastingSystem.France,Germany,Greece,Hungary,Iceland,Ireland,Israel,Italy,Japan,Latvia,Lithuania,Luxembourg,Mexico,theNetherlands,NewZealand,Norway,Poland,Portugal,Slovakia,Slovenia,SouthKorea,Spain,Sweden,Switzerland,Turkey,theUnitedKingdom,theUnitedStates.OPEC=OrganizationofthePetroleumExportingCountries:Algeria,Angola,Congo(Brazzaville),EquatorialGuinea,Gabon,Iran,Iraq,Kuwait,Libya,Nigeria,SaudiArabia,theUnitedArabEmirates,Venezuela.Notes:EIAcompletedmodelingandanalysisforthisreportonAugust4,2022.Theapproximatebreakbetweenhistoricalandforecastvaluesisshownwithhistoricaldataprintedinbold;estimatesandforecastsinitalics.Q1Q2Q3Q4Q1Q2Q3Q4Q1Q2Q3Q4202120222023NorthAmerica.......................................................25.2926.4226.3827.5127.0127.7928.1828.7728.9329.0129.2829.6826.4127.9429.23Canada....................................................................5.625.375.495.685.665.715.745.855.925.885.905.915.545.745.90Mexico.....................................................................1.931.951.901.921.911.891.891.861.901.871.831.791.921.891.85UnitedStates...........................................................17.7419.1119.0019.9019.4420.1820.5521.0521.1121.2621.5521.9718.9420.3121.48CentralandSouthAmerica.................................5.646.296.695.795.836.437.026.626.277.057.376.856.106.486.89Argentina.................................................................0.650.690.730.740.770.770.770.790.810.810.810.830.700.770.82Brazil.......................................................................3.223.894.213.423.333.834.353.893.494.254.574.033.693.854.09Colombia..................................................................0.770.740.770.770.770.770.750.730.690.690.670.650.760.750.67Ecuador...................................................................0.510.500.490.410.480.470.490.530.550.570.590.610.480.490.58OtherCentralandS.America..................................0.480.460.490.460.490.600.660.680.730.730.730.730.470.610.73Europe...................................................................4.343.844.124.124.083.784.074.204.294.334.264.454.104.034.33Norway....................................................................2.111.902.062.051.971.742.072.162.272.312.302.392.031.992.32UnitedKingdom.......................................................1.080.810.930.930.960.920.880.910.900.890.810.910.940.920.88Eurasia...................................................................13.4213.6613.6314.2714.3913.4313.9213.4812.6612.3312.2712.2713.7513.8012.38Azerbaijan................................................................0.750.700.710.710.700.670.630.630.620.600.600.610.720.660.61Kazakhstan..............................................................1.871.861.722.012.011.771.891.952.031.951.952.011.871.901.98Russia.....................................................................10.4210.7110.8011.1611.3010.5911.0010.519.609.379.319.2410.7810.859.38Turkmenistan...........................................................0.250.250.250.250.260.260.260.260.270.270.270.270.250.260.27OtherEurasia...........................................................0.130.140.140.130.140.140.140.140.140.140.130.130.130.140.14MiddleEast............................................................3.103.133.173.183.253.263.253.223.243.233.233.233.153.243.23Oman.......................................................................0.960.970.981.011.051.071.051.031.041.041.041.040.981.051.04Qatar.......................................................................1.801.821.831.831.851.861.861.861.861.861.861.861.821.861.86AsiaandOceania.................................................9.189.109.058.959.179.249.249.309.349.369.309.339.079.249.33Australia...................................................................0.460.420.490.480.450.460.480.480.480.470.460.460.460.470.47China.......................................................................4.995.035.014.935.185.195.145.185.225.255.245.284.995.175.25India.........................................................................0.900.890.890.880.880.930.900.900.900.920.890.880.890.900.90Indonesia.................................................................0.880.850.850.850.840.830.850.840.840.830.820.810.860.840.82Malaysia..................................................................0.660.620.570.590.610.590.630.650.650.650.640.640.610.620.64Vietnam...................................................................0.210.210.200.210.210.200.200.190.190.190.180.180.210.200.19Africa.....................................................................1.481.471.411.411.401.411.421.421.411.411.401.391.441.411.40Egypt.......................................................................0.660.670.650.660.660.670.660.670.650.650.650.650.660.660.65SouthSudan............................................................0.160.160.150.160.150.150.160.160.170.170.170.180.160.160.17Totalnon-OPECliquids.........................................62.4563.9164.4565.2465.1365.3467.1067.0166.1466.7367.1167.1964.0266.1566.80OPECnon-crudeliquids......................................5.265.395.445.445.565.435.485.525.565.435.485.525.385.505.50Non-OPEC+OPECnon-crude............................67.7169.3069.8970.6870.6870.7772.5872.5371.7072.1672.5972.7169.4071.6572.30Unplannednon-OPECProductionOutages.........0.610.500.800.860.761.35------0.70--Table3b.Non-OPECPetroleumandOtherLiquidsProduction(millionbarrelsperday)U.S.EnergyInformationAdministrationShort-TermEnergyOutlook-August2022202120222023YearNotallcountriesareshownineachregionandsumofreportedcountryvolumesmaynotequalregionalvolumes.Historicaldata:LatestdataavailablefromEnergyInformationAdministrationinternationalenergystatistics.Minordiscrepancieswithpublishedhistoricaldataareduetoindependentrounding.Forecasts:EIAShort-TermIntegratedForecastingSystem.-=nodataavailableOPEC=OrganizationofthePetroleumExportingCountries:Algeria,Angola,Congo(Brazzaville),EquatorialGuinea,Gabon,Iran,Iraq,Kuwait,Libya,Nigeria,SaudiArabia,theUnitedArabEmirates,Venezuela.Notes:EIAcompletedmodelingandanalysisforthisreportonAugust4,2022.Theapproximatebreakbetweenhistoricalandforecastvaluesisshownwithhistoricaldataprintedinbold;estimatesandforecastsinitalics.Supplyincludesproductionofcrudeoil(includingleasecondensates),naturalgasplantliquids,biofuels,otherliquids,andrefineryprocessinggains.Table3c.OPECCrudeOil(excludingcondensates)Production(millionbarrelsperday)Q1Q2Q3Q4Q1Q2Q3Q4Q1Q2Q3Q4202120222023CrudeOilAlgeria...............................................................0.870.880.920.950.971.00------0.90--Angola...............................................................1.111.081.111.131.151.19------1.11--Congo(Brazzaville)..........................................0.280.270.260.260.270.29------0.26--EquatorialGuinea.............................................0.110.100.100.090.090.09------0.10--Gabon...............................................................0.160.170.180.190.190.19------0.18--Iran....................................................................2.182.472.472.452.552.53------2.39--Iraq....................................................................3.943.984.074.254.304.42------4.06--Kuwait...............................................................2.332.362.452.532.612.69------2.42--Libya.................................................................1.181.161.181.121.060.76------1.16--Nigeria..............................................................1.311.321.281.311.271.11------1.30--SaudiArabia.....................................................8.498.539.559.8710.0810.30------9.11--UnitedArabEmirates.......................................2.612.652.762.862.943.04------2.72--Venezuela.........................................................0.520.530.530.680.700.73------0.56--OPECTotal....................................................25.0825.4926.8427.6728.1928.3428.6328.7129.0229.1029.0528.9926.2828.4729.04OtherLiquids(a)................................................5.265.395.445.445.565.435.485.525.565.435.485.525.385.505.50TotalOPECProduction....................................30.3430.8832.2833.1033.7533.7734.1134.2334.5834.5334.5334.5131.6633.9734.54CrudeOilProductionCapacityMiddleEast.......................................................25.2125.5025.5025.4825.4825.4625.5225.6025.9026.0326.0326.0325.4225.5226.00Other.................................................................6.126.105.965.985.835.465.355.685.825.865.805.746.045.585.80OPECTotal....................................................31.3331.5931.4531.4631.3130.9230.8731.2831.7231.8931.8331.7731.4631.1031.80SurplusCrudeOilProductionCapacityMiddleEast.......................................................5.665.524.213.533.002.482.222.552.682.782.762.764.722.562.74Other.................................................................0.590.590.400.270.120.110.020.020.020.020.020.020.460.070.02OPECTotal....................................................6.256.104.613.803.122.592.242.572.702.802.782.785.182.632.76UnplannedOPECProductionOutages..........2.492.122.152.031.982.42------2.20--(a)Includesleasecondensate,naturalgasplantliquids,otherliquids,refineryprocessinggain,andotherunaccounted-forliquids.U.S.EnergyInformationAdministrationShort-TermEnergyOutlook-August2022202120222023YearMinordiscrepancieswithpublishedhistoricaldataareduetoindependentrounding.Forecasts:EIAShort-TermIntegratedForecastingSystem.OPEC=OrganizationofthePetroleumExportingCountries:Iran,Iraq,Kuwait,SaudiArabia,andtheUnitedArabEmirates(MiddleEast);Algeria,Angola,Congo(Brazzaville),EquatorialGuinea,Gabon,Libya,Nigeria,andVenezuela(Other).Notes:EIAcompletedmodelingandanalysisforthisreportonAugust4,2022.Theapproximatebreakbetweenhistoricalandforecastvaluesisshownwithhistoricaldataprintedinbold;estimatesandforecastsinitalics.ForecastsarenotpublishedforindividualOPECcountries.Historicaldata:LatestdataavailablefromEnergyInformationAdministrationinternationalenergystatistics.Q1Q2Q3Q4Q1Q2Q3Q4Q1Q2Q3Q4202120222023NorthAmerica........................................................22.3423.9224.3124.5424.3124.0824.3324.9824.4624.8225.0425.2123.7824.4324.88Canada....................................................................2.262.242.502.402.332.362.482.482.442.392.492.472.352.412.45Mexico.....................................................................1.621.641.601.711.751.661.641.651.661.691.681.701.641.671.68UnitedStates...........................................................18.4520.0320.2120.4120.2220.0620.2120.8520.3520.7420.8621.0319.7820.3420.75CentralandSouthAmerica.................................5.886.026.246.366.206.256.366.376.196.336.436.376.136.296.33Brazil.......................................................................2.792.903.023.122.962.973.053.052.943.003.073.062.963.013.02Europe...................................................................12.6513.3614.5714.6513.8314.1014.4314.1213.8813.9214.3214.0913.8214.1214.05Eurasia...................................................................4.664.735.094.954.484.334.694.624.284.434.754.664.864.534.53Russia.....................................................................3.423.533.823.663.323.233.513.423.163.253.533.393.613.373.34MiddleEast............................................................8.088.509.038.778.819.089.518.789.079.299.829.218.609.059.35AsiaandOceania.................................................36.2735.3834.8236.7136.8736.0035.8437.3138.8837.9036.7337.4035.8036.5037.72China.......................................................................15.2715.4814.9915.3315.2515.2415.2415.7816.5216.4115.7815.7015.2715.3816.10Japan.......................................................................3.733.083.183.673.733.113.213.533.773.113.143.443.423.393.36India.........................................................................4.944.374.414.875.085.024.755.055.275.344.995.314.654.975.23Africa.....................................................................4.364.384.284.474.524.514.404.594.614.624.544.704.374.514.62TotalOECDLiquidFuelsConsumption...............42.4544.0845.8246.8145.8945.0545.7846.6146.1445.6546.3346.7044.8145.8346.21Totalnon-OECDLiquidFuelsConsumption........51.7852.2152.5353.6453.1353.3153.7854.1655.2355.6655.3054.9452.5453.6055.28TotalWorldLiquidFuelsConsumption...............94.2396.2998.36100.4599.0298.3699.56100.76101.37101.30101.63101.6497.3599.43101.49RealGrossDomesticProduct(a)WorldIndex,2015Q1=100....................................116.4117.5119.1120.7121.4121.4122.5123.4124.1124.8126.1127.4118.4122.2125.6Percentchangefromprioryear.............................3.411.55.14.64.33.32.92.22.32.83.03.26.13.22.8OECDIndex,2015=100.........................................109.6112.4113.8Percentchangefromprioryear.............................5.52.61.3Non-OECDIndex,2015=100.................................123.8128.4133.5Percentchangefromprioryear.............................6.53.64.0NominalU.S.DollarIndex(b)Index,2015Q1=100..............................................106.5106.1107.5109.1109.6113.0115.5116.1115.9115.4114.7113.9107.3113.5115.0Percentchangefromprioryear.............................-4.6-8.2-3.40.92.96.57.46.55.82.1-0.7-1.9-3.95.81.3Poland,Portugal,Slovakia,Slovenia,SouthKorea,Spain,Sweden,Switzerland,Turkey,theUnitedKingdom,theUnitedStates.Table3d.WorldPetroleumandOtherLiquidsConsumption(millionbarrelsperday)U.S.EnergyInformationAdministrationShort-TermEnergyOutlook-August2022202120222023(a)GDPvaluesfortheindividualcountriesintheindexesareconvertedtoU.S.dollarsatpurchasingpowerparityandthensummedtocreatevaluesfortheworld,OECD,andnon-OECD.HistoricalandforecastdataarefromOxfordEconomics,andquarterlyvaluesarereindexedto2015Q1byEIA.(b)DatasourceistheBoardofGovernorsoftheU.S.FederalReserveSystemNominalBroadTrade-WeightedDollarIndex.AnincreaseintheindexindicatesanappreciationoftheU.S.dollaragainstabasketofcurrenciesandadecreseintheindexindicatesadepreciationoftheU.S.dollaragainstabasketofcurrencies.HistoricalandforecastdataarefromOxfordEconomics,andquarterlyvaluesarereindexedto2015Q1byEIA.-=nodataavailableOECD=OrganizationforEconomicCooperationandDevelopment:Australia,Austria,Belgium,Canada,Chile,theCzechRepublic,Denmark,Estonia,Finland,France,Germany,Greece,Hungary,Iceland,Ireland,Israel,Italy,Japan,Latvia,Lithuania,Luxembourg,Mexico,theNetherlands,NewZealand,Norway,Notes:EIAcompletedmodelingandanalysisforthisreportonAugust4,2022.Theapproximatebreakbetweenhistoricalandforecastvaluesisshownwithhistoricaldataprintedinbold;estimatesandforecastsinitalics.Historicaldata:LatestdataavailablefromEnergyInformationAdministrationinternationalenergystatistics.Minordiscrepancieswithpublishedhistoricaldataareduetoindependentrounding.Forecasts:EIAShort-TermIntegratedForecastingSystem.Q1Q2Q3Q4Q1Q2Q3Q4Q1Q2Q3Q4202120222023Supply(millionbarrelsperday)CrudeOilSupplyDomesticProduction(a)..................................................10.8211.3411.1811.6611.4611.6912.0112.2812.3912.5012.8213.1011.2511.8612.70Alaska..........................................................................0.460.440.410.440.450.440.440.450.440.410.430.440.440.440.43FederalGulfofMexico(b)............................................1.831.801.491.711.671.691.731.811.861.831.741.741.711.721.79Lower48States(exclGOM)........................................8.549.109.299.509.349.569.8410.0310.0910.2710.6510.929.119.6910.48CrudeOilNetImports(c).................................................2.872.963.603.093.002.923.043.233.163.523.132.193.133.053.00SPRNetWithdrawals......................................................0.000.180.040.260.310.810.960.410.040.090.030.110.120.630.07CommercialInventoryNetWithdrawals...........................-0.180.590.30-0.010.08-0.10-0.05-0.13-0.390.080.20-0.070.18-0.05-0.04CrudeOilAdjustment(d).................................................0.300.570.490.510.710.730.330.160.220.220.230.160.470.480.21TotalCrudeOilInputtoRefineries......................................13.8115.6515.6015.5115.5616.0616.2915.9615.4216.4016.4015.5015.1515.9715.93OtherSupplyRefineryProcessingGain................................................0.840.970.971.040.951.071.061.061.031.001.000.990.951.041.01NaturalGasPlantLiquidsProduction..............................4.865.465.525.745.616.006.076.266.286.316.306.405.405.996.32RenewablesandOxygenateProduction(e).....................1.031.131.101.241.191.201.201.241.201.221.211.271.121.211.23FuelEthanolProduction...............................................0.900.990.961.061.021.011.011.020.991.000.991.020.981.021.00PetroleumProductsAdjustment(f)..................................0.190.220.220.230.220.230.220.220.210.220.220.220.220.220.21ProductNetImports(c)...................................................-2.94-3.13-3.24-3.86-3.74-4.16-4.16-4.25-4.13-3.82-3.94-3.70-3.29-4.08-3.90HydrocarbonGasLiquids.............................................-2.02-2.23-2.16-2.19-2.14-2.23-2.34-2.48-2.55-2.51-2.59-2.58-2.15-2.30-2.56UnfinishedOils.............................................................0.140.250.220.080.090.270.370.220.190.250.370.210.170.240.25OtherHC/Oxygenates..................................................-0.08-0.04-0.03-0.06-0.09-0.10-0.05-0.03-0.04-0.04-0.03-0.02-0.05-0.07-0.03MotorGasolineBlendComp.........................................0.550.790.660.400.400.590.460.190.370.630.380.430.600.410.45FinishedMotorGasoline...............................................-0.66-0.66-0.68-0.85-0.76-0.77-0.77-0.65-0.73-0.67-0.69-0.67-0.71-0.74-0.69JetFuel........................................................................0.030.090.090.00-0.04-0.08-0.03-0.03-0.090.030.050.060.05-0.040.01DistillateFuelOil..........................................................-0.49-0.90-0.94-0.89-0.81-1.19-1.20-1.01-0.77-1.10-1.03-0.88-0.80-1.05-0.95ResidualFuelOil..........................................................0.080.050.080.160.140.110.100.140.030.070.040.140.090.120.07OtherOils(g)...............................................................-0.49-0.49-0.50-0.50-0.54-0.75-0.70-0.60-0.54-0.48-0.43-0.38-0.49-0.65-0.46ProductInventoryNetWithdrawals..................................0.65-0.260.030.520.37-0.33-0.460.360.34-0.61-0.330.350.23-0.02-0.06TotalSupply.......................................................................18.4320.0320.2120.4120.1620.0620.2120.8520.3520.7420.8621.0319.7820.3220.75Consumption(millionbarrelsperday)HydrocarbonGasLiquids................................................3.403.333.313.603.873.403.493.974.043.593.513.943.413.683.77OtherHC/Oxygenates.....................................................0.110.130.110.160.130.170.180.240.230.220.210.270.130.180.23UnfinishedOils................................................................0.050.03-0.05-0.010.130.030.000.000.000.000.000.000.000.040.00MotorGasoline................................................................8.009.079.138.968.478.958.918.978.569.099.128.958.808.838.93FuelEthanolblendedintoMotorGasoline....................0.820.930.940.950.870.930.920.930.880.940.930.940.910.910.92JetFuel...........................................................................1.131.341.521.491.451.581.561.531.441.591.631.601.371.531.57DistillateFuelOil.............................................................3.973.933.874.004.143.843.803.984.053.913.893.983.943.943.96ResidualFuelOil.............................................................0.260.250.330.410.380.330.340.340.300.310.320.340.310.350.32OtherOils(g)..................................................................1.531.951.981.811.651.761.931.821.732.032.181.961.821.791.97TotalConsumption.............................................................18.4520.0320.2120.4120.2220.0620.2120.8520.3520.7420.8621.0319.7820.3420.75TotalPetroleumandOtherLiquidsNetImports.............-0.07-0.160.35-0.77-0.74-1.24-1.12-1.01-0.97-0.31-0.81-1.51-0.16-1.03-0.90End-of-periodInventories(millionbarrels)CommercialInventoryCrudeOil(excludingSPR)...............................................501.9448.0420.4421.4414.4423.8428.2440.1475.6468.2450.1456.1421.4440.1456.1HydrocarbonGasLiquids................................................168.6195.8225.6188.4142.0199.0241.5194.7155.4206.6248.0205.7188.4194.7205.7UnfinishedOils................................................................93.393.090.280.387.988.088.382.692.289.789.082.280.382.682.2OtherHC/Oxygenates.....................................................29.127.525.428.634.130.430.430.732.831.531.331.528.630.731.5TotalMotorGasoline.......................................................237.6237.2227.0232.2238.5219.1221.0235.5233.7236.2227.4241.5232.2235.5241.5FinishedMotorGasoline...............................................20.318.618.517.717.317.619.924.021.322.924.026.817.724.026.8MotorGasolineBlendComp.........................................217.4218.6208.5214.5221.2201.5201.1211.5212.4213.4203.4214.8214.5211.5214.8JetFuel...........................................................................39.044.742.035.835.639.943.139.939.240.042.539.335.839.939.3DistillateFuelOil.............................................................145.5140.1131.7129.9114.6111.1114.8118.5108.1113.4120.4122.7129.9118.5122.7ResidualFuelOil.............................................................30.931.128.025.427.928.428.330.330.231.129.631.125.430.331.1OtherOils(g)..................................................................55.854.150.551.858.552.844.146.155.754.045.046.651.846.146.6TotalCommercialInventory................................................1301.71271.51240.71193.81153.61192.61239.81218.41222.91270.61283.31256.81193.81218.41256.8CrudeOilinSPR................................................................637.8621.3617.8593.7566.1492.0403.3365.5361.7353.9351.3340.8593.7365.5340.8(f)Petroleumproductsadjustmentincludeshydrogen/oxygenates/renewables/otherhydrocarbons,motorgasolineblendcomponents,andfinishedmotorgasoline.Table4a.U.S.PetroleumandOtherLiquidsSupply,Consumption,andInventoriesU.S.EnergyInformationAdministrationShort-TermEnergyOutlook-August2022202120222023Year(a)Includesleasecondensate.(b)CrudeoilproductionfromU.S.FederalleasesintheGulfofMexico(GOM).(c)Netimportsequalsgrossimportsminusgrossexports.(d)Crudeoiladjustmentbalancessupplyandconsumptionandwaspreviouslyreferredtoas"UnaccountedforCrudeOil."(e)Renewablesandoxygenateproductionincludespentanesplus,oxygenates(excludingfuelethanol),andrenewablefuels.BeginninginJanuary2021,renewablefuelsincludesbiodiesel,renewablediesel,renewablejetfuel,renewableheatingoil,renewablenaphthaandgasoline,andotherrenewablefuels.ForDecember2020andprior,renewablefuelsincludesonlybiodiesel.Historicaldata:LatestdataavailablefromEnergyInformationAdministrationdatabasessupportingthefollowingreports:PetroleumSupplyMonthly,DOE/EIA-0109;PetroleumSupplyAnnual,DOE/EIA-0340/2;andWeeklyPetroleumStatusReport,DOE/EIA-0208.Minordiscrepancieswithpublishedhistoricaldataareduetoindependentrounding.Forecasts:EIAShort-TermIntegratedForecastingSystem.(g)“OtherOils"includesaviationgasolineblendcomponents,finishedaviationgasoline,kerosene,petrochemicalfeedstocks,specialnaphthas,lubricants,waxes,petroleumcoke,asphaltandroadoil,stillgas,andmiscellaneousproducts.-=nodataavailableSPR:StrategicPetroleumReserveHC:HydrocarbonsNotes:EIAcompletedmodelingandanalysisforthisreportonAugust4,2022.Theapproximatebreakbetweenhistoricalandforecastvaluesisshownwithhistoricaldataprintedinbold;estimatesandforecastsinitalics.Q1Q2Q3Q4Q1Q2Q3Q4Q1Q2Q3Q4202120222023HGLProductionNaturalGasProcessingPlantsEthane..............................................................1.872.192.182.322.332.432.522.652.642.682.602.662.142.482.65Propane............................................................1.621.741.751.821.771.891.881.931.951.941.951.991.731.871.96Butanes............................................................0.850.920.930.960.931.041.001.031.051.041.061.080.921.001.05NaturalGasoline(PentanesPlus)....................0.530.610.650.640.590.650.660.650.630.660.690.670.610.640.66RefineryandBlenderNetProductionEthane/Ethylene...............................................0.000.000.000.010.010.010.010.010.000.010.010.010.000.010.01Propane............................................................0.250.290.280.290.270.280.300.290.290.280.290.280.280.290.28Propylene(refinery-grade)...............................0.270.310.290.290.280.290.280.280.280.290.280.280.290.280.28Butanes/Butylenes...........................................-0.090.240.18-0.16-0.070.240.18-0.19-0.080.260.19-0.190.040.040.05RenewableFuelsandOxygenatePlantNetProductionNaturalGasoline(PentanesPlus)....................-0.02-0.02-0.02-0.02-0.02-0.02-0.02-0.02-0.02-0.02-0.02-0.02-0.02-0.02-0.02HGLNetImportsEthane.................................................................-0.35-0.39-0.41-0.47-0.50-0.35-0.37-0.44-0.46-0.46-0.46-0.46-0.40-0.41-0.46Propane/Propylene..............................................-1.11-1.23-1.19-1.20-1.18-1.29-1.32-1.43-1.40-1.30-1.37-1.41-1.18-1.31-1.37Butanes/Butylenes..............................................-0.35-0.40-0.38-0.34-0.28-0.44-0.46-0.43-0.45-0.51-0.52-0.48-0.37-0.40-0.49NaturalGasoline(PentanesPlus).......................-0.22-0.21-0.18-0.18-0.17-0.16-0.20-0.18-0.23-0.24-0.24-0.23-0.20-0.18-0.24HGLRefineryandBlenderNetInputsButanes/Butylenes..............................................0.390.290.310.520.440.340.330.500.430.290.320.500.380.400.38NaturalGasoline(PentanesPlus).......................0.140.140.160.230.200.190.190.180.170.180.190.180.170.190.18HGLConsumptionEthane/Ethylene..................................................1.541.831.801.901.982.022.142.212.182.182.152.201.772.092.18Propane...............................................................1.090.650.660.961.160.620.590.971.120.660.610.990.840.830.84Propylene(refinery-grade)..................................0.290.320.300.300.300.300.290.300.300.300.300.290.310.300.30Butanes/Butylenes..............................................0.220.290.250.210.230.240.220.220.200.230.220.220.240.230.22NaturalGasoline(PentanesPlus).......................0.260.240.300.220.210.230.250.270.240.210.230.240.250.240.23HGLInventories(millionbarrels)Ethane.................................................................65.867.464.664.051.153.656.659.258.262.262.063.965.455.261.6Propane...............................................................39.353.268.662.136.358.281.363.236.658.381.468.362.163.268.3Propylene(atrefineriesonly)..............................1.11.21.31.41.01.21.61.61.51.71.91.81.41.61.8Butanes/Butylenes..............................................37.253.969.444.435.759.776.547.437.561.979.850.744.447.450.7NaturalGasoline(PentanesPlus).......................22.822.322.320.719.424.024.723.720.921.922.521.620.723.721.6RefineryandBlenderNetInputsCrudeOIl.............................................................13.8115.6515.6015.5115.5616.0616.2915.9615.4216.4016.4015.5015.1515.9715.93HydrocarbonGasLiquids....................................0.530.430.470.750.640.520.520.690.600.470.500.690.540.590.57OtherHydrocarbons/Oxygenates.......................1.051.191.201.181.121.191.171.161.111.181.181.161.151.161.16UnfinishedOils....................................................-0.080.220.310.20-0.120.240.370.280.080.280.380.280.160.190.26MotorGasolineBlendComponents....................0.710.920.810.280.330.840.660.300.480.720.590.530.680.530.58AviationGasolineBlendComponents................0.000.000.000.000.000.000.000.000.000.000.000.000.000.000.00TotalRefineryandBlenderNetInputs...................16.0118.4118.3917.9117.5318.8519.0118.3817.6819.0619.0418.1617.6918.4518.49RefineryProcessingGain..................................0.840.970.971.040.951.071.061.061.031.001.000.990.951.041.01RefineryandBlenderNetProductionHydrocarbonGasLiquids....................................0.440.850.760.420.490.810.770.390.490.830.770.370.620.610.62FinishedMotorGasoline.....................................8.749.829.839.699.229.749.879.849.349.849.899.829.529.679.73JetFuel................................................................1.101.321.411.421.481.701.631.521.521.571.611.501.311.581.55DistillateFuel.......................................................4.294.774.724.874.774.995.045.044.715.074.994.884.664.964.92ResidualFuel......................................................0.190.200.210.220.260.230.230.220.270.250.270.210.210.240.25OtherOils(a).......................................................2.092.422.442.332.262.452.542.432.382.492.512.352.322.422.43TotalRefineryandBlenderNetProduction............16.8619.3819.3618.9418.4919.9120.0719.4418.7120.0620.0419.1518.6419.4819.49RefineryDistillationInputs................................14.2516.1716.2216.0216.0716.5616.6516.2515.7316.6216.7015.8615.6716.3816.23RefineryOperableDistillationCapacity...........18.1118.1318.1318.0517.9417.9417.9417.9417.9417.9417.9417.9418.1017.9417.94RefineryDistillationUtilizationFactor..............0.790.890.890.890.900.920.930.910.880.930.930.880.870.910.90Table4b.U.S.HydrocarbonGasLiquids(HGL)andPetroleumRefineryBalances(millionbarrelsperday,exceptinventoriesandutilizationfactor)U.S.EnergyInformationAdministrationShort-TermEnergyOutlook-August2022202120222023YearMinordiscrepancieswithpublishedhistoricaldataareduetoindependentrounding.Forecasts:EIAShort-TermIntegratedForecastingSystem.(a)"OtherOils"includesaviationgasolineblendcomponents,finishedaviationgasoline,kerosene,petrochemicalfeedstocks,specialnaphthas,lubricants,waxes,petroleumcoke,asphaltandroadoil,stillgas,andmiscellaneousproducts.-=nodataavailableNotes:EIAcompletedmodelingandanalysisforthisreportonAugust4,2022.Theapproximatebreakbetweenhistoricalandforecastvaluesisshownwithhistoricaldataprintedinbold;estimatesandforecastsinitalics.Historicaldata:LatestdataavailablefromEnergyInformationAdministrationdatabasessupportingthefollowingreports:PetroleumSupplyMonthly,DOE/EIA-0109;PetroleumSupplyAnnual,DOE/EIA-0340/2;WeeklyPetroleumStatusReport,DOE/EIA-0208.Q1Q2Q3Q4Q1Q2Q3Q4Q1Q2Q3Q4202120222023Prices(centspergallon)RefinerWholesalePrice..........................180216232243278376319288276286281270219316278GasolineRegularGradeRetailPricesIncludingTaxesPADD1...................................................252287304327364438415367343357353348294397350PADD2...................................................247288304315352435418360339352350338290392345PADD3...................................................228267282298340415381338321332328316271369324PADD4...................................................247311360351360444460388356371370355319413363PADD5...................................................312366391410452543519466440440435420372496434U.S.Average........................................256297316333371450429378356366363352302407359GasolineAllGradesIncludingTaxes265306325343380460440391369379376366311418373End-of-periodInventories(millionbarrels)TotalGasolineInventoriesPADD1...................................................65.169.959.061.856.952.553.358.859.260.756.462.761.858.862.7PADD2...................................................50.750.646.950.956.547.249.150.353.050.950.449.750.950.349.7PADD3...................................................81.981.682.981.787.183.081.586.583.787.583.888.281.786.588.2PADD4...................................................8.66.27.68.18.16.37.28.18.07.97.58.38.18.18.3PADD5...................................................31.429.030.629.629.930.129.831.729.829.329.432.629.631.732.6U.S.Total.............................................237.6237.2227.0232.2238.5219.1221.0235.5233.7236.2227.4241.5232.2235.5241.5FinishedGasolineInventoriesU.S.Total.............................................20.318.618.517.717.317.619.924.021.322.924.026.817.724.026.8GasolineBlendingComponentsInventoriesU.S.Total.............................................217.4218.6208.5214.5221.2201.5201.1211.5212.4213.4203.4214.8214.5211.5214.8Table4c.U.S.RegionalMotorGasolinePricesandInventoriesU.S.EnergyInformationAdministrationShort-TermEnergyOutlook-August2022202120222023YearHistoricaldata:LatestdataavailablefromEnergyInformationAdministrationdatabasessupportingthefollowingreports:PetroleumMarketingMonthly,DOE/EIA-0380;PetroleumSupplyMonthly,DOE/EIA-0109;PetroleumSupplyAnnual,DOE/EIA-0340/2;andWeeklyPetroleumStatusReport,DOE/EIA-0208.Minordiscrepancieswithpublishedhistoricaldataareduetoindependentrounding.Forecasts:EIAShort-TermIntegratedForecastingSystem.-=nodataavailableNotes:EIAcompletedmodelingandanalysisforthisreportonAugust4,2022.Theapproximatebreakbetweenhistoricalandforecastvaluesisshownwithhistoricaldataprintedinbold;estimatesandforecastsinitalics.Pricesarenotadjustedforinflation.RegionsrefertoPetroleumAdministrationforDefenseDistricts(PADD).See“PetroleumforAdministrationDefenseDistrict”inEIA’sEnergyGlossary(http://www.eia.doe.gov/glossary/index.html)foralistofStatesineachregion.Q1Q2Q3Q4Q1Q2Q3Q4Q1Q2Q3Q4202120222023Supply(billioncubicfeetperday)TotalMarketedProduction...............97.65101.12101.89104.86102.77105.21105.66106.83107.60108.99109.41109.40101.40105.13108.86Alaska...........................................1.020.950.901.021.060.970.790.900.930.800.760.890.970.930.85FederalGOM(a)..........................2.262.251.822.112.042.112.142.112.132.051.921.882.112.102.00Lower48States(exclGOM).......94.3797.9299.17101.7399.67102.14102.74103.82104.54106.14106.73106.6398.32102.10106.02TotalDryGasProduction...............90.5993.1593.8696.5294.6096.6197.0298.0998.90100.13100.52100.5193.5596.59100.02LNGGrossImports.........................0.150.020.030.040.150.070.180.200.320.180.180.200.060.150.22LNGGrossExports.........................9.279.819.6010.3211.5010.849.9512.3512.9212.6112.3112.889.7611.1612.68PipelineGrossImports....................8.686.817.247.828.927.566.516.727.786.476.326.507.637.426.76PipelineGrossExports...................8.318.668.508.408.438.579.299.239.139.039.349.248.478.889.18SupplementalGaseousFuels........0.170.150.150.170.190.170.170.170.170.170.170.170.160.170.17NetInventoryWithdrawals..............17.18-9.12-7.871.0320.14-10.26-8.752.7514.80-12.69-9.003.780.240.90-0.83TotalSupply.......................................99.1872.5375.3186.86104.0774.7475.8986.3699.9172.6276.5589.0483.4285.1984.48BalancingItem(b)..............................0.26-0.58-0.21-1.230.240.16-1.090.57-0.57-0.63-0.74-0.60-0.45-0.03-0.64TotalPrimarySupply..........................99.4471.9575.1085.62104.3074.9074.8186.9399.3471.9975.8088.4482.9785.1683.84Consumption(billioncubicfeetperday)Residential......................................25.677.503.6214.4326.097.813.4216.6624.597.773.8616.6812.7513.4413.18Commercial.....................................14.876.234.6810.0815.626.644.4510.3315.187.064.8510.478.949.239.37Industrial..........................................23.8121.4621.1423.4425.2321.9620.9723.2522.3720.3321.2524.3022.4622.8422.07ElectricPower(c)............................26.7929.2037.9429.4728.6530.6338.0928.3228.3628.8637.7228.4430.8831.4430.86LeaseandPlantFuel......................4.875.045.085.235.125.245.275.335.365.435.455.455.055.245.43PipelineandDistributionUse..........3.292.382.482.833.452.472.472.903.332.382.512.952.742.822.79VehicleUse.....................................0.150.150.150.150.150.150.150.150.150.150.150.150.150.150.15TotalConsumption.............................99.4471.9575.1085.62104.3074.9074.8186.9399.3471.9975.8088.4482.9785.1683.84End-of-periodInventories(billioncubicfeet)WorkingGasInventory...................1,8012,5853,3063,2101,4012,3283,1322,8791,5472,7023,5303,1823,2102,8793,182EastRegion(d)............................313515804766242479775665250596894759766665759MidwestRegion(d)......................3956309668872965589188073456521,000853887807853SouthCentralRegion(d).............7609931,0531,1435878899659846851,0291,1081,0921,1439841,092MountainRegion(d)....................1131752051719013716915186134201182171151182PacificRegion(d).........................197246248218165239280246155264301270218246270Alaska...........................................232730252124262626262626252626LNG:liquefiednaturalgas.Table5a.U.S.NaturalGasSupply,Consumption,andInventoriesU.S.EnergyInformationAdministrationShort-TermEnergyOutlook-August2022202120222023Year(a)MarketedproductionfromU.S.FederalleasesintheGulfofMexico.(b)Thebalancingitemrepresentsthedifferencebetweenthesumofthecomponentsofnaturalgassupplyandthesumofcomponentsofnaturalgasdemand.(c)Naturalgasusedforelectricitygenerationand(alimitedamountof)usefulthermaloutputbyelectricutilitiesandindependentpowerproducers.(d)ForalistofStatesineachinventoryregionrefertoWeeklyNaturalGasStorageReport,NotesandDefinitions(http://ir.eia.gov/ngs/notes.html).-=nodataavailableNotes:EIAcompletedmodelingandanalysisforthisreportonAugust4,2022.Theapproximatebreakbetweenhistoricalandforecastvaluesisshownwithhistoricaldataprintedinbold;estimatesandforecastsinitalics.Historicaldata:LatestdataavailablefromEnergyInformationAdministrationdatabasessupportingthefollowingreports:NaturalGasMonthly,DOE/EIA-0130;andElectricPowerMonthly,Minordiscrepancieswithpublishedhistoricaldataareduetoindependentrounding.Forecasts:EIAShort-TermIntegratedForecastingSystem.Q1Q2Q3Q4Q1Q2Q3Q4Q1Q2Q3Q4202120222023Wholesale/SpotHenryHubSpotPrice.........3.703.064.534.964.847.777.787.897.544.454.574.624.067.075.29ResidentialRetailNewEngland.......................14.6616.2420.4117.6117.6920.6823.7319.4018.8819.4521.6817.1716.1218.9518.65MiddleAtlantic.....................10.4313.4919.8114.2912.7915.0821.4015.9014.9716.0719.6313.0212.5514.3414.85E.N.Central.......................7.4112.6922.3611.409.8114.2222.2913.2312.2614.0719.8310.5710.1911.9312.45W.N.Central......................7.4911.6320.3212.6211.3914.7422.7514.3012.8514.5419.8811.1310.2313.0612.92S.Atlantic...........................11.9418.0327.5616.6213.9120.0628.4718.0516.2820.0825.6614.8315.2416.8017.08E.S.Central.......................9.3514.7822.9414.1411.7816.8826.9417.8815.7019.7524.5014.7811.9914.1716.70W.S.Central......................9.2315.8523.7617.8212.6418.9025.9216.7213.7718.0822.7413.5613.2215.5015.19Mountain.............................7.9010.6415.5810.8510.3312.6917.7112.8012.6213.8116.3310.579.7711.7412.41Pacific.................................14.2015.0115.9016.4717.0617.2019.6219.1919.6619.4918.8817.3615.2517.9918.83U.S.Average...................9.7513.8720.3813.8112.3215.9122.4115.7714.9016.5520.4813.0012.2714.5614.95CommercialRetailNewEngland.......................10.3911.1312.2412.5812.6314.3214.8814.6714.9914.2812.5411.7111.3313.7913.68MiddleAtlantic.....................7.927.997.9910.1110.3310.5610.8811.7612.2211.269.769.638.5610.8710.99E.N.Central.......................6.118.5911.038.678.1410.4713.1811.2211.3111.5911.078.467.609.7310.43W.N.Central......................6.327.679.9410.1910.2411.5213.8211.8011.6411.0210.888.667.9111.1310.56S.Atlantic...........................8.699.8410.3711.0410.5211.9013.6613.1513.0512.9011.9710.599.7611.8912.13E.S.Central.......................8.339.9011.9511.8010.5412.8214.6713.5313.0113.1312.2810.589.8912.2212.19W.S.Central......................6.918.5710.1410.879.9912.0112.9812.0611.4711.3410.269.048.6211.3310.64Mountain.............................6.507.769.259.028.839.9711.6110.8310.8711.0311.069.387.759.8710.44Pacific.................................10.4610.3111.3112.1212.7412.9614.2713.8713.5612.5711.6810.6011.0913.3312.14U.S.Average...................7.548.8510.1210.279.9811.4212.9212.2112.1711.8810.989.568.8211.1511.25IndustrialRetailNewEngland.......................8.598.087.8510.0811.0911.8611.5512.5512.9811.369.019.648.7311.7611.10MiddleAtlantic.....................7.667.377.9010.3610.169.1911.3612.2512.6110.969.239.048.2410.8011.08E.N.Central.......................5.438.148.497.897.729.1310.3110.3410.608.727.377.186.909.058.91W.N.Central......................5.134.345.256.958.038.198.969.579.797.286.106.345.488.697.48S.Atlantic...........................5.134.766.027.667.578.529.449.759.967.156.286.555.908.747.58E.S.Central.......................4.724.285.367.216.878.819.019.359.586.835.816.135.398.437.20W.S.Central......................5.753.204.385.955.467.407.938.067.884.994.724.764.807.325.56Mountain.............................4.985.326.667.277.078.269.379.589.858.978.287.625.998.478.73Pacific.................................8.287.248.889.218.818.8210.5811.1311.289.948.558.138.549.899.56U.S.Average...................5.734.095.116.866.827.968.569.049.226.275.535.835.508.036.73Table5b.U.S.RegionalNaturalGasPrices(dollarsperthousandcubicfeet)U.S.EnergyInformationAdministrationShort-TermEnergyOutlook-August2022202120222023YearHistoricaldata:LatestdataavailablefromEnergyInformationAdministrationdatabasessupportingtheNaturalGasMonthly,DOE/EIA-0130.NaturalgasHenryHubspotpricefromReuter'sNewsService(http://www.reuters.com).Minordiscrepancieswithpublishedhistoricaldataareduetoindependentrounding.Forecasts:EIAShort-TermIntegratedForecastingSystem.-=nodataavailableNotes:EIAcompletedmodelingandanalysisforthisreportonAugust4,2022.Theapproximatebreakbetweenhistoricalandforecastvaluesisshownwithhistoricaldataprintedinbold;estimatesandforecastsinitalics.Pricesarenotadjustedforinflation.RegionsrefertoU.S.Censusdivisions.See"Censusdivision"inEIA’sEnergyGlossary(http://www.eia.doe.gov/glossary/index.html)foralistofStatesineachregion.Q1Q2Q3Q4Q1Q2Q3Q4Q1Q2Q3Q4202120222023Supply(millionshorttons)Production..................................................140.3142.7148.3146.7149.0141.7152.2155.9151.4144.2156.7149.0578.1598.9601.3Appalachia...............................................40.839.536.638.940.238.738.640.642.240.238.636.0155.8158.0157.1Interior.....................................................25.023.322.722.523.821.922.723.923.021.924.123.793.592.392.7Western...................................................74.580.089.085.385.081.191.091.486.282.194.089.3328.8348.5351.6PrimaryInventoryWithdrawals...................-4.52.12.6-1.8-1.1-2.0-1.0-5.3-2.2-1.41.5-1.8-1.7-9.4-3.8Imports.......................................................1.11.51.11.71.31.41.21.11.01.21.61.45.45.05.2Exports.......................................................20.722.120.721.720.223.221.422.623.125.024.125.985.287.398.1MetallurgicalCoal....................................10.311.711.411.910.512.911.511.612.013.212.513.345.346.551.1SteamCoal.............................................10.410.49.39.79.710.39.910.911.111.711.612.639.940.847.0TotalPrimarySupply.....................................116.2124.2131.3124.9129.0118.0131.0129.2127.2119.1135.7122.7496.6507.1504.6SecondaryInventoryWithdrawals...............22.30.330.4-14.08.8-2.728.0-8.0-3.1-13.310.4-12.539.026.1-18.3WasteCoal(a)...........................................2.21.72.02.01.91.91.91.91.81.81.81.87.97.57.2TotalSupply..................................................140.6126.2163.7112.9139.6117.1160.9123.1125.9107.7147.9112.0543.4540.8493.5Consumption(millionshorttons)CokePlants................................................4.44.54.44.44.23.93.74.54.24.34.54.617.616.217.5ElectricPowerSector(b)............................128.0113.8157.0102.7122.6110.8152.3111.6114.797.5137.4100.6501.4497.3450.2RetailandOtherIndustry............................6.86.36.57.06.96.86.77.07.05.96.06.826.727.525.7ResidentialandCommercial....................0.30.20.20.20.20.10.20.20.30.20.10.20.80.80.9OtherIndustrial........................................6.66.26.36.86.76.76.56.86.75.85.96.525.826.824.8TotalConsumption.......................................139.2124.6167.9114.1133.7121.6162.6123.1125.9107.7147.9112.0545.7541.0493.5Discrepancy(c)1.41.6-4.1-1.25.9-4.5-1.70.00.00.00.00.0-2.2-0.20.0End-of-periodInventories(millionshorttons)PrimaryInventories(d)...............................28.126.123.425.326.428.429.434.736.938.236.738.525.334.738.5SecondaryInventories................................115.8115.585.199.190.393.065.073.076.089.378.991.399.173.091.3ElectricPowerSector..............................111.5110.980.494.786.287.559.467.671.584.573.986.394.767.686.3RetailandGeneralIndustry.....................2.62.62.72.62.43.53.53.32.72.83.03.02.63.33.0CokePlants.............................................1.51.91.81.71.61.92.01.91.71.81.81.81.71.91.8Commercial&Institutional……………....0.20.20.20.20.20.20.20.20.10.10.10.10.20.20.1CoalMarketIndicatorsCoalMinerProductivity(Tonsperhour)........................................6.326.326.326.326.306.306.306.306.216.216.216.216.326.306.21TotalRawSteelProduction(Millionshorttonsperday).......................0.2460.2580.2670.2600.2530.2530.2620.2930.3070.3060.3260.3450.2580.2660.321CostofCoaltoElectricUtilities(DollarspermillionBtu)...........................1.911.932.032.052.192.222.222.202.212.202.182.151.982.212.19Table6.U.S.CoalSupply,Consumption,andInventoriesU.S.EnergyInformationAdministrationShort-TermEnergyOutlook-August2022202120222023YearTheapproximatebreakbetweenhistoricalandforecastvaluesisshownwithhistoricaldataprintedinbold;estimatesandforecastsinitalics.Historicaldata:LatestdataavailablefromEnergyInformationAdministrationdatabasessupportingthefollowingreports:QuarterlyCoalReport,DOE/EIA-0121;andElectricPowerMonthly,Minordiscrepancieswithpublishedhistoricaldataareduetoindependentrounding.Forecasts:EIAShort-TermIntegratedForecastingSystem.(a)Wastecoalincludeswastecoalandcloalslurryreprocessedintobriquettes.(b)Coalusedforelectricitygenerationand(alimitedamountof)usefulthermaloutputbyelectricutilitiesandindependentpowerproducers.(c)Thediscrepancyreflectsanunaccounted-forshipperandreceiverreportingdifference,assumedtobezerointheforecastperiod.(d)Primarystocksareheldattheminesanddistributionpoints.-=nodataavailableNotes:EIAcompletedmodelingandanalysisforthisreportonAugust4,2022.Q1Q2Q3Q4Q1Q2Q3Q4Q1Q2Q3Q4202120222023ElectricitySupply(billionkilowatthours)ElectricityGeneration.........................9899851,1669751,0331,0271,1779841,0171,0121,1669904,1164,2214,185ElectricPowerSector(a)..................9529491,1279359949911,1379469799741,1259513,9634,0674,030IndustrialSector(b)..........................343336363534373635343736140141143CommercialSector(b).....................334333333343131313NetImports.......................................1111116712141112131511394451TotalSupply........................................1,0009971,1779811,0401,0391,1919951,0291,0251,1811,0014,1554,2664,236LossesandUnaccountedfor(c).......546652526170585145655651225239218ElectricityConsumption(billionkilowatthoursunlessnoted)SalestoUltimateCustomers..............9138981,0898949449371,0989109509261,0889153,7953,8903,880ResidentialSector...........................3793294463243793444433283793334323321,4771,4941,475CommercialSector..........................3043213773223223383843283233353813271,3251,3711,366IndustrialSector...............................2292472642472422542702532472582742559871,0191,033TransportationSector......................222222222222666DirectUse(d).....................................333235353433363433343635136137138TotalConsumption............................9469311,1249299799701,1349449849601,1259503,9304,0274,018Averageresidentialelectricityusagepercustomer(kWh).................2,7442,3813,2322,3462,7252,4713,1832,3592,6972,3703,0792,36310,70310,73710,509End-of-periodFuelInventoriesHeldbyElectricPowerSectorCoal(mmst)........................................111.5110.980.494.786.287.559.467.671.584.573.986.394.767.686.3ResidualFuel(mmb)..........................8.07.46.97.05.75.76.16.74.74.62.73.47.06.73.4DistillateFuel(mmb)...........................16.015.515.316.015.516.116.016.216.015.715.615.916.016.215.9PricesPowerGenerationFuelCosts(dollarspermillionBtu)Coal.................................................1.911.932.032.052.192.222.222.202.212.202.182.151.982.212.19NaturalGas.....................................7.243.264.365.425.687.197.487.947.814.474.574.794.977.115.33ResidualFuelOil.............................11.2813.0914.2216.1016.9125.6321.9519.0818.2818.4617.5817.3013.6620.2317.90DistillateFuelOil..............................13.5415.2016.1918.0321.1130.3827.2224.7722.9622.2322.0622.3015.5024.7622.48PricestoUltimateCustomers(centsperkilowatthour)ResidentialSector...........................13.1013.8413.9913.9713.9814.8014.8014.6614.6615.4215.0414.6013.7214.5614.93CommercialSector..........................10.9911.0711.5911.3711.6312.0212.1911.9812.2512.4212.3711.8511.2711.9712.23IndustrialSector...............................7.096.927.627.387.428.188.257.667.687.958.027.447.267.897.78WholesaleElectricityPrices(dollarspermegawatthour)ERCOTNorthhub...........................616.3439.7452.3149.7942.7383.19121.4077.7670.7444.2857.2243.72189.5481.2753.99CAISOSP15zone...........................44.7436.9072.0260.4745.2060.34125.0176.7857.5749.7792.5043.6853.5376.8360.88ISO-NEInternalhub........................55.2633.6752.5765.75116.4873.2891.4996.90169.6155.1358.0979.0151.8194.5490.46NYISOHudsonValleyzone............44.7431.8550.4257.54100.1079.7296.01104.40138.2753.9257.9770.0046.1495.0680.04PJMWesternhub............................35.0933.7151.3262.5758.3393.00103.7791.8799.3859.7566.3359.9945.6786.7471.36MidcontinentISOIllinoishub...........44.9733.8249.3657.7147.8889.2191.9083.1983.7954.2960.2753.1846.4778.0462.88SPPISOSouthhub.........................250.3130.8648.6345.7237.2572.8585.5861.8960.0440.5446.3337.9293.8864.3946.21SERCindex,IntoSouthern.............41.1032.9344.1851.3442.4584.9679.2471.8170.5746.7951.1745.2042.3969.6153.43FRCCindex,FloridaReliability........27.7332.1742.7649.0241.1178.7069.4258.1556.5442.6745.0842.0637.9261.8446.59Northwestindex,Mid-Columbia......34.5651.5191.6160.4639.8559.39129.0381.4761.0048.7593.4148.0159.5377.4362.79Southwestindex,PaloVerde..........41.7246.5779.8653.6039.0260.50131.0358.5453.2456.18104.6941.6155.4472.2763.93(b)Generationsuppliedbypowerplantswithcapacityofatleast1megawattoperatedbybusinessesinthecommercialandindustrialsectors,primarilyforonsiteuse.Table7a.U.S.ElectricityIndustryOverviewU.S.EnergyInformationAdministrationShort-TermEnergyOutlook-August2022202120222023YearNotes:EIAcompletedmodelingandanalysisforthisreportonAugust4,2022.Theapproximatebreakbetweenhistoricalandforecastvaluesisshownwithhistoricaldataprintedinbold;estimatesandforecastsinitalics.kWh=kilowatthours.Btu=Britishthermalunits.Pricesarenotadjustedforinflation.(a)Generationsuppliedbypowerplantswithcapacityofatleast1megawattoperatedbyelectricutilitiesandindependentpowerproducers.(3)PJMISOWesternHubwholesaleelectricityprices:PJMDataMinerwebsiteMinordiscrepancieswithpublishedhistoricaldataareduetoindependentrounding.Forecasts:EIAShort-TermIntegratedForecastingSystem.(c)Includestransmissionanddistributionlosses,datacollectiontime-framedifferences,andestimationerror.(d)DirectUserepresentscommercialandindustrialfacilityuseofonsitenetelectricitygeneration;andelectricalsalesortransferstoadjacentorcolocatedfacilitiesforwhichrevenueinformationisnotavailable.SeeTable7.6oftheEIAMonthlyEnergyReview.Historicaldatasources:(1)Electricitysupply,consumption,fuelcosts,andretailelectricityprices:LatestdataavailablefromU.S.EnergyInformationAdministrationdatabasessupportingthefollowingreports:ElectricPowerMonthly,DOE/EIA-0226;andElectricPowerAnnual,DOE/EIA-0348(2)Wholesaleelectricityprices(exceptforPJMRTOprice):S&PGlobalMarketIntelligence,SNLEnergyData(3)PJMISOWesternhubwholesaleelectricityprices:PJMDataMinerwebsite.Q1Q2Q3Q4Q1Q2Q3Q4Q1Q2Q3Q4202120222023ResidentialSectorNewEngland...............12.910.814.011.013.110.813.510.912.710.612.810.748.748.346.9MiddleAtlantic..............36.030.341.930.536.130.240.130.635.730.439.230.7138.7137.1136.0E.N.Central................50.143.156.343.250.943.953.844.450.142.753.345.0192.6193.0191.1W.N.Central...............29.923.731.024.030.624.930.323.730.223.829.323.3108.6109.5106.6S.Atlantic.....................95.285.1111.583.196.089.8112.184.897.987.3111.486.4374.9382.7382.9E.S.Central.................33.525.335.825.932.727.437.226.833.726.836.027.2120.5124.1123.6W.S.Central...............56.850.076.247.555.757.180.748.754.252.976.649.8230.5242.3233.6Mountain......................23.726.935.222.324.226.334.623.024.125.534.223.3108.1108.1107.2Pacificcontiguous........39.032.243.034.838.532.439.334.038.731.638.233.9149.0144.2142.4AKandHI.....................1.31.11.21.31.31.11.21.31.21.11.21.34.94.94.8Total..........................378.5328.5445.8323.7379.1343.9442.8328.2378.6332.7432.2331.61,476.61,494.01,475.1CommercialSectorNewEngland...............11.711.713.511.512.112.013.711.712.112.113.411.648.549.549.2MiddleAtlantic..............34.633.239.734.336.034.440.034.736.334.539.434.4141.9145.1144.6E.N.Central................41.742.148.942.143.343.048.842.843.442.848.642.6174.8177.9177.4W.N.Central...............24.023.727.624.025.124.627.724.325.224.427.524.299.3101.7101.3S.Atlantic.....................70.877.389.675.375.182.391.476.775.381.391.176.9313.1325.5324.6E.S.Central.................20.721.526.020.921.022.626.921.221.122.026.321.289.091.790.7W.S.Central...............42.450.558.749.546.753.362.151.247.452.561.651.6201.0213.3213.1Mountain......................21.924.828.823.223.225.329.123.623.325.129.023.798.7101.2101.1Pacificcontiguous........35.235.343.139.637.738.843.139.938.038.642.439.6153.2159.4158.5AKandHI.....................1.31.31.31.41.31.31.41.41.31.31.41.45.35.45.5Total..........................304.3321.5377.2321.8321.5337.7384.1327.5323.4334.7380.7327.21,324.81,370.81,365.9IndustrialSectorNewEngland...............3.84.04.23.93.93.94.13.93.93.94.13.815.815.815.7MiddleAtlantic..............17.617.919.418.117.518.120.018.618.018.420.018.573.174.174.9E.N.Central................44.546.448.646.045.947.149.647.246.847.750.447.5185.5189.7192.4W.N.Central...............23.024.226.024.624.024.826.525.124.824.826.425.097.9100.4101.0S.Atlantic.....................33.435.938.236.136.337.539.437.237.238.039.837.3143.7150.4152.3E.S.Central.................23.724.926.125.024.725.826.425.324.825.926.625.399.7102.2102.7W.S.Central...............44.149.754.351.549.852.656.954.051.855.259.856.5199.7213.3223.2Mountain......................19.221.623.220.419.921.723.320.519.921.923.720.884.485.486.3Pacificcontiguous........18.220.923.120.419.021.122.519.818.620.521.618.882.582.479.5AKandHI.....................1.11.21.21.21.11.21.21.21.11.21.21.24.64.74.7Total..........................228.5246.7264.4247.2242.1253.8269.8252.8246.8257.5273.6254.7986.81,018.51,032.7TotalAllSectors(a)NewEngland...............28.526.631.726.529.226.831.526.628.726.730.526.3113.4114.1112.3MiddleAtlantic..............89.182.3101.883.790.583.5100.884.790.884.199.484.4356.9359.5358.7E.N.Central................136.4131.7154.0131.3140.3134.1152.3134.5140.4133.3152.5135.3553.4561.2561.5W.N.Central...............77.071.684.672.679.774.284.573.180.173.083.372.4305.8311.5308.9S.Atlantic.....................199.7198.6239.6194.9207.7209.9243.2198.9210.7206.9242.5200.9832.7859.7860.9E.S.Central.................77.871.887.871.978.475.890.573.379.674.788.973.7309.2318.0317.0W.S.Central...............143.4150.2189.2148.5152.3163.1199.8154.0153.4160.6198.0157.9631.4669.1670.0Mountain......................64.973.387.366.067.373.487.067.267.472.687.067.8291.4294.9294.8Pacificcontiguous........92.588.6109.395.095.492.5105.093.995.490.9102.392.5385.5386.8381.1AKandHI.....................3.73.63.73.93.73.63.73.93.73.63.73.914.914.914.9Total..........................913.0898.21,089.1894.3944.5936.91,098.4910.0950.4926.41,088.1915.03,794.53,889.83,880.0Table7b.U.S.RegionalElectricitySalestoUltimateCustomers(billionkilowatthours)U.S.EnergyInformationAdministrationShort-TermEnergyOutlook-August2022202120222023YearSee"Censusdivision"inEIA’sEnergyGlossary(http://www.eia.doe.gov/glossary/index.html)foralistofStatesineachregion.Historicaldata:LatestdataavailablefromEnergyInformationAdministrationdatabasessupportingthefollowingreports:ElectricPowerMonthly,DOE/EIA-0226;andElectricMinordiscrepancieswithpublishedhistoricaldataareduetoindependentrounding.Forecasts:EIAShort-TermIntegratedForecastingSystem.(a)Totalretailsalestoallsectorsincludesresidential,commercial,industrial,andtransportationsectorsales.-=nodataavailableNotes:EIAcompletedmodelingandanalysisforthisreportonAugust4,2022.Theapproximatebreakbetweenhistoricalandforecastvaluesisshownwithhistoricaldataprintedinbold;estimatesandforecastsinitalics.RetailSalesrepresentstotalretailelectricitysalesbyelectricutilitiesandpowermarketers.RegionsrefertoU.S.Censusdivisions.Q1Q2Q3Q4Q1Q2Q3Q4Q1Q2Q3Q4202120222023ResidentialSectorNewEngland..............21.3821.3421.4321.9523.9323.9124.6425.5227.7627.4927.8027.9621.5124.4827.75MiddleAtlantic.............15.6316.5116.9316.8517.1218.1118.3617.5817.9918.2418.0317.1416.4917.8117.86E.N.Central...............13.3914.5014.1414.4814.2215.1814.9115.1514.8915.7915.3215.1614.1014.8515.27W.N.Central..............10.8812.7713.2911.9011.2813.0713.6212.1511.5213.4113.7112.0012.2112.5212.65S.Atlantic....................11.6612.3412.4812.4812.6813.4413.3013.1213.1513.9213.4312.9112.2413.1313.35E.S.Central...............11.2012.2411.9912.0211.9712.9612.7612.3912.4913.0612.5812.2111.8312.5212.58W.S.Central..............11.8511.7011.8012.2811.8312.7312.6213.1312.5513.3412.8212.8811.8912.5712.89Mountain.....................11.5312.0912.3312.2712.1412.7512.8412.5812.4013.0613.0712.7012.0812.6112.84Pacific.........................16.7518.1519.4317.5518.1219.4320.3618.1818.9520.4620.9818.4218.0119.0419.70U.S.Average...........13.1013.8413.9913.9713.9814.8014.8014.6614.6615.4215.0414.6013.7214.5614.93CommercialSectorNewEngland..............16.3115.9616.7816.8918.5417.5218.4118.4920.2018.8819.5219.1616.4918.2519.45MiddleAtlantic.............12.5113.2414.3113.5314.0514.6515.3014.3914.7614.9215.2713.8613.4314.6214.72E.N.Central...............10.4010.7010.6610.9211.0811.6511.4111.6311.7812.1511.5911.4610.6711.4411.74W.N.Central..............9.1010.1910.839.619.6510.4010.048.979.159.589.418.249.979.789.10S.Atlantic....................9.299.189.529.9510.3010.5310.1810.5810.8410.8810.3310.319.4910.3910.58E.S.Central...............10.9811.2411.2711.2611.6911.9811.9311.8712.2712.4112.1411.7911.1911.8712.15W.S.Central..............10.378.898.558.658.658.698.578.758.728.498.398.629.048.668.54Mountain.....................9.119.7610.209.599.5610.2410.529.839.8010.4510.699.899.7010.0710.24Pacific.........................14.5215.9918.0816.1216.0917.7319.7317.7317.9419.5021.0618.3516.2717.8819.26U.S.Average...........10.9911.0711.5911.3711.6312.0212.1911.9812.2512.4212.3711.8511.2711.9712.23IndustrialSectorNewEngland..............13.5012.9913.7114.1315.1415.1215.0615.0115.8215.6315.4015.2013.5815.0815.51MiddleAtlantic.............6.526.597.117.307.877.977.487.438.037.497.016.996.897.687.37E.N.Central...............6.976.977.387.707.728.398.017.998.068.207.847.827.268.037.98W.N.Central..............6.977.308.007.067.167.908.337.287.427.888.337.297.357.687.74S.Atlantic....................6.246.317.046.896.857.447.367.037.077.067.106.816.647.177.01E.S.Central...............5.755.866.276.266.357.066.806.456.556.806.616.266.046.676.56W.S.Central..............7.225.466.006.136.207.137.156.536.406.646.576.066.176.766.42Mountain.....................6.276.637.396.546.597.217.746.666.697.257.766.656.747.087.11Pacific.........................9.6910.7112.6211.0610.3411.9413.4211.4810.7512.2713.7411.6911.1011.8612.18U.S.Average...........7.096.927.627.387.428.188.257.667.687.958.027.447.267.897.78AllSectors(a)NewEngland..............18.2017.6718.4018.5420.4819.7020.6120.8322.9121.7922.4122.1418.2120.4122.33MiddleAtlantic.............12.5712.9814.0013.3714.0714.4314.9614.0014.6814.4814.6813.5413.2614.3914.37E.N.Central...............10.3810.6210.9010.9611.1111.6611.5411.5111.6511.9011.6511.4110.7211.4511.65W.N.Central..............9.1610.0710.869.509.5310.4610.789.429.5110.2510.589.129.9210.079.88S.Atlantic....................9.9110.0110.5010.4610.7911.2211.1610.9911.2411.4611.2210.7710.2311.0511.18E.S.Central...............9.489.7210.089.8010.1210.6610.7710.1910.5810.7010.6610.049.7810.4510.51W.S.Central..............9.998.699.138.939.019.619.809.359.299.469.559.059.179.479.35Mountain.....................9.169.6910.319.559.6110.2410.709.809.8110.4010.839.869.7310.1310.27Pacific.........................14.5015.5217.4515.5515.7516.9918.6016.5616.9418.1819.4717.0015.8317.0217.93U.S.Average...........10.8810.9411.6111.2111.4912.0012.2711.7412.0212.2512.3411.6211.1811.8912.07Table7c.U.S.RegionalElectricityPricestoUltimateCustomers(CentsperKilowatthour)U.S.EnergyInformationAdministrationShort-TermEnergyOutlook-August2022202120222023YearSee"Censusdivision"inEIA’sEnergyGlossary(http://www.eia.doe.gov/glossary/index.html)foralistofStatesineachregion.Historicaldata:LatestdataavailablefromEnergyInformationAdministrationdatabasessupportingthefollowingreports:ElectricPowerMonthly,DOE/EIA-0226;andElectricMinordiscrepancieswithpublishedhistoricaldataareduetoindependentrounding.Forecasts:EIAShort-TermIntegratedForecastingSystem.(a)Volume-weightedaverageofretailpricestoresidential,commercial,industrial,andtransportationsectors.-=nodataavailableNotes:EIAcompletedmodelingandanalysisforthisreportonAugust4,2022.Theapproximatebreakbetweenhistoricalandforecastvaluesisshownwithhistoricaldataprintedinbold;estimatesandforecastsinitalics.Pricesarenotadjustedforinflation.RegionsrefertoU.S.Censusdivisions.Q1Q2Q3Q4Q1Q2Q3Q4Q1Q2Q3Q4202120222023UnitedStatesNaturalGas...................................319.3345.7453.9354.7337.9359.5451.9338.6332.8337.7445.4338.81,473.61,487.91,454.7Coal..............................................230.0203.8280.9178.1217.5198.1272.1194.6202.1173.7244.9176.0892.8882.4796.7Nuclear.........................................198.4186.6202.8190.4195.6184.8202.9191.2194.0187.8207.3197.9778.2774.6787.0RenewableEnergySources:.........197.9207.3183.3206.6235.5243.0204.8216.0244.0270.6222.4232.7795.2899.3969.7ConventionalHydropower68.765.860.763.876.571.864.257.870.881.066.260.9259.0270.3278.9Wind..........................................97.096.176.8108.8119.5118.386.2118.3126.5124.190.3123.3378.6442.3464.2Solar(a)....................................21.334.734.623.328.942.843.429.436.355.555.038.2113.9144.4185.0Biomass.....................................7.26.87.26.76.76.36.86.46.66.36.76.327.926.226.0Geothermal................................3.83.94.04.03.93.94.24.13.83.74.23.915.716.115.6PumpedStorageHydropower.......-1.1-1.0-1.8-1.2-1.2-1.2-1.8-1.4-1.2-1.3-1.8-1.3-5.1-5.6-5.5Petroleum(b)...............................5.23.54.74.46.64.04.43.95.23.74.44.117.818.917.3OtherGases.................................0.70.80.90.70.80.90.90.80.80.70.90.83.23.43.2OtherNonrenewableFuels(c)......1.81.81.81.81.61.61.71.71.51.51.71.77.26.66.4TotalGeneration...........................952.2948.51,126.6935.5994.2990.61,137.1945.6979.1974.51,125.2950.73,962.84,067.54,029.5NewEngland(ISO-NE)NaturalGas...................................12.211.015.712.611.812.017.611.512.311.214.812.151.552.950.4Coal..............................................0.50.00.00.00.30.10.10.10.40.10.20.10.60.50.8Nuclear.........................................7.17.17.35.67.15.67.37.37.15.67.36.227.127.226.2Conventionalhydropower..............1.71.51.51.51.71.51.11.72.02.21.21.86.36.07.2Nonhydrorenewables(d).............2.82.92.62.83.13.12.82.83.23.22.82.911.211.912.1Otherenergysources(e).............0.40.30.30.41.40.30.30.40.70.30.30.31.52.41.6Totalgeneration............................24.722.927.623.125.422.629.223.825.622.726.523.398.2100.998.2Netenergyforload(f)..................29.427.032.527.630.225.932.327.929.827.832.528.7116.4116.3118.8NewYork(NYISO)NaturalGas...................................12.914.119.715.214.014.619.614.914.114.618.113.361.963.160.1Coal..............................................0.00.00.00.00.00.00.00.00.00.00.00.00.00.00.0Nuclear.........................................9.37.77.27.06.47.06.66.96.76.57.07.031.126.827.1Conventionalhydropower..............6.96.86.97.27.16.66.66.97.27.37.37.527.927.229.3Nonhydrorenewables(d).............1.81.81.61.92.22.11.72.22.52.72.12.87.18.210.1Otherenergysources(e).............0.60.20.40.11.40.10.20.10.70.10.30.11.31.81.2Totalgeneration............................31.530.635.831.431.030.434.731.031.131.334.730.7129.3127.2127.8Netenergyforload(f)..................36.634.742.834.937.633.943.035.336.635.442.135.4149.0149.8149.4Mid-Atlantic(PJM)NaturalGas...................................72.770.888.978.576.972.491.278.276.282.8103.586.7310.9318.7349.2Coal..............................................50.539.955.429.548.637.248.533.842.533.444.330.0175.4168.1150.3Nuclear.........................................68.364.670.568.369.065.171.866.867.967.272.168.7271.7272.8275.9Conventionalhydropower..............2.62.32.22.22.62.31.62.12.62.61.72.19.38.59.1Nonhydrorenewables(d).............11.010.79.211.513.212.910.212.314.314.211.713.642.448.553.9Otherenergysources(e).............0.90.60.40.60.60.40.30.50.60.40.40.62.51.92.0Totalgeneration............................206.0188.9226.7190.6211.0190.3223.6193.6204.2200.7233.6201.7812.1818.5840.2Netenergyforload(f)..................194.5177.6215.3182.9200.9179.8211.9185.0199.7182.3210.7186.0770.2777.7778.7Southeast(SERC)NaturalGas...................................57.657.273.264.364.165.769.756.363.959.870.856.8252.3255.8251.3Coal..............................................36.333.744.323.332.333.944.628.432.727.741.027.4137.7139.1128.8Nuclear.........................................53.852.254.152.051.451.355.652.452.653.958.259.1212.2210.7223.8Conventionalhydropower..............11.610.410.911.011.99.98.99.812.610.19.210.243.940.542.1Nonhydrorenewables(d).............3.95.75.44.15.06.66.14.85.87.67.15.519.122.626.0Otherenergysources(e).............0.0-0.2-0.5-0.2-0.2-0.2-0.4-0.3-0.2-0.4-0.4-0.3-0.9-1.1-1.4Totalgeneration............................163.2159.0187.3154.6164.6167.1184.5151.5167.4158.7185.9158.6664.2667.6670.6Netenergyforload(f)..................161.3154.7183.9154.5166.5166.9188.1156.0168.7163.3190.1160.7654.4677.5682.8Florida(FRCC)NaturalGas...................................34.543.852.540.938.346.251.142.439.240.349.439.6171.8178.0168.4Coal..............................................4.75.35.62.83.54.45.03.02.93.74.32.418.315.813.3Nuclear.........................................7.87.27.25.87.37.98.07.17.06.97.57.728.130.329.2Conventionalhydropower..............0.10.10.10.10.10.00.00.00.10.00.00.00.20.20.2Nonhydrorenewables(d).............2.43.12.92.62.93.63.42.83.84.74.33.511.012.716.3Otherenergysources(e).............0.80.70.70.60.70.60.80.70.80.70.80.72.82.82.8Totalgeneration............................50.360.268.952.852.862.868.355.953.756.366.453.8232.2239.8230.2Netenergyforload(f)..................52.463.872.355.654.165.768.353.050.259.868.353.2244.1241.1231.5(f)Regionalgenerationfromgeneratingunitsoperatedbyelectricpowersector,plusenergyreceiptsfromminusenergydeliveriestoU.S.balancingauthoritiesoutsideregion.Table7dpart1.U.S.RegionalElectricityGeneration,ElectricPowerSector(billionkilowatthours),continuesonTable7dpart2U.S.EnergyInformationAdministrationShort-TermEnergyOutlook-August2022202120222023Year(a)Solargenerationfromlarge-scalepowerplantswithmorethan1megawattofcapacity.Excludesgenerationfromsmall-scalesolarphotovoltaicsystems.(b)Residualfueloil,distillatefueloil,petroleumcoke,andotherpetroleumliquids.(c)Batteries,chemicals,hydrogen,pitch,purchasedsteam,sulfur,nonrenewablewaste,andmiscellaneoustechnologies.(d)Wind,large-scalesolar,biomass,andgeothermal(e)Pumpedstoragehydroelectric,petroleum,othergases,batteries,andothernonrenewablefuels.Seenotes(b)and(c).Notes:EIAcompletedmodelingandanalysisforthisreportonAugust4,2022.Theapproximatebreakbetweenhistoricalandforecastvaluesisshownwithhistoricaldataprintedinbold;estimatesandforecastsinitalics.Datareflectgenerationsuppliedbypowerplantswithacombinedcapacityofatleast1megawattoperatedbyelectricutilitiesandindependentpowerproducers.Historicaldata:LatestdataavailablefromU.S.EnergyInformationAdministrationdatabasessupportingthefollowingreports:ElectricPowerMonthly,DOE/EIA-0226;andElectricPowerAnnual,DOE/EIA-0348.Q1Q2Q3Q4Q1Q2Q3Q4Q1Q2Q3Q4202120222023Midwest(MISO)NaturalGas...................................35.441.150.243.141.844.551.538.038.646.654.042.7169.7175.7181.8Coal..............................................69.760.183.254.764.559.083.961.060.052.971.853.2267.7268.4238.0Nuclear.........................................23.622.625.224.423.819.723.523.522.321.024.320.895.790.688.5Conventionalhydropower..............2.82.72.52.73.12.82.42.22.52.92.42.210.710.410.1Nonhydrorenewables(d).............24.123.118.527.331.827.519.629.034.029.321.330.893.1107.9115.3Otherenergysources(e).............1.81.31.71.71.31.51.51.21.51.41.51.46.45.55.7Totalgeneration............................157.4150.9181.2153.8166.4154.9182.4154.9158.9154.1175.3151.1643.3658.6639.4Netenergyforload(f)..................159.0154.0180.7153.5165.1158.5181.4157.7161.3159.4181.3159.5647.3662.8661.6Central(SouthwestPowerPool)NaturalGas...................................12.414.318.810.911.114.318.110.710.112.717.69.256.354.349.6Coal..............................................21.819.831.319.222.119.629.919.922.116.527.417.892.091.483.8Nuclear.........................................4.12.84.24.34.34.33.92.54.34.34.44.415.515.117.3Conventionalhydropower..............4.23.93.63.94.63.93.63.03.94.74.23.415.515.216.3Nonhydrorenewables(d).............22.923.820.526.428.829.524.129.430.731.125.430.393.6111.9117.5Otherenergysources(e).............0.30.10.10.20.20.20.10.20.30.20.10.20.70.80.8Totalgeneration............................65.764.778.564.771.271.979.765.771.369.679.165.3273.6288.6285.2Netenergyforload(f)..................65.565.578.562.068.069.177.661.466.065.276.561.0271.6276.1268.6Texas(ERCOT)NaturalGas...................................32.839.757.334.534.244.561.633.028.330.248.728.7164.2173.3136.0Coal..............................................16.318.522.717.017.717.421.716.315.716.921.815.874.573.170.1Nuclear.........................................10.59.811.08.911.09.910.610.910.78.911.010.140.242.440.7Conventionalhydropower..............0.20.20.10.10.20.20.10.10.20.20.10.10.60.60.6Nonhydrorenewables(d).............25.227.823.829.431.238.230.634.436.444.835.637.6106.3134.4154.4Otherenergysources(e).............0.20.30.40.40.30.40.40.50.40.40.40.51.41.71.7Totalgeneration............................85.296.2115.390.494.6110.7125.095.191.7101.4117.692.9387.1425.5403.6Netenergyforload(f)..................85.296.2115.390.494.6110.7125.095.191.7101.4117.692.9387.1425.5403.6NorthwestNaturalGas...................................20.920.128.221.019.618.130.320.724.412.627.216.890.288.781.0Coal..............................................22.519.126.622.221.618.926.923.919.516.524.521.590.591.281.9Nuclear.........................................2.51.22.52.32.52.42.42.42.41.22.42.48.59.78.4Conventionalhydropower..............33.831.025.730.439.336.932.527.733.540.430.227.7121.0136.4132.0Nonhydrorenewables(d).............15.917.015.217.419.119.817.018.520.021.418.219.965.574.479.6Otherenergysources(e).............0.20.20.20.20.20.20.10.10.10.10.10.10.70.60.5Totalgeneration............................95.888.798.593.5102.296.2109.293.3100.092.2102.788.4376.4400.8383.3Netenergyforload(f)..................89.986.197.789.788.088.896.387.991.086.394.587.6363.4361.0359.4SouthwestNaturalGas...................................10.715.219.411.59.612.919.112.412.614.520.110.556.854.057.6Coal..............................................5.55.68.37.46.16.18.45.94.54.36.55.426.826.520.7Nuclear.........................................8.57.18.67.58.27.58.67.48.47.58.67.531.631.731.9Conventionalhydropower..............2.02.31.91.51.92.12.21.82.12.52.41.97.78.09.0Nonhydrorenewables(d).............3.13.93.23.74.65.44.34.94.55.74.55.514.019.320.3Otherenergysources(e).............0.00.10.10.00.00.10.10.10.00.10.10.00.20.30.2Totalgeneration............................29.834.241.531.630.434.142.932.632.134.642.130.9137.1139.9139.7Netenergyforload(f)..................20.526.333.222.521.227.634.723.322.927.534.223.1102.5106.7107.7CaliforniaNaturalGas...................................16.717.929.421.615.813.921.619.812.311.820.721.885.671.266.6Coal..............................................1.81.43.01.40.51.22.82.11.41.32.72.07.66.57.4Nuclear.........................................2.94.25.04.34.64.24.54.04.64.74.64.116.517.318.0Conventionalhydropower..............2.44.24.92.83.65.24.82.13.57.66.93.514.415.721.6Nonhydrorenewables(d).............15.521.219.215.216.721.920.316.617.724.122.818.971.175.583.4Otherenergysources(e).............-0.1-0.10.0-0.10.0-0.10.0-0.10.00.00.00.0-0.2-0.2-0.1Totalgeneration............................39.348.961.545.341.246.453.944.439.649.457.750.2195.0185.9196.9Netenergyforload(f)..................55.662.577.359.556.061.975.059.157.762.473.858.9254.9252.0252.8(f)Regionalgenerationfromgeneratingunitsoperatedbyelectricpowersector,plusenergyreceiptsfromminusenergydeliveriestoU.S.balancingauthoritiesoutsideregion.Table7dpart2.U.S.RegionalElectricityGeneration,ElectricPowerSector(billionkilowatthours),continuedfromTable7dpart1U.S.EnergyInformationAdministrationShort-TermEnergyOutlook-August2022202120222023YearTheapproximatebreakbetweenhistoricalandforecastvaluesisshownwithhistoricaldataprintedinbold;estimatesandforecastsinitalics.Datareflectgenerationsuppliedbypowerplantswithacombinedcapacityofatleast1megawattoperatedbyelectricutilitiesandindependentpowerproducers.Historicaldata:LatestdataavailablefromU.S.EnergyInformationAdministrationdatabasessupportingthefollowingreports:ElectricPowerMonthly,DOE/EIA-0226;andElectricPowerAnnual,DOE/EIA-0348.(a)Large-scalesolargenerationfrompowerplantswithmorethan1megawattofcapacity.Excludesgenerationfromsmall-scalesolarphotovoltaicsystems.(b)Residualfueloil,distillatefueloil,petroleumcoke,andotherpetroleumliquids.(c)Batteries,chemicals,hydrogen,pitch,purchasedsteam,sulfur,nonrenewablewaste,andmiscellaneoustechnologies.(d)Wind,large-scalesolar,biomass,andgeothermal(e)Pumpedstoragehydroelectric,petroleum,othergases,batteries,andothernonrenewablefuels.Seenotes(b)and(c).Notes:EIAcompletedmodelingandanalysisforthisreportonAugust4,2022.Q1Q2Q3Q4Q1Q2Q3Q4Q1Q2Q3Q4202120222023ElectricPowerSectorGeothermal.................................................0.0340.0350.0350.0350.0340.0340.0370.0360.0330.0330.0370.0340.1380.1420.137HydroelectricPower(a)................................0.6030.5770.5330.5600.6710.6380.5720.5150.6300.7220.5890.5422.2722.3952.483Solar(b).......................................................0.1890.3090.3080.2070.2570.3810.3860.2610.3230.4940.4900.3401.0141.2861.648WasteBiomass(c)........................................0.0600.0590.0590.0580.0560.0540.0580.0570.0570.0560.0570.0560.2360.2250.225WoodBiomass.............................................0.0510.0460.0540.0480.0520.0440.0500.0440.0480.0420.0500.0440.1990.1890.184Wind.............................................................0.8630.8560.6840.9691.0641.0530.7681.0541.1261.1050.8041.0983.3723.9384.134Subtotal.....................................................1.8001.8811.6731.8762.1352.2041.8701.9672.2182.4522.0262.1157.2318.1758.811IndustrialSectorBiofuelLossesandCo-products(d)...............0.1790.1990.1960.2160.2030.2040.2050.2080.1970.2010.2020.2070.7890.8190.808Geothermal.................................................0.0010.0010.0010.0010.0010.0010.0010.0010.0010.0010.0010.0010.0040.0040.004HydroelectricPower(a)................................0.0020.0020.0020.0020.0020.0020.0020.0020.0020.0020.0020.0020.0080.0080.008Solar(b)........................................................0.0070.0110.0110.0070.0080.0110.0120.0080.0090.0120.0130.0090.0360.0390.042WasteBiomass(c)........................................0.0420.0400.0370.0420.0420.0400.0400.0420.0410.0400.0400.0420.1600.1630.163WoodBiomass.............................................0.3330.3390.3430.3280.3150.3250.3530.3610.3510.3480.3600.3631.3421.3541.421Subtotal(e)................................................0.5680.5960.5950.6020.5760.5880.6170.6270.6060.6100.6230.6302.3612.4092.468CommercialSectorGeothermal.................................................0.0060.0060.0060.0060.0060.0060.0060.0060.0060.0060.0060.0060.0240.0250.025Solar(b)......................................................0.0280.0420.0420.0280.0330.0490.0500.0350.0400.0590.0590.0410.1400.1670.200WasteBiomass(c)........................................0.0090.0080.0090.0090.0100.0090.0090.0090.0090.0090.0090.0090.0350.0360.036WoodBiomass.............................................0.0200.0200.0210.0210.0200.0200.0210.0210.0200.0210.0210.0210.0830.0830.083Subtotal(e)................................................0.0700.0850.0860.0720.0770.0920.0940.0790.0840.1020.1040.0860.3130.3420.375ResidentialSectorGeothermal.................................................0.0100.0100.0100.0100.0100.0100.0100.0100.0100.0100.0100.0100.0400.0400.040Solar(f).........................................................0.0650.0990.0970.0670.0790.1200.1210.0840.0930.1430.1450.1010.3290.4040.482WoodBiomass.............................................0.1140.1160.1170.1170.1190.1170.1170.1170.1190.1170.1170.1170.4640.4700.470Subtotal.....................................................0.1890.2250.2240.1940.2080.2470.2480.2110.2220.2700.2720.2280.8320.9140.992TransportationSectorBiodiesel,RenewableDiesel,andOther(g)...0.0800.0950.0890.1080.0940.1150.1190.1460.1380.1400.1360.1640.3720.4740.577Ethanol(g)....................................................0.2430.2810.2850.2880.2590.2800.2800.2820.2610.2820.2840.2861.0971.1011.113Subtotal.....................................................0.3220.3760.3740.3970.3530.3920.3990.4290.3990.4220.4200.4501.4691.5721.691AllSectorsTotalBiodiesel,RenewableDiesel,andOther(g)...0.0800.0950.0890.1080.0940.1150.1190.1460.1380.1400.1360.1640.3720.4740.577BiofuelLossesandCo-products(d)...............0.1790.1990.1960.2160.2030.2040.2050.2080.1970.2010.2020.2070.7890.8190.808Ethanol(f).....................................................0.2530.2930.2980.3010.2700.2930.2920.2950.2730.2950.2970.2991.1461.1501.163Geothermal.................................................0.0500.0520.0520.0520.0510.0510.0540.0530.0500.0500.0540.0510.2060.2100.206HydroelectricPower(a)................................0.6050.5800.5350.5620.6740.6400.5740.5170.6330.7240.5920.5452.2832.4062.494Solar(b)(f)....................................................0.2900.4610.4580.3100.3780.5610.5690.3880.4660.7080.7060.4911.5191.8962.371WasteBiomass(c)........................................0.1100.1070.1060.1090.1070.1040.1060.1080.1070.1050.1050.1070.4310.4260.425WoodBiomass.............................................0.5190.5200.5350.5130.5070.5070.5410.5420.5380.5280.5480.5452.0872.0972.159Wind.............................................................0.8630.8560.6840.9691.0641.0530.7681.0541.1261.1050.8041.0983.3723.9384.134TotalConsumption.........................................2.9503.1622.9533.1413.3493.5233.2273.3133.5283.8563.4443.50812.20613.41214.337(a)Conventionalhydroelectricpoweronly.Hydroelectricitygeneratedbypumpedstorageisnotincludedinrenewableenergy.(b)Solarconsumptionintheelectricpower,commercial,andindustrialsectorsincludesenergyproducedfromlargescale(>1MW)solarthermalandphotovoltaicgeneratorsandsmall-scale(<1MW)distributedso(c)Municipalsolidwastefrombiogenicsources,landfillgas,sludgewaste,agriculturalbyproducts,andotherbiomass.(d)Lossesandco-productsfromtheproductionoffuelethanolandbiomass-baseddiesel(f)Solarconsumptionintheresidentialsectorincludesenergyfromsmall-scale(<1MW)solarphotovoltaicsystems.Alsoincludessolarheatingconsumptioninallsectors.-=nodataavailableMinordiscrepancieswithpublishedhistoricaldataareduetoindependentrounding.Table8a.U.S.RenewableEnergyConsumption(QuadrillionBtu)U.S.EnergyInformationAdministrationShort-TermEnergyOutlook-August2022202120222023Year(e)Subtotalsfortheindustrialandcommercialsectorsmightnotequalthesumofthecomponents.Thesubtotalfortheindustrialsectorincludesethanolconsumptionthatisnotshownseparately.Thesubtotalforthecommercialsectorincludesethanolandhydroelectricconsumptionthatarenotshownseparately.(g)Fuelethanolandbiodiesel,renewablediesel,andotherbiofuelsconsumptioninthetransportationsectorincludesproduction,stockchange,andimportslessexports.Somebiomass-baseddieselmaybeconsumedintheresidentialsectorinheatingoil.Notes:EIAcompletedmodelingandanalysisforthisreportonAugust4,2022.Theapproximatebreakbetweenhistoricalandforecastvaluesisshownwithhistoricaldataprintedinbold;estimatesandforecastsinitalics.Historicaldata:LatestdataavailablefromEIAdatabasessupportingthefollowingreports:ElectricPowerMonthly,DOE/EIA-0226andRenewableEnergyAnnual,DOE/EIA-0603;PetroleumSupplyForecasts:EIAShort-TermIntegratedForecastingSystem.Q1Q2Q3Q4Q1Q2Q3Q4Q1Q2Q3Q4202120222023RenewableEnergyElectricGeneratingCapacity(megawatts,endofperiod)ElectricPowerSector(a)Biomass..............................................6,1615,9975,9805,9775,9315,9365,9335,9565,9355,9375,8795,8795,9775,9565,879Waste..............................................3,7003,6803,6773,6743,6293,6343,6313,6533,6333,6353,5763,5763,6743,6533,576Wood...............................................2,4612,3182,3032,3032,3032,3032,3032,3032,3032,3032,3032,3032,3032,3032,303ConventionalHydroelectric................78,73678,79678,79878,79878,80878,81278,85778,88078,88078,88978,91678,92678,79878,88078,926Geothermal.........................................2,4832,4832,4832,4832,4832,5172,5172,5422,5422,5422,5422,5422,4832,5422,542Large-ScaleSolar(b).........................50,36852,35955,60960,67163,12666,56471,23680,17383,68089,31791,859104,55560,67180,173104,555Wind...................................................121,201124,742126,696132,243134,937137,777139,172143,371143,521144,312144,672147,740132,243143,371147,740OtherSectors(c)Biomass..............................................6,2066,2106,2146,2146,1446,1566,1486,1486,1486,1406,1406,1406,2146,1486,140Waste..............................................827830829829821821821821821821821821829821821Wood...............................................5,3805,3805,3855,3855,3225,3345,3275,3275,3275,3185,3185,3185,3855,3275,318ConventionalHydroelectric................291291288288288291291291291291291291288291291Large-ScaleSolar(b).........................473475511529553565565589589637637637529589637Small-ScaleSolar(d).........................28,84630,32531,51532,97234,72036,29938,00339,82541,76943,83946,04148,38132,97239,82548,381ResidentialSector...........................18,02319,10220,03921,02222,26023,33024,49125,74827,10328,56030,12531,80121,02225,74831,801CommercialSector..........................8,7349,0869,3009,72810,22010,70311,18611,69012,21712,76613,33913,9389,72811,69013,938IndustrialSector...............................2,0892,1372,1762,2232,2402,2652,3262,3872,4492,5132,5772,6422,2232,3872,642Wind...................................................121121121121122122122122122122122122121122122RenewableElectricityGeneration(billionkilowatthours)ElectricPowerSector(a)Biomass..............................................7.26.87.26.76.76.36.86.46.66.36.76.327.926.226.0Waste..............................................4.03.93.83.83.53.63.83.73.73.73.73.615.514.614.6Wood...............................................3.22.83.42.93.22.83.12.73.02.63.12.712.411.711.4ConventionalHydroelectric................68.765.860.763.876.571.864.257.870.881.066.260.9259.0270.3278.9Geothermal.......................................3.83.94.04.03.93.94.24.13.83.74.23.915.716.115.6Large-ScaleSolar(b).........................21.334.734.623.328.942.843.429.436.355.555.038.2113.9144.4185.0Wind..................................................97.096.176.8108.8119.5118.386.2118.3126.5124.190.3123.3378.6442.3464.2OtherSectors(c)Biomass..............................................6.96.87.16.86.76.77.16.86.76.77.16.827.627.327.3Waste..............................................0.70.70.70.70.70.70.70.70.70.70.70.72.82.82.8Wood...............................................6.26.16.46.15.96.16.46.15.96.16.46.124.824.524.5ConventionalHydroelectric................0.30.30.30.30.30.30.30.30.30.30.30.31.21.21.2Large-ScaleSolar(b).........................0.20.20.20.20.20.30.30.20.20.30.30.20.81.01.1Small-ScaleSolar(d).........................9.814.714.510.012.017.818.012.514.321.521.815.249.060.372.8ResidentialSector..........................5.99.18.96.17.611.311.47.99.013.814.09.830.138.246.7CommercialSector.........................3.14.54.53.03.65.35.43.74.36.36.44.415.118.021.5IndustrialSector..............................0.81.11.10.80.81.21.20.90.91.31.41.03.84.14.6Wind..................................................0.30.30.20.40.10.10.10.10.10.10.10.11.10.30.3(a)Powerplantslargerthanorequaltoonemegawattinsizethatareoperatedbyelectricutilitiesorindependentpowerproducers.(b)Solarthermalandphotovoltaicgeneratingunitsatpowerplantslargerthanorequalto1megawatt.(d)Solarphotovoltaicsystemssmallerthanonemegawatt.Historicaldata:LatestdataavailablefromEIAdatabasessupportingtheElectricPowerMonthly,DOE/EIA-0226.Minordiscrepancieswithpublishedhistoricaldataareduetoindependentrounding.Table8b.U.S.RenewableElectricityGenerationandCapacityU.S.EnergyInformationAdministrationShort-TermEnergyOutlook-August2022202120222023Year(c)Businessesorindividualhouseholdsnotprimarilyengagedinelectricpowerproductionforsaletothepublic,whosegeneratingcapacityisatleastonemegawatt(exceptforsmall-scalesolarphotovoltaicdata,whichconsistsofsystemssmallerthan1megawatt).-=nodataavailableNotes:EIAcompletedmodelingandanalysisforthisreportonAugust4,2022.Theapproximatebreakbetweenhistoricalandforecastvaluesisshownwithhistoricaldataprintedinbold;estimatesandforecastsinitalics.Forecasts:EIAShort-TermIntegratedForecastingSystem.Q1Q2Q3Q4Q1Q2Q3Q4Q1Q2Q3Q4202120222023MacroeconomicRealGrossDomesticProduct(billionchained2012dollars-SAAR)............................19,05619,36819,47919,80619,72819,61619,68519,81419,90620,01520,12920,24419,42719,71120,074RealPersonalConsumptionExpend.(billionchained2012dollars-SAAR)............................13,28313,66613,73213,81813,88113,92413,97914,04914,11714,20714,29414,38713,62513,95814,251RealPrivateFixedInvestment(billionchained2012dollars-SAAR)............................3,5643,5933,5853,6093,6743,6313,6513,6483,6583,6713,6843,7013,5883,6513,679BusinessInventoryChange(billionchained2012dollars-SAAR)............................-94-174-602492389689118108100104101-20135103RealGovernmentExpenditures(billionchained2012dollars-SAAR)............................3,3913,3743,3823,3593,3343,3073,3083,3253,3503,3573,3673,3783,3763,3193,363RealExportsofGoods&Services(billionchained2012dollars-SAAR)............................2,2622,3042,2732,3912,3612,4362,4532,4832,5212,5602,5982,6362,3082,4332,579RealImportsofGoods&Services(billionchained2012dollars-SAAR)............................3,4883,5493,5903,7413,9063,9343,9713,9764,0214,0574,0964,1403,5923,9474,079RealDisposablePersonalIncome(billionchained2012dollars-SAAR)............................17,21915,80715,64115,46215,15215,13115,14115,26215,40615,64515,87216,08216,03215,17215,751Non-FarmEmployment(millions).........................................................................143.7145.2146.9148.6150.4151.6152.4153.0153.4153.6153.8153.9146.1151.8153.6CivilianUnemploymentRate(percent).........................................................................6.25.95.14.23.83.63.63.73.94.04.24.35.43.74.1HousingStarts(millions-SAAR).............................................................1.581.591.571.681.721.651.551.511.511.511.501.471.611.611.50IndustrialProductionIndices(Index,2017=100)TotalIndustrialProduction................................................98.199.7100.5101.7103.0104.5105.1105.9105.8106.1106.6106.8100.0104.6106.3Manufacturing.................................................................96.998.399.2100.6101.6102.7103.0103.9103.8104.3104.9105.398.8102.8104.6Food............................................................................104.5103.3102.0103.5105.5105.1105.4105.7105.9106.3106.7107.2103.3105.4106.5Paper..........................................................................95.096.096.095.296.497.397.298.197.697.898.098.495.597.398.0PetroleumandCoalProducts.....................................86.092.393.596.094.194.594.894.994.594.794.995.192.094.694.8Chemicals....................................................................94.3101.1101.2102.6102.5103.4103.2104.6104.0104.5105.4106.099.8103.4104.9NonmetallicMineralProducts....................................97.896.097.399.1102.7102.4101.8101.7101.1101.3101.8102.997.5102.2101.8PrimaryMetals.............................................................93.096.698.398.795.897.198.2103.2101.6103.2105.0105.896.698.6103.9Coal-weightedManufacturing(a)...................................91.194.995.596.696.296.796.898.997.898.699.6100.194.597.299.0Distillate-weightedManufacturing(a)............................100.9102.2102.7104.2105.7106.3106.3107.1106.7107.1107.8108.4102.5106.3107.5Electricity-weightedManufacturing(a)...........................93.196.496.597.698.198.999.0100.7100.2100.9101.8102.395.999.2101.3NaturalGas-weightedManufacturing(a).......................88.894.694.195.295.395.895.697.496.597.197.998.493.196.097.5PriceIndexesConsumerPriceIndex(allurbanconsumers)(index,1982-1984=1.00).................................................2.642.692.732.782.852.922.952.972.982.993.013.042.712.923.01ProducerPriceIndex:AllCommodities(index,1982=1.00)..........................................................2.102.242.332.422.532.692.632.592.562.502.492.492.272.612.51ProducerPriceIndex:Petroleum(index,1982=1.00)..........................................................2.002.362.552.723.164.213.312.962.842.872.842.792.413.412.84GDPImplicitPriceDeflator(index,2012=100)...........................................................115.8117.5119.3121.3123.7125.9127.3128.4129.3130.0130.8131.7118.5126.3130.4MiscellaneousVehicleMilesTraveled(b)(millionmiles/day)............................................................7,9289,1259,3688,9348,3739,1289,3059,1438,5879,4439,6309,2408,8438,9909,228AirTravelCapacity(Availableton-miles/day,thousands)..............................537597658667656698720674666695716701615687695AircraftUtilization(Revenueton-miles/day,thousands)..............................245340372376356413399371360405408383334385389AirlineTicketPriceIndex(index,1982-1984=100)..................................................198.4243.3218.5210.0225.6326.7300.9300.1267.9308.9284.4286.8217.5288.3287.0RawSteelProduction(millionshorttonsperday)..............................................0.2460.2580.2670.2600.2530.2530.2620.2930.3070.3060.3260.3450.2580.2660.321CarbonDioxide(CO2)Emissions(millionmetrictons)Petroleum..........................................................................5175595705785625565675805575715815832,2242,2652,292NaturalGas.......................................................................4853533734265083623714324843533764401,6371,6741,654Coal...................................................................................2562293072092452272962262321982712061,001994907TotalEnergy(c).................................................................1,2601,1441,2521,2161,3181,1471,2371,2411,2751,1261,2311,2324,8724,9434,864SAAR=Seasonally-adjustedannualrateTable9a.U.S.MacroeconomicIndicatorsandCO2EmissionsU.S.EnergyInformationAdministrationShort-TermEnergyOutlook-August2022202120222023YearHistoricaldata:LatestdataavailablefromU.S.DepartmentofCommerce,BureauofEconomicAnalysis;FederalReserveSystem,StatisticalreleaseG17;FederalHighwayAdministration;andFederalMinordiscrepancieswithpublishedhistoricaldataareduetoindependentrounding.Forecasts:EIAShort-TermIntegratedForecastingSystem.U.S.macroeconomicforecastsarebasedontheS&PGlobalmodeloftheU.S.Economy.(a)FuelshareweightsofindividualsectorindicesbasedonEIAManufacturingEnergyConsumptionSurvey.(b)Totalhighwaytravelincludesgasolineanddieselfuelvehicles.(c)Includeselectricpowersectoruseofgeothermalenergyandnon-biomasswaste.-=nodataavailableNotes:EIAcompletedmodelingandanalysisforthisreportonAugust4,2022.Theapproximatebreakbetweenhistoricalandforecastvaluesisshownwithhistoricaldataprintedinbold;estimatesandforecastsinitalics.Q1Q2Q3Q4Q1Q2Q3Q4Q1Q2Q3Q4202120222023RealGrossStateProduct(Billion$2012)NewEngland................9791,0011,0081,0261,0261,0201,0221,0281,0311,0351,0391,0441,0041,0241,037MiddleAtlantic..............2,7182,7562,7742,8132,8022,7832,7922,8122,8242,8362,8492,8652,7652,7972,843E.N.Central................2,4852,5142,5202,5532,5442,5252,5332,5482,5582,5732,5892,6032,5182,5382,581W.N.Central...............1,1991,2131,2151,2211,2141,2061,2111,2191,2241,2311,2381,2451,2121,2131,235S.Atlantic.....................3,3823,4363,4613,5173,5063,4883,5013,5253,5423,5623,5833,6033,4493,5053,572E.S.Central................836842846861858852854858861865870874846856868W.S.Central...............2,3202,3622,3782,4312,4162,4112,4262,4442,4602,4752,4912,5072,3732,4242,483Mountain......................1,2741,2961,3031,3241,3161,3111,3161,3261,3341,3441,3541,3641,2991,3171,349Pacific..........................3,6923,7743,8003,8833,8703,8443,8543,8773,8933,9153,9363,9583,7873,8613,925IndustrialOutput,Manufacturing(Index,Year2017=100)NewEngland................95.196.697.698.899.7100.7100.8101.6101.6102.1102.6102.997.0100.7102.3MiddleAtlantic..............92.994.194.996.297.098.198.399.299.199.499.9100.294.598.299.7E.N.Central................95.295.896.898.799.3100.1100.2100.9100.9101.5102.3102.696.6100.1101.8W.N.Central...............98.199.2100.2101.1102.4103.2103.3104.2104.2104.8105.5106.099.7103.3105.1S.Atlantic.....................99.2100.4101.5103.0103.8105.2105.5106.3106.0106.4107.0107.4101.0105.2106.7E.S.Central................97.598.599.4100.9101.3102.0102.3103.2102.9103.4104.2104.599.1102.2103.8W.S.Central...............98.3100.0100.9102.5103.9105.5106.1107.1107.0107.7108.4108.9100.4105.7108.0Mountain......................106.3108.5109.6111.5113.1114.4114.5115.4115.2115.7116.4116.9109.0114.4116.0Pacific..........................94.095.696.297.498.299.399.8101.0101.3101.8102.4102.895.899.6102.1RealPersonalIncome(Billion$2012)NewEngland................998948942929928926926932936943949954955928945MiddleAtlantic..............2,6152,4502,4372,3952,3822,3792,3812,3972,4112,4262,4412,4542,4742,3852,433E.N.Central................2,7452,5242,4932,4722,4582,4442,4442,4572,4692,4872,5042,5182,5582,4512,494W.N.Central...............1,2751,1941,1751,1631,1601,1611,1631,1681,1741,1811,1881,1941,2021,1631,184S.Atlantic.....................3,7213,4443,4283,4373,4173,4183,4193,4393,4603,4873,5143,5373,5073,4233,500E.S.Central................1,025927924921914912910914919925931936949913928W.S.Central...............2,2372,0772,0702,0772,0632,0692,0742,0892,1042,1212,1372,1532,1152,0742,129Mountain......................1,3811,2801,2771,2841,2771,2751,2751,2841,2921,3041,3151,3251,3061,2781,309Pacific..........................3,2683,0873,0853,0373,0193,0243,0203,0343,0493,0703,0903,1063,1193,0243,079Households(Thousands)NewEngland................6,0566,0616,0586,0666,0736,0776,0816,0896,0976,1056,1126,1206,0666,0896,120MiddleAtlantic..............16,41516,40516,39016,40616,41616,42516,43216,45216,47516,49916,52116,54016,40616,45216,540E.N.Central................19,07619,09019,09619,13419,15919,16819,17519,19419,21819,24519,27019,29319,13419,19419,293W.N.Central...............8,7158,7298,7368,7618,7798,7968,8128,8278,8458,8648,8828,8988,7618,8278,898S.Atlantic.....................26,28026,35826,40226,52026,61926,70626,78526,87226,96227,05027,13527,21826,52026,87227,218E.S.Central................7,8137,8307,8397,8667,8887,9077,9247,9407,9587,9767,9948,0117,8667,9408,011W.S.Central...............15,33115,37915,41415,48815,55215,60915,66215,71615,77015,82515,87915,93015,48815,71615,930Mountain......................9,6119,6539,6889,7419,7869,8269,8649,9019,9419,98310,02210,0619,7419,90110,061Pacific..........................19,00018,99218,97919,01219,04119,06219,08419,10619,13119,15819,18319,21019,01219,10619,210TotalNon-farmEmployment(Millions)NewEngland................7.17.17.27.37.47.47.57.57.57.57.57.57.27.57.5MiddleAtlantic..............18.518.718.919.219.419.619.719.819.819.819.819.918.819.619.8E.N.Central................21.121.221.421.621.922.022.122.122.222.222.222.321.322.022.2W.N.Central...............10.410.410.510.510.610.710.810.810.810.810.810.910.510.710.8S.Atlantic.....................28.228.528.829.229.529.829.930.130.130.230.230.228.729.830.2E.S.Central................8.18.18.28.38.48.48.48.58.58.58.58.58.28.48.5W.S.Central...............17.217.417.617.918.118.318.418.518.518.618.618.617.518.318.6Mountain......................10.811.011.111.311.411.511.511.611.611.711.711.711.111.511.7Pacific..........................22.222.723.123.323.723.924.024.124.224.224.324.322.823.924.2Table9b.U.S.RegionalMacroeconomicDataU.S.EnergyInformationAdministrationShort-TermEnergyOutlook-August2022202120222023YearMinordiscrepancieswithpublishedhistoricaldataareduetoindependentrounding.Forecasts:U.S.macroeconomicforecastsarebasedontheIHSMarkitmodeloftheU.S.Economy.-=nodataavailableNotes:EIAcompletedmodelingandanalysisforthisreportonAugust4,2022.Theapproximatebreakbetweenhistoricalandforecastvaluesisshownwithhistoricaldataprintedinbold;estimatesandforecastsinitalics.RegionsrefertoU.S.Censusdivisions.See"Censusdivision"inEIA’sEnergyGlossary(http://www.eia.doe.gov/glossary/index.html)foralistofStatesineachregion.Historicaldata:LatestdataavailablefromU.S.DepartmentofCommerce,BureauofEconomicAnalysis;FederalReserveSystem,StatisticalreleaseG17.Q1Q2Q3Q4Q1Q2Q3Q4Q1Q2Q3Q4202120222023HeatingDegreeDaysNewEngland................3,013779851,9223,1397851242,1333,0808481352,1375,7996,1816,200MiddleAtlantic..............2,821668571,7262,940672791,9652,858681831,9695,2725,6565,592E.N.Central.................3,085707691,8883,2687541232,2483,1497421262,2535,7496,3936,270W.N.Central................3,228720892,0293,4867921522,4543,2497161682,4636,0666,8846,596SouthAtlantic...............1,346212107991,342189129511,382195139532,3682,4942,543E.S.Central.................1,790315191,0351,822248191,2951,812263221,3043,1593,3843,401W.S.Central................1,29412114961,3445647821,1678957881,9122,1862,049Mountain.......................2,3086641101,6342,2957411301,8372,2307061561,8544,7155,0034,946Pacific...........................1,562482771,2061,401609831,2241,554577931,2243,3263,3173,449U.S.Average............2,107472511,3072,149493701,5242,106488771,5273,9364,2354,198HeatingDegreeDays,Prior10-yearAverageNewEngland................3,1338551072,1003,1008521072,1043,1518581072,1096,1956,1646,225MiddleAtlantic..............2,912677711,9112,887684711,9082,945692711,9115,5725,5515,619E.N.Central.................3,1577311042,1703,133727972,1623,215741962,1716,1616,1196,223W.N.Central................3,2487281332,3683,2197261252,3573,3187541252,3676,4776,4276,564SouthAtlantic...............1,395181119161,380187119061,401190109012,5032,4832,503E.S.Central.................1,771231161,2491,763243151,2281,809251141,2253,2673,2493,299W.S.Central................1,1408637861,1449337541,1899537612,0151,9942,048Mountain.......................2,1887041351,8502,1816851321,8172,2007011331,8234,8774,8164,858Pacific...........................1,461553811,1471,455522791,1361,439523791,1423,2423,1923,183U.S.Average............2,112483651,4872,096479621,4732,133486621,4754,1474,1104,156CoolingDegreeDaysNewEngland................0143457607947220874162606554505MiddleAtlantic..............0183625230151599501565445831755705E.N.Central.................2250629301256544702095286911808744W.N.Central................831174723330169610325564791,0891,010913SouthAtlantic...............1546151,1692841557131,1752351256431,1502342,2222,2772,153E.S.Central.................404341,014126296061,09567284891,018621,6141,7971,596W.S.Central................907681,472315561,0961,599209888361,4721992,6452,9602,596Mountain.......................1052796568174709407417413908711,5711,5011,410Pacific...........................2425470757312176066225169578621,042915833U.S.Average............50411902127464668909544392843941,4901,4971,373CoolingDegreeDays,Prior10-yearAverageNewEngland................080474108747120874702555561560MiddleAtlantic..............016361060162608801596058779779773E.N.Central.................3234572732385719123456010816821805W.N.Central................729468610729968111429167012997999977SouthAtlantic...............1436791,1942601476681,1882691446751,1902732,2762,2722,283E.S.Central.................425321,06574445181,05784365211,062861,7131,7021,706W.S.Central................1148811,5682101138531,5362241018611,5422262,7722,7262,730Mountain.......................2444194985234589468423456943821,4991,5111,505Pacific...........................311936488631208665853221466084959989989U.S.Average............5241389210453412889109504158881101,4611,4631,464Table9c.U.S.RegionalWeatherDataU.S.EnergyInformationAdministrationShort-TermEnergyOutlook-August2022202120222023YearRegionsrefertoU.S.Censusdivisions.See"Censusdivision"inEIA’sEnergyGlossary(http://www.eia.gov/tools/glossary/)foralistofstatesineachregion.Historicaldata:LatestdataavailablefromU.S.DepartmentofCommerce,NationalOceanicandAtmosphericAssociation(NOAA).Forecasts:BasedonforecastsbytheNOAAClimatePredictionCenter(http://www.cpc.ncep.noaa.gov/pacdir/DDdir/NHOME3.shtml).-=nodataavailableNotes:EIAcompletedmodelingandanalysisforthisreportonAugust4,2022.Theapproximatebreakbetweenhistoricalandforecastvaluesisshownwithhistoricaldataprintedinbold;estimatesandforecastsinitalics.RegionaldegreedaysforeachperiodarecalculatedbyEIAascontemporaneousperiodpopulation-weightedaveragesofstatedegreedaydatapublishedbytheNationalOceanicandAtmosphericAdministration(NOAA).SeeChangeinRegionalandU.S.Degree-DayCalculations(http://www.eia.gov/forecasts/steo/special/pdf/2012_sp_04.pdf)formoreinformation.Theapproximatebreakbetweenhistoricalandforecastvaluesisshownwithhistoricaldataprintedinbold;estimatesandforecastsinitalics.AppendixtotheAugust2022Short-TermEnergyOutlookTablea1.SummaryofEstimatedPetroleumandOtherLiquidsQuantitiesJun2022Jul2022Jun2022–Jul2022AverageJun2021–Jul2021Average2019–2021AverageGlobalPetroleumandOtherLiquids(millionbarrelsperday)GlobalPetroleumandOtherLiquidsProduction(a)99.7100.3100.096.296.6GlobalPetroleumandOtherLiquidsConsumption(b)99.398.899.198.296.7BiofuelsProduction(c)3.03.13.13.12.7BiofuelsConsumption(c)2.62.62.62.62.6IranLiquidFuelsProduction3.63.63.63.63.2IranLiquidFuelsConsumption1.81.91.81.81.9PetroleumandPetroleumProductsProducedandConsumedinCountriesOtherThanIran(millionbarrelsperday)Production(d)93.293.593.489.690.7Consumption(d)94.994.494.793.892.2ProductionminusConsumption-1.8-0.9-1.3-4.2-1.6WorldInventoryNetWithdrawalsIncludingIran-0.4-1.5-1.01.90.0EstimatedOECDInventoryLevel(e)(millionbarrels)2,6882,7282,7082,8502,943SurplusProductionCapacity(millionbarrelsperday)OPECSurplusCrudeOilProductionCapacity(f)2.52.12.35.24.3Note:Theterm“petroleumandotherliquids”encompassescrudeoil,leasecondensate,naturalgasliquids,biofuels,coal-to-liquids,gas-to-liquids,andrefineryprocessinggains,whichareimportanttoconsiderinconcertduetotheinter-relatedsupply,demand,andpricedynamicsofpetroleum,petroleumproducts,andrelatedfuels.(a)Productionincludescrudeoil(includingleasecondensates),naturalgasliquids,otherliquids,andrefineryprocessinggains.(b)ConsumptionofpetroleumbytheOECDcountriesissynonymouswith“productssupplied,"definedintheglossaryoftheEIAPetroleumSupplyMonthly,DOE/EIA-0109.Consumptionofpetroleumbythenon-OECDcountriesis"apparentconsumption,"whichincludesinternalconsumption,refineryfuel,andloss,andbunkering.(c)BiofuelsproductionandconsumptionarebasedonEIAestimatesaspublishedintheInternationalEnergyStatistics.BiofuelsproductioninthethirdquartertendstobeatitshighestlevelintheyearasethanolproductioninBrazilreachesitsseasonalpeakandistypicallylowestinthefirstquarterasseasonalproductionfallsintheSouth/South-CentralregionofBrazil.(d)GlobalproductionofpetroleumandpetroleumproductsoutsideofIranisderivedbysubtractingbiofuelsproductionandIranliquidfuelsproductionfromgloballiquidfuelsproduction.ThesamemethodisusedtocalculateglobalconsumptionoutsideofIran.(e)EstimatedinventorylevelisforOECDcountriesonly.Thisappendixispreparedinfulfillmentofsection1245(d)(4)(A)oftheNationalDefenseAuthorizationAct(NDAA)forFiscalYear2012,asamended.ThelawrequirestheU.S.EnergyInformationAdministration(EIA),thestatisticalandanalyticalagencywithintheU.S.DepartmentofEnergy,tosubmittoCongressareportontheavailabilityandpriceofpetroleumandpetroleumproductsproducedincountriesotherthanIraninthetwo-monthperiodprecedingthesubmissionofthereport.Bylaw,EIA’sdata,analyses,andforecastsareindependentofapprovalbyanyotherofficeroremployeeoftheU.S.Government.Thedatainthisappendix,therefore,shouldnotbeconstruedasrepresentingthoseoftheU.S.DepartmentofEnergyorotherfederalagencies.EIAconsultedwiththeU.S.DepartmentoftheTreasury,theU.S.DepartmentofState,andtheintelligencecommunityintheprocessofdevelopingtheNDAAreport,whichwaspreviouslypublishedasastand-alonereport.DetailedbackgroundandcontextualinformationnotrepeatedherecanbefoundinearlyeditionsoftheNDAAreport.ThisappendixispublishedintheShort-TermEnergyOutlookinevennumberedmonths.(f)EIAdefinessurplusoilproductioncapacityaspotentialoilproductionthatcouldbebroughtonlinewithin30daysandsustainedforatleast90days,consistentwithsoundbusinesspractices.Thisdoesnotincludeoilproductionincreasesthatcouldnotbesustainedwithoutdegradingthefutureproductioncapacityofafield.Source:U.S.EnergyInformationAdministration.Tablea2.CrudeOilandPetroleumProductPriceDataItemJun2022Jul2022Jun2022–Jul2022AverageJun2021–Jul2021Average2019–2021AverageBrentFrontMonthFuturesPrice($perbarrel)117.50105.12111.4673.8459.44WTIFrontMonthFuturesPrice($perbarrel)114.3499.38107.0471.8854.82DubaiFrontMonthFuturesPrice($perbarrel)113.16103.16108.2872.2858.86Brent1st-13thMonthFuturesSpread($perbarrel)20.4017.4418.966.121.80WTI1st-13thMonthFuturesSpread($perbarrel)21.4217.0119.277.261.37RBOBFrontMonthFuturesPrice($pergallon)3.993.343.672.241.67HeatingOilFrontMonthFuturesPrice($pergallon)4.303.643.982.121.75RBOB-BrentFuturesCrackSpread($pergallon)1.190.841.020.480.25HeatingOil-BrentFuturesCrackSpread($pergallon)1.511.141.330.370.34(a)BrentreferstoBrentcrudeoiltradedontheIntercontinentalExchange(ICE).(b)WTIreferstoWestTexasIntermediatecrudeoiltradedontheNewYorkMercantileExchange(NYMEX),ownedbyChicagoMercantileExchange(CME)Group.(c)RBOBreferstoreformulatedblendstockforoxygenateblendingtradedontheNYMEX.Source:U.S.EnergyInformationAdministration,basedonChicagoMercantileExchange(CME),IntercontinentalExchange(ICE),andDubaiMercantileExchange(DME).


 VIP
VIP VIP
VIP VIP
VIP VIP
VIP VIP
VIP VIP
VIP VIP
VIP VIP
VIP VIP
VIP VIP
VIP