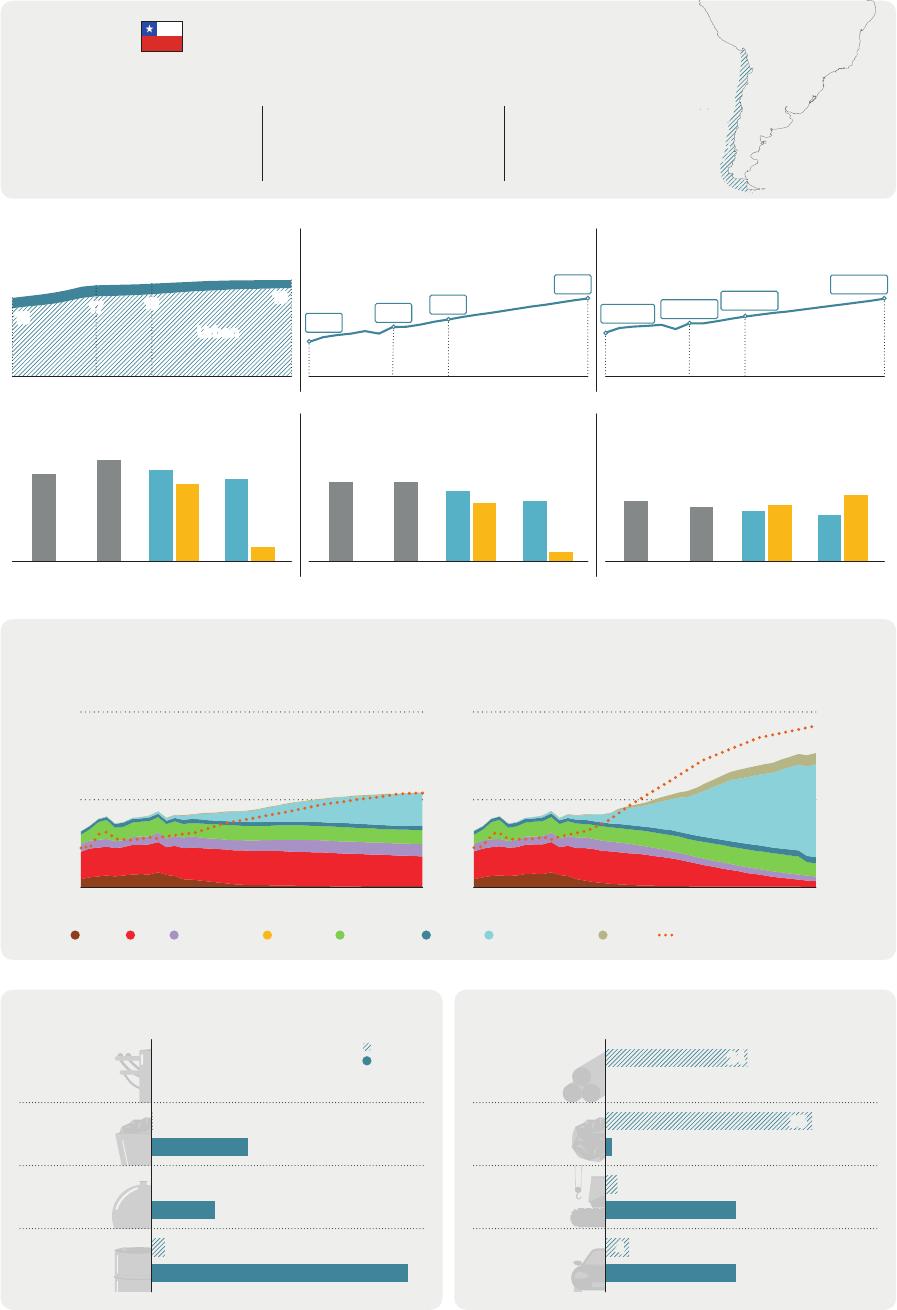
LatinAmericaEnergyOutlookOverview:ChileWorldEnergyOutlookSpecialReportINTERNATIONALENERGYAGENCYTheIEAexaminestheIEAmemberIEAassociationfullspectrumcountries:countries:ofenergyissuesincludingoil,gasAustraliaArgentinaandcoalsupplyandAustriaBrazildemand,renewableBelgiumChinaenergytechnologies,CanadaEgyptelectricitymarkets,CzechRepublicIndiaenergyefficiency,DenmarkIndonesiaaccesstoenergy,EstoniaKenyademandsideFinlandMoroccomanagementandFranceSenegalmuchmore.ThroughGermanySingaporeitswork,theIEAGreeceSouthAfricaadvocatespoliciesHungaryThailandthatwillenhancetheIrelandUkrainereliability,affordabilityItalyandsustainabilityofJapanenergyinitsKorea31membercountries,Lithuania13associationLuxembourgcountriesandMexicobeyond.NetherlandsNewZealandThispublicationandanyNorwaymapincludedhereinarePolandwithoutprejudicetothePortugalstatusoforsovereigntyoverSlovakRepublicanyterritory,totheSpaindelimitationofinternationalSwedenfrontiersandboundariesSwitzerlandandtothenameofanyRepublicofTürkiyeterritory,cityorarea.UnitedKingdomUnitedStatesTheEuropeanCommissionalsoparticipatesintheworkoftheIEASource:IEA.InternationalEnergyAgencyWebsite:www.iea.orgChile6THtop2ndlargestshareofsolarinelectricitycopperproducerintheworldlargestlithiumproducergenerationintheworldintheworldPopulationMillionpeopleGDPBillionUSD(2022,PPP)GDPpercapitaUSDpercapita(2022,PPP)22Rural221990043400172410029300332001518600700Urban400201020222030205020102022203020502010202220302050MtCO2CO2emissionspercapitaCO2emissionstCO2/capitaEnergyintensityGJperthousandUSD82(2022,PPP)7174674.24.23.7633.13.43.23.12.82.62.92.4EJ201020222030112010202220300.52010202220302050STEPS20502050APSPrimaryenergysupplyandshareoflow-emissionssourcesAPSSTEPS100%4250%2010205020102050Shareoflow-emissions(rightaxis)CoalOilNaturalgasNuclearBioenergyHydroWindandsolarOtherTradeofmainenergyproducts(2021)PJTradeofnon-energyproducts(2021)BillionUSDExports35ElectricityImportsNon-ferrous24CoalGas728metalsOil2Ores273andmetals117837Machinery2andtransportequipment22Manufactured4goods22Table1⊳RecentpolicydevelopmentsinChilePolicyPublicationyearEconomy-wide•ClimateChangeLaw21455:Binding2050netzeroGHGemissionstarget.2022measures•NDC(update):GHGemissionspeaknolaterthan2025andreach95Mt2021CriticalCO2-eqby2030.2022mineralsHydrogen•2022-2026NationalEnergyEfficiencyPlan:ReduceenergyintensityonaPowernationalbasisofatleast13%by2030relativeto2019.IndustryTransport•Industryandpower:CO2taxofUSD5/tCO2.2017Buildings•NationalLithiumStrategy:Aimstoincreasepublicparticipationandpublic-2023privatepartnershipsinthelithiumsupplychain;proposesthecreationof2022researchinstitutesandanationallithiumcompany(announced).•NationalMiningPolicy2050:Reachcarbonneutralityinminingby2040.•NationalHydrogenStrategy:Electrolysiscapacitytargets(operatingand2020underdevelopment)of5GWby2025and25GWby2030.AimtoreachUSD2.5billion/yearfromexportsofhydrogenandderivativesby2030.•Phaseoutorretrofitcoal-firedpowerplantsnolaterthan2040.2019•EnergyEfficiencyLaw21305:By2023,mandatoryenergymanagement2021systemforlargeenergyconsumers(consumptionofover50Tcal/year).•Law21505promotingelectricitystorageandelectromobilityintroducedan2022eight-yeargradualtaxexemptionschemeforelectricandhybridvehicles.2021•NationalElectromobilityStrategy2035targets:100%ofnewlight-dutyandmedium-dutyvehicles,andnewurbanpublictransportvehiclestobezeroemissions.•NationalEnergyPolicy2050target:100%low-emissionsheatingand2022cookinginurbancentresin2040,and100%ofnewbuildingsarenetzeroenergyuseby2050.Table2⊳MajorinfrastructureprojectsinChileHydrogen/ProjectSizeDateonlineStatusDescriptionammoniaH2Magallanes1400ktH2/year2025Dedicatedwind2028SynfuelsGenteGrande(capacity)2027DedicatedwindTransmission,Magallanes2025interconnections630ktH2/yearGrid+dedicatedFaraday(production)DedicatedrenewablesHaruOni(phase2)180ktH2/year1500kmat(production)Kimal-LoAguirrehighpermittingstagevoltagedirectcurrent75mill.litressynfuel/yeartransmissionline3000MW-600kV2029IEA.CCBY4.0.ChileenergyprofileFigure1⊳FinalenergyconsumptionbyscenarioinChile2STEPSAPS1EJLever2010Avoideddemand2022ElectrificationActivityEnergyefficiencyTransportFuelswitchingIndustrySectorBuildingsOther2050Transport2022BuildingsActivityIndustryTransportIndustryBuildings2050IEA.CCBY4.0.Industryandtransportaccountfor72%offinalenergyconsumptiontoday.Transportandindustrydriveupfinalenergyconsumptionbynearly20%intheSTEPSby2050.IntheAPS,finalenergyconsumptionin2050is25%lowerthanintheSTEPSduetoelectrificationandenergyefficiencygainsintransport.Figure2⊳FuelconsumptioninindustrybytypeandscenarioinChileEnergy-intensiveindustriesOtherindustryActivitydrivers0.4300EJIndex(2022=100)0.32500.22000.20.115020101002050202220302030205020302050201020222030205020302050STEPSAPSSTEPSAPSCrudesteelChemicalsIndustryVALACCoalOilNaturalgasBioenergyElectricityOtherIEA.CCBY4.0.IEA.CCBY4.0.Lightindustries,mostlymining,currentlyaccountforover50%ofenergyconsumptioninindustryinChile.By2050,steelindustryoutputisabove2.5-timeshigherthantoday.IntheAPS,acceleratedelectrificationandadoptionofhydrogen-fuelledtrucksintheminingsectorbringaboutsteepdeclinesinemissions.InternationalEnergyAgencyLatinAmericaEnergyOutlookFigure3⊳FuelconsumptionintransportbytypeandscenarioinChile0.6RoadNon-roadActivitydrivers300EJIndex(2022=100)0.42000.220101002050202220302030205020302050201020222030205020302050STEPSAPSSTEPSAPSOilNaturalgasBioenergyElectricityOtherPassengercarsTrucksLACIEA.CCBY4.0.Chile’sgeographymeansthatmostpassengersandfreighttravelbyroad.Fuelconsumptionfortransportisdominatedbyoiluseinroadtransport.Chilehastheninth-largestelectricbusfleetintheworld.IntheAPS,itsambitiousfueleconomyandelectromobilityplansboostEVsales.Figure4⊳FuelconsumptioninbuildingsbytypeandscenarioinChileHeatingandSpacecoolingandActivitydriversappliances7000.3cookingEJIndex(2022=100)0.25000.130020101002050202220302030205020302050201020222030205020302050STEPSAPSSTEPSAPSAirconditionerstockFloorspaceLACOilNaturalgasBioenergyElectricityOtherIEA.CCBY4.0.IEA.CCBY4.0.Oilandbioenergymeetmostheatingandcookingneedstoday.By2050,firewooduseforheating,relevantinthecentralandsouthernregions,isdramaticallylowerinbothscenarios.Theshiftawayfromoilandfirewooduseinheatingandcookingandrisingsalesofhouseholdappliancesarethedriversofadditionalelectricitydemand.ChileenergyprofileFigure5⊳AverageelectricitydailyloadprofilebyscenarioinChile402022STEPS2050APS2050GW3020100h24h0h24h0h24hIndustryBuildingsTransportIEA.CCBY4.0.By2050,peakelectricitydemanddoublesintheSTEPSandtriplesintheAPS;itgrowsbyupto15%(STEPS)and60%(APS)fasterthanaverageelectricitydemand.Theincreaseindailypeakdemandismainlydrivenbylightindustries(mining)andtheuptakeofEVs.Demandmanagementcouldhelptosmootheveningpeakdemand.Figure6⊳ElectricitygenerationandcapacitybyfuelandscenarioinChile600STEPSAPS200STEPSAPSTWh2050GW45015020223002030100205015020305020502010205020222022CoalOilNaturalgasBioenergyNuclearHydroWindSolarPVBatteryOtherDedicatedrenewablesforhydrogenIEA.CCBY4.0.IEA.CCBY4.0.Coalaccountedfor20%ofelectricitygenerationin2022.AbigincreaseinwindandsolarPVgenerationleadstocoalbeingphasedoutoftheelectricitymixinbothscenarios.Chile’ssolarpotentialisthethird-largestintheworld.IntheAPS,dedicatedsolarPVforhydrogenproductionleadstotalinstalledcapacitytorisetothree-timesthelevelintheSTEPS.InternationalEnergyAgencyLatinAmericaEnergyOutlookFigure7⊳FueldemandandproductionbyscenarioinChileOil(mb/d)Naturalgas(bcm)Low-emissionshydrogen(Mt)0.510100.4880.3660.2440.122202220302050203020502022203020502030205020222030205020302050STEPSAPSSTEPSAPSSTEPSAPSProductionDemandIEA.CCBY4.0.IntheSTEPS,oildemandstagnates,whilenaturalgasdemandincreasesduetofuelswitchinginbuildingsandhigheractivityinenergy-intensiveindustries.Hydrogenproductionisprojectedtoreacharound7.5Mtin2050intheAPS,drivenbydomesticdemand,particularlyintransportandmining,andbyinternationaltrade.Figure8⊳AnnualinvestmentinenergysupplybytypeandscenarioinChile20302022CleanenergyHydro2050STEPSNon-hydrorenewablesAPSNuclearBatterystorageSTEPSElectricitygridsAPSCleanfuelsOtherlow-emissionsUnabatedfossilfuelsOilCoalNaturalgasOtherfossilfuels510152025BillionUSD(2022,MER)IEA.CCBY4.0.IEA.CCBY4.0.Investmentincleanenergysupplyaccountsforover1%ofGDPinChileintheSTEPSin2050and4%intheAPS.IntheAPS,40%ofinvestmentgoesby2050togridsand20%tohydrogensupply.ChileenergyprofileNoteshahectaresUnitskmkilometreAreaDistanceGtCO2gigatonnesofcarbondioxideEmissionsMtCO2milliontonnesofcarbondioxideMtCO2-eqmilliontonnesofcarbon-dioxideequivalent(using100‐EnergyyearglobalwarmingpotentialsfordifferentgreenhousetCO2-eqgases)Gastonnesofcarbon-dioxideequivalentEJMassPJexajoule(1joulex1018)MonetaryTWhpetajoule(1joulex1015)OilTcalterawatt-hourPowerteracalorie(1caloriex1012)bcmbcm/dbillioncubicmetresmcm/dbillioncubicmetresperdaymillioncubicmetresperdaykgktkilogrammekilotonnes(1tonne=1000kg)USDmillionUSDbillion1USdollarx1061USdollarx109mb/db/dmillionbarrelsperdaybarrelsperdayGWMWgigawattkVmegawattkilovoltIEA.CCBY4.0.TermsActivitydriversforindustryincludeproductionlevels(Mt)andvalueadded(USD2022,PPP);fortransport,vehicle-kilometres(km)forpassengercarsandtonne-kmfortrucks;forbuildings,airconditioning(millionunits)andfloorspace(millionsquaremetres).TheactivitynumberspresentedcorrespondtotheStatedPoliciesScenario(STEPS)indexedonthe2022value.Bioenergyreferstobioenergyandwaste.Cleanfuelsreferstobiofuels,hydrogenandhydrogen-relatedfuels.InternationalEnergyAgencyLatinAmericaEnergyOutlookIEA.CCBY4.0.Dailyaverageelectricityloadprofilesdonotfactorinelectricitydemandgeneratedbydedicatedrenewablesourcesconnectedtoelectrolysers,andtheyalsodonotconsidertheinfluenceofdemand-responsemechanisms.Energy-intensiveindustriesincludechemicals,ironandsteel,non-metallicminerals(cementandother),non-ferrousmetals(aluminiumandother)andpulp,paperandprinting.Heatingandcookinginbuildingsreferstoenergydemandforspaceandwaterheating,andcooking.Hydrogendemandexcludesbothhydrogenexportsandthehydrogenusedforproducinghydrogen-basedfuelswhichareexported.Investmentdataarepresentedinrealtermsinyear-2022USdollars.Large-scaleCCUSprojectsreferonlytofacilitieswithaplannedcapturecapacityhigherthan100000tonnesofCO2peryear.Low-emissionshydrogenprojectsconsideredarethosewithanannouncedcapacityfor2030.Non-roadtransportincludesrail,domesticnavigation,domesticaviation,pipelineandothernon-specifiedtransport.Otherforpowergenerationandcapacityreferstogeothermal,concentratedsolarpower,marine,non-renewablewasteandothernon-specifiedsources.Otherforfinalconsumptioninsectorsreferstonon-renewablewaste,hydrogen,solarthermalandgeothermal.Otherinasectorcategoryreferstoagricultureandothernon-energyuses.Otherfossilfuelsinenergysupplyinvestmentrefertonon-renewablewasteandothersupplysources.Otherfuelshiftsincludebioenergy,nuclear,solarthermal,geothermalandnaturalgas.Otherindustryreferstotheconstruction,foodandtobacco,machinery,miningandquarrying,textileandleather,transportequipment,woodindustrybranchesandremainingindustry.Otherlow-emissionsinenergysupplyinvestmentincludeheatpumps,CCUS,electricitygenerationfromhydrogen,electricitygenerationfromammoniaanddirectaircapture.Roadtransportincludessixvehiclecategories(passengercars,buses,two/three-wheelers,light-dutyvansandtrucks,andmediumandheavytrucks).SDG7referstoSustainableDevelopmentGoal(SDG)7:“ensureaccesstoaffordable,reliable,sustainableandmodernenergyforall”,adoptedbytheUnitedNationsin2015.Solarpotentialdataiscalculatedbasedontheaveragepotentialatnationallevelassessedinkilowatt-hourperkilowattpeakperday(2020).ChileenergyprofileTotalfinalconsumptionincludesconsumptionbythevariousend‐usesectors(industry,transport,buildings,agriculture,andothernon‐energyuse).Itexcludesinternationalmarineandaviationbunkers,exceptatworldlevelwhereitisincludedinthetransportsector.AcronymsScenarios:STEPS=StatedPoliciesScenario;APS=AnnouncedPledgesScenario.AFOLUagriculture,forestryandotherlanduseBECCSbioenergywithcarboncaptureandstorageCCUScarboncapture,utilisationandstorageCNGcompressednaturalgasEVelectricvehicleGDPgrossdomesticproductGHGgreenhousegasesH2hydrogenHVDChighvoltagedirectcurrentICEinternalcombustionengineMEPSminimumenergyperformancestandardsMERmarketexchangerateNDCNationallyDeterminedContributionPPPpurchasingpowerparityPVphotovoltaicsSDGSustainableDevelopmentGoalsVAvalueaddedZEVzeroemissionsvehicleThepolicytablesincludeexistingpoliciesandannouncementsasoftheendofSeptember2023.Thesameappliestothetablesofexistingandannouncedprojects.TheIEAdoesnotusecolourstorefertothevarioushydrogenproductionroutes.However,whenreferringtospecificpolicyannouncements,programmes,regulationsandprojectswhereanauthorityusescolourtodefineahydrogenproductionroute,e.g.greenhydrogen,weusethatterminologytoreportdevelopmentsinthisreview.IEA.CCBY4.0.InternationalEnergyAgencyLatinAmericaEnergyOutlookInternationalEnergyAgency(IEA)ThisworkreflectstheviewsoftheIEASecretariatbutdoesnotnecessarilyreflectthoseoftheIEA’sindividualmembercountriesorofanyparticularfunderorcollaborator.Theworkdoesnotconstituteprofessionaladviceonanyspecificissueorsituation.TheIEAmakesnorepresentationorwarranty,expressorimplied,inrespectofthework’scontents(includingitscompletenessoraccuracy)andshallnotberesponsibleforanyuseof,orrelianceon,thework.SubjecttotheIEA’sNoticeforCC-licencedContent,thisworkislicencedunderaCreativeCommonsAttribution4.0InternationalLicence.Thisdocumentandanymapincludedhereinarewithoutprejudicetothestatusoforsovereigntyoveranyterritory,tothedelimitationofinternationalfrontiersandboundariesandtothenameofanyterritory,cityorarea.Unlessotherwiseindicated,allmaterialpresentedinfiguresandtablesisderivedfromIEAdataandanalysis.IEAPublicationsInternationalEnergyAgencyWebsite:www.iea.orgContactinformation:www.iea.org/contactTypesetinFrancebyIEA-November2023Coverdesign:IEAPhotocredits:©GettyImages


 VIP
VIP VIP
VIP VIP
VIP VIP
VIP VIP
VIP VIP
VIP VIP
VIP VIP
VIP VIP
VIP VIP
VIP