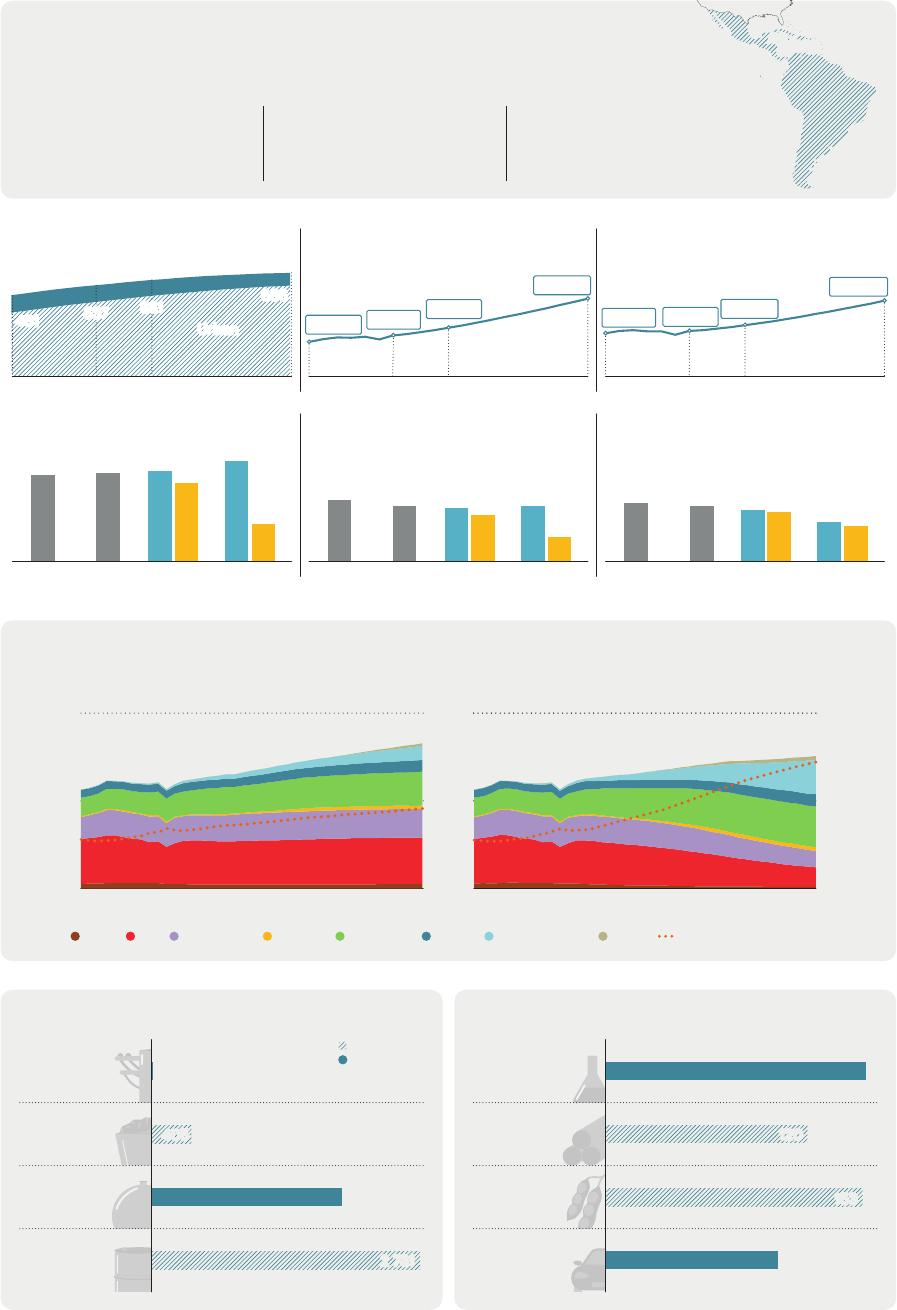
LatinAmericaEnergyOutlookOverviewWorldEnergyOutlookSpecialReportINTERNATIONALENERGYAGENCYTheIEAexaminestheIEAmemberIEAassociationfullspectrumcountries:countries:ofenergyissuesincludingoil,gasAustraliaArgentinaandcoalsupplyandAustriaBrazildemand,renewableBelgiumChinaenergytechnologies,CanadaEgyptelectricitymarkets,CzechRepublicIndiaenergyefficiency,DenmarkIndonesiaaccesstoenergy,EstoniaKenyademandsideFinlandMoroccomanagementandFranceSenegalmuchmore.ThroughGermanySingaporeitswork,theIEAGreeceSouthAfricaadvocatespoliciesHungaryThailandthatwillenhancetheIrelandUkrainereliability,affordabilityItalyandsustainabilityofJapanenergyinitsKorea31membercountries,Lithuania13associationLuxembourgcountriesandMexicobeyond.NetherlandsNewZealandThispublicationandanyNorwaymapincludedhereinarePolandwithoutprejudicetothePortugalstatusoforsovereigntyoverSlovakRepublicanyterritory,totheSpaindelimitationofinternationalSwedenfrontiersandboundariesSwitzerlandandtothenameofanyRepublicofTürkiyeterritory,cityorarea.UnitedKingdomUnitedStatesTheEuropeanCommissionalsoparticipatesintheworkoftheIEASource:IEA.InternationalEnergyAgencyWebsite:www.iea.orgLatinAmericaandtheCaribbeanHIGHEST15%Over1/3shareofrenewablesinelectricityofglobaloilandgasresourcesofglobalsilver,coppergenerationintheworldandlithiumreservesPopulationMillionpeopleGDPBillionUSD(2022,PPP)GDPpercapitaUSDpercapita(2022,PPP)121115Rural921266562290017400183002060030600461537581Urban143001020012000201020222030205020102022203020502010202220302050CO2emissionsMtCO2CO2emissionspercapitatCO2/capitaEnergyintensityGJperthousandUSD2.82.52.42.1(2022,PPP)162316571693185414922.53.33.12.92.81.1EJ7972.22.0STEPSAPS201020222030205020102022203020502010202220302050Primaryenergysupplyandshareoflow-emissionssourcesAPSSTEPS100%603050%2010205020102050Shareoflow-emissions(rightaxis)CoalOilNaturalgasNuclearBioenergyHydroWindandsolarOtherTradeofmainenergyproducts(2021)PJTradeofnon-energyproducts(2021)BillionUSDElectricity4NetexportsChemicals155NetimportsCoal405Ores120andmetals153Gas1940Food103Oil2731productsManufacturedgoodsTable1⊳RecentpolicydevelopmentsinLatinAmericaandtheCaribbeanPolicyClimatecommitments:1716CountryRepresents60%oftotalCO2NetzeroemissionstargetTargetsemissionsfromfuelcombustion429Withand65%oftotalGDPWithoutTargetformid-centuryEconomy-wide(orearlier)measuresCountry1.7-1.8GtCO2emissionsfromClimatecommitments:NDCsfuelcombustionby2030NationallyDeterminedContribution(NDC)Initial(+13-18%increasefrom2022)UpdatedTargetfor2030Cleancooking7Country11%oftheLACpopulationlacksAccess(SDG7)26TargetscleancookingaccessElectricityaccess11With(12outof33countrieshave22Withoutalreadyreached95%accessCountryrate)Targets3%oftheregionalpopulationWithlackselectricityaccessWithout(24outof33countrieshavealreadyreached95%accessrate)AFOLUEightcountrieswithtargetstoendortomitigatedeforestation(Brazil,Chile,Colombia,CostaRica,Dominica,Guatemala,MexicoandSuriname).EnvironmentalFifteencountriesratifiedtheEscazúRegionalAgreementonAccesstoInformation,PublicgovernanceParticipationandJusticeinEnvironmentalMatters(AntiguaandBarbuda,Argentina,Belize,Bolivia,Chile,Ecuador,Grenada,Guyana,Mexico,Nicaragua,Panama,SaintKittsandNevis,SaintLucia,SaintVincentandtheGrenadinesandUruguay).HydrogenEightcountrieshaveahydrogenstrategy(Argentina,Brazil,Chile,Colombia,CostaRica,Ecuador,Panama,Uruguay),andfourcountrieshaveannouncedahydrogenstrategybutarestillinthepreparationphase(Bolivia,Paraguay,Peru,TrinidadandTobago).PowerTwenty-fourcountrieshaverenewablestargets(AntiguaandBarbuda,Argentina,Bahamas,Barbados,Belize,Bolivia,Brazil,Chile,Colombia,CostaRica,Cuba,Dominica,DominicanRepublic,Grenada,Guatemala,Haiti,Honduras,Mexico,Nicaragua,Panama,Peru,SaintLucia,UruguayandVenezuela).TransportSixteencountrieshaveelectricvehiclepolicies(Argentina,Bolivia,Brazil,Chile,Colombia,CostaRica,Cuba,DominicanRepublic,Ecuador,ElSalvador,Mexico,Nicaragua,Panama,Paraguay,TrinidadandTobagoandUruguay).BuildingsThirteencountrieshaveenergy-relatedbuildingcodes(AntiguaandBarbuda,Argentina,Barbados,Brazil,Chile,Colombia,CostaRica,Cuba,Ecuador,Jamaica,Mexico,ParaguayandPeru).Seventeencountrieshaveminimumenergyperformancestandards(MEPs)forairconditioning(Argentina,Brazil,Chile,CostaRica,Cuba,Ecuador,ElSalvador,Honduras,Jamaica,Mexico,Nicaragua,Panama,Peru,SaintLucia,TrinidadandTobago,UruguayandVenezuela).IEA.CCBY4.0.RegionalenergyprofileTable2⊳MajorinfrastructureprojectsinLACLow-emissionsProjectsCountrieshydrogenAnnouncedprojects2030ProductionArgentina,Barbados,Brazil,Chile,Colombia,CostaRica,Dominica,Mexico,1085.9Panama,Paraguay,Peru,TrinidadandTobago,Uruguay.projectsMtH2/yOilandgasOilandgasextractionNumberofprojectsArgentina,Bolivia,Brazil,Chile,Colombia,GaspipelineEcuador,ElSalvador,Guatemala,Guyana,DispatchableLNGterminalHonduras,Mexico,Nicaragua,Panama,low-emissionsParaguay,Peru,TrinidadandTobago.powerplants128hydroprojects20406080564nuclearprojectsHydro:Argentina,Bolivia,Brazil,Chile,GW3.4Colombia,CostaRica,Ecuador,Guyana,Honduras,Mexico,Nicaragua,Panama,GWParaguay,Peru.Nuclear:Argentina,Brazil,Mexico.Large-scaleCCUS1BECCSprojectinBrazil:LucasdoRioVerde(0.4MtCO2removalperyear).InterconnectionsFourprojectsunderconstructionorinfinancingphase:Argentina-Paraguay(270MW);Peru-Ecuador(600MWaddition);SIEPACexpansion(from300MWto600MW);SIEPAC-Colombiahighvoltagedirectcurrent(400MW).Figure1⊳FinalenergyconsumptionbyscenarioinLAC5040STEPSAPS30IEA.CCBY4.0.20Lever10EJAvoideddemand2010Electrification2022EnergyefficiencyActivityFuelswitchingTransportIndustrySectorBuildingsOther2050Transport2022BuildingsActivityIndustryTransportIndustryBuildings2050IEA.CCBY4.0.Risingtransportdemandandre-industrialisationpushtotalfinalenergyconsumptionupby40%intheSTEPSandover10%intheAPSby2050.Inbothscenarios,energyefficiencymoderatesthisgrowthinallsectors.IntheAPS,electrificationplaysakeyroleintemperingthisgrowthinthetransportsector.InternationalEnergyAgencyLatinAmericaEnergyOutlookFigure2⊳FuelconsumptioninindustrybytypeandscenarioinLACEnergy-intensiveindustriesOtherindustryActivitydrivers8220EJIndex(2022=100)6190416021302010100205020222030Chemicals20302050CrudesteelIEA.CCBY4.0.2030IndustryVA2050201020222030205020302050STEPSAPSSTEPSAPSCoalOilNaturalgasBioenergyElectricityOtherRe-industrialisationboostsgrowth,withthealuminium,ironandsteel,andchemicalssub-sectorsleadingtheway.Thisincreasesenergyconsumptioninthesector.Bioenergyplaysakeyroleinbothscenariosandelectricityusealsorises.Theshareofnaturalgasremainsconstantatjustbelow20%intheSTEPSanddeclinesintheAPS.Figure3⊳FuelconsumptionintransportbytypeandscenarioinLAC16RoadNon-roadActivitydrivers220EJIndex(2022=100)121908160413020101002050202220302030205020302050201020222030205020302050STEPSAPSSTEPSAPSOilNaturalgasBioenergyElectricityOtherPassengercarsTrucksIEA.CCBY4.0.IEA.CCBY4.0.Oilaccountsfor86%ofenergyconsumptiontodayinthetransportsector,comparedwith91%globally.Roadactivitydoublesby2050.IntheAPS,growinguseofelectricityandbioenergyleadstheshareofoilinroadtransporttodeclinebelow80%by2030andaround40%by2050.RegionalenergyprofileFigure4⊳FuelconsumptioninbuildingsbytypeandscenarioinLACHeatingandSpacecoolingandActivitydriversappliances7006cookingEJIndex(2022=100)4500230020101002050202220302030205020302050201020222030205020302050STEPSAPSSTEPSAPSAirconditionerstockFloorspaceLACOilNaturalgasBioenergyElectricityOtherIEA.CCBY4.0.Over10%oftheLACpopulationlacksaccesstocleancookingtoday.Theirrelianceonbioenergyforcookingisamajorcauseofhouseholdairpollutionandleadstonearly82000prematuredeathsperyear.Risingincomespromptincreasesintheownershipofappliancesandairconditioners,whicharethemaindriversofelectricityconsumptiongrowthinthebuildingssector.Figure5⊳ElectricitygenerationandcapacitybyfuelinLAC6000STEPSAPS2000STEPSAPSTWhGW450015003000100015005002010202220502022205020222030205020302050CoalOilNaturalgasBioenergyNuclearHydroWindSolarPVBatteryOtherDedicatedrenewablesforhydrogenIEA.CCBY4.0.IEA.CCBY4.0.Today,mostelectricityintheregionisfromhydropowerandnaturalgas,butsolarphotovoltaics(PV)andwindprovidethebulkofcapacityadditionsinbothscenarios.IntheAPS,renewablesmeetallnewelectricitydemand,reducingtheneedfornaturalgasanddisplacingalmostallgenerationfromcoalandoil.InternationalEnergyAgencyLatinAmericaEnergyOutlookFigure6⊳FueldemandandproductionbyscenarioinLACOil(mb/d)Naturalgas(bcm)Low-emissionshydrogen(Mt)123002482001641008202220302050203020502022203020502030205020222030205020302050STEPSAPSProductionSTEPSAPSDemandSTEPSAPSIEA.CCBY4.0.IntheSTEPS,oilproductionoutstripsdemandandnetoilexportstripleto2030.Theregionremainsanetimporterdespitenaturalgasproductionincreasinginthelongrun.IntheSTEPS,low-emissionshydrogenproductionseesmodestgrowthfromnearzero.IntheAPS,itreachesnearly2milliontonnes(Mt)in2030andmorethan20Mtin2050.Figure7⊳AnnualinvestmentinenergysupplybytypeandscenarioinLAC20302022CleanenergyHydro2050STEPSNon-hydrorenewablesAPSNuclearBatterystorageSTEPSElectricitygridsAPSCleanfuelsOtherlow-emissionsUnabatedfossilfuelsOilCoalNaturalgasOtherfossilfuels50100150200BillionUSD(2022,MER)IEA.CCBY4.0.IEA.CCBY4.0.IntheSTEPS,fossilfuelsaccountformostenergysupplyinvestmentin2030.IntheAPS,investmentincleanenergysupplyovertakesthoseforfossilfuelsby2030.Investmentincleanenergysupplyreaches0.8%ofGDPintheSTEPSandover1%intheAPSby2030,increasingtonearly0.9%and1.6%respectivelyby2050.RegionalenergyprofileNoteshahectaresUnitskmkilometreAreaDistanceGtCO2gigatonnesofcarbondioxideEmissionsMtCO2milliontonnesofcarbondioxideMtCO2-eqmilliontonnesofcarbon-dioxideequivalent(using100‐EnergyyearglobalwarmingpotentialsfordifferentgreenhousetCO2-eqgases)Gastonnesofcarbon-dioxideequivalentEJMassPJexajoule(1joulex1018)MonetaryTWhpetajoule(1joulex1015)OilTcalterawatt-hourPowerteracalorie(1caloriex1012)bcmbcm/dbillioncubicmetresmcm/dbillioncubicmetresperdaymillioncubicmetresperdaykgktkilogrammekilotonnes(1tonne=1000kg)USDmillionUSDbillion1USdollarx1061USdollarx109mb/db/dmillionbarrelsperdaybarrelsperdayGWMWgigawattkVmegawattkilovoltIEA.CCBY4.0.TermsActivitydriversforindustryincludeproductionlevels(Mt)andvalueadded(USD2022,PPP);fortransport,vehicle-kilometres(km)forpassengercarsandtonne-kmfortrucks;forbuildings,airconditioning(millionunits)andfloorspace(millionsquaremetres).TheactivitynumberspresentedcorrespondtotheStatedPoliciesScenario(STEPS)indexedonthe2022value.Bioenergyreferstobioenergyandwaste.Cleanfuelsreferstobiofuels,hydrogenandhydrogen-relatedfuels.InternationalEnergyAgencyLatinAmericaEnergyOutlookIEA.CCBY4.0.Dailyaverageelectricityloadprofilesdonotfactorinelectricitydemandgeneratedbydedicatedrenewablesourcesconnectedtoelectrolysers,andtheyalsodonotconsidertheinfluenceofdemand-responsemechanisms.Energy-intensiveindustriesincludechemicals,ironandsteel,non-metallicminerals(cementandother),non-ferrousmetals(aluminiumandother)andpulp,paperandprinting.Heatingandcookinginbuildingsreferstoenergydemandforspaceandwaterheating,andcooking.Hydrogendemandexcludesbothhydrogenexportsandthehydrogenusedforproducinghydrogen-basedfuelswhichareexported.Investmentdataarepresentedinrealtermsinyear-2022USdollars.Large-scaleCCUSprojectsreferonlytofacilitieswithaplannedcapturecapacityhigherthan100000tonnesofCO2peryear.Low-emissionshydrogenprojectsconsideredarethosewithanannouncedcapacityfor2030.Non-roadtransportincludesrail,domesticnavigation,domesticaviation,pipelineandothernon-specifiedtransport.Otherforpowergenerationandcapacityreferstogeothermal,concentratedsolarpower,marine,non-renewablewasteandothernon-specifiedsources.Otherforfinalconsumptioninsectorsreferstonon-renewablewaste,hydrogen,solarthermalandgeothermal.Otherinasectorcategoryreferstoagricultureandothernon-energyuses.Otherfossilfuelsinenergysupplyinvestmentrefertonon-renewablewasteandothersupplysources.Otherfuelshiftsincludebioenergy,nuclear,solarthermal,geothermalandnaturalgas.Otherindustryreferstotheconstruction,foodandtobacco,machinery,miningandquarrying,textileandleather,transportequipment,woodindustrybranchesandremainingindustry.Otherlow-emissionsinenergysupplyinvestmentincludeheatpumps,CCUS,electricitygenerationfromhydrogen,electricitygenerationfromammoniaanddirectaircapture.Roadtransportincludessixvehiclecategories(passengercars,buses,two/three-wheelers,light-dutyvansandtrucks,andmediumandheavytrucks).SDG7referstoSustainableDevelopmentGoal(SDG)7:“ensureaccesstoaffordable,reliable,sustainableandmodernenergyforall”,adoptedbytheUnitedNationsin2015.Solarpotentialdataiscalculatedbasedontheaveragepotentialatnationallevelassessedinkilowatt-hourperkilowattpeakperday(2020).RegionalenergyprofileTotalfinalconsumptionincludesconsumptionbythevariousend‐usesectors(industry,transport,buildings,agriculture,andothernon‐energyuse).Itexcludesinternationalmarineandaviationbunkers,exceptatworldlevelwhereitisincludedinthetransportsector.AcronymsScenarios:STEPS=StatedPoliciesScenario;APS=AnnouncedPledgesScenario.AFOLUagriculture,forestryandotherlanduseBECCSbioenergywithcarboncaptureandstorageCCUScarboncapture,utilisationandstorageCNGcompressednaturalgasEVelectricvehicleGDPgrossdomesticproductGHGgreenhousegasesH2hydrogenHVDChighvoltagedirectcurrentICEinternalcombustionengineMEPSminimumenergyperformancestandardsMERmarketexchangerateNDCNationallyDeterminedContributionPPPpurchasingpowerparityPVphotovoltaicsSDGSustainableDevelopmentGoalsVAvalueaddedZEVzeroemissionsvehicleThepolicytablesincludeexistingpoliciesandannouncementsasoftheendofSeptember2023.Thesameappliestothetablesofexistingandannouncedprojects.TheIEAdoesnotusecolourstorefertothevarioushydrogenproductionroutes.However,whenreferringtospecificpolicyannouncements,programmes,regulationsandprojectswhereanauthorityusescolourtodefineahydrogenproductionroute,e.g.greenhydrogen,weusethatterminologytoreportdevelopmentsinthisreview.IEA.CCBY4.0.InternationalEnergyAgencyLatinAmericaEnergyOutlookInternationalEnergyAgency(IEA)ThisworkreflectstheviewsoftheIEASecretariatbutdoesnotnecessarilyreflectthoseoftheIEA’sindividualmembercountriesorofanyparticularfunderorcollaborator.Theworkdoesnotconstituteprofessionaladviceonanyspecificissueorsituation.TheIEAmakesnorepresentationorwarranty,expressorimplied,inrespectofthework’scontents(includingitscompletenessoraccuracy)andshallnotberesponsibleforanyuseof,orrelianceon,thework.SubjecttotheIEA’sNoticeforCC-licencedContent,thisworkislicencedunderaCreativeCommonsAttribution4.0InternationalLicence.Thisdocumentandanymapincludedhereinarewithoutprejudicetothestatusoforsovereigntyoveranyterritory,tothedelimitationofinternationalfrontiersandboundariesandtothenameofanyterritory,cityorarea.Unlessotherwiseindicated,allmaterialpresentedinfiguresandtablesisderivedfromIEAdataandanalysis.IEAPublicationsInternationalEnergyAgencyWebsite:www.iea.orgContactinformation:www.iea.org/contactTypesetinFrancebyIEA-November2023Coverdesign:IEAPhotocredits:©GettyImages


 VIP
VIP VIP
VIP VIP
VIP VIP
VIP VIP
VIP VIP
VIP VIP
VIP VIP
VIP VIP
VIP VIP
VIP