2022年回顾:气候驱动的全球可再生能源潜在资源和能源需求(英文版)--世界气象组织VIP专享VIP免费

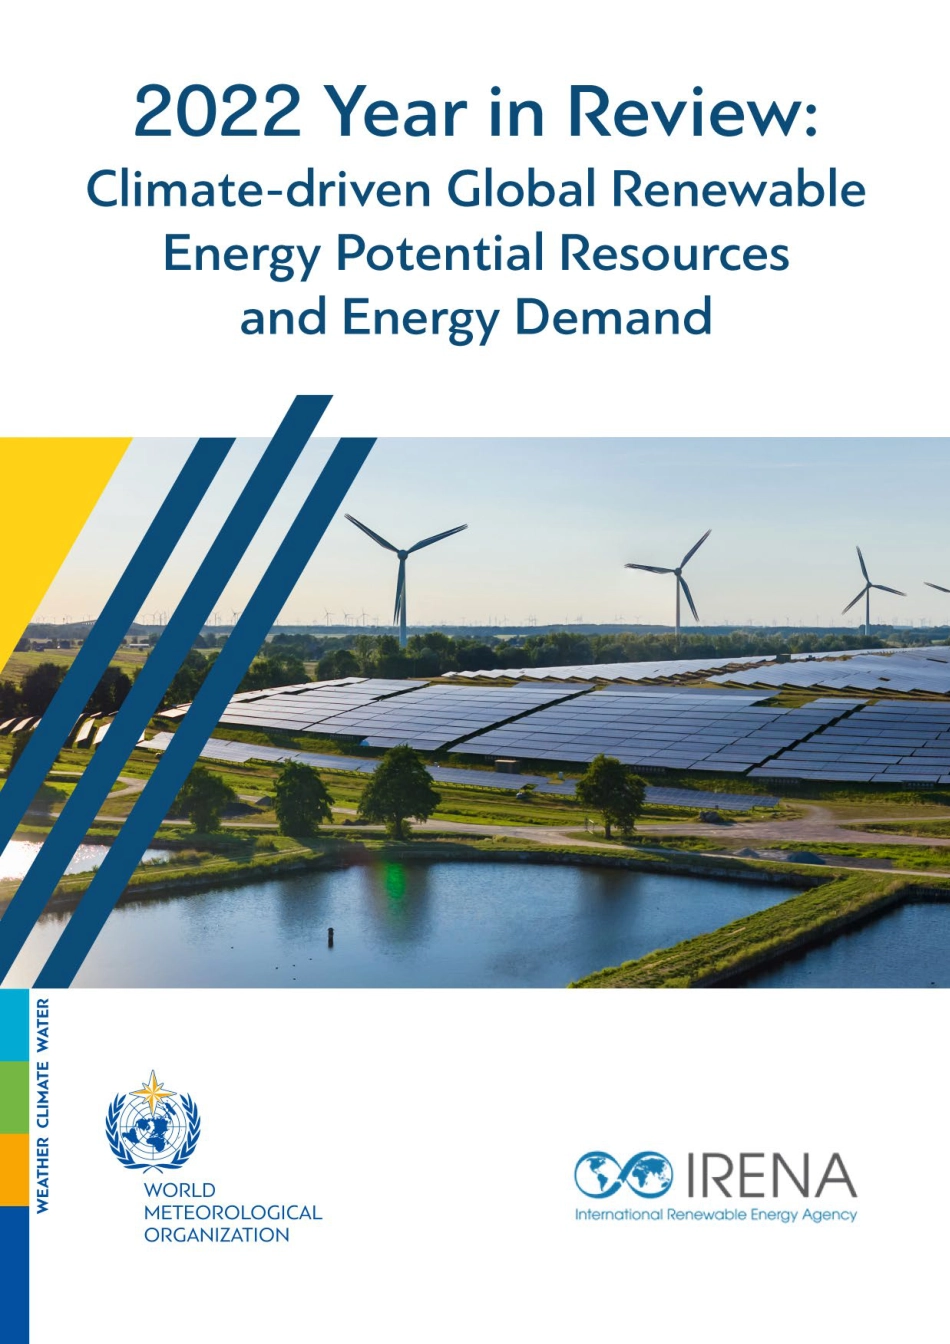
Cover photo: Environmentally friendly installation of photovoltaic power plant and wind turbine farm situated by landfill. Solar
panels farm built on a waste dump and wind turbine farm. Renewable energy source, Adobe Stock.
© World Meteorological Organization, 2023
The right of publication in print, electronic and any other form and in any language is reserved by WMO. Short extracts
from WMO publications may be reproduced without authorization, provided that the complete source is clearly indicated.
Editorial correspondence and requests to publish, reproduce or translate this publication in part or in whole should be
addressed to:
Chair, Publications Board
World Meteorological Organization (WMO)
7 bis, avenue de la Paix Tel.: +41 (0) 22 730 84 03
P.O. Box 2300 Email: publications@wmo.int
CH-1211 Geneva 2, Switzerland
NOTE
The designations employed and the presentation of material in this publication do not imply the expression of any opinion whatsoever on the part of
WMO or IRENA concerning the legal status of any country, territory, city or area, or of its authorities, or concerning the delimitation of its frontiers
or boundaries.
The mention of specific companies or products does not imply that they are endorsed or recommended by WMO or IRENA in preference to others of a
similar nature which are not mentioned or advertised.
The findings, interpretations and conclusions expressed are those of the authors alone and do not necessarily reflect those of WMO, IRENA
or their Members.
Contents
Foreword .............................................................................................................. 4
Executive summary ............................................................................................... 6
Acknowledgments .................................................................................................. 8
1 Global perspective on renewable energy resources and demand in 2022 ................ 9
1.1 Introduction ............................................................................................. 9
1.2 Wind power capacity factor ....................................................................... 10
1.3 Solar power capacity factor ...................................................................... 13
1.4 Hydropower proxy indicator ...................................................................... 15
1.5 Energy demand proxy indicator ................................................................. 18
2 Regional perspective on renewable energy resources and demand in 2022 .......... 21
2.1 Africa ..................................................................................................... 21
2.2 Asia ....................................................................................................... 24
2.3 South America ........................................................................................ 26
3 Potential future climate risks for renewable energy and demand ......................... 28
3.1 Wind power ............................................................................................ 28
3.2 Solar photovoltaic power .......................................................................... 28
3.3 Hydropower ............................................................................................ 29
3.4 Demand ................................................................................................. 31
4 Conclusions .................................................................................................. 32
4.1 Discussion on the importance of early warning systems ............................... 32
4.1.1 Detection, observation, monitoring, analysis and forecasting .................. 32
4.1.2 Preparedness and response capabilities................................................ 33
4.2 Policy for potential growth of renewable energy in the context
of climate variability ................................................................................ 33
4.3 Key messages ......................................................................................... 34
References ......................................................................................................... 36
Annex. Methodology ............................................................................................ 38
Wind power capacity factor calculation ................................................................ 38
Solar photovoltaic power capacity factor calculation .............................................. 40
Hydropower proxy ............................................................................................ 41
Energy demand proxy ....................................................................................... 42
Coverphoto:Environmentallyfriendlyinstallationofphotovoltaicpowerplantandwindturbinefarmsituatedbylandfill.Solarpanelsfarmbuiltonawastedumpandwindturbinefarm.Renewableenergysource,AdobeStock.©WorldMeteorologicalOrganization,2023Therightofpublicationinprint,electronicandanyotherformandinanylanguageisreservedbyWMO.ShortextractsfromWMOpublicationsmaybereproducedwithoutauthorization,providedthatthecompletesourceisclearlyindicated.Editorialcorrespondenceandrequeststopublish,reproduceortranslatethispublicationinpartorinwholeshouldbeaddressedto:Chair,PublicationsBoardTel.:+41(0)227308403WorldMeteorologicalOrganization(WMO)Email:publications@wmo.int7bis,avenuedelaPaixP.O.Box2300CH-1211Geneva2,SwitzerlandNOTEThedesignationsemployedandthepresentationofmaterialinthispublicationdonotimplytheexpressionofanyopinionwhatsoeveronthepartofWMOorIRENAconcerningthelegalstatusofanycountry,territory,cityorarea,orofitsauthorities,orconcerningthedelimitationofitsfrontiersorboundaries.ThementionofspecificcompaniesorproductsdoesnotimplythattheyareendorsedorrecommendedbyWMOorIRENAinpreferencetoothersofasimilarnaturewhicharenotmentionedoradvertised.Thefindings,interpretationsandconclusionsexpressedarethoseoftheauthorsaloneanddonotnecessarilyreflectthoseofWMO,IRENAortheirMembers.ContentsForeword..............................................................................................................4Executivesummary...............................................................................................6Acknowledgments..................................................................................................81Globalperspectiveonrenewableenergyresourcesanddemandin2022................91.1Introduction.............................................................................................91.2Windpowercapacityfactor.......................................................................101.3Solarpowercapacityfactor......................................................................131.4Hydropowerproxyindicator......................................................................151.5Energydemandproxyindicator.................................................................182Regionalperspectiveonrenewableenergyresourcesanddemandin2022..........212.1Africa.....................................................................................................212.2Asia.......................................................................................................242.3SouthAmerica........................................................................................263Potentialfutureclimaterisksforrenewableenergyanddemand.........................283.1Windpower............................................................................................283.2Solarphotovoltaicpower..........................................................................283.3Hydropower............................................................................................293.4Demand.................................................................................................314Conclusions..................................................................................................324.1Discussionontheimportanceofearlywarningsystems...............................324.1.1Detection,observation,monitoring,analysisandforecasting..................324.1.2Preparednessandresponsecapabilities................................................334.2Policyforpotentialgrowthofrenewableenergyinthecontextofclimatevariability................................................................................334.3Keymessages.........................................................................................34References.........................................................................................................36Annex.Methodology............................................................................................38Windpowercapacityfactorcalculation................................................................38Solarphotovoltaicpowercapacityfactorcalculation..............................................40Hydropowerproxy............................................................................................41Energydemandproxy.......................................................................................42ForewordThedataandanalysisinthisreportrepresentasignificantmilestoneinfulfillingthejointcommitmentbytheWorldMeteorologicalOrganization(WMO)andtheInternationalRenewableEnergyAgency(IRENA)toadvancetheunderstandingofrenewableenergyresourcepotential,anditsintricaterelationshipwithclimatevariabilityandchange.Renewableenergy,primarilydrivenbythedynamicforcesofsolarradiation,windandwater,hassurgedtotheforefrontofglobalpowergeneration.Thisglobalenergytransitionisapowerfulcatalystformitigatingclimatechange,safeguardingourplanetandensuringaprosperousfutureforgenerationstocome.Thenumbersspeakforthemselves.In2022,83%ofnewpowergenerationcapacitywasfromrenewableenergy.SuchrobustexpansionrepresentsconsiderableprogressinachievingthegoalsoftheParisagreementtolimitglobalsurfacetemperatureincreaseto1.5°Cabovepre-industriallevelsandsubstantiallyreduceenergy-relatedgreenhousegasemissionsby2030.Tomeetthe1.5°Cgoal,globalrenewablepowercapacitymusttripleby2030,whileenergyefficiencyimprovementsmustdouble.Thisreporthighlightstheinherentlinksbetweenrenewableenergysourcesandweatherandclimateconditions.Thecriticalnexusbetweenclimatevariabilityandrenewableenergyrequiresacomprehensiveunderstandingofhowmeteorologicalvariablesimpactthepotentialcapacityofwind,solarandhydropower.Climateinfluencesnotonlyenergysupplybutalsodemand,particularlyinthecontextofheatingandcooling.Thispublicationexplorestheseintricateconnectionsindetail,atboththeglobalandregionallevels,byconsideringanomalousbehavioursofenergyindicators(onshorewindpower,solarphotovoltaic(PV)power,hydropowerandenergydemandproxies–called“energydegreedays”)occurringin2022,andcomparingthemtothecurrent30-yearstandardclimatologyreferenceperiod(1991–2020).Thechangesintheseindicatorsfor2022comparedtothe30-yearclimatologicalaverageofferavaluableinsightintotheroleofclimateinrenewableenergysupplyanddemand.Beyondclimatetrends,theanalysisemphasizestheimportanceofconsideringclimatevariabilityinthecontextsofrenewableenergyoperations,management,planningandinvestment.Thekeymessagesofthisreportrepresentaninvitationtopolicymakers,scientistsandstakeholderstoaddressthesynergybetweenmeteorologyandrenewableenergy.ItisatthisintersectionthatIRENAandWMOexpertisesetsthestageforarigorousevaluationthatwillempowerpolicymakers,energyplanners,resourcemanagersandgridoperatorstograspthemagnitudeandpatternsofobservedvariationsincleanenergysupplyanddemand.Thiseffortalsosupportsthereorganizationofpowersystemsintoa“dualprocurement”structure,whichcaneffectivelyoptimizetheacquisitionofhigh-valuevariablerenewableresourcesandtheflexibledeploymentofresources.ItisalsoalignedwiththeactivitiestakingplacewithintheEarlyWarningsforAllinitiative,whichisco-ledbyWMO.Byassistingtheunderstandingofrelevantclimatedriversandtheirassociatedlarge-scaleatmosphericpatterns,stakeholderscanbetteranticipateclimate-relatedimpactsonrenewablepowergenerationanddemand.2022YEARINREVIEW:CLIMATE-DRIVENGLOBALRENEWABLEENERGY5POTENTIALRESOURCESANDENERGYDEMANDWeextendourgratitudeandappreciationtotheleadauthorsfrombothorganizationsfortheirexceptionaleffortsincompilingthisreport,aswellastoalltheexpertsandcontributorsfortheirunwaveringsupportandvaluableinputs.Wehopethatthisreportwillmarktheinauguraleditionofaseriesofsuchpublicationsintheyearstocome.PetteriTaalasFrancescoLaCameraSecretary-GeneralDirector-GeneralWorldMeteorologicalOrganization(WMO)InternationalRenewableEnergyAgency(IRENA)ExecutivesummaryRenewableenergy(RE)dominatesnewcapacityadditions,drivenbysolarandwind.Theglobaltotalinstalledcapacityofrenewablepower,anditsshareintheelectricitygrid,hasbeensteadilyincreasingoverthepasttwodecades.Today,some30%1ofglobalpowergenerationisrenewable,duetorapiddeploymentinthepastdecade.In2022alone,83%ofnewcapacitywasrenewable,withsolarandwindaccountingformostadditions.Suchanincreaseiskeytoachievingdecarbonizedenergysystemsby2050,withanaccompanyingsteepanddecisivedeclineoffossilfuelconsumption.Moredecisiveactionsareneededtofurtheracceleratethetransitionofenergysystemstodramaticallyreducethegreenhousegasesemissionsoftheenergysectorby2030inlinewith1.5°Cpathways.ToachievethemostambitiousclimatetargetoftheParisAgreement,globalREcapacityneedstobetripledandtherateofenergyefficiencyimprovementsdoubledby2030.Powergenerationfromrenewables,suchassolar,windandhydropower,whichareaddressedinthisreport,isbothdrivenandimpactedbyclimaticfactors.Theseresourcesplayanessentialroleintheglobalenergytransition.ButtheseREresourcesarelargelydrivenbyclimaticfactors,soitiscriticaltounderstandtheeffectsofclimatevariabilityandchangesinrelevantvariablesonREgeneration.Ontheotherhand,climatealsoimpactsenergydemand,especiallyrelatedtoheatingandcooling.Thepresentreportanalysestheyear2022comparedwith30-yearclimatologydatatoofferinsightsintotheeffectsofclimatevariabilityandchangeonselectedtechnologiesandenergydemand.Theeffectsofclimatevariabilityandchangearepresentedbyevaluatingthechangesinfourenergyindicators,namely,windpowercapacityfactor(CF),solarphotovoltaic(PV)CF,ahydropowerproxyandanenergydemandproxy(calledenergydegreedays,EDD)for2022,comparedwiththestandard30-yearaverage,1991–2020.Thiscomparisonallowsustoidentifyspecificinter-annualfeaturesthatoccurredin2022,withrespectto“average”conditions.Themainmeasureconsideredisthepercentageanomaly(for2022comparedwith1991–2020).ThisassessmentisaninitialsteptowardsamorerigorousevaluationontheroleofclimateonREsupplyanddemand.Suchinformationcanbeusedbothasaretrospectiveanalysisandtoaidfuturedecision-making.Ultimately,policymakers,energyplannersandresourcemanagers,aswellasgridoperators,willneedcomprehensivedataandanalysistofullyunderstandthemagnitudeandpatternsofobservedvariationsinresourcesanddemand.Keyinsightshavebeenidentified:(i)Allassessedindicatorsshownoticeablechangesduetoeffectsofclimatevariabilityandchange,albeitdifferingbytechnologyandcountry.Thefourenergyindicatorsassessed(windpowerCF,solarPVCF,ahydropowerproxyandtheenergydemandproxyEDD),presentedascountryaverages,displaymarkedpercentageanomaliesforbothannualandmonthlyaverages.AsidefromsolarPV,whichdisplayslimitedvariabilityoflessthan10%onaverageannually,theoverallinter-annualandintra-annualvariabilityispronounced;forinstance,itislargerthan15%forwindpowerCFformanycountries.(ii)Improvingourunderstandingofclimatedriversandtheirinteractionswithrenewableresourcesisvitalforresilienceandtheefficiencyofenergysystemsandtheirtransition.ItiscriticaltoconsiderkeyclimatedriverssuchastheElNiñoSouthernOscillation(ENSO),asthesenormallyexplainalargeportionoftheobserved1REN21,Renewables2023GlobalStatusReport:EnergySupply,https://www.ren21.net/gsr-2023/modules/energy_supply/01_energy_supply.2022YEARINREVIEW:CLIMATE-DRIVENGLOBALRENEWABLEENERGY7POTENTIALRESOURCESANDENERGYDEMANDvariability;accuratelypredictingthemmakesitpossibletomanageenergyresourcesmoreefficientlythanwouldbepossiblewithoutsuchknowledge.(iii)Mainstreamingclimatevariability,inadditiontoclimatechange,shouldbeapriorityforimprovedoperation,managementandplanningofenergyresources.Thiscouldleadtotheestablishmentofearlywarningsystemstohelpbettermanageenergyload,resourcesandmaintenance.Moreover,thiscaninformenergyinfrastructuremodernizationandexpansion,andtriggerthenecessaryinnovationacrosstechnologies,marketsandpolicies.(iv)Adaptingmarketstructuresiscentraltoprovidingthenecessaryflexibilityduringthetransitionalphasefromcentralizedtodecentralizedpowersystems.Powersystemorganizationalstructuresthatallowboththeprocurementofthehighestvaluesetofvariablerenewableresourcesandthedeploymentofflexibilityresourcesarenecessary.A“dualprocurement”systemcanbeaneffectiveavenueinthisregard.(v)Developingcountries,especiallyinAfricawhereenergyaccessremainsakeypriority,canadapttheirsystemstoharnessrenewablepotentialwiththebenefitofknowledgeonclimatevariability.REisparticularlyunderdevelopedinAfrica,whichaccountsforonly2%ofglobalcapacitydespiteitsabundantpotentials.REisessentialtosupportthecontinent’sdevelopmentandindustrialization.ForeffectiveimplementationandutilizationofRE,itisimportanttocombineknowledgeofpotentialresourcesandexistinginfrastructures,butalsoclimatevariabilityasdiscussedhere.(vi)Comprehensiveandsystematicenergydatacollectionandsharingareessentialtoimprovingknowledgeandunderstandingoftheimpactofclimatevariabilityandchangeonenergysupplyanddemand.Theenergyindicatorspresentedherearesimplifiedwithrespecttoactual,morerepresentativeones.Thecomputationofmoreaccurateindicatorsrequiresmoregeneralandsystematicsharingofenergydata,includinginstalledcapacityandactualgeneration.AcknowledgmentsThefollowingpeoplearethankedfortheircontributionstothispublication:Leadauthors:AlbertoTroccoli(WorldEnergy&MeteorologyCouncil(WEMC)),RobertaBoscolo(WMO),HamidBastani(WMO),ImenGherboudj(IRENA),AmjadAbdulla(IRENA),EllipseRath(IRENA)Othercontributors:EmanueleBianco(IRENA),PennyBoorman(WEMC),ChiaraCagnazzo(EuropeanCentreforMedium-RangeWeatherForecasts(ECMWF)),BeatrizContreras(WEMC),KamleshDookayka(IRENA),LaurentDubus(RéseaudeTransportd’Electricité(RTE)),TobiasFuchs(DeutscherWetterdienst(DWD)),ChristopherHewitt(WMO),KristianHorvath(Državnihidrometeorološkizavod(DHMZ)),FrankKaspar(DWD),JuergLuterbacher(WMO),ElizabethPress(IRENA),JohanStander(WMO),NirStav(WMO),ElenaManaenkova(WMO),BinuParthan(IRENA)Graphicdesigners:ElenaRestivo,GiovanniAldrigo,StefanoCampostrini(InsideClimateService)1Globalperspectiveonrenewableenergyresourcesanddemandin20221.1IntroductionAccordingtotheIntergovernmentalPanelonClimateChange(IPCC),decarbonizingenergysystemsby2050willrequireasteepanddecisivedeclineinfossilfuelconsumption.Concreteactionsareneededinthenearterm(2030timehorizon)totransitionourenergysystemsfromcarbon-intensivetorenewable,cleansources.ToachievethemostambitiousclimatetargetoftheParisAgreement,globalrenewableenergy(RE)capacityneedstobetripledandtherateofenergyefficiencyimprovementsdoubledby2030(IRENA,2023c).PowergenerationfromREresources(herespecificallywind,solarandhydropower)playsanessentialroleintheglobaltransitioninlinewith1.5°Cenergypathways.AstheseREresourcesarelargelydrivenbyclimaticfactors,itiscriticaltounderstandtheeffectofthevariabilityofrelevantclimatevariablesonrenewableenergygeneration.Climateinfluencesdemandforelectricity,andenergyconsumptionmoregenerally,especiallyinrelationtoheatingandcooling;thisiswhydemandisalsoconsideredhere.Consideringclimatefactors,suchasclimatevariability,isallthemoreimportantgiventhatglobaltotalinstalledcapacityofwindandsolarpower,anditsshareintheelectricitygrid,hasbeensteadilyincreasingoverthepasttwodecades.Windpowerreachednearly900GWofcapacityin2022,a9%increasecomparedwith2021(anda200%increasecomparedwithtenyearsearlier,2013).Solarpowerhasbeengrowingfasterthanwindpower,withinstalledcapacityreaching1055GWin2022,a22%increasecomparedwith2021(650%comparedwith2013)(IRENA,2023a).Hydropowercurrentlyhasalargerinstalledcapacitythaneitherwindorsolarpower,withabout1400GWin2022,anincreaseof2%comparedwith2021(22%comparedwith2013).By2030,windpowerinstalledcapacityisexpectedtoreachabout3000GW(8000GWby2050),solarpowerabout5400GW(18000GWby2050),andhydropower1500GW(2500GWby2050)(IRENA,2023c).Itisworthnotingthatfrom2010to2019,therewasasustaineddecreaseintheunitcostofsolarenergy(–85%)andwindenergy(–55%)(IPCC,2022b).Actualpowergenerationdependsonthecapacityfactors(CF)–namelytheratiobetweentheaverageelectricitygeneratedbyapowersystemanditsnominalrated(ormaximum)power.Thus,intermsofpowerproduced,in2021(thelatestfiguresavailable)hydropowergenerated4400TWh,windpower1840TWh,andsolarpower1030TWh(IRENA,2023b).Thetotalglobalelectricityconsumption,fromallsources,includingrenewables,was28500TWhin2022,a2.5%increasecomparedwith2021(anda25%increasecomparedwithtenyearsearlier,2013)(EMBER,2023).AccordingtoIRENA(2023b)thepercentageofelectricityconsumptionmetbyREwas27.8%in2022,upfrom27.6%in2021.AccordingtotheInternationalEnergyAgency(IEA)(2023),demandisexpectedtogrowbyslightlylessthan2%in2023.Thismoderationingrowthcomparedwithpreviousyearsisstronglydrivenbydecliningelectricitydemandinadvancedeconomies,whicharedealingwiththeongoingeffectsoftheglobalenergycrisisandslowereconomicgrowth.In2024,asexpectationsfortheeconomicoutlookimprove,globalelectricitydemandgrowthisforecasttoreboundto3.3%.10CHAPTER1:GLOBALPERSPECTIVEONRENEWABLEENERGYRESOURCESIN2022Table1.Summaryofglobalinstalledcapacityforwindpower(WP),solarphotovoltaic(PV)andhydropower(HP).Thecorrespondingpowergenerationisalsoshownfor2021(thelatestyearforwhichdataareavailableatthetimeofwriting).Thetotalglobalenergyconsumptionisreportedinthelastrow.WP2013Generation2021Generation2022Generation20302050SolarPVCapacity(TWh)Capacity(TWh)Capacity(TWh)CapacityCapacityHP(GW)(GW)1840(GW)(GW)(GW)Totalenergy3002280082410309002850030008000consumption140860440010555400180001140136027800140015002500Forthispublication,theREgenerationpotentialanddemandarerepresentedusingrelativelysimpleindicators,whicharepresentedmainlyatthecountryleveloverthewholeglobe.Abriefdefinitionoftheseindicatorsispresentedinthefollowingsectionsononshorewindpower(forsimplicity,thiswillbereferredtoaswindpower),solarphotovoltaic(PV)power(alsoreferredtoassolarpower),hydropower,andenergydemand.2BecausethemainfocusofthispublicationisonassessingtheroleofclimatevariabilityontheREpotentialandenergydemand,thereportmainlyconsidersanomalousbehavioursoftheseindicatorsin2022incomparisonwiththecurrent30-yearstandardclimatologyreferenceperiod(1991–2020).Inotherwords,thepublicationwillhighlightthemaindeviationsthatoccurredin2022withrespectto1991–2020inordertoinformREplannersandresourcemanagers,aswellasgridoperators,aboutthemagnitudeandpatternsofobservedvariationsinresourcesanddemand.Suchanassessmentcanbeusefulbothasaretrospectiveanalysisandtoaidfuturedecision-making.Inthefollowingsections,REresourcesanddemandarefirstassessedseparatelyatthegloballevel,andthenimplicationsfortheirinteractionsarediscussed,whichismosteffectivelydoneattheregional(continental)level.Also,indicatorsarepresentedaspercentageanomalies(for2022comparedto1991–2020),butdependingonthecontext,othertermssuchas“variation”,“signal”,“change”orsimply“anomaly”arealsousedtodenote“percentageanomaly”.1.2WindpowercapacityfactorAusefulindicatorofclimatevariabilityistherelativechangeoftheCF(anomaliesexpressedasapercentage)foragivenyearcomparedwithareferenceperiod.TheglobalmonthlywindpowerCF,astakenfromtheIEAWeatherforEnergy(WfE)portal,iscomputedconsideringasingle100mhubheightwindturbineand100-mwindspeedataspatialresolutionof0.25°×0.25°(IEA/CMCC,2023).3MonthlywindpowerCFanomaliesfor2022relativetothemonthlyaverageforthe1991–2020referenceperiodarethencalculated.Whenaveragedovertheentireyear2022,annualwindpowerCFanomaliesdisplaysomerelativelylargevaluesandnoticeablepatterns,whichaffectthegenerationpotential(Figure1).Forinstance,severalcountriesinEuropeexperiencedareductionof10%ormoreinCF(negativeanomalies)(seeEuropeanStateoftheClimate20224).StrongreductionsinCFarealsoseeninCentralAmericaandPapuaNewGuinea(morethan16%),whileamoderatedeclineinCFisobservedinseveralcountriesinSouthandSouth-EastAsia,andSouthAfrica(between4%and8%).Atthesametime,increasesof8%ormoreinCF(positiveanomalies)areobservedinseveralcountriesthroughouttheworld,includingsomecountriesinsub-SaharanAfrica,2Furtherdetailsaboutthecomputationoftheenergyindicatorsareprovidedintheannex.3Thewindpowerconversionmodelusedishighlysimplified,asthereexistmanydifferentwindturbinetypes,withalargerangeofhubheights.Thesimplifiedmodelhereisintendedtocomparetheyear2022withtheclimatologicalperiod1991–2020,andnottocalculateactualvaluesforaspecificyear.ItisworthnotingthatgridpointswithCFlowerthan0.1arenotconsideredincountryaverages(seetheannexforadditionaldetails).4https://climate.copernicus.eu/esotc/2022/wind-solar-energy-resources2022YEARINREVIEW:CLIMATE-DRIVENGLOBALRENEWABLEENERGY11POTENTIALRESOURCESANDENERGYDEMANDMadagascar,thePlurinationalStateofBolivia,Paraguay,RepublicofKoreaandtheDemocraticPeople’sRepublicofKorea.Inaddition,NorthAmerica,hostof163GWofinstalledcapacityin2022,whichisasizeable18%oftheglobalcapacity(IRENA,2023a),experienceda4%–8%increasecomparedtothelong-termreferenceaverage.Figure1.Globalanomaliesofwindpower(WP)capacityfactorannualmean(expressedin%)for2022relativetotheaverageofthe1991–2020referenceperiodTwomainconsiderationsemergefromtheglobal2022annualmeananomaliesinwindpowerCF:(i)evenwhenaveragedoverayear,variationscanbesizeable–changeslargerthan5%–10%,ineitherdirection,wouldbeconsideredimportantintermsofpowerresourceallocationandmanagement;and(ii)spatialpatternsemergewithcountryclustersdisplayingconsistentlylowerresources(forexample,Europe)orhigherresources(NorthAmerica,SouthAmerica,sub-SaharanAfrica).Suchpatternspointtopossiblebalancingofelectricityonacontinentalorintercontinentalscalesubjecttothepresenceofnecessarypowernetworkstoexchangeelectricitybetweencountriesorcontinents.Forinstance,thehigherproductioninNorthAmericacouldcompensatethereductioninCFinMexico.Itisalsoimportanttoconsiderindividualmonths,asresourceoperationandmanagementisperformedattemporalscalescommensuratetomonthlyperiodsratherthanonanannualbasis,notingthatatmonthlytimescalesweexpecttoseelargeranomaliesduetothegreatervariabilityinwindspeedfortheseshorterperiods.Forinstance,windpowerCFanomaliesforMay2022relativetotheMay1991–2020referenceperiodshowstrongersignalsthanfortheannualmean(Figure2;notethatthescalerangeisdoublethatinFigure1).ThisisobservedinalargepartofEurope,wherethereishighnegativevariation,butthistimewithconsiderablyhighervalues(largerthan24%forsomecountries).However,severalothercountrieswhichonannualaveragehadpositivevaluesarenowshowingmarkednegativevariations.ThisisthecaseforArgentina,ParaguayandAustralia,amongothers.Ontheotherhand,forplaceslikeMexico,alargeportionofSouthAsiaandSouth-EastAsiathevariationisreversed,withwindpowerCFforMay2022inMexicobeingmorethan8%higherthantheclimatologicalaverageforMay.12CHAPTER1:GLOBALPERSPECTIVEONRENEWABLEENERGYRESOURCESIN2022Figure2.Globalanomaliesofwindpower(WP)capacityfactorannualmean(expressedin%)forMay2022relativetotheaverageforMayin1991–2020.NotethattherangeofvaluesistwicethatoftheannualmeaninFigure1.SomestronganomaliesarealsoseeninNovember2022,withanotablereversalinsignforcountriessuchasChinaandArgentinafromnegativeinMaytopositiveinNovember,andintheoppositedirectionfortheRussianFederation,IndiaandespeciallySouth-EastAsia,thelatterwithaswinglargerthan50%(Figure3).Thechangesinsign,especiallyforneighbouringcountries,againpointstopotentialpowerbalancing,with,forinstance,the“surplus”inChinapotentiallyoffsettingthedeficitinSouth-EastAsia.Fromanatmosphericpointofview,itisinterestingtonotethatinequatorialareaswheretheWalkercirculationoperates–thisisanEast–Westverticalmotionofairdrivenbydifferencesinheatdistributionbetweenlandandocean–someoftheobservedchangescanbelinkedtointer-annualclimatedriverssuchasElNiñoSouthernOscillation(ENSO)andtheIndianOceanDipole(IOD).ThisisthecaseforinstanceforKenya,EthiopiaandSomalia,wherelargepositiveanomaliescanberelatedtoairsubsidenceinthatregiondrivenbytheLaNiñaconditionspresentin2022,notingthatLaNiñatypicallypeaksintheOctobertoFebruaryperiodinthePacificOcean,withslightlydelayedimpactsinotherpartsoftheglobe.TheascendentbranchesofthesamezonalWalkercirculation,wherestrongconvectiveprocessesoccur,canbelinkedtothereductionsofwindpowerCFinPapuaNewGuineaandNorthernSouthAmerica.Forconsistencythesametwomonths,May2022andNovember2022,areconsideredforthefollowingthreeenergyindicators,namelyforsolarPVpower,hydropowerandenergydemand.2022YEARINREVIEW:CLIMATE-DRIVENGLOBALRENEWABLEENERGY13POTENTIALRESOURCESANDENERGYDEMANDFigure3.Globalanomaliesofwindpower(WP)capacityfactorannualmean(expressedin%)forNovember2022relativetotheaverageforNovemberin1991–2020.NotethattherangeofvaluesistwicethatoftheannualmeaninFigure1.1.3SolarpowercapacityfactorThesolarphotovoltaic(PV)powerCFiscomputedusingarelativelysimpleformulationwhich,inadditiontotherequiredglobalsolarirradiance,alsoaccountsforefficiencyeffectsduetovariationsinairtemperaturenearthesurfaceand10-mwindspeed.5ThemaindrawbackofthisapproachistheuseofaconstanttiltangleforthecomputationregardlessofthePVpanel’sgeographicallocation.However,thisshortcomingisnottoomajorasweareonlyconcernedwithrelativevariations.TheglobalannualanomaliesinsolarPVCFfor2022relativeto1991–2020areshowninFigure4.TherangeoftheseanomaliesislowerthanthatforthewindpowerCF(±15%comparedwith±20%).Moreover,theoverallvariationsareconsiderablysmallerthanthoseforwind,withthelargestchangesobservedinthePlurinationalStateofBolivia,ParaguayandArgentina,withanincreaseofbetween3%and6%.Attheglobalscaleanoverallbalanceofpositiveandnegativevariationsemerges,evenifitisdifficulttoestimatetheoverallmeansolarPVCFvariationduetofactorssuchastherelativesizeofcountries.Atthecontinentalscale,inparticular,thereappeartobeinterestingfeatures,forexamplewiththepositivevariationsinAsiancountrieslikeChina,TurkmenistanandUzbekistanpotentiallycounterbalancingthereductioninSouthAsiaandSouth-EastAsiaevenifthechangesineitherdirectionareweak(±3%).Clearly,theseobservationsarespeculative,sinceintheareasmentioned,onlyChina,IndiaandVietNamcurrentlyhaveasizeableinstalledcapacity(asof2022)with392GW,62GWand18GW,respectively(IRENA,2023a).Moreover,theactuallocationoftransmissionlineshasnotbeentakenintoaccounttobeabletoindicatehowpowercouldbetransmittedacrossboundariesinpractice.5ItisworthnotingthatgridpointswithCFlowerthan0.1arenotconsideredincountryaverages(seetheannexforadditionaldetails).14CHAPTER1:GLOBALPERSPECTIVEONRENEWABLEENERGYRESOURCESIN2022Figure4.Globalanomaliesofsolarphotovoltaic(SPV)powercapacityfactorannualmean(expressedin%)for2022relativetotheaverageofthe1991–2020referenceperiod.InMay2022(Figure5),severalcountriesinSouthAmerica,AfricaandEurope(thelatterinlinewiththeEuropeanStateoftheClimate2022)experiencedapositiveanomalycomparedtothecorrespondingaverageforMayin1991–2020(noteagainthattherangeofvaluesinthefiguresforindividualmonthsistwicethatintheannualaverage).Thegeneralpatterninthesecontinentsissimilartothatpresentintheannualaverage,butpositiveanomaliesseemtobemorewidespread(forexample,theBolivarianRepublicofVenezuela,theUnitedRepublicofTanzaniaandSpainhavenowturnedpositive),evenifthevaluesarerathermodest,withthelargestvaluesrangingfrom6%to12%.Atthesametime,alargepartofAsiadisplaysanegativeanomalyinMay2022,withSouth-EastAsiareachingreductionsofbetween12%and18%.Inthissituation,intracontinentaltransmissionofsolarpowerwouldbechallenging.ItisalsoworthnotingthatinMay2022,ChinahadbothwindpowerandsolarPVpowerCFswithanegativeanomaly,againmakingcompensationbetweenwindandsolarpowerdifficult.Figure5.Globalanomaliesofsolarphotovoltaic(SPV)powercapacityfactorannualmean(expressedin%)forMay2022relativetotheaverageforMayinthe1991–2020referenceperiod.NotethattherangeofvaluesistwicethatoftheannualmeaninFigure4.2022YEARINREVIEW:CLIMATE-DRIVENGLOBALRENEWABLEENERGY15POTENTIALRESOURCESANDENERGYDEMANDMorenegativeanomaliesinsolarPVpowerCFareobservedinNovember(Figure6)thaninMay,withthemainnotableexceptionofIndia,Bangladesh,Myanmar,theLaoPeople’sDemocraticRepublicandVietNam,whichbecamemoderatelypositive,andthePlurinationalStateofBoliviaandParaguay,whichaccentuatedtheirpositivevariation(18%–24%).Particularlyinthetropicalarea,theNovember2022patternisconsistentwithLaNiñaconditions,6whichwerepresentovermostof20227(evenifLaNiñanormallypeaksduringtheaustralsummer,see,forexample,theNationalOceanicandAtmosphericAdministration(NOAA)ENSOmonitoringportal8).LaNiñamanifestsitselfasincreasedcloudcover(andprecipitation)overcountriesintheWesternPacific(forexample,Australia),inSouthernAfrica(forexample,SouthAfrica,ZimbabweandBotswana),andinNorth-easternSouthAmerica,withcorrespondingreducedsolarPVpowerCF.Atthesametime,LaNiñaisassociatedwithsubsidenceconditionsinEasternAfrica(Somalia,EthiopiaandKenya)andinWesternSouthAmerica(Ecuador,Peru,thePlurinationalStateofBoliviaandParaguay).ItistobenotedthatbyandlargethesesameLaNiñapatterns,orteleconnections,arenoticeableinMay2022.9Figure6.Globalanomaliesofsolarphotovoltaic(SPV)powercapacityfactorannualmean(expressedin%)forNovember2022relativetotheaverageforNovemberinthe1991–2020referenceperiod.NotethattherangeofvaluesistwicethatfortheannualmeaninFigure4.1.4HydropowerproxyindicatorThehydropowerindicatorisrepresentedbyaproxybasedonacombinationofprecipitationandhydropowerinstalledcapacityatagivenlocation.Monthlyprecipitationisconsideredonlyforsub-countryareasinwhichpowerplantsarepresent,withtheirinstalledcapacityusedasweightsfortheprecipitation.Thus,thishydropowerindicator,alsoreferredtoasinstalled-capacity-weightedtotalprecipitationorIC-WTP,iscomputedasaprecipitation-weightedcountryaverageatthemonthlyscale.10Theindicatoraveragedover2022,relativeto1991–2020,canbeseeninFigure7.Accordingtothedefinitionadopted,theindicatorisnotcalculated6Thepatternistechnicallycalledteleconnection.Moreinformationisavailableat:https://www.weather.gov/fwd/teleconnections.7Theyear2022wasthethirdLaNiñayearinarow.8https://www.ncei.noaa.gov/access/monitoring/enso9AmorerigorousassessmentwouldneedtoascertaintowhatextenttheobservedvariationsareduetoLaNiña,orENSOmoregenerally.10Thischoiceisdictatedbythelackofhomogenousdatasetsforpowergenerationfortheperiodcovered(1991–2022),whichpreventstheimplementationofapowerdatamodel(typicallyastatisticalmodel),asdoneforinstanceinhttps://doi.org/10.3390/en13071786.Moredetailsareavailableintheannex.16CHAPTER1:GLOBALPERSPECTIVEONRENEWABLEENERGYRESOURCESIN2022forcountrieswithnohydropowerplant;thisisindicatedbyhatchinginthefigures.Becausethishydropowerindicatorisbasedonprecipitation,thepatternofanomaliesfor2022closelyresemblesthatofthesolarPVCF(Figure4).TheIC-WTPpresentsclustersofcountrieswithareductioninmeanvaluesfor2022comparedwiththe1991–2020average.ThisisapparentforalargepartofSouthAmerica,EasternAsia,CentralandEasternAfricaandWesternEurope.Inthelattercase,thereductionislinkedtothestrongdroughtwhichaffectedWesternEurope,particularlyitssouthernpart,overmuchof2022.Atthesametime,Scandinavia,whichhasaveryhighinstalledcapacity(nearly55GWamongNorway,SwedenandFinland),experiencedapositivevariation.Thisisacasewherepowerbalancingthroughtransmissionofelectricitycouldoccur,forinstanceviathe1400MWinterconnectorlinkingNorwaywiththeUnitedKingdomofGreatBritainandNorthernIreland–theNorthSeaLink.TherearealsoseveralcountriesforwhichtheIC-WTPshowsapositiveanomaly,asinthecaseofCanada,Mexico,theRussianFederation,India,Nepal,SouthAfricaandAustralia,inadditiontotheScandinaviancountriesmentionedabove.MostofthesecountrieswouldhavebenefittedfromtheincreaseinIC-WTPgiventheiroverallhighhydropowerinstalledcapacity.AswasthecaseforsolarPVCF,theglobalLaNiñapatternisevidentintheIC-WTP.ThisisalsoapparentintheanomaliesfortheindividualmonthsofMayandNovember2022(seeFigure8andFigure9,respectively).Specifically,thepositiveIC-WTPsignalsinAustralia,SouthAfrica,MozambiqueandNorthernSouthAmerica,togetherwiththenegativesignalinEasternAfrica(especiallyinSomalia,Kenya,UgandaandtheUnitedRepublicofTanzania),andSouthernSouthAmerica(Peru,Chile,BolivarianRepublicofVenezuela,PlurinationalStateofBolivia,Paraguay,Argentina)clearlyreflectsuchapattern.Figure7.Globalanomaliesofhydropowerproxyannualmean(expressedin%)for2022relativetotheaverageofthe1991–2020referenceperiod.Note:IC-WTPstandsforinstalled-capacity-weightedtotalprecipitation.AsidefromtheconsistentLaNiñapatterninMayandNovember2022,aspecificfeatureinMay2022(Figure8)istheshiftfromnegativetopositivevariationsfortheUnitedStatesofAmerica,Spain,KazakhstanandChina.Notableinversionsfrompositivetonegative,albeitwithmoderatevaluesoneitherside,areseenforMexico,IndiaandScandinaviancountries(Norwaydisplaysthestrongestreduction).MajornotablechangesinNovember2022(Figure9),particularlywithrespecttotheannualaverage,arethenegativeanomalyforCanadaandSweden,andthepositiveoneformuchofWesternEurope.2022YEARINREVIEW:CLIMATE-DRIVENGLOBALRENEWABLEENERGY17POTENTIALRESOURCESANDENERGYDEMANDFigure8.Globalanomaliesofhydropowerproxyannualmean(expressedin%)forMay2022relativetotheaverageforMayinthe1991–2020referenceperiod.NotethattherangeofvaluesistwicethatfortheannualmeaninFigure7.Note:IC-WTPstandsforinstalled-capacity-weightedtotalprecipitation.Figure9.Globalanomaliesofhydropowerproxyannualmean(expressedin%)forNovember2022relativetotheaverageforNovemberinthe1991–2020referenceperiod.NotethattherangeofvaluesistwicethatfortheannualmeaninFigure7.Note:IC-WTPstandsforinstalled-capacity-weightedtotalprecipitation.18CHAPTER1:GLOBALPERSPECTIVEONRENEWABLEENERGYRESOURCESIN20221.5EnergydemandproxyindicatorTheenergydemandindicatorisrepresentedbyaproxybasedontwocommonlyusedindicators:coolingdegreedays(CDD)andheatingdegreedays(HDD).11Usually,theseindicatorsareusedseparatelyastheyaddressspecificrequirements,namelytheneedforcoolingandheating,respectively.However,tostreamlinethepresentationoftheenergydemandindicator,itisalsopossibletodefineenergydegreedays(EDD)asthesumofCDDandHDD12(IPCC,2021,2022a;Spinonietal.,2017).Naturally,CDDandHDD(andthereforeEDD)donotcaptureallusesofelectricity(forexample,industry)astheyaremoresuitedtohumancomfort(heating/coolinginresidentialorcommercialbuildings).Moreover,theydonotseparateelectricitydemandfromthemoregeneralenergydemand(forexample,includinggas).However,theyprovideanindicationofenergyrequirementsandarealsoeasytocompute;thisiswhytheyarewidelyused,includingbyIEAinitsWfEdata.The2022EDDvariationspresentnoticeableclusters,withrelativelystrongreductionsindemand,ofuptoabout20%,inSouthernAfricaandEasternandNorthernEurope(Figure10).Moremoderatereductionsareseeninmanyotherareas,suchastheRussianFederation,WesternAsia,EasternSouthAmerica,Canada,SaharanAfricaandAustralia.Thelargestpositivechangesareseeninthetropicalareas,aswellasintheMediterraneanbasin.ThesignatureinEDDintheseareasessentiallystemsfromCDD,henceEDDispredominantlydrivenbyrequirementsforcooling.Athigherlatitudes,polewardof40°,wheretypicallyheatingrequirements,henceHDD,areprevalent,negativeanomaliesdominate,asmentioned.Overall,thepatternobservedinEDD,accountingforthegeographicalprevalenceofHDDandCDD,closelyreflectsthepatterninairtemperature,whichdisplayslargeareasofpositiveanomaliesfor2022,comparedtothe1991–2020climatology(seeStateoftheGlobalClimate2022(WMO-No.1316)Figure3).Theyear2022wasthefifthorsixthwarmestyearonrecord,despiteongoingLaNiñaconditions,whichgenerallymanifestincoolerconditionsthaninElNiñoyears(StateoftheGlobalClimate2022(WMO-No.1316)).AfewareaswherethetemperatureanomalywasmoremoderateorevennegativewereAustraliaandSouthernAfrica,forwhichthenegativeEDDvariationsarelinkedtothedirecteffectofLaNiñawithcoolersouthernhemispheresummerconditions,andArgentinaandUruguay,wherethepositiveEDDvariationsarelinkedtolower-than-normalsouthernhemispherewintertemperatures.11HDDassessesthelevelofthecoldoveraspecifictimeperiod,typicallyamonth,takingintoconsiderationoutdoortemperatureandaverageroomtemperaturetoinfertheneedforheating(conversely,CDDassessesthelevelofheattoinfertheneedforcooling).Similarlytothehydropowerindicator,HDDandCDDareusedduetothesparsityanddisparityofenergydemanddataatmonthlyresolutionformostcountriescoveringthe1991–2020baselineperiod.SeveralversionsofCDDandHDDareavailable.Two“middleoftheroad”optionsareconsideredhere:CDDhum21andHDDThold18.Moredetailsareavailableintheannex.TheindividualglobalgriddedCDDandHDDdata,whicharebasedontheERA5reanalysis,areavailablefromtheIEA/CMCCportal:http://weatherforenergydata.iea.org.12ThemaindifficultywithEDDisthatitcanbedifficulttoseparatetheeffectofcoolingfromheating,evenifgenerallytheformerismorepronouncedinlow–midlatitudes(andinsummer),andthelatterinmid–highlatitudes(andinwinter).2022YEARINREVIEW:CLIMATE-DRIVENGLOBALRENEWABLEENERGY19POTENTIALRESOURCESANDENERGYDEMANDFigure10.Globalanomaliesofenergydemandproxy(energydegreedays(EDD))annualmean(expressedin%)for2022relativetotheaverageofthe1991–2020referenceperiod.TheMay2022EDD(Figure11)changesagaincloselyreflectthetemperatureanomalies,indicatingadecreasedneedforheatinginplaceslikeCentralEuropeandCentralAsia,whichexperiencedconsiderablepositivetemperatureanomalies,atatimewhenheatingwouldnormallystillbeused.Similarpositiveanomaliesbutatlowerlatitudes,asinMexico,Morocco,AlgeriaandTunisia,aswellasinCentralandEasternAfrica,insteadledtopositiveEDDvariationsduetoincreasedcoolingrequirements(higherCDD).ThepositiveEDDvariationsinfarEasternEurope,RussianFederation,ArgentinaandUruguayreflecthigherheatingrequirementsduetotheextensivenegativetemperatureanomalies.13Figure11.Globalanomaliesofenergydemandproxy(energydegreedays(EDD))annualmean(expressedin%)forMay2022relativetotheaverageforMayinthe1991–2020referenceperiod.NotethattherangeofvaluesistwicethatfortheannualmeaninFigure10.13https://climate.copernicus.eu/surface-air-temperature-may-202220CHAPTER1:GLOBALPERSPECTIVEONRENEWABLEENERGYRESOURCESIN2022InNovember2022,theEDDvariationsarenegativeoverall(Figure12),butagainreasonsdifferfordifferentregions.Thus,thenegativesignalinBrazil,Paraguay,PeruandChileandinalargepartofSouthernAfricaisduetolower-than-normaltemperatures,14andhencelowercoolingdemand.SimilarnegativeEDDvariationsinEurope,NorthAfricaandthecentral–easternUnitedStates,wereinsteaddrivenbyhigher-than-normaltemperatures,andthereforewerelinkedtolowerheatingrequirementsatatimewhenheatingusuallystartstobeused.Atthesametime,positivetemperatureanomaliesovertheArabianPeninsula,Argentina,UruguayandSouth-EastAsiadrovethehighercoolingdemand,andhencethepositiveEDDvariations.Figure12.Globalanomaliesofenergydemandproxy(energydegreedays(EDD))(expressedin%)forNovember2022relativetotheaverageforNovemberinthe1991–2020referenceperiod.NotethattherangeofvaluesistwicethatfortheannualmeaninFigure10.14https://climate.copernicus.eu/surface-air-temperature-november-20222Regionalperspectiveonrenewableenergyresourcesanddemandin2022Thissectioncontainsassessmentsatregionallevelforportionsofthreecontinents:Africa,AsiaandSouthAmerica.Foreach,thereisaloosefocusonaspecifictechnology,namelysolarPVpower,windpowerandhydropower,respectively.Itshouldbenotedthatrenewablecapacityforhydro-,windandsolarpowerintheseregionsvariesdramatically.Forinstance,inAfrica,powergenerationis154,12and20TWh,respectively,whereasinAsia,itaccountsfor1856,748and550TWh,respectively.Thesearerepresentedbytheir2022annualvariationsrelativeto1991–2020,displayedonamap,asintheprevioussection.However,themainanalysisisbasedonthe2022monthlypercentageanomaliesinthefourenergyindicatorsforselectedcountriesforeachofthethreecontinents.Forpresentationpurposes,thenumberofcountrieshasbeenlimitedtofivepercontinent.Whilethechoiceofcountriesissomewhatarbitrary(forAfricaforinstancethisislessthan10%ofthecountries),thecountrieschosenareclosetoeachotherandthereforepotentially,oractually,connectedviapowertransmissionlines.Thisisimportantforconsiderationsrelatingtobalancingofelectricalpower,evenifitisbeyondthescopeofthisreporttoassesstheactualpossiblebalancingofenergyresources,notleastbecauseweareconsideringrelativechangesinCFsorproxyindicators,andthereforenottheactualdemandorgeneration,oreventheREinstalledcapacity.Thus,thepowerbalancingdiscussionthatfollowsismostlyqualitative,butitismeanttoprovidepromptsforfurtheranalysis.2.1AfricaThesolarPVpower,orsolarPVCFforAfricafor2022relativeto1991–2020isshowninFigure13(asalsopresentedinFigure4).Onceagainlargecountryclustersarevisible,wherepositiveanomaliesareobservedinthenorthernandcentralpartsofthecontinent,whilenegativeanomaliesaremainlyobservedinthewestern,easternandsouthernparts.Inbothcasesthevariationsaremoderate,upto6%ineitherdirection.FivecountrieswithintheSouthernAfricanDevelopmentCommunity(SADC)areselectedforthemorein-depthanalysis:Botswana,Mozambique,Namibia,SouthAfricaandZimbabwe.IntermsofsolarPVCF,SADCshowsanalmostentirelynegative,albeitsmall,variation,animportantreferencefortheensuinganalysis.Thefourenergyindicatorsforthesefivecountriesforeachmonthof2022areshowninFigure14.Themonthlyvariationsmakeitpossibletoobservefeaturesthataremaskedbytheannualaverage(andactuallyevenbytheindividualmonthsassessedintheprevioussection,MayandNovember),namelythattherearealsomonthsinwhichvaluesarepositiveandcomparativelylarge(around10%),asinthecaseofZimbabwe(FebruaryandDecember),Botswana(February)andMozambique(October).22CHAPTER2:REGIONALPERSPECTIVEONRENEWABLEENERGYRESOURCESANDDEMANDIN2022Figure13.Annualmeananomalyofsolarphotovoltaic(SPV)powercapacityfactor(expressedin%)for2022relativetotheaverageofthe1991–2020referenceperiodwithfocusonAfrica(asalsopresentedinFigure4).Notethatthebordersoftheselectedcountrieshavebeenhighlightedinblue.AlthoughtheoverallmagnitudeofthevariationsinsolarPVCFforthesecountriesismodest,itisimportanttoalsoassessthevariationsinadjacentmonths.Forinstance,forZimbabwethereisajumpofover25%fromJanuarytoFebruary,andaconsecutivedropofsimilarmagnitudefromFebruarytoApril.Itistheserelativelylargechangeswhichrequirecloseattentionwhenmanagingenergyresources.Naturallythesechangesmustbeconsideredinthecontextofotherenergyresources(inthiscasewindpowerandhydropower),ideallyalsoconsideringpossibletransmissionswithneighbouringcountries,butespeciallydemand,whichistheultimatedriverforgeneration.ToillustratehowtheplotsinFigure14canbeinterpreted,consideramonthinwhichthedemandisanomalouslyhighsuchasJune2022.AsidefromMozambique,demandanomaliesarepositive,andupto40%higherthanthe1991–2020Juneaverage.WhilesolarPVCFinJuneisreduced,theindicatorsforwindpowerandhydropowershowstrongincreases.Therefore,anddependingontheinstalledcapacity,windpowerandhydropowercouldmorethancompensateforthesmallreductioninsolarPVtomeettheincreaseindemand(notehoweverthatthelargeanomalyinthehydropowerindicatorisduetoalowbaseline,relatedtothelocaldryseason,typicallyoccurringfromJunetoSeptember).Thus,inthiscasenoimportsorexportsofpowerwouldbenecessary,evenifinprincipletherewouldbeenoughpotentialgenerationtoprovidesomeinter-countrybalance.Amoreproblematicsituationintermsofsupply–demandbalanceoccursinOctoberwhenthedemandanomalyinallfivecountriesispositive(between5%and30%),andatthesametimealargeportionofpotentialgenerationshowsanegativeanomaly,exceptforsmallincreasesinsolarPVCFforMozambiqueandZimbabwe,andwindpowerCFforZimbabwe.Inthissituation,balancingpoweramongthesecountrieswouldrequirecarefulplanning,forinstancetoensurethereisenoughwaterinhydropowerdamsfromthepreviousrainyseason(typicallyendinginMay),andaheadofthenextrainyseason(typicallystartinginOctober–November).2022YEARINREVIEW:CLIMATE-DRIVENGLOBALRENEWABLEENERGY23POTENTIALRESOURCESANDENERGYDEMANDFigure14.Monthlypercentageanomalyfor2022relativetocorrespondingmonthsinthe1991–2020referenceperiodforfivecountriesinSouthernAfrica.Fromtoptobottom:windpower(WP)capacityfactor,solarphotovoltaic(PV)powercapacityfactor,weightedtotalprecipitation(WTP)(hydropowerproxyindicator),energydegreedays(EDD)(energydemandproxyindicator).NotethatBotswanadoesnothavehydropowerplants,andthereforenoindicatorhasbeencomputed.Alsonotethatthey-axisvariesdependingontherangeoftheindicator.24CHAPTER2:REGIONALPERSPECTIVEONRENEWABLEENERGYRESOURCESANDDEMANDIN20222.2AsiaThewindpowerCFanomaliesforAsiafor2022relativeto1991–2020areshowninFigure15(asalsopresentedinFigure1).InthiscasetheselectedfivecountriesarethemajorcountriesinSouthAsia–Afghanistan,Bangladesh,India,Pakistan–plusChina.WiththeexceptionofBangladesh,thewindpowerCFanomalyismoderatelynegativeforthesecountriesover2022,onaverage.Themonthlymeananomalies(Figure16)broadlyconfirmthisnegativesignal,withacoupleofexceptions:(i)China,whichafteraninitialnegativeanomalyinJanuary(lessthanminus20%)andFebruary,hoveredaroundthezerovalueuntilthesecondhalfoftheyearwhenitreachedpositivevaluesofuptoaround10%,which,consideringitshugeinstalledcapacity(approximately360GWin2022),translatesintoaverylargechangeingeneration;and(ii)Bangladesh,withsomelargepositivesignalsinafewmonthsof2022(April,OctoberandNovember,withvalueslargerthan30%),evenifitsCFbaselineissmallanditspotentialgenerationwouldalsobeextremelylowgivenitssmallcurrentinstalledcapacityofjustafewMW.Figure15.Annualmeananomalyofwindpower(WP)capacityfactor(expressedin%)for2022relativetotheaverageofthe1991–2020referenceperiodwithafocusonAsia(asalsopresentedinFigure1).Notethatthebordersoftheselectedcountrieshavebeenhighlightedinblue.AsintheAfricasection,thissectionconsidersaproblematicsituationinwhichtheoveralldemandanomalyishighforthefiveAsiancountries,andatthesametimepotentialgenerationisdepressed(Figure16).ThishappenedinJune2022,whentheEDDindicatorsshowmoderatetohighincreasesforfouroutofthefivecountries–notablyChinashowsanincreaseofabout30%–whileindicatingamodestdecreaseforPakistan.ThesmallincreasesinwindpowerCFforBangladesh(withaverylowinstalledcapacity,asmentioned)andPakistan(whichhasasizeableinstalledcapacity,at1.4GW),andthemarginalincreasesinsolarPVCFofafewpercentforAfghanistan(33MWofinstalledcapacity),India(63GW)andPakistan(1.2GW)wouldlikelybeinsufficienttocounterthereductionintheremainingREpotentialgenerationandmeettheincreaseddemand.TherearealsomonthsinwhichthedemandisconsiderablyreducedforChina,asforinstanceMarchandNovember,whenEDDreachesnegative20%,butthedemandanomalyshowsmarkedincreasesintheotherfourcountries,especiallyinMarch.Overall,thecombinationofhighaveragedemandanomalyandgenerallylowgenerationpotentialforthethreeREresourcesmakesayearlike2022somewhatchallengingfromtheperspectiveofdemand–supplybalanceforthesefivecountries(seealsoFigures1,4,7and10).2022YEARINREVIEW:CLIMATE-DRIVENGLOBALRENEWABLEENERGY25POTENTIALRESOURCESANDENERGYDEMANDFigure16.Monthlypercentageanomalyfor2022relativetocorrespondingmonthsinthe1991–2020referenceperiodforfivecountriesinAsia.Fromtoptobottom:windpower(WP)capacityfactor,solarphotovoltaic(PV)powercapacityfactor,weightedtotalprecipitation(WTP)(hydropowerproxyindicator),energydegreedays(EDD)(energydemandproxyindicator).Notethatthey-axisvariesdependingontherangeoftheindicator.26CHAPTER2:REGIONALPERSPECTIVEONRENEWABLEENERGYRESOURCESANDDEMANDIN20222.3SouthAmericaThehydropowerindicator,IC-WTP,forSouthAmericafor2022relativeto1991–2020isshowninFigure17(asalsopresentedinFigure7).Inthiscasetheselectedfivecountriesare:Argentina,Brazil,Chile,ParaguayandUruguay.ForallofthemtheaverageIC-WTPisnegativeover2022,withvaluesaslowasnegative30%–40%forUruguay.Figure17.Annualmeananomalyofhydropowerproxyindicator(expressedin%)for2022relativetotheaverageforthe1991–2020referenceperiodwithafocusonSouthAmerica(asalsopresentedinFigure7).Notethatthebordersoftheselectedcountrieshavebeenhighlightedinblue.Theoverallnegativesignalisalsoreflectedinthemonthlyaverages,withtheexceptionsofApril(forChile),andMayandOctober(forParaguay)(Figure18).Ontheotherhand,windpowerandsolarpowerCFanomaliesaregenerallypositivethroughouttheyear,exceptforthewindpowerCFinMayandJune.Incidentally,theEDDisanomalouslyhighinMayandJuneforallfivecountries,withUruguayat40%andArgentinaaround25%higherthannormal.However,suchanincreaseindemandforthesetwomonthscouldbebalancedbysolarpower,giventhatitsCFishigherthannormal.AlthoughtheincreaseinsolarpowerCFisonlyaround5%–10%,itisoccurringforallfivecountries,whichhaveacurrentaggregatePVinstalledcapacityof32GW(though75%ofthatisinBrazil).AdifferentsituationispresentinJuly2022,whentheoverallEDDanomalyisnegative(onlyChileshowsasmallincrease)andatthesametimewindandsolarpowerpotentialgenerationisgenerallypositive(Figure18),leadingtoapotentialsurplusingenerationthatcouldbeexportedtoneighbouringcountries.However,thiswouldalsodependonthedeficitshownbythehydropowerindicator,whichiscomputedagainstarelativelylowbaselinegiventhelocaldryseason.2022YEARINREVIEW:CLIMATE-DRIVENGLOBALRENEWABLEENERGY27POTENTIALRESOURCESANDENERGYDEMANDFigure18.Monthlypercentageanomalyfor2022relativetocorrespondingmonthsinthe1991–2020referenceperiodforfivecountriesinSouthAmerica.Fromtoptobottom:windpower(WP)capacityfactor,solarphotovoltaic(PV)powercapacityfactor,weightedtotalprecipitation(WTP)(hydropowerproxyindicator),energydegreedays(EDD)(energydemandproxyindicator).Notethatthey-axisvariesdependingontherangeoftheindicator.3PotentialfutureclimaterisksforrenewableenergyanddemandWhilethemainfocusofthisreportisontheimpactofclimate-inducedvariabilityonREpotentialgenerationanddemand,specificallyfor2022relativetothe1991–2020climatology,anoften-askedquestionishowREresourcesanddemandcouldvaryoverfuturedecadesduetoclimatechange.Toaddressthisquestionabriefreviewofavailableliteratureispresentedbelow.Morespecifically,abroadassessmentoftheprojectedchangesforeachofthefourenergyindicatorsispresented,basedononerelevantpapereach.153.1WindpowerArecentreviewofclimatechangeimpactsonwindpowergeneration(IPCC,2022b;Pryoretal.,2020)concludedthatnaturalvariabilityduetotheactionofinternalclimatemodesappearstodominateoverglobal-warming-inducednon-stationarityovermostareasoftheglobewithlargewindenergyinstallationsorpotential.However,thereisevidenceforincreasedwindenergyresourcesbytheendofthecurrentcenturyinNorthernEuropeandtheUnitedStatessouthernGreatPlains.Theauthorsaddacaveattotheresultsbypresentingevidenceofsomeofthechallengesintrinsicinthistypeofassessment,namelyquantifyingtheclimateimpactsonwindpowergeneration.Forinstance,incontrasttoairtemperatureandtotalprecipitablewater,itisunknownwhetheranthropogenicwarmingwillresultinstilling(decreasesinwindspeed)orincreasedwindinessateithertheregionalortheglobalscale.Reductionsintheequator-to-polelarge-scaletemperaturegradientwilllikelymodifytropicalcirculationpatterns(Hadleycell,monsooncirculationsand/ortropicalcyclonefrequency)andthebehaviourofmid-latitudejetstreamsandstormtracksand,hence,cyclonefrequency,intensityandtracking.Moreover,climatedriverssuchastheNorthAtlanticOscillation(NAO)expressvarianceatfrequenciesfromsub-annualtomulti-decadal,withthelatter(uptotimescalesof60years)beingmodulatedbyNorthAtlanticsea-surfacetemperatures,theAtlanticMulti-decadalOscillationandthePacificDecadalOscillation.Thepresenceoflow-frequencyvariabilitygreatlyconfoundstheabilitytoidentifyandassigncausesoflong-termtendenciesinwindresources.Ontheotherhand,basedonhistoricalrecords,arecent“recovery”ofwindspeedshasbeenobservedinbothindividualregions(forexample,inChina)andacrossthenorthernhemisphere.Whileglobalannualmeanwindspeedsat10mheightbetweenthe1980sandearly2000sexhibitedanegativelineartrendof<−0.1ms−1perdecade,thetrendhassincereversedandincreasesof>0.2ms−1perdecadewerereportedfor2010–2017.Overall,thereneedstobegreateremphasisplacedonquantifyingthefidelityofprojectionsofwindresourcesandoperatingconditions,throughregionalandglobalstudies.Accesstodatafromoperatingwindfarmswouldgreatlybenefiteffortstoevaluateandimproveourmodellingofwindresourcesandaddressthesechallengesandotherresearchquestions(IPCC,2022b;Pryoretal.,2020).3.2SolarphotovoltaicpowerClimatechangemayaffectsolarPVpoweroutputbyincreasingtheweathervariabilityandextremes,especiallyintermsofchangesintemperatureorclouds.ByassessingglobalchangesinthefrequencyofwarmandcloudyconditionsthatleadtoverylowPVpoweroutputs,Feronetal.(2021)showedthatsummerdayswithverylowPVpoweroutputsareexpectedtodoubleintheArabianPeninsulabymid-centurybutcouldbereducedbyhalfinSouthernEuropeover15Thereviewisrestrictedtoonepapereachbecauseofspacelimitations,butalsoduetothefactthatcurrentlytherearefewassessmentsatthegloballevel.However,thereareconsiderablymorepapersstudyingtheimpactofclimatechangeonREanddemandattheregionallevel.Manyofthesepaperscanbefoundinthereferencelistsofthecited,global,papers.2022YEARINREVIEW:CLIMATE-DRIVENGLOBALRENEWABLEENERGY29POTENTIALRESOURCESANDENERGYDEMANDthesameperiod,evenunderamoderate-emissionscenario.Changesforwinter,eitherincreasingorreducingthePVpowervariability,areprojectedtobelessstriking,atleastinlow-andmid-latituderegions.Morespecifically,asshownbyFeronetal.(2021)andincludedintheIPCCAR6WG2report(IPCC,2022a),climatechangeisexpectedtochangeaveragePVpoweroutputstoonlyaminortomoderateextentundertheRepresentativeConcentrationPathway4.5(RCP4.5)scenario(thatis,theRCPthatstabilizesradiativeforcingat4.5Wm−2intheyear2100).Moderatechanges(eitherpositiveornegative)areexpectedbymid-centuryinsummerPVpotentialestimatesinpartsoftheArabianPeninsula(−4%)andCentralEurope(+5%).ThechangesinPVpotentialarelesspronouncedinotherregionssuchastheAtacamaDesert(+3%),south-easternAustralia(−2%),easternChinaandSouth-EastAsia(+2%),andNorth-WesternAfrica(−2%)(Figure19).Figure19.Futurechangesinsolarpotentialforsummerareonaveragemoderateworldwide.(a)–(f)showchangesfrom1961–1990to2036–2065(RCP4.5)inthemulti-modelmean(MMM)ofGeneralCirculationModel-basedsummerestimatesof:(a)PVpotential(PVPOT),(b)downwellingshort-wave(SW)irradiance,(c)surfaceambienttemperature,(d)capacityfactor(CF),(e)surfacewindspeedand(f)aerosolopticaldepth(AOD).TheplotsweremadebyassemblingDecember–February(DJF)dataforthesouthernhemisphereandJune–August(JJA)dataforthenorthernhemisphere.Stipplingindicatesregionswherethedetectedchangesareconsideredtobesignificant.Source:Feronetal.,20213.3HydropowerUsingasetofCoupledModelIntercomparisonProject(CMIP)models,vanVlietetal.(2016)showedthatthereareconsistentexpectedincreasesinannualmeanstreamflowforhigh-latituderegions(NorthernNorthAmerica,NorthernAsia),andlargepartsofthetropics(CentralAfrica,SouthernAsia).For25%ofthegloballandsurfacearea,increasesinannualmeanstreamflowforthe2050sareconsistentamongalltenCMIPmodels.ConsistentdecreasesinstreamflowareprojectedfortheUnitedStates,SouthernandCentralEurope,South-EastAsiaandSouthernpartsofSouthAmerica,AfricaandAustralia(8%ofglobalsurfaceareafor2050s)(Figure20).Spatialpatternsofchangesinhydropowerusablecapacitiesstronglycorrespondwiththeprojectedimpactsonstreamflow,showingoverallincreasesinCanada,NorthernEurope,CentralAfrica,Indiaandnorth-easternChina(vanVlietetal.,2016).However,mosthydropowerplants(61%–74%forRCP2.6–8.5)aresituatedinregionswhereconsiderabledeclinesinstreamflow30CHAPTER3:POTENTIALFUTURECLIMATERISKSFORRENEWABLEENERGYANDDEMANDareprojected,resultinginmeanreductionsinhydropowerusablecapacity.Reductionsareprojectedintheglobalannualhydropowercapacitiesof1.7%–1.9%(2020s),1.2%–3.6%(2050s)and0.4%–6.1%(2080s)basedontheGeneralCirculationModel(GCM)ensemblemeanforRCP2.6–8.5.Monthlymaximumreductionsare8.9%–9.2%(2020s),9.6%–17%(2050s)and8.3%–24%(2080s),with5%–22%ofthehydropowerplantsexperiencingstrong(>30%)reductionsinmonthlyusablecapacityforthe2050s.Figure20.Impactsofclimatechangeonannualmeanstreamflow.MapsofchangesinstreamflowforRCP8.5for2040–2069(2050s)relativetothecontrolperiod1971–2000.Trendsinchangesfor1971–2099arepresentedbasedontheGeneralCirculationModel(GCM)ensemblemeanresults(thicklines)andforthefiveindividualGCMsseparately(thindottedlines)forbothRCP2.6(orange)andRCP8.5(red).Trendspercontinentwereassessedbycalculatingmeanvaluesinstreamflowandwatertemperatureoverallcontinentgridcells.Futurechangeswerethencalculatedrelativetothecontrolperiod1971–2000.Source:vanVlietetal.,20162022YEARINREVIEW:CLIMATE-DRIVENGLOBALRENEWABLEENERGY31POTENTIALRESOURCESANDENERGYDEMAND3.4DemandTheprojectedglobaltemperatureincreasesinthetwentyfirstcenturyareexpectedtohaveconsequencesonenergyconsumptionduetoanincreaseinenergydemandtocoolthebuiltenvironmentandadecreaseinenergydemandtoheatit.Thisincreaseanddecreasealsodependonthenumberofendusersforsuchenergy;thusitiscrucialtoincludepopulationintheanalyses.BystudyingtheprojectedchangestoCDD,HDDandEDD,Spinonietal.(2021)foundthattheprogressiveincreaseinCDDoutbalancesthedecreaseinHDDalmosteverywhereformostglobalwarminglevels(GWLs)andsharedsocioeconomicpathways(SSPs).AfewregionsshowadecreasingtendencyinEDDathighGWLsforallSSPs:CentralEurope,andNorth-western,North-easternandEasternAsia.Globally,EDDarelikelytodoubleat2°Cofwarmingcomparedto1981–2010independentlyoftheSSP.Undertheworst-casescenario(SSP3),at4°CofwarmingCDDareapproximately380%higherandHDDapproximately30%lowerthanintherecentpast,leadingtoanincreaseinEDDofcloseto300%.Moreover,EDDshowsthelargestincreaseoverequatorialAfricaandIndiaandthelargestdecreaseoverCentralEuropeandChina.Globally,CDDarelikelytoincreasewithallSSPs(thelargestincreaseiswithSSP3),whileHDDarelikelytodecreasewithlesssustainableSSPs(SSP3–SSP5)andshowverysmallchangewithSSP1andSSP2.Thus,EDDareprojectedtoincreaseoverallattheglobalscale,buttodecreaseovermiddleandhighlatitudesinEurasiaandinSouth-westernSouthAmerica(Figure21).Spinonietal.(2021)cautionaboutthelikelylargeuncertaintiesofpopulation-weighteddegree-dayprojectionsforCDDcomparedtoHDD.TheareaswiththelargestuncertaintiesarethecentralUnitedStates,Amazonia,SouthernSouthAmerica,EasternEurope,theMediterraneanregion,theSahel,tropicalSouthernAsia,andsouthernAustralia.However,consideringareaswithpopulationdensitieshigherthan1person/km2,lessthan4%ofglobalareasshowinter-modelspreadslargerthan10%–atanyGWL–inatleastoneofthedegree-dayindicators.Moreover,theagreementamongmodelsinthesignofchangeissignificantover98%ofgloballandsandforallGWLs(over99%excludingthesparselypopulatedareas).Figure21.Population-weightedenergydegree-days(EDD)for1981–2010(recentpast(RP))andprojectedchangeatfourglobalwarminglevels(GWLs)followingfivesharedsocioeconomicpathways(SSPs)Source:Spinonietal.,20214ConclusionsClimatevariabilityandchangemodulatebothenergydemandandREsupply.GiventheambitiousglobaltargetstodramaticallyincreaseREgenerationinlinewith1.5C°emissionsscenariosby2050,itiscriticaltoassesstheimpactthatclimatehasonREpotentialgenerationanddemand.Theeffectofclimatevariabilityhasbeendiscussedherebyevaluatingthechangesinfourindicators,windpowerCF,solarPVCF,ahydropowerproxyandtheenergydemandproxyEDD,over2022comparedtothestandard30-yearaverage,1991–2020.Thefourindicatorsdisplayconsiderablepercentageanomaliesbothwhenaveragedoverthewholeof2022andevenmoreonamonth-to-monthbasis,overseveralpartsoftheglobe,withvaluesconsiderablylargerthanatypicalthresholdreferenceof5%–10%16(withsolarPVCFshowingthesmallestrangeofuptoapproximately6%onanannualmean).Theassessmentpresentedheremaybeusefulbothasaretrospectiveanalysisandtomanageenergyresourcesinamoreefficientway.ThissectiondiscussestherelevanceofearlywarningsystemsforenergysecurityandpolicyimplicationsforpotentialgrowthofREinthecontextofclimatevariability.Asubsectionwithkeymessagesthenattemptstosynthesisethewholedocumentinshortparagraphs.4.1DiscussionontheimportanceofearlywarningsystemsOfthefourpillarsoftheEarlyWarningsforAllinitiative,17twoareparticularlyrelevantinthecontextoftheenergysectorandthemanagementofREgeneration:•Detection,observation,monitoring,analysisandforecasting;•Preparednessandresponsecapabilities.4.1.1Detection,observation,monitoring,analysisandforecastingWhilethereisawealthofdata,fromobservationsormodels,alreadybeingusedtocreateeffectiveservicesforenergy,includingforecasts,somelimitationsinthequalityofdataareevident.Thescienceandtechnologyareatdifferentlevelsofdevelopment,withweatherforecastingmoreadvancedthanclimateforecasting,butbothrelevantforeffectiveearlywarningsystems.Ineachoftheseareasthereisroomforimprovement.Inweatherforecasts,forinstance,workcouldbedonetoimproveparametrizationsrelevantforwindandsolarpower.Inseasonalclimateforecasts,improvementscouldcomefromthedynamicsofclimateanomalies,whichmayinvolveimprovingmodelresolutionorimproveduseofforecastensemblemembers,butalsoincreasedobservationcoverage(IntegratedWeatherandClimateServicesinSupportofNetZeroEnergyTransition(WMO-No.1312)).Morespecifically,itisimportanttoassessrelevantclimatedriversandtheircorrespondinglarge-scaleatmosphericpatternsandunderstandtheirimplicationsforrenewablepowergenerationanddemand,tobeabletoprovideappropriateadvancewarnings.Anotherkeyaspectisthesharingofobservations:thesearefundamentalforinitializingnumericalweatherpredictionsthroughdataassimilation,theassessmentofweatherandclimatemodeloutputoreventhecalibrationofparametrizationsandpost-processingproceduressuchasbiasadjustments.Despitetheimportanceofobservations,therearestillmanyareasoftheglobe,bothindevelopedandleastdevelopedcountries,whichareunder-observed,especiallyintermsofwindspeedatdifferentheightsorsolarradiation.16Anaverageannualchangeofthismagnitudecanbeconsideredsignificantforbothgenerationanddemandpurposes.Monthlychangesaretypicallymuchlargerthanannualmeans.17TheEarlyWarningsforAllinitiativeisaground-breakingefforttoensurethateveryoneonEarthisprotectedfromhazardousweather,waterorclimateeventsthroughlife-savingearlywarningsystemsbytheendof2027.TheEarlyWarningsforAllinitiativeisbuiltaroundfourkeypillars:(i)disasterriskknowledgeandmanagement;(ii)detection,observation,monitoring,analysisandforecasting;(iii)warningdisseminationandcommunication;and(iv)preparednessandresponsecapabilities.Moreinformationisavailableat:https://public.wmo.int/en/earlywarningsforall.2022YEARINREVIEW:CLIMATE-DRIVENGLOBALRENEWABLEENERGY33POTENTIALRESOURCESANDENERGYDEMANDThesharingofdataiscriticalalsowhenitcomestoenergy,bothintermsofgenerationandinstalledcapacity.Thesedataareessentialforaccuratelymodellingpowerproductionorcapacityfactors.However,manygapsstillexistintheseenergydata,alsoduetocommercialsensitivities,andqualityissometimessuboptimal.Evenforcountrieswheredataaremadefreelyavailable,suchaswiththeEuropeanNetworkofTransmissionSystemOperatorsforElectricity(ENTSO-E)TransparencyPortal,18whichisanexemplarinenergydatasharing,therearesometimesinconsistenciesbetweengenerationandinstalledcapacities,partlyduetothefactthatinstalledcapacitiesarenotupdatedfrequentlyenoughorarenotalwaysreportedaccurately.Overall,thereisaneedtofurtherassessgapsandopportunitiesforearlywarningsystemsforenergyattheregionalperspectiveandconsideringdifferenttypesofREs(2022StateofClimateServices:Energy(WMO-No.1301)).4.1.2PreparednessandresponsecapabilitiesPreparednessandresponsecapabilitiesfortheoperationandmanagementofenergyresourcesaretypicallytheresponsibilityofenergycompanies,whichdirectlymanagepowersupplyorthegrid.However,inlessdevelopedcountriestheorganizationsinchargeofpowersupplyorgridmanagementsometimeslackthetoolstoproperlymanageenergyresources.TheWMOStateofGlobalWaterResources2022(WMO-No.1333)reportsthatdroughtconditionscausedasignificantdropinhydropowerproductionin2022,resultingfromlowriverflows.Itisthereforeimportanttosupportearlywarningsforenergysecurity,particularlyforhydropower,whichiscurrentlythemostcommonREsourceinmanylessdevelopedcountries.4.2PolicyforpotentialgrowthofrenewableenergyinthecontextofclimatevariabilityPowersystemflexibilityisthekeytocopingwithfluctuationinelectricitygenerationandconsumptionpatterns,toensureanequilibriumbetweensupplyanddemand.Powersystemflexibilityreferstotheextenttowhichgenerationordemandcanbeincreasedordecreasedwithinatimeframerangingfromminutestohours,inresponsetoanticipatedorunexpectedfluctuations.Insuchregard,theroleofpolicymakersisasfollows:•Assisttheadoptionofweatherforecasttoolsthatallowalong-andshort-termsetofactionstodealwithsolarPVandwindvariability.•AssistthedevelopmentofthepowersysteminsuchawaythatsolarPVandwindgenerationcomplementeachotherandotherrenewablesourcesinthemosteffectiveway.Thisrequiresaccurateplanningandprovisionoflong-termpricesignalsthatfacilitateselectionofthebestlocationforvariablerenewableenergy(VRE)plantsandaVREdesignthatisthemost“systemfriendly”.•Fosterflexibilityresources(batteries,demand-sidemanagement,interconnections)throughlong-andshort-termpricesignals,tobothsupporttheircommissioningandfacilitatetheirdailyoperations.Forthelasttwopoints,IRENAproposesthe“dualprocurement”approach(IRENA,2022)toshapepowersystemorganizationalstructuresinthecontextoftheenergytransition.Thisapproachrecognizesthedistinctcharacteristicsandrequirementsoftwoessentialelementsforasuccessfultransition:renewableelectricityandflexibility.Thedualprocurementapproach18https://transparency.entsoe.eu34CHAPTER4:CONCLUSIONSenvisionsanintegratedsystemthatefficientlyincorporatesboththeseelementswithinthepowersystem,consideringtheiruniqueattributesandtheinterplaybetweenthem.Long-termrenewableenergy(LT-RE)procurementfocusesonsecuringrenewableelectricitygenerationforthelongterm.Itinvolvesmechanismslikeauctionsordirectpublicinvestments,specificallydesignedforcapital-intensiverenewabletechnologies.LT-REprocurementaimstoalignsupplyanddemandoverextendedtimeframes,bothtemporallyandspatially,facilitatinginvestmentsnecessaryforreliableelectricitysupply.Short-termflexibility(ST-Flex)procurementcomplementstheLT-REpillarbyaddressingtheneedforflexibilityintheshortterm.Itoperatesbasedonmarginalpricesandemploysagranularbiddingformat.ST-Flexprocurementisgearedtowardsmatchingreal-timesupplyanddemand,handlingdeviationsbetweenscheduledandactualloadandrenewableenergyproduction.Itaccommodatesvariousflexibilityresources,includingdemand-sideresources,storage,distributedenergyresourcesandsectorcoupling.BothLT-REandST-Flexprocurementmechanismsshouldrecognizethevalueoftimeandlocationinelectricityandflexibilityprovision.Theyshouldalsoemphasizetheactiveparticipationofendusers,whocandirectlyorindirectlyengageinthesemechanisms,shapinglong-termforecastsandcontributingtosystemoperation.Conduciveretailratesandpricesplayacrucialroleinencouragingdistributedinvestmentsinrenewableenergyandflexibilityassets.Thedualprocurementconceptisadaptabletodifferentsocioeconomiccontexts,whetherliberalized,regulatedorhybridsystems.Itseekstoimprovegovernance,alignmarketstructureswithsocialvalueandfosteractivestakeholderinvolvementintheenergytransition.Ultimately,theaimistostrikeabalancebetweenenvironmentalsustainability,humanrightsandeconomicperformanceinshapingthefutureofpowersystems.Overtime,aconvergenceofimplementationapproachesinregulatedandliberalizedcontextsmaybeexpectedastheysharethecommongoalofenhancingpowersystemefficiency.4.3Keymessages(i)Allassessedindicatorsshownoticeablechangesduetoeffectsofclimatevariabilityandchange,albeitdifferingbytechnologyandcountry.Thefourenergyindicatorsassessed(windpowerCF,solarPVCF,ahydropowerproxyandtheenergydemandproxyEDD),presentedascountryaverages,displaymarkedpercentageanomaliesforbothannualandmonthlyaverages.AsidefromSolarPV,whichdisplayslimitedvariabilityoflessthan10%onaverageannually,theoverallinter-annualandintra-annualvariabilityispronounced;forinstance,itislargerthan15%forwindpowerCFformanycountries.(ii)Improvingourunderstandingofclimatedriversandtheirinteractionswithrenewableresourcesisvitalforresilienceandtheefficiencyofenergysystemsandtheirtransition.ItiscriticaltoconsiderkeyclimatedriverssuchastheElNiñoSouthernOscillation(ENSO),asthesenormallyexplainalargeportionoftheobservedvariability;accuratelypredictingthemmakesitpossibletomanageenergyresourcesmoreefficientlythanwouldbepossiblewithoutsuchknowledge.(iii)Mainstreamingclimatevariability,inadditiontoclimatechange,shouldbeapriorityforimprovedoperation,managementandplanningofenergyresources.Thiscouldleadtotheestablishmentofearlywarningsystemstohelpbettermanageenergyload,resourcesandmaintenance.Moreover,thiscaninformenergyinfrastructuremodernizationandexpansion,andtriggerthenecessaryinnovationacrosstechnologies,marketsandpolicies.2022YEARINREVIEW:CLIMATE-DRIVENGLOBALRENEWABLEENERGY35POTENTIALRESOURCESANDENERGYDEMAND(iv)Adaptingmarketstructuresiscentraltoprovidingthenecessaryflexibilityduringthetransitionalphasefromcentralizedtodecentralizedpowersystems.Powersystemorganizationalstructuresthatallowboththeprocurementofthehighestvaluesetofvariablerenewableresourcesandthedeploymentofflexibilityresourcesarenecessary.A“dualprocurement”systemcanbeaneffectiveavenueinthisregard.(v)Developingcountries,especiallyinAfricawhereenergyaccessremainsakeypriority,canadapttheirsystemstoharnessrenewablepotentialwiththebenefitofknowledgeonclimatevariability.REisparticularlyunderdevelopedinAfrica,whichaccountsforonly2%ofglobalcapacitydespiteitsabundantpotentials.REisessentialtosupportthecontinent’sdevelopmentandindustrialization.ForeffectiveimplementationandutilizationofRE,itisimportanttocombineknowledgeofpotentialresourcesandexistinginfrastructures,butalsoclimatevariabilityasdiscussedhere.(vi)Comprehensiveandsystematicenergydatacollectionandsharingareessentialtoimprovingknowledgeandunderstandingoftheimpactofclimatevariabilityandchangeonenergysupplyanddemand.Theenergyindicatorspresentedherearesimplifiedwithrespecttoactual,morerepresentativeones.Thecomputationofmoreaccurateindicatorsrequiresmoregeneralandsystematicsharingofenergydata,includinginstalledcapacityandactualgeneration.ReferencesEmber.GlobalElectricityReview2023;Ember:2023.https://ember-climate.org/app/uploads/2023/04/Global-Electricity-Review-2023.pdf.Feron,S.;Cordero,R.R.;Damiani,A.;Jackson,R.B.ClimateChangeExtremesandPhotovoltaicPowerOutput.NatSustain2021,4(3),270–276.https://doi.org/10.1038/s41893-020-00643-w.Hersbach,H.;Bell,B.;Berrisford,P.etal.TheERA5GlobalReanalysis.QuarterlyJournaloftheRoyalMeteorologicalSociety2020,146(730),1999–2049.https://doi.org/10.1002/qj.3803.InternationalEnergyAgency(IEA).ElectricityMarketReport–Update2023:IAE:Paris,2023.https://www.iea.org/reports/electricity-market-report-update-2023.InternationalEnergyAgency(IEA)/Euro-MediterraneanCentreforClimateChange(CMCC).WeatherforEnergyTrackerUsersGuide;April2023Edition;IAE:2023.https://iea.blob.core.windows.net/assets/d8558cd7-5a1a-4ef6-9c24-6d639f54be7d/IEA_CMCC_Weather_for_Energy_Tracker_-_Users_Guide.pdf.IntergovernmentalPanelonClimateChange(IPCC).ClimateChange2021:ThePhysicalScienceBasis.ContributionofWorkingGroupItotheSixthAssessmentReportoftheIntergovernmentalPanelonClimateChange;Masson-Delmotte,V.;Zhai,P.;Pirani,A.etal.,Eds.;CambridgeUniversityPress:Cambridge,UnitedKingdom,2021.https://www.ipcc.ch/report/ar6/wg1.IntergovernmentalPanelonClimateChange(IPCC).ClimateChange2022:Impacts,AdaptationandVulnerability.ContributionofWorkingGroupIItotheSixthAssessmentReportoftheIntergovernmentalPanelonClimateChange;Pörtner,H.-O.;Roberts,D.C.;Tignor,M.M.B.etal.,Eds.;CambridgeUniversityPress:Cambridge,UnitedKingdom,2022a.https://www.ipcc.ch/report/ar6/wg2.IntergovernmentalPanelonClimateChange(IPCC).ClimateChange2022:MitigationofClimateChange.ContributionofWorkingGroupIIItotheSixthAssessmentReportoftheIntergovernmentalPanelonClimateChange;Shukla,P.R.;Skea,J.;Slade,R.etal.,Eds.;CambridgeUniversityPress:Cambridge,UnitedKingdom,2022b.https://www.ipcc.ch/report/ar6/wg3.InternationalRenewableEnergyAgency(IRENA).RE-organisingPowerSystemsfortheTransition;IRENA:AbuDhabi,2022.https://www.irena.org/-/media/Files/IRENA/Agency/Publication/2022/Jun/IRENA_Organising_Power_Systems_2022.pdf.InternationalRenewableEnergyAgency(IRENA).RenewableCapacityStatistics2023;IRENA:AbuDhabi,2023a.https://www.irena.org/Publications/2023/Mar/Renewable-capacity-statistics-2023.InternationalRenewableEnergyAgency(IRENA).RenewableEnergyStatistics2023;IRENA:AbuDhabi,2023b.https://www.irena.org/Publications/2023/Jul/Renewable-energy-statistics-2023.InternationalRenewableEnergyAgency(IRENA).WorldEnergyTransitionsOutlook2023:1.5°CPathway;Volume1;IRENA:AbuDhabi,2023c.https://www.irena.org/Publications/2023/Jun/World-Energy-Transitions-Outlook-2023.Jerez,S.;Tobin,I.;Vautard,R.etal.TheImpactofClimateChangeonPhotovoltaicPowerGenerationinEurope.NatCommun2015,6(1),10014.https://doi.org/10.1038/ncomms10014.Pryor,S.C.;Barthelmie,R.J.;Bukovsky,M.S.etal.ClimateChangeImpactsonWindPowerGeneration.NatRevEarthEnviron2020,1(12),627–643.https://doi.org/10.1038/s43017-020-0101-7.2022YEARINREVIEW:CLIMATE-DRIVENGLOBALRENEWABLEENERGY37POTENTIALRESOURCESANDENERGYDEMANDSpinoni,J.;Vogt,J.V.;Barbosa,P.etal.ChangesofHeatingandCoolingDegree-DaysinEuropefrom1981to2100.InternationalJournalofClimatology2018,38(S1),e191–e208.https://doi.org/10.1002/joc.5362.Spinoni,J.;Barbosa,P.;Füssel,H.-M.etal.GlobalPopulation-WeightedDegree-DayProjectionsforaCombinationofClimateandSocio-EconomicScenarios.InternationalJournalofClimatology2021,41(11),5447–5464.https://doi.org/10.1002/joc.7328.vanVliet,M.T.H.;Wiberg,D.;Leduc,S.;Riahi,K.Power-GenerationSystemVulnerabilityandAdaptationtoChangesinClimateandWaterResources.NatureClimChange2016,6(4),375–380.https://doi.org/10.1038/nclimate2903.WorldMeteorologicalOrganization(WMO).2022StateofClimateServices:Energy(WMO-No.1301).Geneva,2022.WorldMeteorologicalOrganization(WMO).StateoftheGlobalClimate2022(WMO-No1316).Geneva,2023.WorldMeteorologicalOrganization(WMO).IntegratedWeatherandClimateServicesinSupportofNetZeroEnergyTransition(WMO-No.1312).Geneva,2023.WorldMeteorologicalOrganization(WMO).StateofGlobalWaterResources2022(WMO-No.1333).Geneva,2023.Annex.MethodologyTounderstand2022patternsofpowerpotentialanomalies,the1991–2020periodisusedasabaselineinallcases.Thisperiodisofficiallydesignatedasthenewclimatologicalnormal.Allcalculationsforwind,solarandhydropower(ortheirproxies)arebasedonglobalmonthlydatawith0.25°resolution.Windandsolaranomaliesareestimatedusingthepowercapacityfactors.Precipitationisusedasaproxyforhydropower,butitisweighedaccordingtothenumberofhydropowerplantsandtheirsizeinaparticulararea.Oncethepowergeneration(oritsproxy)foreachofthethreeREsourcesiscalculated,theirco-variabilityandtheirroleintheenergymixareexploredinaqualitativeway.Thegenerationindicatorsarealsocomparedwiththeenergydemandproxy.Thefollowingsectionsdescribethemethodsadoptedforthecomputationofeachofthefourenergyindicators(threeforgenerationandonefordemand).LimitationsofclimatedataAlltheenergyindicatorsarebasedonclimatedatafromtheERA5reanalysis(Hersbachetal.,2020;IPCC,2021).WhileERA5isconsideredanexcellentglobalreanalysis,thefactthatitis,aswithallreanalyses,acombinationofobservationsandnumericalweathermodelprocesses,meansthatitisingeneralnotasaccurateasdirectobservations.Reanalysesareusedastheyprovidecompletedatasets,bothtemporally(overtherequiredperiod,1991–2022)andspatially(at0.25°×0.25°overthewholeglobe),whichisnormallynotthecasewithobservations.MasksForeachenergysource,anappropriatemaskisusedinadditiontoageneralland-seamask.Thedetailsforeachmaskaregivenbelowintheappropriatesection,butingeneral,areasthatarenotsuitableorhaverestrictionsforpowerplantconstruction(suchasnaturalreserves,steepslopes)areexcluded.DisplayMapsatagloballevelarepresentedascountryaverageddata.Also,timeseriesofmonthlyaveragesfor2022forselectedcountriesaredisplayed.WindpowercapacityfactorcalculationThewindpowercapacityfactordatausedwerethoseavailableintheWeatherforEnergy(WfE)portalcalculatedbyIEA/Euro-MediterraneanCentreforClimateChange(CMCC)for1991–2020and2022.Theyrepresentthepercentageofpoweroutputovernominalpowerexpectedfromawindturbineonaspecificpointofthegridforaspecifictime.BasedataWindcapacityfactorat100mfromWfE:•Spatialresolution:0.25°x0.25°latitude/longitude•Coverage:Global•Temporalresolution:Monthly•Temporalperiod:1991–2020and20222022YEARINREVIEW:CLIMATE-DRIVENGLOBALRENEWABLEENERGY39POTENTIALRESOURCESANDENERGYDEMANDWindmask•ThisproductisproducedundertheC3SEnergyproject19andisconsideredtime-invariant•Spatialresolution:0.25°×0.25°latitude/longitude•Coverage:Global•Binarylayersaccountingfor:oProtectedareasoTopographicconditionswithhighelevationsandhighslopesoAreasofurbancoverageoPolarareasLand-seamaskAsimplemaskthatidentifieslandandoceansat0.25°(fromERA5);thesamemaskisusedforsolar.FormulausedbyWfEwhere:𝑊𝑊100𝑡𝑡,𝑖𝑖,𝑗𝑗:windspeedat100mabovesurfaceattimet,latitudeiandlongitudej(m/s)𝑃𝑃𝑃𝑃𝑃𝑃𝑃𝑃𝑃𝑃𝑃𝑃𝑃𝑃𝑡𝑡,𝑖𝑖,𝑗𝑗:netelectricalpoweroutputattimet,latitudeiandlongitudej(MW)𝑃𝑃𝑃𝑃𝑃𝑃𝑃𝑃𝑃𝑃𝑃𝑃𝑃𝑃𝑃𝑃:nominaloutputofthewindturbine(MW)T:timeconsidered,forexample,dayt:hoursintheintervalTn:numberofhoursinTi,j:latitudeiandlongitudejofthegridpoint𝑃𝑃𝑃𝑃𝑃𝑃𝑃𝑃𝑃𝑃𝑃𝑃𝑃𝑃𝑡𝑡,𝑖𝑖,𝑗𝑗=𝑓𝑓(𝑤𝑤𝑤𝑤𝑤𝑤𝑤𝑤𝑠𝑠𝑠𝑠𝑠𝑠𝑠𝑠𝑠𝑠100𝑚𝑚𝑡𝑡,𝑖𝑖,𝑗𝑗)isthepowercurveoftheselectedwindturbine,inthiscasetheVestasV110-2MW20WorkflowThewindpowercapacityfactor(CF)ismaskedpriortocalculations.Withthesedatathefollowingarecalculated:(i)capacityfactorsfor“non-restricted”gridpointsfortheperiod1991–2020and2022;(ii)capacityfactorsaveragedovercountries(NaturalEarthAdmin0regions(ADM0)),consideringthenon-restrictedareas.(1)Maskwindcapacityfactordatausingthewindmask(seebelowfordescription)inadditiontoaland-seamask(thatmasksoutalloceans).(a)Considergridpointsforeachcountry(afterapplyingmask)andretainonlythepointsforwhichtheclimatologicalCFisabovethethresholdof0.1,toavoidincludingareaswherewindpowerisunlikelytobedeveloped.(b)Retainthecountryifthenumberofgridpointsabovethethresholdisgreaterthan20%ofallgridpointsforthatcountryandthereareatleasttwogridpoints,otherwisethecountryisnotconsidered(thatis,settoNA).19https://climate.copernicus.eu/operational-service-energy-sector20TheVestasV110-2MWisaturbine110mhighthatcanstartgeneratingatalowwindspeedof3m/s,producingagoodcapacityandyieldatlow-andmedium-windsites.(2)Calculateanomaliesfor2022using1991–2020asbaseline(monthlymeans).(3)Anomaly=monthlymeanfor2022–monthlymeanfortheperiod1991to2020.(4)AggregatebycountrytakingonlygridpointsaboveCFthreshold.(5)Generateglobalanomalymapsaggregatedbycountry(shapefile).(6)Generateregionalanomalymaps(selectedWMOregions)usinggriddeddataclearlyshowingmaskedareas(asthisisalsousefulinformationfortheuser).SolarphotovoltaicpowercapacityfactorcalculationSolarphotovoltaic(PV)powerpotentialcapacityfactorisbasedonmonthlyaveragesofdownwardsolarirradiance,airtemperatureat2mand10-mwindspeed.PVcapacityfactormainlyaccountsforthesolarirradianceresource,butalsotakesintoaccounttheinfluencethatotheratmosphericvariablesmayhaveontheefficiencyofthePVcells,whichdiminishesastheirtemperatureincreases(Jerezetal.,2015).So,theeffectoftemperatureandwindspeedisalsoconsidered.ThecalculationofPVcapacityfactorfollowsthemethodinJerezetal.(2015).Onlypowercapacityoverlandisevaluatedand,inthiscase,urbanareasarenotmasked,asPVcanbeinstalledthere.AnevendistributionofPVpanelsisassumedinallunmaskedareas.Similarlytowind,anomaliesfor2022arecalculatedanddataareaggregatedbycountrytoexploretheenergymixcomplementarityofeachregion.BasedataDownwardsolarirradiance(radiationwithinawavelengthinterval0.2–4.0μm)fromERA5:•Spatialresolution:0.25°×0.25°latitude/longitude•Coverage:Global•Temporalresolution:Monthly•Temporalperiod:1991–2020and2022Airtemperatureat2mfromERA5reanalysisdata:•Spatialresolution:0.25°×0.25°latitude/longitude•Coverage:Global•Temporalresolution:Monthly•Temporalperiod:1991–2020and2022Windspeedat10mfromERA5reanalysisdata:•Spatialresolution:0.25°×0.25°latitude/longitude•Coverage:Global•Temporalresolution:Monthly•Temporalperiod:1991–2020and2022Solarmask•Thisproduct,producedbyWEMC(C3SEnergyproject),isconsideredtime-invariant•Spatialresolution:0.25°×0.25°latitude/longitude•Coverage:Global•Binarylayersaccountingfor:oProtectedareasoTopographicconditionswithhighelevationsandhighslopesoPolarareas2022YEARINREVIEW:CLIMATE-DRIVENGLOBALRENEWABLEENERGY41POTENTIALRESOURCESANDENERGYDEMANDWorkflow(1)Calculatesolarpowercapacity,assuminganevendistributionoverlandofPVpanels.(2)Masksolarcapacityfactordatausingtherestrictedareasmaskandtheland-seamask.(a)Considergridpointsforeachcountry(afterapplyingmask)andretainonlythepointsforwhichtheclimatologicalCFisabovethethresholdof0.1,toavoidincludingareaswheresolarPVpowerisunlikelytobedeveloped.(b)Retainthecountryifthenumberofgridpointsabovethethresholdisgreaterthan20%ofallgridpointsforthatcountryandthereareatleasttwogridpoints,otherwisethecountryisnotconsidered(thatis,settoNA).(3)Calculateanomaliesfor2022usingthesamebaselineandformulasasforwind.(4)AggregatebycountrytakingonlygridpointsaboveCFthreshold.(5)Generateglobalanomalymapsaggregatedbycountry(shapefile).(6)Generateregionalanomalymaps(selectedWMOregions)usinggriddeddataclearlyshowingmaskedareas(asthisisalsousefulinformation).HydropowerproxyThecalculationoftheproxyhydropowercapacityfactorisbasedonmonthlyaveragesofERA5precipitationdata.AstheinstalledcapacityofthisREismorestableovertime,globalhydropowerplantlocationdatawereused,witheverythingelsemaskedout.However,onlyinstallationsfromrecentyears(forexample,2021–2022)wereconsidered,toavoidissueswithunevencoverageoverthereferenceperiodandalsotohaveresultsmorerepresentativeoffuturehydropowerinstalledcapacity(assumingchangeswillbeminor);however,knowledgeofnewpowerplantsmayalsobeincludedinviewofapotentialuseofprojectiondata,asotherwisethosegridcellswouldnotbeconsidered(forexample,theplannedlargehydropowerplantinMalawi).Theinstalledcapacitiesofexistingpowerplantswereusedasweightsfortheproxycalculationbasedonprecipitationoverdefinedsub-countryareas,accordingtoNaturalEarthAdmin1regions(ADM1).Severalcountrieshaveverylowprecipitationvalues,andanyincrease/decreasecauseshighvaluesinthepercentagechangecalculations.Therefore,dataareaggregatedoverathree-monthperiod,namelythemonthconsideredtogetherwiththetwoprecedingmonths(tomimicaccumulationofwaterforhydropower).BasedataPrecipitationfromERA5:•Spatialresolution:0.25°×0.25°latitude/longitude•Coverage:Global•Temporalresolution:Monthlyaverages•Temporalperiod:1991–2020and2022PlantlocationsandinstalledcapacityWeusethehydropowerplantlocationsdatabasefromtheGlobalEnergyMonitorGlobalHydropowerTracker,whichisacomprehensiveandup-to-datedatabase:•Spatialresolution:lat./long.datapoints•Coverage:GlobalWorkflow(1)Foreachgridcellorarea(asdefinedbytheADM1shapefiles),assignweightsbasedonthearea’saggregatedinstalledcapacity.(2)Calculatenewmonthlymovingaveragevaluesusingathree-monthwindow.(3)AggregateprecipitationdataatADM1level(orotheragreeduponaggregationarea).(4)Computethecountry’sweighted-averageprecipitationbasedontheinstalledcapacityweights(thenormalizationfactoristakenasthecountryaverage,consideringalltheADM1forthatparticularcountry).(5)Calculateanomaliesfor2022usingthesamebaselineandformulasasforotherenergyindicators.(6)GenerateanomalymapsaggregatedbycountryforthedifferentWMOregions.EnergydemandproxyToprovideanassessmentofthebalanceorimbalancebetweendemandandrenewableenergy,inthecontextofenergymix,thereportconsidersanenergydemandproxy.Giventhesparsityanddisparityofenergydemanddataatmonthlyresolutionformostcountriescoveringthe1991–2020baselineperiod,theuseofproxydatahadtobeconsideredinstead.Tothisend,theenergydegreedays(EDD)indicator–thesumofcoolingdegreedays(CDD)andheatingdegreedays(HDD)21–wasselectedasaproxyforenergy(electricity)demand.EDDhasbeendefinedandusedinvariousstudiesinEurope(Spinonietal.,2017)andglobally(Spinonietal.,2021).Havingonlyasingledemandindicator,EDD,ratherthantwo,CDDandHDD,makesitpossibletosimplifythepresentationanddiscussion.GlobalCDDandHDDdataarefreelyavailablefromtheIEA/CMCCWeatherforEnergyTrackerfrom1979tonearrealtime(IEA/CMCC,2023).ThereareseveralvarietiesofCDDandHDD.Mid-rangeCDDandHDDwereselected(Table1),andtheEDDwascomputed.AswiththeIEA/CMCCdataset,griddeddataareweightedbypopulation,aspopulationlocationandgrowthhaveaneffectonchangingenergydemand,andthencountryaveragesarecalculated.Table1.SelectedindicesfromtheWeatherforEnergyTrackerVariableShortnameShortexplanationCDD(21°C,humidity)CDDhum21CoolingdegreedaysfromtemperatureHDD(18°C,15°CHDDThold18correctedbyhumidity(referencetemperaturethreshold)21°C).HeatIndexisusedasinputtemperature.EDD(21°C,humidity,18°Cthold)Heatingdegreedays(referencetemperature18°Candthresholdtemperature15°C).Examples:ifthedailymeanairtemperatureis12°C,forthatdaythevalueoftheHDDis6(18°C–12°C).Ifthedailymeanairtemperatureis16°C,forthatdaytheHDDis0.EDDh21Thold18SumofCDDhum21andHDDThol1821HDDassessestheseverityofthecoldinaspecifictimeperiodtakingintoconsiderationoutdoortemperatureandaverageroomtemperaturetoinfertheneedforheating(conversely,CDDassessestheseverityoftheheattoinfertheneedforcooling).Thenumberofdaysthetemperatureisaboveorbelowapredefinedthresholdisthencounted.2022YEARINREVIEW:CLIMATE-DRIVENGLOBALRENEWABLEENERGY43POTENTIALRESOURCESANDENERGYDEMANDPopulationdataProvidedbyCMCC:22•Spatialresolution:0.25°×0.25°latitude/longitude•Coverage:Global•Temporalresolution:Annual•Temporalperiod:1991–2020and2022BasedataUseHDDThold18andCDDhum21datasets(seeTable1):•Spatialresolution:0.25°×0.25°latitude/longitude•Units:Degreedays•Coverage:Global•Temporalresolution:Monthlyaverages•Temporalperiod:1991–2020and2022Workflow(1)Dataareonlymaskedwiththeland-seamask.(2)TheCDDandHDDareweightedbypopulation.(3)EDDvaluesareobtainedfromCDDandHDDusingtheformula:EDDh21Thodl18=CDDhum21+HDDThold18.(4)Anomaliesarecalculatedusingthesameformulaasabove.(5)DataareaggregatedbycountrytobecomparedtotheenergymixderivedfromthethreeREsources.22ThedataarederivedfromtheCenterforInternationalEarthScienceInformationNetwork(CIESIN),ColumbiaUniversity,2018,GriddedPopulationoftheWorld,Version4andGHSpopulationgridfromtheJointResearchCentre(IEA/CMCC,2023).Dataareinterpolatedtoestimateyearlypopulationvaluesfrom2000to2023.

1、当您付费下载文档后,您只拥有了使用权限,并不意味着购买了版权,文档只能用于自身使用,不得用于其他商业用途(如 [转卖]进行直接盈利或[编辑后售卖]进行间接盈利)。
2、本站所有内容均由合作方或网友上传,本站不对文档的完整性、权威性及其观点立场正确性做任何保证或承诺!文档内容仅供研究参考,付费前请自行鉴别。
3、如文档内容存在违规,或者侵犯商业秘密、侵犯著作权等,请点击“违规举报”。

碎片内容

碳中和
已认证
内容提供者

碳中和

确认删除?
回到顶部
微信客服
  • 管理员微信
QQ客服
  • QQ客服点击这里给我发消息
客服邮箱