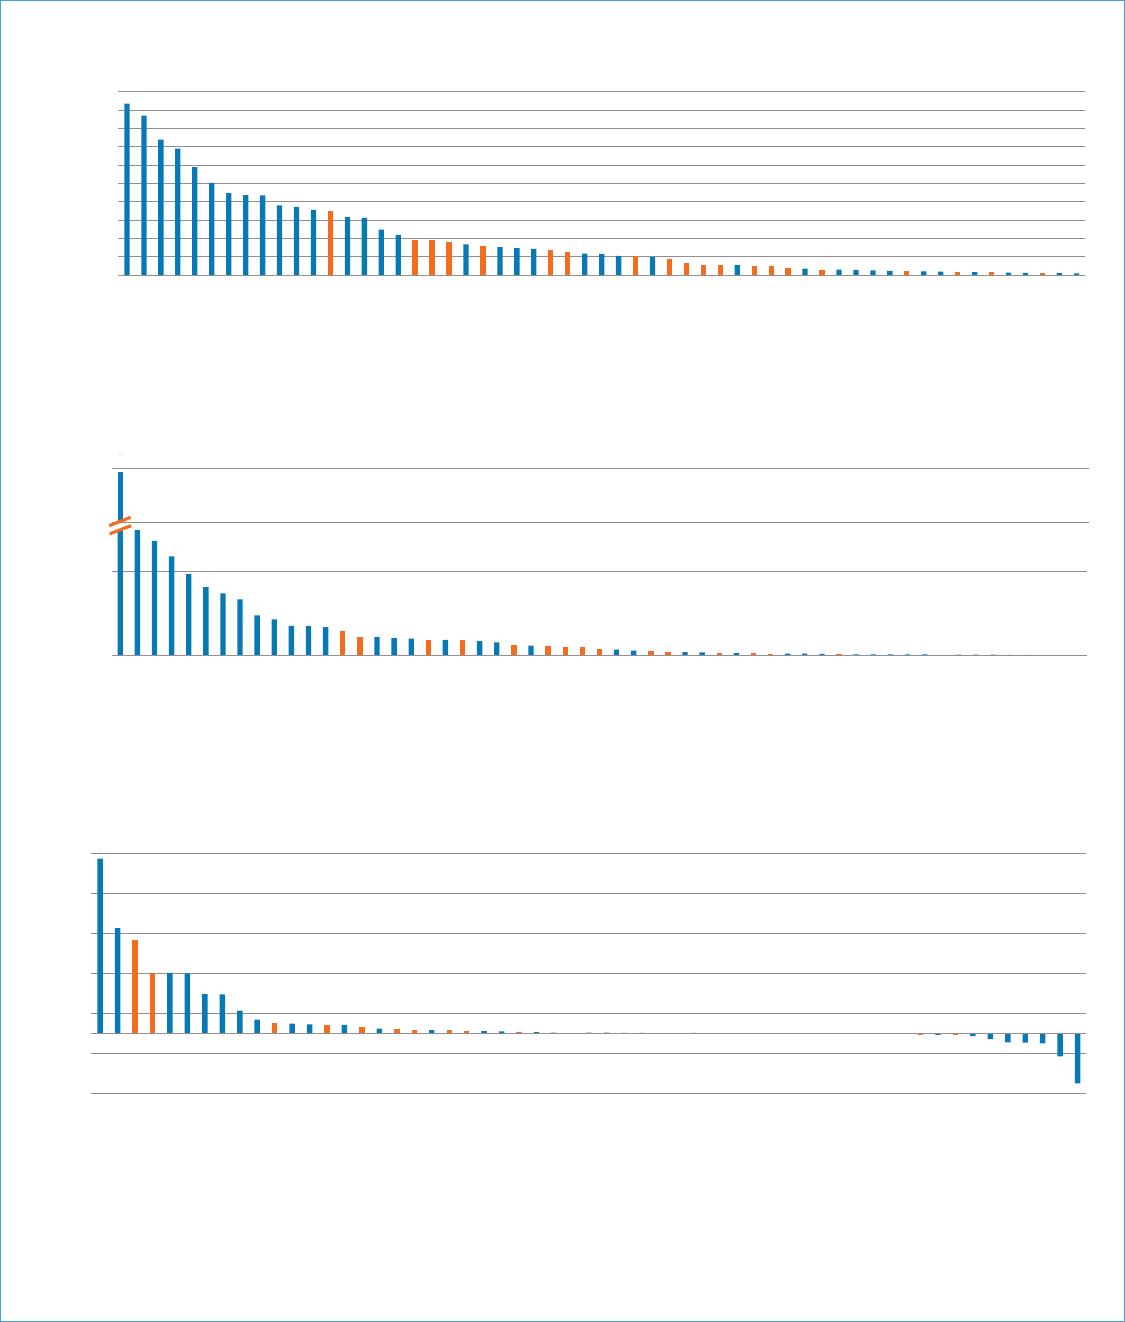
NO.276ADBBRIEFSNOVEMBER2023KEYPOINTSEuropeanUnionCarbonBorderAdjustmentMechanism:Economic•QuantitativeanalysesImpactandImplicationsforAsiasuggestthatthevalueoftheCarbonBorderAdjustmentCyn-YoungParkYuyaYamamotoMechanism(CBAM)inDirector,RegionalCooperationTradeSpecialist,RegionalCooperationtermsofmitigatingclimateandIntegrationandTradeDivisionandIntegrationandTradeDivisionchangeismarginal.However,ClimateChangeandSustainableCCSDitsimpactsontradepatterns,DevelopmentDepartment(CCSD)ADBcompetitiveness,andincomeAsianDevelopmentBank(ADB)distributionarefarfromMariaAnneLorraineDoongnegligible,especiallyforConsultant,RegionalCooperationdevelopingeconomies.andIntegrationandTradeDivisionCCSD•TheoveralleconomicimpactADBoftheCBAMseemstobelimitedforAsianeconomies,OVERVIEWbutsomeeconomiesfacesignificantcostincreasesatTheEuropeanUnion(EU)aimstobecomethefirstclimate-neutraleconomicblocthesectorlevel,suchasIndiaby2050,throughtheEUGreenDeal.In2021,theEUstrengthenedthiscommitmentintheironandsteelsector,byadoptingthe“Fitfor55”package,whichupholdsaninterimtargetofreducingnetGeorgiainfertilizer,andgreenhousegasemissionsbyatleast55%by2030froma1990baseline.ThisambitionKazakhstaninaluminum.posesanincreasedriskofcarbonleakage—wherecarbon-intensiveindustriesshiftproductiontoeconomieswithlessstringentenvironmentalregulations.•TheCBAMpresentsanopportunityforAsianToaddresspotentialcarbonleakage,theEUGreenDealincludestheCarbonBordereconomiestofocusonAdjustmentMechanism(CBAM),whichimposesacarbontariffoncarbon-intensivedevelopingtheircarbonproductssuchasironandsteel,cement,fertilizers,aluminum,electricity,andhydrogen.markets,whiletacklingTheseitemswereselectedbecausetheyarehighlysusceptibletocarbonleakageandshortfallsininvestmentscreatesignificantcarbonemissionsthatneverthelesscanbetracked(Simões2023).requiredtodeveloprenewableenergysources.TheEuropeanCommissionconsidersCBAMa“landmarktool”forputtingafairpriceoncarbonemissionsgeneratedduringtheproductionofidentifiedgoods(European•CBAM-affectedeconomiesCommissionn.d.).TheCBAMimposesacarbonpriceonimportsofemissions-intensiveandcouldconsiderrespondingbytrade-exposed(EITE)goodstoensuretheyhaveasimilarcarbonpricetodomesticproducts.upgradingthevalueaddedItalsoaimstopreventcarbonleakage.CBAMpreventscarbonleakageby“subjectingtheoftheirexportstoavoidthecarbontariff.Note:Inthispublication,“$”referstoUnitedStatesdollars.•Diversificationofexportmarkets,increasingtheproductivecapacityofnon-CBAMsectors,andbuildingstatisticalcapacitiesmayhelpmitigatetheriskexposuretoCBAMintheshortterm.ISBN978-92-9270-487-2(print)ISBN978-92-9270-488-9(electronic)ISSN2071-7202(print)ISSN2218-2675(electronic)PublicationStockNo.BRF230561-2DOI:http://dx.doi.org/10.22617/BRF230561-2ADBBRIEFSNO.276importofcertaingroupsofproductsfromthirdeconomies(non-EUembodiedcarbonpaymentperdollarofexporttotheEUandnon-EFTA)toacarbonlevylinkedtothecarbonpricepayable(theexporter’semissionintensitymultipliedbya$100pertonundertheEUEmissionsTradingSystem(ETS),supposingifthesamecarbonprice).EconomieswithahighscoreontheCBAMexposuregoodswereproducedwithintheEU,”accordingtoDeloitte(2023).indexarelikelytobemoreaffectedthaneconomieswithalowscore.Canada,theUnitedStates,andtheUnitedKingdomarealsoexploringmechanismsforbordercarbonadjustment.TheWorldBankhasalsocreatedarelativeexposureindex.ThisiscalculatedbymultiplyingthesameexportsharebythedifferenceTheCBAMregulationenteredintoforcethedayafteritsbetweentheexporter’semissionintensityandtheEUaveragepublicationintheEU’sOfficialJournalon16May2023.TheEUemissionintensityfortheCBAMproduct,scaledbytheassumedplanstoimplementtheCBAMintwostages.First,thetransitionalCBAMpriceof$100pertonofcarbon(WorldBank2023).phasestartedon1October2023.Duringthisstage,importersofApositiverelativeexposureindexindicatesthataneconomyhasCBAMgoodsarerequiredtosubmitquarterlyreportsindicating:highercarbon-emissionintensitythantheEUaverage,andso(i)quantitiesofCBAMgoodsimportedduringthequarter,willlikelyhavehighercostsunderCBAM.Ontheotherhand,aspecifiedpereconomyoforiginperproductionsite;(ii)embeddednegativerelativeexposureindexshowsthataneconomyhaslowerdirectand,ifapplicable,indirectgreenhousegasemissions;andemissionintensitythantheEUaverage.Forexample,ifGeorgiahas(iii)thecarbonpricedueintheeconomyoforigin,ifapplicable.anaggregaterelativeCBAMexposureindexscoreof0.0464,thentheadditionalcostwillbe$4.64pertonofcarbondioxide(CO2)InthesecondstageoftheCBAM,from1January2026,thefullemitted.TheindexalsoincludestheaggregateCBAMexposureindexscopeofregulationwilltakeeffect,withpriceadjustmentsonwhichresultsfrommultiplyingtheexportsofallcoveredsectorsofimportedproducts.Importerswillneedto:(i)obtainauthorizationtheproductstotheEUbythesumofthetotalembodiedcarbontoimportCBAMgoods,(ii)declarethequantityofCBAMgoodspayments(theassumedpricemultipliedbytheexporter’semissionimportedintotheEUintheprecedingyearalongwiththeirintensityofallcoveredsectorsoftheproduct),dividedbythesumofembeddedgreenhousegasemissions,and(iii)surrenderCBAMtheeconomy’stotalvalueofexportsofCBAMproductstotheworld.certificatestocoverthedeclaredemissions(Deloitte2023).AsianExposurebyEconomyTheCBAMwillbephasedinalongsidethephasingoutoffreeallowancesundertherevisedETS.ThemechanismwillinitiallyFigure1ashowsthat,amongtheaccountedeconomies,ADB’sregionalincludesixselectedindustries:cement,aluminum,fertilizers,membersarenotamongthetopCBAMproductexporterstotheelectricity,ironandsteel,andhydrogen,inadditiontosomeEUasashareoftheirtotalCBAM-affectedproductsexportedtoprecursorsandafewdownstreamproducts.Undercertaintheworld.ExportersofCBAMproductstotheEUaredominatedbyconditions,indirectemissionswillbeincluded.economiesinAfrica,theMiddleEast,andEurope.Asianeconomiesarepredominantlyatthemiddletothetailendofthegraph,ledbyASIA’SEXPOSURETOTHECBAMGeorgiawith34.80%,Cambodiawith19.18%,andIndiawith18.92%.TheintroductionoftheCBAMhassignificanteconomicimplicationsFigure1bpresentstheexportsofCBAM-affectedproductstofortradeandinvestment,especiallyindevelopingeconomies.AtheEUasapercentageofthegrossdomesticproduct(GDP)ofUnitedNationsConferenceonTradeandDevelopment(UNCTAD57economies.EconomiesinAfricashowahighshareofCBAM2021)studyfoundthattheCBAMcouldaltertradepatternsinproductsintheirGDP,withMozambique(6.9%)asthetopexporter.favorofeconomieswithrelativelycarbon-efficientproductionTheexportsofCBAMproductsarenotveryeconomicallysignificantandsuppressexportsfromdevelopingeconomieswithcarbon-evenforthelargestregionalexportersuchasGeorgia(0.3%).intensiveindustries.EconomieswithEITEproductsasalargeshareofexportswillbeparticularlyexposed.Also,risksinadaptingtotheGeorgiahasthehighestaggregaterelativeCBAMexposureindex,CBAMwouldincreaseineconomiesreliantontheEUasanexportwithascoreof0.0464.Indiacomesnextwith0.0303,followedbymarketandineconomieslackingthecapacitytotrackandreportKazakhstanwith0.0051,VietNamat0.0043,andHongKong,Chinaproduction-relatedcarbonemissions.Economiesthatstruggletoat0.0033,asinFigure1c.ThissuggestsadditionalcostsfromCBAMadjusttoalow-carbonparadigmmayalsobeathigherriskofimpact.implementationwillbe$4.64pertonofCO2emissionsforGeorgiaand$3.03forIndia.FormostAsianeconomies,theadditionalcostsRiskscanbetrackedbasedontheexposureandvulnerabilityofarelessthan$1pertonofCO2emissions.economiestotheCBAM.TheWorldBankhasdevelopedtheCBAMExposureIndextohelpeconomiesmakepolicydecisions.AsianExposurebySectorTheindexgaugesthepotentialforCBAMtoimpactexportsofcarbon-intensivegoodsforthesixselectedindustries.ItisWhileAsia’soverallexposuretotheCBAMseemslimited,calculatedbymultiplyingtheexportshareofeacheconomybythetheimpactcouldbesignificantforcertainsectorsandforsomeeconomies.Theregion’ssectorexposuresareshowninFigures2to5.1DatashowstheexportsofCBAMproducts.21TheWorldBankdatabasedoesnothavedataonallADBregionalmembers.Presenteddataareonlythoseavailable.2Ironandsteel;fertilizer;cement;andaluminum;nodataonhydrogen;nodataonADB’sregionalmembersforelectricity.2EuropeanUnionCarbonBorderAdjustmentMechanism:EconomicImpactandImplicationsforAsiaZimbabweMozambiqueCameroonUkraineUkraineZimbabweFigure1:CBAMExposureofSelectedEconomiesGeorgiaBelarusMozambiquea.CBAMProductsExportstotheEU(%oftotalCBAMproductsexportstoworld)IndiaBahrainUnitedKingdomBelarus.TrinidadandTobagoAlbania.TrinidadandTobagoTürkiyeBelarus.Egypt,ArabRep.AlbaniaVenezuela.Türkiye.RussianFederationRussianFederationTunisia.VenezuelaTunisiaEgypt,ArabRep..Ukraine.SouthAfricaZimbabweGhana.KazakhstanEgypt,ArabRep.Georgia.UnitedArabEmiratesRussianFederation.TürkiyeIran,IslamicRep.MoroccoIsraelb.CBAMProductsExporttotheEU(%ofGDP)GeorgiaJordanVietNam.TunisiaTaipei,ChinaChile.CameroonCambodiaHongKong,China.BrazilSouthAfricaIndia.PRCUnitedKingdomTajikistanRepublicofKoreaSouthAfrica.IndonesiaAzerbaijanOmanJordanMoroccoc.AggregateRelativeCBAMExposureIndexKazakhstanUnitedArabEmiratesPakistanVenezuela.AzerbaijanBahrain.ArgentinaGhanaKazakhstan.VietNamTaipei,China.PeruTrinidadandTobago.MalaysiaOman-.SaudiArabiaMalaysiaBrazil-.ColombiaKuwaitIndiaRepublicofKoreaCBAM=CarbonBorderAdjustmentMechanism,EU=EuropeanUnion,GDP=grossdomesticproduct,PRC=People’sRepublicofChina.ThailandAzerbaijanUnitedStatesNote:TheWorldBank’sdatabasefortheCBAManalysisincludes57economies,20ofwhichareregionalmembersofADB.OrangebarsrepresentADB’sTajikistanregionalmembers.MexicoPRCSource:WorldBank2023.UnitedArabEmiratesChileIndonesiaBrazilVietNam3UnitedStatesPRCMalaysiaBahrainIndonesiaIran,IslamicRep.Iran,IslamicRep.HongKong,ChinaRepublicofKoreaIsraelNewZealandPhilippinesThailandThailandCanadaMozambiqueCambodiaKuwaitNewZealandNewZealandSriLankaSaudiArabiaCanadaQatarOmanSingaporeMauritiusCanadaTajikistanJapanSaudiArabiaCostaRicaColombiaArgentinaAustraliaSenegalMexicoJapanQatarArgentinaMexicoCameroonUnitedStatesMauritiusHongKong,ChinaPhilippinesGhanaAustraliaAustraliaJapanSingaporePakistanSriLankaCostaRicaSenegalPakistanPeruTaipei,ChinaKuwaitSenegalMauritiusSriLankaSingaporeCambodiaPeruCostaRicaUnitedKingdomPhilippinesMoroccoQatarChileIsraelJordanColombiaAlbaniaADBBRIEFSNO.276Figure2:AsianCBAMExposure—IronandSteela.ExportsofironandsteeltoEU(%oftotalironandsteelexportstotheworld)...........ZimbabweSwitzerlandNorwayUnitedKingdomTunisiaAlbaniaVenezuelaBelarusTürkiyeEgypt,ArabRep.UkraineCambodiaRussianFederationIndiaSenegalIsraelMozambiqueKuwaitSouthAfricaTaipei,ChinaBrazilMoroccoUnitedStatesRepublicofKoreaGeorgiaPRCIndonesiaIran,IslamicRep.VietNamNewZealandMalaysiaAustraliaThailandHongKong,ChinaKazakhstanUnitedArabEmiratesOmanArgentinaAzerbaijanTrinidadandTobagoSriLankaJapanMexicoCostaRicaSaudiArabiaPeruCanadaBahrainChilePhilippinesSingaporePakistanQatarColombiab.RelativeCBAMExposureIndex.Zimbabwe.Ukraine.India.Albania.Egypt,ArabRep.-Venezuela(.)RussianFederationSouthAfricaMozambiqueGeorgiaKazakhstanBelarusTunisiaHongKong,ChinaVietNamIran,IslamicRep.TürkiyeAzerbaijanPRCOmanTrinidadandTobagoBrazilIndonesiaArgentinaKuwaitPeruUnitedArabEmiratesBahrainNewZealandThailandPakistanUnitedStatesMalaysiaMexicoCanadaSaudiArabiaRepublicofKoreaPhilippinesSingaporeColombiaCostaRicaAustraliaQatarChileJapanSriLankaIsraelTaipei,ChinaCambodiaSenegalMoroccoUnitedKingdomCBAM=CarbonBorderAdjustmentMechanism,EU=EuropeanUnion,PRC=People’sRepublicofChina.Note:OrangebarsrepresentADB’sregionalmembers.Source:WorldBank2023.CambodialeadsinexportsofironandsteeltotheEU,whichmarksHongKong,Chinaat0.0055,andVietNamat0.0054.Indiafaces34.25%ofitstotalironandsteelexports.ThisisfollowedbyIndiathehighestadditionalcostfromCBAMimplementationinironwith23.55%;Taipei,Chinawith13.22%;theRepublicofKoreawithandsteel,butit’sstill$4.36pertonofCO2emissions.Forother10.66%;Georgiawith9.43%;andthePeople’sRepublicofChinaAsianeconomies,theadditionalcostislessthan$1pertonof(PRC)with8.76%.CO2emissions.ADB’sregionalmembersscoregenerallylowinrelativeCBAMGeorgiacomesouttopinfertilizerexportstotheEU,whichexposureindexes.Amongthem,Indiahasthehighestscore,atconstituteasignificant59.47%ofitstotalfertilizerexports.0.0436,followedbyGeorgiaat0.0097,Kazakhstanat0.0078,Azerbaijanisclosebehind(58.65%);thenJapanwith2.08%;4EuropeanUnionCarbonBorderAdjustmentMechanism:EconomicImpactandImplicationsforAsiaFigure3:AsianCBAMExposure—Fertilizera.ExportsoffertilizertoEU(%oftotalfertilizerexportstotheworld).........BelarusUnitedKingdomGeorgiaAzerbaijanIsraelTunisiaSwitzerlandUkraineTürkiyeEgypt,ArabRep.ChileJordanRussianFederationNorwayTrinidadandTobagoMoroccoMexicoUnitedStatesJapanIran,IslamicRep.ColombiaKazakhstanMauritiusIndiaPRCTaipei,ChinaVietNamCanadaSouthAfricaAustraliaOmanSaudiArabiaUnitedArabEmiratesb.RelativeCBAMExposureIndex.Ukraine.Georgia.Belarus.TrinidadandTobago.RussianFederationEgypt,ArabRep.-Azerbaijan(.)Iran,IslamicRep.(.)TürkiyeKazakhstanIndiaPRCOmanMexicoSouthAfricaVietNamTaipei,ChinaSaudiArabiaCanadaUnitedArabEmiratesAustraliaJapanMauritiusUnitedStatesColombiaMoroccoTunisiaJordanChileIsraelUnitedKingdomCBAM=CarbonBorderAdjustmentMechanism,EU=EuropeanUnion,PRC=People’sRepublicofChina.Note:OrangebarsrepresentADB’sregionalmembers.Source:WorldBank2023.Kazakhstanat1.31%;Indiawith1.12%;PRCwith1.07%;Taipei,ChinaMalaysiatakestheleadintermsofitsrelativeshareofcementwith0.80%;andVietNamat0.60%.exportstotheEU,makingup6.69%ofitstotalglobalcementexports.ThisisfollowedbyJapanwith1.68%,Pakistanwith1.67%,GeorgiaalsoclaimsthehighestrelativeCBAMexposureindex,thePRCwith1.08%,VietNamwith0.73%,andIndiawith0.61%.withascoreof0.0814,followedbyAzerbaijanat0.0102,Indiaat0.0010,Kazakhstanat0.0014,thePRCwith0.0007,andVietMalaysiaalsostandsoutintherelativeCBAMexposureindexwithNamat0.0002.Intermsoffertilizer,Georgiafacesthehighestthescoreof0.0256,followedbythePRCat0.0034,PakistanatadditionalcostfromCBAMimplementationat$8.14pertonof0.0033,VietNamat0.0026,andIndiaat0.0013.MalaysiafacesCO2emissions.5ADBBRIEFSNO.276Figure4:AsianCBAMExposure—Cementa.ExportsofcementtoEU(%oftotalcementexports)...........UkraineUnitedKingdomColombiaNorwayMoroccoSwitzerlandBelarusAlbaniaTunisiaTürkiyeMalaysiaEgypt,ArabRep.SaudiArabiaJapanPakistanUnitedStatesPRCVietNamIndiab.RelativeCBAMExposureIndex.Belarus.Ukraine.Malaysia.SaudiArabia.Tunisia..PRCPakistan-VietNam(.)(.)India(.)UnitedStatesJapanTürkiyeEgypt,ArabRep.UnitedKingdomAlbaniaMoroccoColombiaCBAM=CarbonBorderAdjustmentMechanism,EU=EuropeanUnion,PRC=People’sRepublicofChina.Note:OrangebarsrepresentADB’sregionalmembers.Source:WorldBank2023.thehighestadditionalcostfromCBAMimplementationat0.0028,Indiaat0.0024,andTajikistanat0.0023.Althoughthe$2.56pertonofCO2emissionsincement.PhilippinesrankedfourthamongtheAsianexporterstotheEU,itsrelativeCBAMexposurescorecomesoutlowest,at–0.0005,Inthealuminumsector,KazakhstanhasthehighestshareofexportstrailedbyHongKong,ChinaandtheRepublicofKoreawithtotheEU,at42.15%,followedbyAzerbaijanwith29.30%.Behind–0.0002.KazakhstanfacesthehighestadditionalcostfromCBAMthemarethePRCwith13.20%,thePhilippineswith9.28%,Indiawithimplementationinaluminumat$4.04pertonofCO2emissions.9.08%,theRepublicofKoreawith7.22%,andMalaysiawith6.55%.Overall,thetradeimpactoftheCBAMforAsianeconomiesKazakhstankeepsthetoppositionintherelativeCBAMindex,appearsmanageablegiventheregion’srelativelylowexposure.withascoreof0.0404,followedbyAzerbaijanat0.0073,PRCatHowever,certainsubregionsoreconomieswithstrongertrade6EuropeanUnionCarbonBorderAdjustmentMechanism:EconomicImpactandImplicationsforAsiaFigure5:AsianCBAMExposure—Aluminuma.ExportsofaluminumtoEU(%oftotalaluminumexportstotheworld)...........MozambiqueGhanaCameroonNorwayMoroccoSwitzerlandEgypt,ArabRep.UnitedKingdomTunisiaTürkiyeUkraineKazakhstanVenezuelaRussianFederationJordanAzerbaijanUnitedArabEmiratesSouthAfricaBahrainIsraelPRCBelarusUnitedStatesPhilippinesIndiaROKSaudiArabiaMalaysiaOmanHongKong,ChinaCanadaThailandTajikistanNewZealandVietNamJapanMexicoBrazilTaipei,ChinaIndonesiaArgentinaQatarSingaporeColombiaAustraliab.RelativeCBAMExposureIndex.Mozambique.Kazakhstan..Egypt,ArabRep..Venezuela.Cameroon.UkraineAzerbaijan-(.)SouthAfricaTunisiaSaudiArabiaBahrainOmanPRCRussianFederationUnitedArabEmiratesIndiaTajikistanBrazilIndonesiaTürkiyeIsraelNewZealandArgentinaCanadaUnitedStatesBelarusAustraliaMalaysiaSingaporeJapanVietNamMexicoTaipei,ChinaQatarColombiaThailandRepublicofKoreaHongKong,ChinaPhilippinesJordanMoroccoUnitedKingdomGhanaCBAM=CarbonBorderAdjustmentMechanism,EU=EuropeanUnion,PRC=People’sRepublicofChina,ROK=RepublicofKorea.Note:OrangebarsrepresentADB’sregionalmembers.Source:WorldBank2023.tieswithEuropewillbemoreaffected.SomeAsianeconomiesarewiththehighestCBAMexposureindexscoresamongidentifiedmoreexposedinthattheytrademorecarbon-intensivegoodswithsectors,withironandsteelasitsmostexposedsector.MorethantheEU(suchasCentralAsia,duemostlytosignificantexportsofhalfofGeorgian(59.47%)andAzerbaijan(58.65%)fertilizerexportsaluminumandfertilizer).SomeeconomieshaveahighshareofwenttotheEU.ThismakesGeorgiasubjecttoarelativelyhighscorecarbon-intensivesectorsintheireconomies,suchasforironandof0.08114andAzerbaijanascoreof0.0102onCBAMexposuresteeloraluminumexportstotheEU.indexforfertilizers.Foraluminum,42.15%ofKazakhstan’sexportsofthemetalwenttotheEU,makingitthemostexposedCBAMAsia’ssectorexposuretotheCBAMvariesamongeconomiesandaluminumexporter.Ontheotherhand,negativeCBAMexposurecouldbesignificantforsome.Forexample,Georgia’sfertilizerandscoreswererecordedforCambodiaandSriLankaforironandsteel,ironandsteelindustriesaresubstantiallyexposedandcontributedtoandforthePhilippinesandThailandforaluminum,meaningtheirtheoverallhighestexposure.IndiaalsobelongstothetopeconomiesemissionintensityislowerthantheEUaverage.7ADBBRIEFSNO.276Inaddition,Asia’sindustrialstructuretendstobeskewedtowardForexample,SouthAfricawillbesubjecttoacarbonborderhigherCO2emissions,whichcouldmaketheregionmorelikelyinadjustmentlevyonitsexportswithahighercarboncontentthantobesubjectedtotheCBAMinthefuture.TherearealsoissuesoftheEUproduction.Asithasahighcarbonintensityof7,801.33tonsthecapacitytotraceandtradeCO2emissions.Someeconomiesper$1millionworthofbasemetalproduction,thelevycanbe(suchasinthePacificandSouthAsia)maystruggletoadapttoestimatedbymultiplyingthecarbonintensitywiththecarbonpriceCBAMimplementationduetotheabsenceofcarbonemission-differencebetweentheEUandSouthAfrica.UsingtheEUcarbonreducingmechanismsandlowstatisticalcapacitytomeasureandpriceof$96.30,SouthAfricafacesthehighestrateoflevyat68.16%reportemissions.ofitsbasicmetalexports,followedbyIndiaat38.80%,theRussianFederationat32.90%,andVietNamat22.05%oftheirrespectiveECONOMICIMPACTSbasemetalexports.3Thesehighratesreflecttheirrelativelyhighcarbonintensitiesandlowdomesticcarbonprices.RepercussionsforEPRxCpo=rPtesopolef’sARDepBublRiceofgCiohinnaa.lRMesteomfthbeeWrosrldindicateseconomieswhichdonothavedataontheircarbonCBAMiiPnn-RttaeeCnnffss=eiittyycPtaaeennodddplepdd’oorsommRdeeeusspttciiuccbtscclicaahrrobbafoovnnCehpptinrroiiaccee.re..RgeTTisoosttttoehhfreetmmwhe,,itttWhhheeorppldeenninaadllttiyycarrtaaettseeeocfotnhoemleieasstwehfifcichiednotEnoUth1a0v%eidsaatappolniedtheaisrccaarrbboonnEUimportersofoftheleastefficientEU10%isappliedascarbontheirnationalauthoritiiPeiiNnnnRstotteeeCt(nennts:ss=hiiiOtttyryyPro..aaeunnogdgpelhedb’osaamrRmseersepetiupccbrhecliascaenrobnifotsnCAmDhpiBnraiac’kse.irn.RegetTisootnttoahhfleetmmhee,mtWhbeoerrplsde.ninadltiycartaetseeocfotnhoemleiFeasisgtwuehfrifciechie6dnot:EnToUhth1ea0v%EesidstaiatmappoalnietdethdeaisrCccaaarrbbroobnnonBorderETS)anddiscloseemisiSSNnstoooieouutnerrnscc:ieesOty::fr.OOaronEEgmCCeDDbCa((nnBrs..ddAr..e))M;;pWWrepoosrrrelloddntdBBAuaaDnncBkkt’s((s22,r00ien22g33ilo))i;;nnaaaennlddwmAAeitmDDhBBbeccraasll.ccuullaattiioonnss..AdjustmentLevyin%ofExportstotheEUcertificationNs.oTteh:OerdanagteabmarussretpbreesesnutbAmDBit’steredgbioyna3l1mMemabyers.exporters’SFoourrceex:aOmECpDle(,nS.do.)u;WthoArldfrBicaankw(2il0l2b3e);saundbjAeDcBttcoalcaulcaatiorbnso.nborderadjustimnetnhteleBvyaosnicitMseextpaolrstsInwdituhstryofthefollowingyearafhFteiogrrhteehxreaccmaerprbtleoif,nicSacootuinotthne.nAItmfrtihcpaaonrwtteihlrlesbfEeaUcseupbarjoedcutctotioanc.aArsboitnhbaosrdaehriagdhjucsatrmboenntinletevynsoitnyiotsfe7x8p0o1r.t3s3wtoitnhpenaltyrateofapplyingFhpoietghrrhe$ee1xaravmcmeairlpralbilogeone,nSwccaooorurbntthtohenoAnftifnbrtithaceaasnenwsmitithllyeebtoaeEflUtsphuroepbdrj1eou0cdc%tutitcootnioa,nthc.aeArlsbeovitnyhcbaaosnrdabeehrieagsdhtjiumcsaatrmtbeeodnnbtiynletmveynuslotiintpyliytosinfge7x8thp0eo1r.ct3sa3rwbtioothnnoftheEU’sleastefficiehipnnietgterhpn$erso1ridtcmyuaiwcrllbieiotorhnsntwihfcoeoernxcthptaeoronbrfttobetnharaspsneraicrmteeheeudtnaiEfaflUebprrlepeonrdtocuoedcutbicoetnitow,nteh.eeAnslethivteyhEcaaUsnaabneh.diegSshoticmuatahrbtAeodfnribcinyat.meUnussltiiintpyglyotihfneg78tEh0Ue1.cc3aa3rrbbtooonnnsupplycarbonintensityppinefrtirecg$enu1sroeitmfsy.$iwlE9lioiU6thn.3imtw0h,oeprSotchoratuorebtfhrosbAnawfsprieilrclicamelsefaodtacifbelfeepsrrretoehndqecuuechitribigeoehdntew,stehteernaltetehveyofcElaeUnvaybneadteS6st8oim.u1ta6ht%eAdforbifcyaitsm.UbusaltiisnpigclyitmnhgeettEahlUeeccxaaprrobbrootsnn,ppipffneoorrtrilliecllmcooenewwistooeeistffydds$$twbb9a9yyi6r6tth.II.i3nn3nt0dd0hg3,ii,eaaiSnScaaooa2ttuur033btthh288o..6AnA88f00(fprra%%iirccicsaa,,yeRRfsfaadtuucecissfemfessessiiraatetthhhnaaaeecttte33hh22ibigg..e99hht00eew%%ssett,,erraanaannttteeddheooVVffEiieelleUettvvNNayyaanaammdttS6ao8tu.21t2h6.%0A5fr%oicfaoit.sfUtbhsaeinsirigcretmhsepeetEacUltievcxeapbrobarotssne,tobuycarbonimport6a8t.2126.%05o%fiotsftbhaesiricremspeetacltievxepboartsse,againissimilartotheEfmmcToalSeelro)ttbaaw.oTlleneehdxxpeppbriCooycrreBIttnsssAd...3MiaTThhaaeetcss3tsee8a.hh8sii0gga%hht,arraaRxttubeesssassrrieeeadffalleeotccn3tt2tthh.9ee0iirr%rree,llaaanttiidvveeVllyyiehhtNiiggahhmccaaa.rrtbb2oo2nn.0iinn5tt%eennossiifttiiteehsseiaarnnreddsllpooewwctddivooemmbeeasssttiieccthecarboncontentofmicmaeprtbaoolrnteexpdpriogcroetsso..d3sTahnedsethheigphrircaetedsifrfeefrleenctcetheirrelativelyhighcarbo.ninte.nsitiesandlowdomesticbetweencarboninthecTEahUrebaoCnBdpArtMihcewsei.lxlplikoertlyinigmepcaocntgolmobya,wltrhaedreepaatternsforaffectedindustri.es.S.omeEUimportersmaycarbonpriceisoftennosTneheeekxCismBteoAnrMet.cwIotimlalilpmikeestilttyiovimecrpeeaxapcttoegrftleaoribrsacgloitvrnaeddniettiohpenastctehrannsgfeorinafpfericcteesdoinfdeuxsptoriretesd.Sgoomo.desE..OUt.ihme.prsorm.tearsyms.haifytforEUexportersandpTrtshoehedeeiurkCcsmBeuorApsrpMealinecwrdosilmlttolopikepientrlisyetiivvdimeeenpetthax“ecpctoEagrrUtlbeo.robsWanglhlteirivlaaeedkntaehtgehpeeaC.”tctBehAranMnsgwfeoirlilnahfpafervicceteeasdgoinlfodebuxaspltoirmiretpesa.dcSgtoobmoydedsEe.sUOigtihnme,prthosermtesarc.syamlsehaoiyf.ft.....GiventhegapinprevaistilthiesneegiskrepsmniullovopirvpreoelirecnormesmfefteponcetitntasistliivradeeregoeutuhxlnapedtoiEorttUhnee.rbsWewgthiowvilreeeldnethntisheeClecBshAsaMnugnwedieilnlrhspatrovicoeedas.gTolfhoeebxapflooilmlrotepwdaincggtoboaydndsae.lysOsigtehnse,rtashsemsseacsyasslehthiofetf.theEUanddevelopingtiissthtessppeciillisosllroopnpsvviioulleellopmorrvpveeieeleiffreffrseer,eccsetftthfftssfeoeeaaccritennntsssddisiadaiiddareroeeoctunnuhonttneiindffdyycEetcctUhhroone.euuWtnnwwhtthrroaoiiieelrtrellssdtdhtiihnneiisesttEhhCllUeeeeBssrrAsseeMgguuiioonnwnnddielemmlrrhssooattssoovttooellddiikka..eegTTllyylhhotteebooafbbflooeeilmlllooiimmpwwappiincnaagtgccbttaeeyanddnda..aellysysisgeenss,tahsessecsaslethoefassesstheSouthAfricaIndiaRussianFederationVietNamTaipei,ChinaPRCKazakhstanBrazilThailandRestoftheWorldRepublicofKoreaTürkiyeUkraineIndonesiaTunisiaColombiaMalaysiaArgentinaAustraliaJapantransferspollutant-intesCnp.si2lil.voQeveuprareonfdtfietuaccttitsvioeannAdtnoaidelyecsnoetnisfyoomcfoEieucsnotwnrioeitmshiilncaxItmheerparecgtsioonnmDoMstClisk:eLlyitetorabtuereimRpeavciteewd.environmentalregulatiCon.2s.,tQhuuasnctirteaatitviengAcnarlybsoensleoafkEacgoen.oBmyictaIxminpgactsonDMCs:LiteratureReviewthecarbon-intensivegCoRRo.ee2dcc.eesQnnautttatssnhttuuteitddabiieetoivssredaaeAddrn,ooatpphlttyeesddeEsUqqouuifnaaEnndttcuiittocaanettiiosvvmeenoicmmnIee-mEaapUssauucrreetsssottnooDeeMxxaaCmms:iinnLeeitetthhraeetueereccooRnneoovmmieiiccwaannddeennvviirroonnmmeennttaallproducerstoadoptmoRciirmmaeepprcsbaaetorccnnittntoolgesffetabbunkoodtarrieddegneeserrvsaiccrbdaaoyorrnbbpbmooteenntedwnaaeddtqaejjuuulnassre5nttmmg%tiuteealnnaatittnvt((ideoBBn1CCm5sAA,%e))a...sTTBuhhCreeeAssseestsswohhoooeuwwxldattmhhbaaeinttmeaaobbtshooterrddeeefefrriccaaoieddnnjjouutmssattinmmcdeeaennnfttfdtteaacxxetinccvvooeiuurwollddnemrrreeeeddtnuuhtcceaeeylimprovingtheEUproditcumoacprcebaorocsvn’temorlefaaabrlkolkarsedgeteeccrtsoocbmrasyrpbabeonetndtitwaiivendeecjunlnusedt5sme%seaenanxtnpd(doBgr1Cat5iArn%e)ib.n.TagBtheCesAse(sBswrhaoonuwgldetrhbaaetnmadboQosutrdiereifofrincaied2nj0ut1sa4tmn).deHneotfftweacextvicveoeru,wlcdeorrneecdetuhrceneyspublicbackingforcarbchtooaanrvcbpeoorvniceblireenaaeglkn.laAsgemtehcsaototnbrgsyaibatsenBtdcwCoieAnnecsnleucq5dou%eueldenaxcnpuedonsr1,fta5trhi%releyb.aBtieCmsAp(saBcwrtaonudAgledDevrBbeae=lonAmpdsiionaQsgntuDeicrefiofoviceunlinoe2tpnr0mite1aes4nn’)td.BeHexafonpfewko,creEttvsiUvee=ra,wEncuedorronepctrteehaarednnyesUnion,CBAMmightalsopromtchopoamctvoeEpvUeebtritetriavealendlnsineetgshcstapotabrsretacnaaneuBrdssCeitnAodcleiumcvdoepeulooledpsxeinpuagonrtcftaaorxiuerlnbytariteiemsspt(eaBncrtdantdoOgeeElavrCecaDklon=cpdaiOnQrgbrguoainnrciioospanurtinci2otir0nnieg1fos4mr’)E.eceHcoxhonpawoonmeritsviscmeCrs,aonca-oodnpndectrheraaartndivoseenandDevelopment,oncarbonemissions—hcdwaoifhvfmeeprreeenbttitethiiaevelnerrneeestvhspeasontnbuseeaicbwailBuiotisCueelsAddfogecrovometuloioltdipngiaanuttgininocfganoiaeurlmnytirsiiesmsioptnaescnt(dLtodoPweRlvaeCec2=lko0Ppc2eia1nor;pgbUloe’NnscoRCpuerTpniAcutirDnbielgi2csm0’o2fee1Ccx)hh.piaTnonahr.itessmtrsaandadendetfhrfeaacdvteesgovernments,nottheEcodUofifmf.tehpreeentCittiiBavAlernMeesspwsoilbnlesdicebapiluietsineedsdfooenrvemeloxitpiisgitnaingtigncgotrueanmdterisiespsiaottnetesnrd(nLstoo,wtlahece2k0cc2aa1rrb;boUonnNiCpnrtTiecAninDsgit2ym0o2ef1c)hp.arTonhdiseumctrtsaiodanendaemfhfeaocvntegsddoiifffffteehrreeennCttiBaclAorueMnsptwroieilnlss,dibeaipnlietdientsdhefoonrcmaeribxtiiogsnatintpingogltirceaimedseisospifoaEnttUser(ntLrsoaN,wdtoiehnteeg2s0:cp2aa1rrb;tnoUenNrsCin.TtQeAnuDsain2tyt0it2oa1fti)vp.erTohadenuactrltayiosdniesaesmfhfeoocwntsgsNevertheless,thecarbootdhfnifaftetharaeeribnCffotBmrcdAoeaMuyrncitwnaricirelblrseod,aneaspaneeddtnjhutdhesetocmnoceasentrxbtoitosfantxeinxpcgpoaoltnircractiederesedaoptefaEtateUdrvntersra,s1d.etih�RndeegissctptaroairbfrbttuhnoteeinorWnsina.otlrQelednufsfianeitndcyittcistoaatfftoeipvsrerecocoadoununnoactmtlryiioeisensissstahsumahbtoojdewnocgstnothavedataontheirgoods.Figure6illustrattdtttheoohifasafttetthhtrahaeeeebnbmmoetoeerscrddtaaoieessmurruunacrrcteeatraierer((bsbsBBoof,rronnaaarnnanatggdddheejjeuutrrhsscaaettamnnmrcddebeanonQQrbttnuutotaiiabnrrxiixooopcrcnndoaa22lennic00rcic11err44ese))aaotaatefennEaddaUddeevvxxteeraararsccsdeeeeincorrddbbagfiiraastsbhpttttoeerraiinbblrrretuieeunatggtsteiioetoiiroo-nnsnennsa.afiaaftllQiyllceeiauiiefnnffnfaneeeedtncqqcEdtttuuisUsotaaamfftll1ooiii0ettvrryys%ectc((iocoiBBasuucnööananaphhrttplbrrrryiiilioenniseensggisdseepssarsrrusuichbeebceoajttj.eewrTaabccosllott..tnhienmte,ntshietyp.enaltyrateadjustmentlevyinperct22oe00nt11ht22ae))g..meeoafseuxrpeo(rBtsratnogtehreaEnUdiQnutihrieonba2s0i1c4)andexac2e.OrbraatnegerebgairosnreaplrienseeqntuAaDlitBy’s(Breöghiorninaglmeremetbaerls..metalindustry.2012).Sources:OECDn.d.;WorldBank2023;andADBcalculations.3Theratioiscalculatedas3Theratioiscalculatedas3�Theratioiscalculateda3sTheratioiscalculatedas×(−)(1),×(−)(1),×(−)whereEEidenotestheembeddedemissionsintheexportstotheEUin(t1h)e,basicmetalindustryfromcountryi,PEUdwehneoretesEEthiedceanrobtoenspthrieceeminbtheeddEeUdinem20is2s3io,nPsidinenthoetesexthpeorctsartbootnheprEicUeiinnctohuenbtraysiicinm20e2ta3l,iannddusEtrxyidfreonmotecsouthnetryexi,poPrEtsUwhereEEidenotestheewvdmaehlneuboreeetedtEosdEttehhideedeecEmnaUoribtsfeorsosniomtpnhrcseicoieneumnitnthbrtyeehdeiedixnEepUtdoheirentmsb2ati0sos2sic3itoh,mnePseiEdtinaUelntiihnonedtetuehssxettprhbyoe.arctsBsaicertbocmaotunehstepaerEliciUnediinnusctthoreuynbftrraoysmiicinem2ce0ot2na3ol,imnadnyudis,EtPrxyEiUdfredonemontoceotseutshnettrhyeexi,pcPoarEtbUsonpriceintheEUin2023,PidenotesthecadvreabnlouoneteptsorittchheeicEnaUrebcforoonnmpormcicoeyuininitnrtyh2ei0iEn2Ut3h,ienabn2a0ds2Ei3cx,imPdeiedtnaeolnitonetdesustshtthreye.ecxBaperobcroatnusspveraiclueeintocotuhnetrEyUiinfro20m23e,caonndoEmxyidieinottheesbthaesiecxmpoertsalindustry.BecausevaluetotheEUfromcountr==yiinth××ebasicmetalindustry.ℎℎBecause,,(1)canbesimplifiedas=×ℎ,(1)canbesimplifiedas(1)canbesimplifiedas(1)canbesimplifiedasℎ×(−).ℎ×(−).ThecalculationusedtWhbTTeoyhhrleetalhdtcceeBaasWllacctnuuoallkvraal,adttCiiioolBaannabruubnlesskoee,ndddCaPatthhrarieebc(oicllnaanagttreePbDssrottiacnaasinvvhigaanbiitDlloaaeabbnrsllseedhit)bddy.oaaiattnℎaard2(()cc0.aa1rr8bboobnnyiiOnnttreegnnassniittiyysaiinntio2200n11f88orbbyyEcOOoEEnCCoDDmssi×cttaa(Cttiiosstt-iicco−sspaaennra)dd.ticcoaanrrbbaoonnndppDrriicceeevsseliionnp22m0022e33ntstatisticsandcarbonpricesin2023bytheTbhyethcealWcuolarltdioBnaunske,dCtahrebolantePsrticainvagilDabalsehdbaotaard(c).arbonintensityin2018byOECDstatisticsandcarbonpricesin20238bytheWorldBank,CarbonPricingDashboard).INTERNAL.ThisinformaonisaccessibletoADBManagementandstaff.ItmaybesharedoutsideADBwithappropriateIpNeTrmERisNsAioLn..ThisinformaonisaccessibletoADBManagementandstaff.ItmaybesharedoutsideADBwithappropriateIpNeTrEmRiNssAioL.nT.hisinformaonisaccessibletoADBManagementandstaff.ItmaybesharedoutsideADBwithappropriatepermission.EuropeanUnionCarbonBorderAdjustmentMechanism:EconomicImpactandImplicationsforAsiaTheCBAMwilllikelyimpactglobaltradepatternsforaffectedandanalyzedimpactssuchasonmacroeconomy,sectors,trade,industries.SomeEUimportersmayseekmorecompetitivesociety,andenvironment.4Themodelofferssixoptions.exportersgiventhechangeinpricesofexportedgoods.Forexample,option1assumesanimportcarbontax,calculatedbyOthersmayshifttheirsupplierstoinsidetheEU.WhiletheCBAMadefaultvaluereflectingEUaverage,withoutfreeallocationunderwillhaveaglobalimpactbydesign,thescaleofitsspillovereffectsEUETS.Amongtheothers,option4ispresentedhereasitisclosearoundtheworldislessunderstood.ThefollowinganalysesassesstotherealCBAM.Option4asksimporterstosurrenderCBAMthespillovereffectsandidentifyeconomiesintheregionmostcertificatesinaccordancewithembeddedemissionsinimports,likelytobeimpacted.allowsgradualphase-outoffreeallocationunderEUETS,andtargetsonlybasicmaterialsandbasicmaterialproducts.5QuantitativeAnalysesofEconomicImpactsonRegionalMembers:LiteratureReviewUnderoption4,themodelestimatesthemacroeconomicimpactsasisshowninTable1.EUGDPwillcontractby0.22%in2030Recentstudiesadoptedquantitativemeasurestoexaminethewiththedecreaseofconsumptionby0.56%,comparedwiththeeconomicandenvironmentalimpactsofbordercarbonadjustmentbaselinescenario.6IntermsofimpactsonEU’simports,CBAM(BCA).Theseshowthataborderadjustmenttaxcouldreducesectorswillseethedecreaseofimportsfrom4.41%(aluminum)tocarbonleakagesbybetween5%and15%.BCAswouldbemost26.41%(fertilizer)in2030.Onemployment,CBAMsectorsinEUefficientandeffectiveweretheytocoverallsectorsandincludeotherthancementwillincreaseemploymentby0.22%(ironandexportrebates(BrangerandQuirion2014).However,concernssteel)and2.59%(fertilizer)in2030.CarbonleakageiscalculatedhavebeenthataBCAcouldunfairlyimpactdevelopingeconomies’asthe“increase”inemissionsinnon-EUregionsinaspecificsectorexportsandtradecompetitivenessbecausedevelopingeconomiesdividedbythe“decrease”inemissionsinthesamesectorinthetendtolackcarbonpricingmechanismsandhavedifferentialEU.Therefore,asnon-EUregionsdecreaseemissions,thisratioresponsibilitiesformitigatingemissions(Lowe2021;UNCTAD2021).goesdowntoalargenegativevalue.TheresultshowsthatcarbonThetradeeffectsoftheCBAMwilldependonexistingtradepatterns,leakageinfertilizerwillbereducedsignificantlyin2030.thecarbonintensityofproductionamongdifferenteconomies,andthecarbonpoliciesofEUtradingpartners.QuantitativeanalysisUNCTAD(2021)studiesthepotentialeffectsoftheCBAMonCO2showsthataBCAtaxcancreateadversedistributionaleffectsforemissions,trade,income,andemploymentintheEuropeanUnioneconomiessubjecttothemeasure(BrangerandQuirion2014)andanditsmaintradingpartners,withparticularfocusondevelopingexacerbateregionalinequality(Böhringeretal.2012).economies.Usingageneralequilibriummodel,thestudyfirstsimulatesthebaselinescenariowithdomesticcarbonpricesfullyTheEuropeanCommissionpublishedanimpactassessmentimposedintheEU.Thenthestudyestimatestheadditionalimpactreporton14July2021.ThereportemployedaJRC-GEM-E3modeloftheCBAMunderEUcarbonpricingof$88perton.Table1:MacroeconomicImpactsoftheCBAMImpactonEUin2030MacroeconomyImportsEmploymentCarbonLeakagebyoption4(%change)(%change)(%change)(%change)-0.223-11.980.22-24(GDP)(IronandSteel)(IronandSteel)(IronandSteel)0.388-15.12-0.48+7(Investment)(Cement)(Cement)(Cement)-0.558-26.412.59-208(Consumption)(Fertilizer)(Fertilizer)(Fertilizer)-4.410.89-89(Aluminum)(Aluminum)(Aluminum)CBAM=CarbonBorderAdjustmentMechanism,EU=EuropeanUnion,GDP=grossdomesticproduct.Source:EuropeanCommission2021a.4TheJointResearchCentre(JRC)’sGEM-E3isarecursivedynamiccomputablegeneralequilibriummodel.Variablesaredeterminedsimultaneouslythroughtheinteractionsbetweeneconomy,energysystem,andtheenvironment.5Otheroptions:Option2requiresimporterstosurrenderCBAMcertificates,basedonadefaultvaluereflectingEUaverage,withoutfreeallocationunderEUETS.Option3operatesinthesamewayasoption2,exceptthewaytocalculatethenumberofCBAMcertificatetobesurrendered.Option3asksactualcarbonintensityofthethirdeconomyproducers,whileoption2referstoadefaultvalue.Option5basicallyfollowsoption3butitexpandsthescopetothefinalproducts.Option6isbeyondthebordercontrol.Itintroducesanexcisedutyondomesticproductsandimportedproducts.6ThebaselinereferstotheEUReferenceScenario2020(‘REF’),themainelementsofwhicharedepictedintheAnnexoftheimpactassessmentfortherevisionofEUETSDirective.Itassumesthecontinuationoffreeallocationofallowancestooperatorsofinstallationsfromsectorsandsubsectorsatasignificantriskofcarbonleakage.9ADBBRIEFSNO.276Theresults(Table2)suggestthattheCBAMwouldhelpreduceThePRC’schemicalexportscouldfallby1.4%.ChemicalexportsCO2emissionsby45millionmetrictons(MtCO2)insideandinSouthAsia(otherthanIndia)wereseenasdecreasingby0.9%,outsidetheEUanddecreasecarbonleakageby8.2%,from15.1%andby0.3%inEastAsia(otherthanJapanandthePRC).Forotherto6.9%.Thisreducedleakagerepresentslessthan0.2%ofglobalsectors,theimpactwasconsideredmoremodest.emissions.YettheCBAMhasparticularlynegativeeffectsontradeandincomefordevelopingeconomiesaschangesininternationalSeparately,He,Zhai,andMa(2022)conductedaquantitativetradepatternsfavoreconomieswithrelativelycarbon-efficientassessmentofCBAMimpactsusingadynamicCGEmodel.Table4production.TheCBAMisseenashavingthesameeffectasapresentseconomies/regionswhereGDPwillbemostnegativelyortariffincreaseondeepeningintra-EUtradeanddivertingtradepositivelyaffected.Theirfindingsshowedeconomiesthatrelyonfromcarbon-intensivetradingpartnerstoregionsthatareeithercarbon-intensiveexportstotheEUarebeingdisproportionatelymorecarbonefficientorexemptfromthemechanism.Therefore,impacted,butoverall,theimpactismodest.Forexample,onlyafewitsintroductionfavorsdevelopedeconomies,whichtendtohaveeconomieswithhighexportdependenceontheEUmarketsuchlesscarbon-intensiveproductionthandevelopingeconomies.astheRussianFederationandUkrainewouldseeadeclineoftheirEUdomesticcarbonpricingof$88pertonwillreduceglobalGDPin2030by0.2%.Theyaremajorexportersofironandsteel,realincomeby$104.5billion,mainlycausedbyincomelossofnonferrousmetal,electricity,andothercarbon-intensiveproductsto$111.0billioninEU.However,withtheintroductionoftheCBAM,theEU,whichwouldbehitdirectlybyCBAM.TheimpactofCBAMglobalrealincomefallsbyafurther$8.3billion,withdevelopingonthePRC’sGDPisnegative,butclosetozero,giventhatitsexportsregionsincurringhigherlosses.ofCBAMproductstotheEUamounttoonly0.4%ofitstotalexports.Table2:PotentialEffectsoftheCBAMonCO2UndertheCBAMscenario,selecteddevelopedeconomies(mainlyinEmissions,CarbonLeakage,andIncometheEU)wouldexperiencewelfaregainsamountingto$11billionwhiledevelopingeconomiesincurwelfarelossesamountingto$9billionImpactedAreasCO2EmissionsCarbonIncomecomparedwiththebaseline.WelfarelossesinthePRCandIndiaareEuropeanUnion(millionmetricLeakage($billion)between$1billionand$2billion.Formostdevelopingeconomies,Othereconomies(%change)welfarelosseswillbebelow$1billion.AssociationofSoutheastTotaltons)5.929AsianNations(ASEAN)wouldincur$500millioninwelfarelosses,(8.2%)(14.2)whiletheRepublicofKoreawouldgainabout$300million.The13(8.271)resultsshowthatCBAMwidenstheGDPandwelfaregapbetweendevelopedanddevelopingeconomies,worseningtheincomeand(59)welfaredistributionsbetweenrichandpooreconomies.(45)Eickeetal.(2021)expandedtheriskscopetocovernationalcapacitiestocomplywiththeCBAMregulation.Thestudy()=negative,CBAM=CarbonBorderAdjustmentMechanism,EU=EuropeanintroducedanindexthatcapturednotonlytradeexposuretotheUnion,CO2=carbondioxide.EU,butalsotradediversificationproxiedbythetradeshareofEITEgoods,statisticalcapacity,thecarbonintensityofenergysystems,Source:UNCTAD2021.andanationaltargettoreduceemissions.8Theindexindicatedaneconomy’srelativeriskbyfivequantiles.Chepeliev(2021)conductedaquantitativeassessmentusingacomputablegeneralequilibriummodeltoestimatetheimpactofTable5showsthetop10economieswithahighestrelativeriskindex.theCBAMonEUtradepartners.7TheassessmentaggregateddataTheindexshowsasthedistancefromthemeanincreasesintheinto20economies/regionsand22sectorsandusedeconomy-positivedirection,theeconomybecomesrelativelyvulnerabletospecificCO2emissionsperunitofoutputbysector.Table3CBAM.Mozambiquetakesthefirstplacebyahighmargin.Bosniapresentseconomies/regionsthatwillseethemostimpactsonperandHerzegovinaandNorthMacedoniacometothesecondandthirdcapitaincomeandAsianeconomies/regions.Thestudyestimatedplace.AmongADBregionalmembers,onlyBhutanisincludedintheextremelylimitednegativeimpactsontheregionalmemberstop10list.ofADB,whileUkraine’sironandsteelsector,andtheRussianFederation’spetroleumproductssectorwerelargelyexposedOverall,quantitativeanalysisshowsthatwhiletheCBAMmayhavetoCBAM.ForIndia,theimpactonwelfarewasestimatedatalimitedeffectonemissionreduction,itsdistributionaleffects$418.2millionandpercapitaincomewasforecastedtodecreasecouldbeaconcern.Arangeoffactorsneedtobeconsidered.First,by0.02%.ForthePRCandSoutheastAsia,percapitaincomegeographicallocationisamongthedominantfactors.Studiesoncoulddecreaseby0.01%.Lookingattheeffectacrosssectors,chemicalproductsandironandsteelwereseenasthemostimpacted.India’sironandsteelexportscoulddecreaseby5.9%.7TheGTAP-EModelwasused.TheGTAPmodelisamultiregion,multisector,andcomputablegeneralequilibriummodel,withperfectcompetitionandconstantreturnstoscale.TheGTAP-EmodelisanexpansionoftheGTAPModelbyincorporatingcarbondioxideemissions.8Therelativeriskindexiscomputedbysectoral_Exports_GDP+0.25×(RelativeExports_Sectoral+LowStatisticalCapacity+CarbonIntensity_FinalEnergyConsumption+LackingEmissionReductionTargets).Everyvariableisstandardizedsothatequalweightsareimposed.10EuropeanUnionCarbonBorderAdjustmentMechanism:EconomicImpactandImplicationsforAsiaTable3:ImpactsoftheCBAMonEUTradingPartnersUkraineImpactonperImpactonWelfareMostImpactedExportMostImpactedExportRestofEuropeCapitaIncome($million)(sector)(%change)RestofFormerSovietUnion(451.3)IronandSteel(5.1)MENA(%change)(341.2)Electricity(29.9)Sub-SaharanAfrica-0.40(228.4)(1.4)India-0.35(1163.1)Petroleumproducts(0.9)PRC-0.04(434.9)Chemicals(0.5)SoutheastAsia-0.03(418.2)(5.9)RussianFederation-0.03(703.6)Othermetals(1.4)Japan-0.02(121.4)IronandSteel(0.2)RestofSouthAsia-0.01(34)(4.3)RestofEastAsia-0.01355Chemicals(0.4)0.0051.7Chemicals(0.9)0.01179.5Chemicals(0.3)0.01Chemicals0.01ChemicalsChemicals()=negative,CBAM=CarbonBorderAdjustmentMechanism,EU=EuropeanUnion,MENA=MiddleEastandNorthAfrica,PRC=People’sRepublicofChina.Note:AsianDevelopmentBankregionalmembersarehighlighted.Source:Chepeliev2021.Table4:ImpactsofCBAMonGDPandWelfareTable5:CBAMRiskExposures—RelativeRiskIndexUkraineImpactonGDPChangeinMozambiqueRelativeRiskIndexRussianFederation(%change,WelfareBosniaandHerzegovina(Mean=-0.03,StandardDeviation=1.07)Kazakhstanin2030)($billion,NorthMacedoniaIndia(0.207)in2030)Ukraine6.67MENA(0.193)(0.7)Jamaica4.44ASEAN(0.045)(4.7)Serbia2.77People’sRepublicofChina(0.043)(0.2)Montenegro2.49Japan(0.036)Türkiye1.85RepublicofKorea(0.013)(1.8)Bhutan1.47EU(0.007)(14.0)TrinidadandTobago1.42(0.002)(0.5)0,920.0040.63NoData(1.1)0.540.20.3ADB=AsianDevelopmentBank,CBAM=CarbonBorderAdjustment10.7Mechanism.Note:ADBregionalmembersarehighlighted.()=negative,ASEAN=AssociationofSoutheastAsianNations,Source:Eickeetal.2021.CBAM=CarbonBorderAdjustmentMechanism,EU=EuropeanUnion,GDP=grossdomesticproduct,MENA=MiddleEastandNorthAfrica.Note:AsianDevelopmentBankregionalmembersarehighlighted.Source:He,Zhai,andMa2022.tradeoftenuseagravitymodel,inwhichdistancebetweenanSecond,theshareofaffectedindustriesintheeconomy’sstructureexporterandanimporterisusuallyincludedasanegativetermforalsomatters.EvenifthetotalCBAMimpactmaynotbelarge,bilateraltrade.Ascanbeseen,regionalmembersgeographicallyspecificsectorsmaybehardhit.Forexample,CambodianandclosetotheEUtendtohavestrongtradetieswiththeEU.ThoseIndianironandsteelindustriesdependhighlyontradewiththeeconomiesshouldforeseeareductionintradethroughthatroute.EU.Localimpactsonsuchsectorsmightbecriticalforeconomieswheretheseindustriesareeconomicallyimportant.11ADBBRIEFSNO.276Third,otherfactorssuchasaneconomy’scapacityandattitudetothesettlementprocesscannotclaimretrospectivecompensation;climateagendasneedtobeconsidered.Eickeetal.(2021)findthatitwillsimplyurgefutureadjustment.smalldevelopingeconomieshaveahigherrelativeriskthanlargeemergingeconomies.LargereconomiesmaybelessexposedtoControversysurroundingtheCBAM’scompatibilitywithWTOinternationalmarketsbecausetheyhavestrongerinternalmarkets,rulesarisesfromthepotentialtreatmentofCBAMasakindofhigherstatisticalcapacity,andclimatetargetsasaguide.carbontax.Therelatedquestionsare:(i)IsCBAMataxonproductsoroncarbon?GATTArticleProspectsofCBAMandIssuesII:2(a)allowsimportchargesequivalenttodomestictaxesonTheapprovedCBAMregulationtargetssixsectors.However,theaproductoranyinputstoaproduct.AsfarasCBAMtargetsEuropeanCommissionmayconsiderexpandingthecoveragebyeithertheproductortheinputs,therearenocontradictions.2025,theendofthetransitionperiod.TheregulationexplicitlyHowever,ifCBAMisconsideredataxoncarbon,itisraisedthepossibleexpandedscopetoinclude:(i)embeddeduncertainthatcarboncanberecognizedasaninputratherindirectemissionsofgoodsinAnnexII,(ii)embeddedemissionsinthanaby-product.thetransportationofthosegoods,(iii)othergoodsatriskofcarbon(ii)IsCBAMconsistentwiththeprincipleofnationaltreatment?leakage,and(iv)otherinputmaterials.GATTArticleIII:4statesthatimportedproductsshallreceivetreatmentnolessfavorablethandomestic-likeAnnexIIofthemechanismlistsironandsteel,aluminum,andproducts.Ifimportedproductsarecomparedwithdomesticchemicalsasexemptionfromindirectemissionsbyarticle7.1.products,unilateraltaxappliedonlytoimportedproductsIndirectemissionsaredefinedasemissionsfromtheproductionofcannotbeadmitted.electricitythatisconsumedduringproduction.Becauseindirect(iii)DoesCBAMviolatetheruleofmostfavorednationemissionsarecalculatedbydefaultvalue,economiesproducing(MFN)treatment?MFNtreatmentbyGATTArticleI:1ishighcarbonemissionsfromelectricitygenerationwouldfacemoreacoreprincipleofGATT-WTOtradestandards.IfCBAMofaburden,ifembeddedindirectemissionsofgoodslistedindiscriminatesimportsbyeconomy-specificparameterstoAnnexIIwerepartoftheexpandedscope.9measureembeddedemissions(referredtoasdefaultvaluesandmark-upinCBAMregulation,AnnexIV),thattreatmentThequantityofembeddedemissionsintransportisusuallycanberenderedasarbitrary.tiedtothedistancetoEUimporters.Ifembeddedemissionsintransportationareadopted,regionalmembers,especiallyinEastRegardlessoftheseandotherpoints,GATTArticleXXprovidesAsia,SoutheastAsia,andthePacific,willlosecompetitiveness.someexceptions.Amongthem,ArticleXX:(g),“relatingtotheconservationofexhaustiblenaturalresource”canhelpjustifytheTheCBAMcoveragecouldbeexpandedovertime.TheEuropeanCBAMastheEUimplementsthemechanismtopreservecarbonCommission’sassessmentreporthasalreadyconsideredanoptionconcentrationintheair,whencurrentcarbonconcentrationisthatwouldexpanditsscopetodownstreamsectors.Intermediateviewedasanexhaustiblenaturalresource.goodsandmanufacturedgoodscouldbeincluded.However,administrativepracticalityisinquestionascalculationmethodswillPOLICYIMPLICATIONSbecomemorecomplex.QuantitativeanalysessuggestthatthevalueoftheCBAMintermsAnotherstickingpointiscompatibilitywithWorldTradeofmitigatingclimatechangeismarginal.However,itsimpactsonOrganization(WTO)rules.IftheCBAMisdeemedincompatible,tradepatterns,competitiveness,andincomedistributionarefarexportingeconomiescancallonWTO’sdisputesettlementfromnegligible,especiallyfordevelopingeconomies.processtotestthatpoint.Asthefirststep,concernedpartiesareexpectedtoresolvetheissuewithin60days.Iftheyfailtosettle,TheCBAMislikelytoaffectregionalmembers,somemorethanthecaseusuallygoestoaWTOpanelthatwillsubmitafinalreport,others.Forexample,CentralAsiahasarelativelylargeexposuretotheinprinciple,within6months.BothpartiescanappealagainsttheEUinthetradeofgoodscoveredbythemechanism.Atthesectorfinalreport.Insuchacase,theDisputeSettlementBodywillmakelevel,someAsianeconomieswillfeelaheadwindintheirexports,afinaldecisionusuallywithinafurther4months.Generally,fromasthecostscalculatedbyembeddedemissionswillbechargedontheinitiationofabilateralconsultation,atotalof15monthsmayimportpricesfrom2026.TheseincludeIndiaintheironandsteelelapse.Besides,iftheCBAMturnsouttobreachWTOrules,thesector,Georgiainfertilizer,andKazakhstaninaluminum.EventhoughEUwillhaveafurther15monthstoadjustCBAMandfollowtheeconomiescansuccessfullydisputetheCBAMattheWTO,theydisputepanelrecommendation.ThatmeansEUtradingpartnerscannotavoiditsshort-termimpacts,generallyforabout30months.couldbeexposedtotheCBAMfor30months.ItshouldalsobehighlightedthateveniftheCBAMweretobejudgedinviolation,9AnnexIV,4.3.articulates“Defaultvaluesfortheindirectemissionsembeddedinagoodproducedinathirdcountryshallbedeterminedonadefaultvaluecalculatedontheaverage,ofeithertheemissionfactoroftheUnionelectricitygrid,theemissionfactorofthecountry-of-originelectricitygridortheCO2emissionfactorofprice-settingsourcesinthecountryoforigin,oftheelectricityusedfortheproductionofthatgood.”12EuropeanUnionCarbonBorderAdjustmentMechanism:EconomicImpactandImplicationsforAsiaThesequantitativeanalysesalsoindicatethattheCBAMwouldTechnicalandfinancialsupportcanincreasetheproductivewidenthewelfaregapbetweendevelopinganddevelopedcapacityofothersectorsandsoreducerelianceonEITEsectors.economiesunderthebusiness-as-usualscenario.Inmostcases,Asianeconomiesalsoneedtoseekmoretechnicalassistanceanddevelopedeconomiesfarebettersincetheirproductionpracticescapacitybuildingthroughinternationalcooperationtohelpthemtendtobelesscarbon-intensive.Fromadevelopmentperspective,implementcarbonpricingandtoincreasetheirstatisticalcapacity.effectivereductionofglobalemissionswillrequiremoreefficientEarlierstudiesshowthataneconomy’scapacitytoadjusttoCBAMproductionandtransportprocessesinregionalmembers.TheimplementationmaysignificantlyskewtheeconomicimpactsEUmightconsiderutilizingpartoftherevenuegeneratedbyoftheCBAM.SmallerandlessdevelopedeconomiesarehighlytheCBAMtoacceleratethediffusionanduptakeofcleanersusceptibletorisksthatmaycomefromalackofcapacitytotrackproductiontechnologiesinCBAM-targetedsectorsofdevelopingtradeincarbon-intensiveproducts.ADBcanfacilitatecapacityeconomies.buildingandknowledge-sharingactivitiesamongitsregionalmemberstosupporttheiradjustmentstoCBAMimplementationTheCBAMmayhavemoresystemicimplications,despitehavingandmitigatetheimpactoftheCBAMontheireconomies.relativelysmalleffectsonemissionsandonmosttradeflows.Someeconomiesmayconsiderintroducingorexpandingbroad-basedFourth,andoverthelongterm,bordercarbonadjustmentsmaydomesticcarbonpricingprograms.Suchprogramswouldstillbecomemorecommonasamechanismforreducingcarbondriveupbusinesscosts,butthecollectedtaxeswouldaccruetoleakage.AsianeconomiesneedtosubstantiallystrengthentheirgovernmentsdomesticallyandcouldbeusedtosupportexportersenergyefficienciesandreduceemissionsthroughenergytransitionseekingtoreducecarbonintensityinwayscompliantwithWTOandupgradingofproductiontechnology.ManyAsianeconomiesrules.Effectivecarbonpricingcanalsocatalyzeprivatesectorwithhighexposuresoftradeincarbon-intensivesectorsshouldinvestmentingreensectorandlow-carbontechnologytospurenhancetheireffortstodecarbonizethesectors.Forexample,innovations.Asia’ssteelproducerswouldfacesteepcostsduetotheCBAMimplementationwithoutscalingupinvestmentinlow-carbonWhatCanAsianEconomiesDo?productionandenergytransition.PublicpolicycanplayacatalyticrolebysettingclearandambitiousemissionreductionandFirst,Asianpolicymakersmayreflectonhowtheirexistingrenewableenergytargets,whilemobilizingpublicandprivatedomesticcarbonpolicyframeworksmightmitigatetheimpactofinvestmentinlowcarbontechnologyandenergytransition.theCBAMontheireconomies.Theregion’scarbonmarketsarestillbeingdeveloped(Duggal2023).Currently,AsiaandthePacificFinally,strongerregionalcooperationisneededtogeneratetimelyeconomieshaveimplementedsixdirectcarbonpricinginitiatives.andcollectiveresponsestotheCBAM,tobuildastrongerregionalJapanandSingaporeemployacarbontaxwhileNewZealand,voiceinnegotiatinghowtherevenuesitwillgenerateareused,toKazakhstan,theRepublicofKorea,andthePRChaveeachclaimtechnicalassistanceandcapacitybuilding,andtoexpandlaunchedanETS.VietNamandThailandhavealsotakenlegalandintegrateregionalcarbonmarkets.andadministrativestepstoimplementacarbonprice.Pakistan,thePhilippines,andTaipei,ChinaarealsoconsideringadoptingREFERENCESdomesticETS.AlthougharegionalcarbontradinghubisbeingsetupinSingapore,itwilltaketimeforeconomiesintheregiontofullyBöhringer,C.,E.J.Balistreri,andT.F.Rutherford.2012.TheRoleparticipate.TheCBAMpresentsanopportunityforthemtofocusofBorderCarbonAdjustmentinUnilateralClimatePolicy:ondevelopingtheircarbonmarkets,whiletacklingshortfallsinOverviewofanEnergyModelingForumStudy(EMF29).investmentsrequiredtodeveloprenewableenergysources.EnergyEconomics.34(S2).pp.S97–S110.Second,regionaleconomiescouldconsiderrespondingbyseekingBranger,F.,andP.Quirion.2014.WouldBorderCarbonAdjustmentstoupgradethevalueaddedoftheirexports.Forinstance,steelPreventCarbonLeakageandHeavyIndustryCompetitivenessembeddedincarpartsexportedtotheEUisnotsubjecttothelevyLosses?InsightsfromaMeta-analysisofRecentEconomic(althoughthiscouldsoonchange).AnincreaseincarbonpriceStudies.”EcologicalEconomics.99.pp.29–39.wouldstrengthenincentivestoshifttoimportsofhigher-value-addedproducts,negativelyimpactingsupplychainsintheEU.ForChepeliev,M.2021.PossibleImplicationsoftheEuropeanCarboninstance,Chepeliev(2021)showsthattheUkrainiansteelsectorBorderAdjustmentMechanismforUkraineandOtherEUcouldundergosignificantreorientationtowardhigher-value-addedTradingPartners.EnergyResearchLetters.2(1).products,limitingtheCBAMexposureofUkraine’ssteeloutputs.Deloitte.2023.EUCarbonBorderAdjustmentMechanism(CBAM).Third,theshort-termriskfromtheCBAMisdrivenmainlybyanhttps://www2.deloitte.com/nl/nl/pages/tax/articles/eu-economy’srelianceontheEUmarketforEITEexports,asreflectedcarbon-border-adjustment-mechanism-cbam.html.bytheshareofEUtradeinitsnationalaccounts.DiversificationofexportmarketsmayhelpmitigatetheriskexposuretotheCBAM.13ADBBRIEFSNO.276Duggal,V.K.2023.CarbonPricingDevelopmentandDynamics:Keen,M.,I.Parry,andJ.Roaf.2021.BorderCarbonAdjustment:ImplicationsforDevelopingAsia.BackgroundpaperforRationale,DesignandImpact.IMFWorkingPaper21/239,AsianDevelopmentOutlookThematicReport2023.Manila:InternationalMonetaryFund,Washington,DC.AsianDevelopmentBank.https://www.adb.org/sites/default/https://www.imf.org/en/Publications/WP/Issues/2021/09/24/files/institutional-document/874256/adotr2023bp-carbon-Border-Carbon-Adjustments-Rationale-Design-and-pricing-developing-asia.pdf.Impact-466176.Eicke,L.,S.Weko,M.Apergi,andA.Marian.2021.PullinguptheLowe,S.2021.TheEU’sCarbonBorderAdjustmentMechanism:CarbonLadder?Decarbonization,Dependence,andThird-HowtoMakeItWorkforDevelopingCountries.London:CentrecountryRisksfromtheEuropeanCarbonBorderAdjustmentforEuropeanReform.Mechanism.EnergyResearchandSocialScience.80(October).102240.OrganisationforEconomicCo-operationandDevelopment(OECD).n.d.OECDStat,CarbonDioxideEmissionsEuropeanCommission.n.d.CarbonBorderAdjustmentMechanism.EmbodiedinInternationalTrade(2021ed.),EXGR_TaxationandCustomsUnion.Brussels.https://taxation-TCO2INT:IntensityofCO2EmissionsEmbodiedinTotalcustoms.ec.europa.eu/carbon-border-adjustment-GrossExports.https://stats.oecd.org/.mechanism_en.Simões,H.M.2023.EUCarbonBorderAdjustmentMechanism:EuropeanCommission.2021a.CommissionStaffWorkingImplicationsforClimateandCompetitiveness.Brussels:DocumentImpactAssessmentReport.AccompanyingtheEuropeanParliamentaryResearchService.documentProposalforaRegulationoftheEuropeanParliamenthttps://www.europarl.europa.eu/RegData/etudes/andoftheCouncilEstablishingaCarbonBorderAdjustmentBRIE/2022/698889/EPRS_BRI(2022)698889_EN.pdf.Mechanism.SWD/2021/643final.Brussels.UNCTAD.2021.AEuropeanUnionCarbonBorderAdjustmentEuropeanCommission.2021b.ProposalforaRegulationoftheMechanism:ImplicationsforDevelopingCountries.Geneva:EuropeanParliamentandoftheCouncilEstablishingaUnitedNationsConferenceonTradeandDevelopment.CarbonBorderAdjustmentMechanism.COM/2021/564https://unctad.org/system/files/official-document/Final.Brussels.https://eur-lex.europa.eu/legal-content/en/osginf2021d2_en.pdf.TXT/?uri=CELEX:52021PC0564.Vickers,B.,S.Ali,andK.Powell.2021.TheEU’sCarbonBorderEuropeanUnion(EU).2023.Regulation(EU)2023/956oftheAdjustmentMechanism:ImplicationsforCommonwealthEuropeanParliamentandoftheCouncilof10May2023Countries.CommonwealthTradeHotTopics.178.4November.EstablishingaCarbonBorderAdjustmentMechanism(Texthttps://www.thecommonwealth-ilibrary.org/index.php/withEEARelevance).OfficialJournalL130,16.5.2023,comsec/catalog/book/732.52–104,EuropeanUnion,Brussels.WorldBank.2023.CarbonPricingDashboard.He,X.,F.Zhai,andJ.Ma.2022.TheGlobalImpactofaCarbonhttps://carbonpricingdashboard.worldbank.org/map_data.BorderAdjustmentMechanism:AQuantitativeAssessment.Update.TaskforceonClimate,DevelopmentandtheWorldBank.2023.RelativeCBAMExposureIndex.InternationalMonetaryFund.June.https://www.bu.edu/gdp/https://www.worldbank.org/en/data/interactive/2023/06/15/files/2022/03/TF-WP-001-FIN.pdf.relative-cbam-exposure-index#2(accessedJuly2023).InternationalTradeCentre.2023.TradeMap.https://www.trademap.org/Index.aspx.14EuropeanUnionCarbonBorderAdjustmentMechanism:EconomicImpactandImplicationsforAsiaAPPENDIXAggregateCBAMExposureIndexEconomyCBAMProductsExportsCBAMProductsAggregateMostExposed1AlbaniatotheEU(%oftotalCBAMExportstotheEURelativeCBAMCBAMProducts2Argentinaproductsexportstoworld)ExposureIndex3Australia(%ofGDP)Cement4Azerbaijan58.70200.7323(0.0250)Ironandsteel5Bahrain2.17490.00830.00116Belarus1.40190.00430.0000Cement7Brazil15.91490.09240.0011Fertilizer8Cambodia14.13021.17160.0002Cement9Cameroon1.35800.0302Cement10Canada50.16600.05300.0024Ironandsteel11Chile11.45770.0204Ironandsteel12China,People’sRepublicof19.18070.2145(0.0010)Cement13Colombia93.38360.02440.0000Ironandsteel14CostaRica2.60110.06560.0001Fertilizer15Egypt,ArabRep.21.70320.0494Cement16Georgia8.59630.0097(0.0045)Cement17Ghana10.37550.00410.0024Ironandsteel18HongKong,China0.94560.3470(0.0116)Fertilizer19India37.84540.28780.0001Fertilizer20Indonesia34.80090.15000.0196Aluminum21Iran,IslamicRep.35.39010.00670.0464Ironandsteel22Israel4.86350.1018Ironandsteel23Japan18.92320.0418(0.0000)Ironandsteel24Jordan6.21870.03610.0033Ironandsteel25Kazakhstan5.23230.03250.0303Cement26Korea,Republicof31.06790.01200.0017Cement27Kuwait1.98340.18020.0044Fertilizer28Malaysia24.60860.1758Aluminum29Mauritius13.74330.1832(0.0047)Ironandsteel30Mexico10.05300.0014(0.0001)Cement31Morocco3.30150.1105(0.0050)Cement32Mozambique5.53000.0137Cement33NewZealand1.65100.00920.0051Fertilizer34Oman1.85870.33160.0002Cement35Pakistan15.05006.92230.0004Aluminum36Peru73.73380.01730.0007Fertilizer4.52370.1135(0.0007)Aluminum2.75600.00160.0004Cement1.22600.0013(0.0029)Ironandsteel0.00011.10310.0001continuedonnextpage0.00160.0015150.0009ADBBRIEFSNO.276Appendixtable:continuedEconomyCBAMProductsExportsCBAMProductsAggregateMostExposedtotheEU(%oftotalCBAMExportstotheEURelativeCBAMCBAMProductsproductsexportstoworld)ExposureIndex(%ofGDP)CementCement37Philippines1.56280.00080.0002ElectricityCement38Qatar0.78390.01710.0000IronandsteelIronandsteel39RussianFederation31.43330.66270.0194IronandsteelCement40SaudiArabia2.41860.01730.0006IronandsteelAluminum41Senegal1.08460.0097(0.0001)IronandsteelFertilizer42Singapore1.04250.00420.0001CementElectricity43SouthAfrica16.51590.20070.0069CementAluminum44SriLanka2.80270.0013(0.0001)CementCement45Taipei,China12.16540.2184(0.0006)IronandsteelIronandsteel46Tajikistan17.73510.07550.0001Ironandsteel47Thailand3.93320.02680.000448TrinidadandTobago11.50880.96070.030049Tunisia43.33040.47210.004250Türkiye43.45200.80750.004951Ukraine37.10542.35810.052552UnitedArabEmirates14.48720.34580.000353UnitedKingdom68.93290.1964(0.0015)54UnitedStates9.72670.00800.000355Venezuela44.53360.16550.011456VietNam5.53300.11490.004357Zimbabwe86.96250.42540.0873()=negative,CBAM=CarbonBorderAdjustmentMechanism,EU=EuropeanUnion,GDP=grossdomesticproduct.Note:AsianDevelopmentBankregionalmembersarehighlighted(accessedJuly2023).Source:WorldBank2023.AbouttheAsianDevelopmentBankTheviewsexpressedinthispublicationarethoseoftheauthorsanddonotADBiscommittedtoachievingaprosperous,inclusive,resilient,andnecessarilyreflecttheviewsandpoliciesofADBoritsBoardofGovernorssustainableAsiaandthePacific,whilesustainingitseffortstoeradicateorthegovernmentstheyrepresent.ADBdoesnotguaranteetheaccuracyextremepoverty.Establishedin1966,itisownedby68members—ofthedataincludedhereandacceptsnoresponsibilityforanyconsequence49fromtheregion.Itsmaininstrumentsforhelpingitsdevelopingmemberoftheiruse.Thementionofspecificcompaniesorproductsofmanufacturerscountriesarepolicydialogue,loans,equityinvestments,guarantees,grants,doesnotimplythattheyareendorsedorrecommendedbyADBinpreferenceandtechnicalassistance.toothersofasimilarnaturethatarenotmentioned.Bymakinganydesignationoforreferencetoaparticularterritoryorgeographicarea,orbyusingthetermADBBriefsarebasedonpapersornotespreparedbyADBstaffandtheir“country”inthispublication,ADBdoesnotintendtomakeanyjudgmentsasresourcepersons.Theseriesisdesignedtoprovideconcise,nontechnicaltothelegalorotherstatusofanyterritoryorarea.accountsofpolicyissuesoftopicalinterest,withaviewtofacilitatinginformeddebate.TheDepartmentofCommunicationsandKnowledgeManagementAsianDevelopmentBankadministerstheseries.6ADBAvenue,MandaluyongCity1550MetroManila,Philippineswww.adb.org/publications/series/adb-briefswww.adb.orgCreativeCommonsAttribution3.0IGOlicense(CCBY3.0IGO)Printedonrecycledpaper©2023ADB.TheCClicensedoesnotapplytonon-ADBcopyrightmaterialsinthispublication.https://www.adb.org/terms-use#openaccesshttp://www.adb.org/publications/corrigendapubsmarketing@adb.org16


 VIP
VIP


