RenewablePowerGenerationCostsin2021Thispublicationshouldbecitedas:Citation:IRENA(2022),RenewablePowerGenerationCostsinContentsHighlightsExecutiveSummaryThisfilecontainsdatafromtheabovementionedreport.Note:Monetaryvaluesinthisreportareexpressedinreal2021USD(thatistosay,takinContact:1.Latestcosttrends2.Onshorewind3.SolarPV4.Offshorewind5.Concentratingsolarpower6.Hydropower7.Geothermal8.BioenergyAnnexIOperations&Maintenacecosts@irena.orgtsin2021newablePowerGenerationCostsin2021,InternationalRenewableEnergyAgency,AbuDhabi.al2021USD(thatistosay,takingintoaccountinflation)unlessexplicitlymentioned.20102021201020212010-13%7268-6%0.07847%8777-11%0.0562%44452%0.039857-82%141725%0.417-4%3080167%0.358-35%273944%0.102-41%38393%0.188TableH.1Globalweightedaveragetotalinstalledcost,capacityfactorandlevelisedcostofelectricitytrendsbytechnology,2010and2021TotalinstalledcostsCapacityfactorLevelisedcostofelectricity(2021USD/kW)(%)(2021USD/kWh)PercentchangePercentchangeBioenergy27142353Geothermal27143991Hydropower13152135SolarPV4808CSP94229091Onshorewind20421325Offshorewind4876285820210.067-14%0.06834%0.04824%0.048-88%0.114-68%0.033-68%0.075-60%ofelectricitytrendsbyLevelisedcostofelectricity(2021USD/kWh)PercentchangeFigureS.1Changeinglobalweightedlevelisedcostofelectricitybytechnology,2020-2021SolarphotovoltaicYear-on-yearpercentagereduction2020-2021-13%gy,2020-2021OfshorewindOnshorewindConcentratingsolarpower-13%-15%7%Totalinstalledcost(2021USD/kW)2010201120122013Solarphotovoltaic4808410431242742Offshorewind4876558449425223Onshorewind2044200019061965Capacityfactor(%)2010201120122013Solarphotovoltaic13.80%15.30%15.10%16.40%Offshorewind37.90%38.10%39.90%45.00%Onshorewind27.20%27.60%27.60%28.10%LCOE(2021USD/kWh)2010201120122013Solarphotovoltaic0.4170.3110.2330.179Offshorewind0.1880.1960.1670.141Onshorewind0.1020.0960.0880.089Fossilfuelcostrange2021USD/kWhLowband0.054Highband0.167FigureS.2Globalweightedaveragetotalinstalledcosts,capacityfactorsandLCOEofnewlycommissionedutility-scalesolarPV,onshoreandoffshorewind,2010-2021201420152016201720182019202020212478188717171483126710460916085754995515434249064798384432552858189817221729172916361553150113252014201520162017201820192020202116.60%16.50%16.70%17.50%17.90%17.50%16.10%17.20%35.10%41.90%39.70%44.70%43.10%42.50%38.30%38.80%29.20%29.10%30.80%32.50%34.60%35.70%39.80%39.20%201420152016201720182019202020210.1610.1210.1060.0840.0710.0620.0550.0480.1720.1410.1160.1060.10.0860.0860.0750.080.0690.0640.060.0510.0450.0390.033EofnewlycommissionedTechnologyUnits20102011201220132021USD/kWh0.0820.0990.1050.095Solarphotovoltaic2021USD/kWh0.4380.3530.2360.18FigureS.3TheweightedaverageLCOEofutilityscalesolarPVcomparedtofuelandCO2costonlyforfossilgasinEurope,2010-2022Fossilgas(fuel+CO2only)201420152016201720182019202020212022p0.0880.0620.0370.0480.070.0460.0360.1410.2690.1820.1360.1290.1010.0810.0720.0710.0610.064onlyforfossilgasinFigureS.1Changeinglobalweightedlevelisedcostofelectricitybytechnology,2020-2021SolarphotovoltaicYear-on-yearpercentagereduction2020-2021-13%y,2020-2021OfshorewindOnshorewindConcentratingsolarpower-13%-15%7%2021USD/kWhSolarphotovoltaic201020215thpercentile0.2080.0295thpercentileWeightedaverage0.4170.048Weightedaverage95thpercentile0.5220.12095thpercentileOnshorewind201020215thpercentile0.0660.0215thpercentileWeightedaverage0.1020.033Weightedaverage95thpercentile0.1410.06495thpercentileOffshorewind201020215thpercentile0.1120.0545thpercentileWeightedaverage0.1880.075Weightedaverage95thpercentile0.3070.12795thpercentileConcentratingsolarpowerFossilfuelcostrange20102021Lowband5thpercentile0.2740.114HighbandWeightedaverage0.3580.11495thpercentile0.4060.114Figure1.2GlobalweightedaverageLCOEsfromnewlycommissioned,utility-scalerenewablepowergeneratechnologies,2010-2021Biomass201020210.0410.0610.0780.0670.1440.139Geothermal201020210.0380.0370.0500.0680.0770.099Hydro201020210.0210.0290.0390.0480.0870.1312021USD/kWh0.0540.167renewablepowergenerationYearTechnologyCompetitiveNeedssupport2010Solarphotovoltaic0%100%Onshorewind0%100%2011Solarphotovoltaic0%100%Onshorewind1%99%2012Solarphotovoltaic0%100%Onshorewind0%100%2013Solarphotovoltaic0%100%Onshorewind1%99%2014Solarphotovoltaic0%100%Onshorewind2%98%2015Solarphotovoltaic0%100%Onshorewind9%91%2016Solarphotovoltaic0%100%Onshorewind16%84%2017Solarphotovoltaic3%97%Onshorewind57%43%2018Solarphotovoltaic52%48%Onshorewind76%24%2019Solarphotovoltaic58%42%Onshorewind83%17%2020Solarphotovoltaic63%37%Onshorewind96%4%2021Solarphotovoltaic74%26%Onshorewind96%4%TechnologyGW20102011BiomassCompetitive0.20.6ConcentratingsolarpowerCompetitive0.00.0GeothermalCompetitive0.20.0HydroCompetitive26.525.5OffshorewindCompetitive0.00.0SolarphotovoltaicCompetitive0.00.0OnshorewindCompetitive0.10.5TechnologyGW20102011BiomassNeedssupport5.47.5ConcentratingsolarpowerNeedssupport0.30.5GeothermalNeedssupport0.20.0HydroNeedssupport7.15.0Figure1.3Annualandcumulativetotalnewrenewablepowergenerationcapacityaddedatalowercostthancheapestfossilfuel-firedoption,2010-2021OffshorewindNeedssupport1.11.1SolarphotovoltaicNeedssupport4.48.4OnshorewindNeedssupport31.640.82012201320142015201620172018201920200.70.40.30.50.30.02.90.00.40.00.00.00.00.00.00.00.00.00.00.10.10.20.10.50.00.10.150.024.826.338.820.413.226.613.215.00.00.00.00.00.00.00.00.00.00.00.00.00.20.02.030.440.746.70.10.21.06.18.428.735.745.7102.720122013201420152016201720182019202010.210.16.54.74.12.02.06.74.31.01.21.30.30.30.20.90.60.20.20.20.40.60.60.81.20.80.18.79.010.913.617.28.19.47.66.7tyaddedatalowercostthanthe1.22.31.14.12.23.64.26.78.229.256.122.833.450.669.427.629.127.749.932.746.459.643.922.111.49.34.820210.00.00.121.82.570.269.220219.20.10.33.820.024.42.6TechnologyMetric20102011BiomassSavingsbyyear(2021USDbillion)0.00.0GeothermalSavingsbyyear(2021USDbillion)0.0HydroSavingsbyyear(2021USDbillion)1.82.1SolarphotovoltaicSavingsbyyear(2021USDbillion)OffshorewindSavingsbyyear(2021USDbillion)OnshorewindSavingsbyyear(2021USDbillion)0.00.0TechnologyMetric20102011BiomassRunningtotal(2021USDbillion)0.00.0GeothermalRunningtotal(2021USDbillion)0.00.0HydroRunningtotal(2021USDbillion)1.83.9SolarphotovoltaicRunningtotal(2021USDbillion)OffshorewindRunningtotal(2021USDbillion)OnshorewindRunningtotal(2021USDbillion)0.00.0TechnologyMetric20102011BiomassGeneration(TWh)1.12.1GeothermalGeneration(TWh)1.8HydroGeneration(TWh)101.799.7SolarphotovoltaicGeneration(TWh)OffshorewindGeneration(TWh)OnshorewindGeneration(TWh)0.20.8TechnologyMetric20102011BiomassRunningSumofGenerationinTWh1.13.2GeothermalRunningSumofGenerationinTWh1.81.8HydroRunningSumofGenerationinTWh101.7201.4SolarphotovoltaicRunningSumofGenerationinTWhOffshorewindRunningSumofGenerationinTWhOnshorewindRunningSumofGenerationinTWh0.21.1Figure1.4Annualandcumulativesavingsandgenerationfromnewrenewablepowergenerationcapacitywlowercoststhanthecheapestfossilfuel-firedoption,non-OECDcountries,2010-202120122013201420152016201720182019202020210.00.00.00.00.10.00.00.00.00.00.10.00.00.04.21.92.13.51.41.02.00.91.21.00.00.10.50.81.30.00.00.00.00.00.10.50.51.24.23.320122013201420152016201720182019202020210.00.10.10.10.10.10.20.20.20.20.00.00.00.00.00.10.10.10.10.18.210.112.215.717.118.020.121.022.223.10.00.10.61.42.70.00.00.00.10.10.10.61.12.36.69.920122013201420152016201720182019202020213.71.81.33.617.81.00.30.61.30.93.30.20.70.2208.7111.8112.1172.791.152.5103.450.061.275.92.544.241.947.570.60.70.20.83.03.94.859.964.481.4223.1138.320122013201420152016201720182019202020216.98.79.913.613.613.631.431.432.332.31.82.12.74.04.98.18.18.49.19.3410.1521.9633.9806.7897.8950.21053.61103.61164.81240.72.546.788.6136.1206.80.71.32.05.08.913.773.6138.1219.4442.6580.9owergenerationcapacitywith-2021Figure1.6Wholesaleelectricity(hourly)andfossilgas(daily)pricesforBelgium,France,Germany,ItalyandtheNetherlands,March2022industrialproducts,GP09-24102,GP09-24103andGP09-24104,GermanFederalStatisticalOffice(StatistischesBundesamt),Wiesbaden.any,ItalyandsticalOfficeOnshorewindSolarPVCoal2021USD/MWh2021USD/MWh2021USD/MWhGermany51.061.0Italy41.051.0Europe42.061.0France44.049.0Brazil24.052.0Japan141.087.0Finland47.0UnitedKingdom42.069.0Denmark40.061.0China28.034.077.3Korea64.056.0India30.035.0127.4Turkey45.064.0VietNam57.046.0126.3Australia38.042.089.4Argentina47.091.0Chile42.044.0UnitedStates30.055.0Mexico42.049.0Figure1.7Fuel-onlygenerationcostsforcoalandfossilgasfor2022relativetotheLCOEofnewsolarPV,onshoreandoffshorewindpowerprojectscommissionedin2021,bycountryFossilgasOnshorewindSolarPV2021USD/MWhRatiotofossilgasRatiotofossilgas268.45.3259.56.3270.36.4245.45.6223.99.3210.62.4208.14.4210.65.0203.65.1197.97.1180.03.2149.05.0128.12.82.788.32.492.42.082.92.053.81.851.91.2RequiredannualcapitalrecoveryPotentialrevenueOffshorewind2021USD/kW/year2021USD/kW/yearRatioUnitedKingdom155.5866.85.6Japan379.8545.51.4China199.2505.52.5VietNam190.1362.71.9RequiredannualcapitalrecoveryPotentialrevenueOnshorewind2021USD/kW/year2021USD/kW/yearRatioBrazil80.01016.712.7France87.5767.08.8Italy81.2750.19.2UnitedKingdom105.3736.47.0Germany79.9650.88.2RepublicofKorea165.1583.33.5China61.8496.08.0Japan214.3448.42.1Turkey114.2440.03.9Argentina254.5401.41.6India71.1370.25.2VietNam108.9326.13.0Australia70.0301.14.3Chile105.5296.32.8Canada77.9203.72.6UnitedStates78.5203.42.6Mexico89.5161.21.8RequiredannualcapitalrecoveryPotentialrevenueSolarPV2021USD/kW/year2021USD/kW/yearRatioBrazil65.9427.06.5France39.8312.97.9Italy44.9340.77.6UnitedKingdom43.1191.74.4Germany32.4280.08.7RepublicofKorea56.1252.14.5China33.5210.46.3Japan88.4274.43.1Turkey72.2188.72.6Argentina125.7138.31.1Figure1.8Implied2022revenueforsolarandwindprojectscommissionedin2021,relativetotheirannualcrecoveryrequirementIndia45.3198.84.4VietNam53.7161.93.0Australia57.6167.72.9Chile64.0170.02.7Canada71.264.50.9UnitedStates71.190.81.3Mexico75.899.31.3021,relativetotheirannualcapitalFigure1.9Europeanfossilgaspricesbymonthand15-yearrollingaverage,1989-2022Source:IMF(2022b),GlobalpriceofNaturalgas,EU(PNGASEUUSDM),https://fred.stlouisfed.org/series/PNGASEUUSDM(accessed15June2022).Figure1.10LCOEofnewsolarPV,onshoreandoffshorewindinEuropecomparedtofossilgas-firedCCGTRenewablesin2021OnshorewindSolarPVOffshorewind2021USD/MWh426165Fossilgas:CCGTwithoutCCS2021USD/MWhCCGT50%CF,noCCSCCGT30%CF,noCCSVariableO&M4.04.0FixedO&M12.620.9Capital20.233.7CO239.739.7Fuel68.168.1Fossilgas:CCGTwithCCS2021USD/MWhCCGT50%CF,CCSCCGT30%CF,CCSVariableO&M5.65.6FixedO&M14.624.3Capital48.580.8CO23.83.8Fuel71.671.6tofossilgas-firedCCGTplants,2021/2025BiomassOffshorewindHydroSolarphotovoltaicOnshorewindFigure1.11Estimatedsavingsin2022afternewrenewablecapacityaddedin2021hasdisplacedfossilfuelgenerationin2022,bygenerationtechnologySavingsin2022(2021USDbillion)5.056.629.0911.2723.30capacityaddedin2021hasdisplacedfossilfuelSavingsin2022(2021USDbillion)BiomassOffshorewindHydroBrazil0.4960.082India0.0230.350UnitedKingdom1.4780.001UnitedStatesFrance0.109Germany0.113Japan0.3100.006Turkey0.1740.162RepublicofKorea0.163Italy0.246AustraliaCanadaRussianFederationSouthAfricaIndonesia0.098Argentina0.003MexicoSaudiArabiaChina3.4464.3806.170Figure1.12Estimatedsavingsin2022fromnewrenewablecapacityaddedin2021thatdisplacesfossilfuelgeneration,byG20countryandgenerationtechnologySolarphotovoltaicOnshorewind0.8183.5171.5250.4200.0300.1940.1851.1890.4170.7520.2960.8400.8310.0060.0670.5120.5480.0070.0480.2550.1340.1650.0240.2180.2090.0390.1440.0020.0670.0160.0390.0225.23611.936dedin2021thatdisplacesfossilfuelLargedatafile.Dataavailableonrequest.Email:costs@irena.orgFigure1.13Germany:Estimatedhourlynetcostsavingsfromrenewablegenerationandwholesaleelectricityprices,January-May2022olesaleelectricityWind(2021USDbillion)JanuaryFebruaryMarchAprilMayAustria0.1990.1860.1560.1600.078Belgium0.1970.3100.1990.2070.124CzechRepublic0.0170.0200.0140.0130.008Denmark0.1630.2230.1200.1690.160Estonia0.0070.0080.0060.0070.006Finland0.2470.1860.3270.1380.100Greece0.1640.1430.2570.1650.106Hungary0.0170.0170.0120.0150.006Ireland0.1870.2670.2600.1520.154Lithuania0.0390.0390.0260.0330.024Netherlands0.4360.5720.3990.0000.000Poland0.3500.3770.2460.3160.233Portugal0.2470.1650.4340.2530.168Romania0.1970.1240.2310.1650.072Slovakia0.0000.0000.0000.0000.000Italy0.4840.4140.5900.5160.156France0.5730.8760.9280.6990.403Spain1.0180.8161.8211.1800.911Germany3.1093.8452.3502.5021.572JanuaryFebruaryMarchAprilMayAustria0.1990.3840.5400.7010.778Belgium0.1970.5070.7060.9131.036CzechRepublic0.0170.0380.0520.0650.073Denmark0.1630.3860.5050.6740.834Estonia0.0070.0150.0210.0280.034Finland0.2470.4320.7590.8970.997Greece0.1640.3070.5640.7290.835Hungary0.0170.0340.0460.0610.067Ireland0.1870.4540.7140.8661.020Lithuania0.0390.0780.1040.1370.160Netherlands0.4361.0071.4061.4061.406Poland0.3500.7280.9741.2891.522Portugal0.2470.4120.8461.0981.266Romania0.1970.3210.5520.7170.789Slovakia0.0000.0000.0000.0000.000Italy0.4840.8981.4882.0042.159France0.5731.4492.3773.0753.478Spain1.0181.8353.6564.8365.747Figure1.14Estimatedfossilfuelimportsavoidedduetosolarandwindgeneration,19Europeancountries,January-May2022Wind,runningtotal(2021USDbillion)Germany3.1096.9539.30411.80613.377Solar(2021USDbillion)JanuaryFebruaryMarchAprilMayAustria0.0060.0090.0230.0180.018Belgium0.0190.0410.1620.1560.177CzechRepublic0.0120.0240.0810.0530.064Denmark0.0020.0070.0210.0310.033Estonia0.0000.0010.0030.0070.009Finland0.0000.0020.0090.0090.014Greece0.0580.0610.1210.1210.122Hungary0.0230.0320.0870.0620.070Ireland0.0000.0000.0000.0000.000Lithuania0.0020.0040.0170.0070.006Netherlands0.0460.0960.4050.0000.000Poland0.0140.0340.1520.1970.152Portugal0.0290.0300.0460.0530.056Romania0.0120.0150.0350.0290.034Slovakia0.0040.0060.0170.0110.014Italy0.2470.3170.6740.6280.614France0.1310.1610.3500.3430.449Spain0.3200.3400.4370.6350.780Germany0.2100.4621.7691.3671.633JanuaryFebruaryMarchAprilMayAustria0.0060.0150.0380.0560.074Belgium0.0190.0600.2220.3780.555CzechRepublic0.0120.0360.1170.1690.233Denmark0.0020.0090.0300.0610.094Estonia0.0000.0010.0040.0110.020Finland0.0000.0020.0110.0190.033Greece0.0580.1190.2410.3610.483Hungary0.0230.0550.1410.2030.273Ireland0.0000.0000.0000.0000.000Lithuania0.0020.0060.0230.0300.036Netherlands0.0460.1430.5470.5470.547Poland0.0140.0480.2000.3970.549Portugal0.0290.0590.1050.1580.213Romania0.0120.0260.0610.0900.124Slovakia0.0040.0090.0270.0380.052Italy0.2470.5641.2381.8662.480France0.1310.2930.6420.9851.434Spain0.3200.6601.0961.7312.511ancountries,Solar,runnningtotal(2021USDbillion)Germany0.2100.6722.4413.8085.441JanuaryFebruaryMarchAprilMay2021USDbillion8.78419.01331.79742.21050.733Solarandwind,runnningtotalIndex(January2019=100)AluminumCobaltCopperIronoreNickelJanuary2019100.0100.0100.0100.0100.0February2019100.578.9106.1116.5110.1March2019100.977.0108.4115.8113.0April201999.682.3108.4125.7110.8May201996.183.9101.3135.3104.3June201994.770.899.0145.7103.7July201996.967.2100.0159.0117.6August201993.974.096.1124.3136.7September201994.687.897.0122.7153.2October201993.186.696.9117.8147.9November201995.787.298.7110.2131.7December201995.682.4102.3121.0120.0January202095.779.1101.6126.6117.2February202091.182.495.8116.5110.3March202086.976.587.3117.9102.8April202078.872.685.2111.4102.4May202079.172.688.2121.5105.7June202084.671.496.9137.4110.4July202088.770.1107.3143.6116.3August202093.880.9109.6159.7126.5September202094.182.3112.9163.6128.9October202097.481.6113.0158.6132.3November2020104.479.2119.0164.3137.2December2020108.778.3130.9203.5146.0January2021108.193.1134.2221.7155.0February2021112.1116.7142.6215.9161.3March2021118.2128.8151.3221.7142.4April2021125.1120.4157.0237.0143.4May2021131.3108.6171.2269.8152.8June2021132.0108.5162.2287.0156.0July2021134.7126.9159.1285.0163.3August2021140.4126.9157.8215.5166.1September2021152.9127.3157.0151.2168.2October2021158.3134.6165.5152.2168.0November2021142.2148.4163.8119.9173.0December2021145.4170.4160.8146.9173.7January2022157.9176.7161.8157.8210.6February2022171.1164.3199.0March2022184.4169.1218.7April2022171.1168.1213.6May2022149.7155.2186.7Figure1.15Keyinternationalcommoditypricetrends(monthly)andGermansteelproductproducerpriceindex(annual),2015-Q12022ChangeinindexvalueAluminumCobaltCopperIronoreNickel(January2019toMay2022)50%-100%55%87%-100%IndexofproducerpricesofindustrialproductsGermanyProducerpriceindexforindustrialproducts(2015=100)GP2009(5-digitcodes):Industrialprodu20152016201720182019GP09-24102Ingotsando10092.4101.3112.7112.8GP09-24103Hotrolledfl10093.8111118.5113.5GP09-24104Flatsteel10095.2112.2116.3113.9______________©FederalStatisticalOffice,Wiesbaden2022created:2022-05-30/17:44:25producerpriceindexProducerpriceindexforindustrialproducts:Germany,years,productclassification(GP20092-/3-/4-/5-/6-/202220202021Q2107.6133.5164.8101.5145.8184.2667107.8154.4203.1333Figure1.16SolarPVmodulepricesinEuropebymoduletype,2020-2022MonthlychangeHighefficiencyJanuary,20200%HighefficiencyFebruary,20201%March,20206%April,20204%May,20201%June,20201%July,20200%August,20200%September,20200%October,2020-1%November,20203%December,20206%January,20215%February,20218%March,20213%April,20217%May,20218%June,202111%July,20219%August,202111%September,20218%October,202110%November,202111%December,202113%January,20229%February,20229%March,20229%April,202215%May,202221%MainstreamJanuary,20200%MainstreamFebruary,20202%March,20204%April,20202%May,2020-2%June,2020-3%July,2020-9%August,2020-10%September,2020-11%October,2020-11%November,2020-6%MainstreamDecember,2020-4%MainstreamJanuary,2021-3%February,20210%March,2021-5%April,2021-1%May,20215%June,20214%July,2021-2%August,20212%September,20212%October,20214%November,202111%December,20219%January,20225%February,20229%March,202210%April,20229%May,202215%LowcostJanuary,20200%LowcostFebruary,20204%March,20206%April,2020-2%May,2020-2%June,2020-5%July,2020-9%August,2020-6%September,20200%October,2020-6%November,2020-6%December,20203%January,2021-1%February,20215%March,20219%April,20214%May,20215%June,202110%July,20218%August,20212%September,2021-4%October,20210%November,20215%December,20214%January,2022-6%February,2022-6%March,2022-3%April,2022-2%May,20220%2021USD/WJanuary,20200.37Highefficiency2020February,20200.372021March,20200.392022eApril,20200.38Mainstream2020May,20200.372021June,20200.382022eJuly,20200.37Lowcost2020August,20200.372021September,20200.372022eOctober,20200.37November,20200.38December,20200.392020-2022eUSD/WJanuary,20210.39Highefficiency0.07February,20210.40Mainstream0.054March,20210.38Lowcost0.004April,20210.40May,20210.40June,20210.41July,20210.40August,20210.41September,20210.40October,20210.41November,20210.41December,20210.42January,20220.40February,20220.40March,20220.40April,20220.43May,20220.45January,20200.29February,20200.30March,20200.30April,20200.29May,20200.28June,20200.28July,20200.26August,20200.26September,20200.26October,20200.26November,20200.27December,20200.28January,20210.28February,20210.29March,20210.27April,20210.29May,20210.30June,20210.30July,20210.28August,20210.29September,20210.29October,20210.30November,20210.32December,20210.32January,20220.30February,20220.32March,20220.32April,20220.32May,20220.33January,20200.20February,20200.20March,20200.21April,20200.19May,20200.19June,20200.19July,20200.18August,20200.18September,20200.20October,20200.18November,20200.18December,20200.20January,20210.19February,20210.21March,20210.21April,20210.20May,20210.21June,20210.22July,20210.21August,20210.20September,20210.19October,20210.20November,20210.21December,20210.20January,20220.18February,20220.19March,20220.19April,20220.19May,20220.202021USD/W0.37700.40200.44700.27800.29600.33200.19300.20400.1970Percentagechange19%19%2%Figure1.17Possibleutility-scalesolarPVtotalinstalledcosttrendsin20222021USD/kWIndia2021590Supplychain212022p611China2021628Supplychain212022p645France2021808Supplychain362022p844Brazil2021824Supplychain282022p852UnitedStates20211,085Supplychain372022p1,123Figure1.18Representativewindturbinepriceevolutionbycostcomponent,2008,2017,2020,2021and20222021USD/kW2022-High2022-LowMaterials406.2352.8Energy6.06.0Labour170.0170.0Installation60.060.0Distribution27.727.7Depreciation46.646.6Legalandfinancial78.978.9R&D24.624.6Margin50.050.0Residual(suppliers/other)62.162.120,2021and2022Figure2.1Globalweighted-averagetotalinstalledcosts,capacityfactorsandLCOEforonshorewind,2010-20212010201120122013201420155thpercentile128112841311125912781318Weightedaverage20422004190419621894172595thpercentile287929143053315731783000Capacityfactor(%)2010201120122013201420155thpercentile20%20%20%20%20%21%Weightedaverage27%28%28%28%29%29%95thpercentile36%38%44%48%51%49%LCOE(2021USD/kWh)2010201120122013201420155thpercentile0.0670.0680.0660.0620.0570.046Weightedaverage0.1020.0960.0880.0890.0800.06995thpercentile0.1400.1450.1210.1240.1250.129Onshorewind2010-2021Totalinstalledcost(2021USD/kW)orewind,2010-20212016201720182019202020211230121512111160108889317291729163615531397132527152765250225232344214420162017201820192020202122%23%25%25%26%28%31%33%35%36%36%39%52%52%54%51%52%56%2016201720182019202020210.0410.0360.0320.0300.0250.0200.0640.0600.0510.0450.0390.0330.1090.1080.0870.0920.0790.064Figure2.2Weighted-averagerotordiameterandnameplatecapacityevolution,2010-2021WindturbinecharacteristicsYearBrazil20101.808320213.98144Canada20102.059020214.27139China20101.477520213.01143France20102.108820212.71118Germany20102.008520214.08137India20101.307720212.02119Japan20102.008020213.0299Netherlands2010--20214.24132Sweden20101.849020213.97144Türkiye20102.409120214.17134UnitedKingdom20102.108720213.45122UnitedStates20101.808420213.07129Vietnam2010-20214.24146NameplateCapacity(MW)RotorDiameter(m)Figure2.3Windturbinepriceindicesandpricetrends,1997-2021UnitedStates<5MW5-100MW>100MWFeb-971938#N/A#N/ADec-971510#N/A#N/AJan-981478#N/A#N/AMay-98#N/A1248#N/A2585May-98#N/A1248#N/A2585Aug-98#N/A1168#N/A2585Aug-98#N/A1168#N/A2585Nov-98#N/A1449#N/A2585Nov-98#N/A1449#N/A2585Jul-00#N/A#N/A7151664Dec-00#N/A#N/A9941664Mar-01#N/A1154#N/A1455Apr-01#N/A#N/A7381455Feb-02#N/A963#N/A1284Apr-02#N/A#N/A7311284May-02#N/A874#N/A1284Jun-02#N/A#N/A9801284Aug-02#N/A875#N/A1284Dec-02#N/A#N/A9921284May-03#N/A1193#N/A1313Jun-03#N/A#N/A11521313Jul-03#N/A1228#N/A1313Dec-04#N/A#N/A11801324Aug-04#N/A1236#N/A1324Mar-05#N/A1350#N/A1227May-05#N/A1568#N/A1227Nov-05#N/A#N/A15421227Jan-06#N/A#N/A15781143May-06#N/A#N/A15611143Jun-06#N/A#N/A14251143Jul-06#N/A#N/A14711143Jul-06#N/A#N/A14711143Sep-06#N/A#N/A13621143Sep-06#N/A#N/A13621143Mar-07#N/A#N/A15431173Mar-07#N/A#N/A15431173Mar-07#N/A#N/A15431173ChineseturbinepricesApr-07#N/A1409#N/A1173May-07#N/A#N/A12261173Jun-07#N/A#N/A16821173Jun-07#N/A#N/A16821173Jun-07#N/A#N/A16821173Jun-07#N/A#N/A16821173Jul-071852#N/A#N/A1173Aug-072383#N/A#N/A1173Sep-07#N/A#N/A16591173Sep-07#N/A#N/A16591173Oct-07#N/A#N/A17571173Oct-07#N/A#N/A17571173Nov-07#N/A#N/A18421173Dec-07#N/A#N/A16311173Jan-08#N/A2062#N/A1128Jan-08#N/A2062#N/A1128Feb-08#N/A#N/A17501128Mar-08#N/A#N/A16621128Apr-08#N/A#N/A21971128Apr-08#N/A#N/A21971128Jun-08#N/A#N/A20301128Aug-081896#N/A#N/A1128Oct-08#N/A1809#N/A1128Nov-08#N/A1837#N/A1128Nov-08#N/A1837#N/A1128Dec-082080#N/A#N/A1128Feb-091475#N/A#N/A1074Mar-09#N/A1713#N/A1074Apr-09#N/A1319#N/A1074May-091601#N/A#N/A1074Jun-09#N/A1760#N/A1074Jul-091941#N/A#N/A1074Jul-091941#N/A#N/A1074Aug-09#N/A#N/A16431074Sep-092014#N/A#N/A1074Oct-09#N/A#N/A19081074Dec-09#N/A#N/A19621074Jan-10#N/A2391#N/A787Jan-10#N/A2391#N/A787Mar-10#N/A1833#N/A787Jun-10#N/A1446#N/A787Jul-101822#N/A#N/A787Jul-101822#N/A#N/A787Jul-101822#N/A#N/A787Aug-10#N/A#N/A1626787Oct-10#N/A1495#N/A787Oct-10#N/A1495#N/A787Feb-11#N/A1471#N/A711Feb-11#N/A1471#N/A711Mar-11#N/A1403#N/A711May-111342#N/A#N/A711May-111988#N/A#N/A711Jun-111428#N/A#N/A711Aug-111976#N/A#N/A711Sep-111975#N/A#N/A711Sep-111975#N/A#N/A711Oct-11#N/A#N/A1586711Oct-11#N/A#N/A1586711Nov-11#N/A#N/A1590711Dec-11#N/A#N/A1216711Jan-12#N/A1767#N/A682Jan-12#N/A1767#N/A682Feb-12#N/A1332#N/A682Feb-12#N/A1332#N/A682Oct-12#N/A1351#N/A682Jan-13#N/A1353#N/A710Jan-13#N/A1496#N/A710May-13#N/A#N/A1436710May-13#N/A#N/A1436710Jul-13#N/A1312#N/A710Nov-13#N/A#N/A1524710Dec-13#N/A1054#N/A710Dec-13#N/A1054#N/A710Dec-13#N/A1054#N/A710Dec-13#N/A1054#N/A710Jan-14#N/A#N/A1054601Mar-14#N/A#N/A988601Apr-14#N/A#N/A1133601May-14#N/A1393#N/A601Jun-14#N/A#N/A1081601Jul-14#N/A1262#N/A601Dec-14#N/A1313#N/A601Jan-15#N/A1339#N/A541Sep-15#N/A#N/A1443541Jan-16#N/A#N/A#N/A551Jul-16#N/A#N/A973551Dec-16#N/A#N/A#N/A551Jun-17#N/A#N/A#N/A559Dec-17#N/A#N/A#N/A559Jun-18#N/A#N/A#N/A544Dec-18#N/A#N/A#N/A528Mar-19518Jun-19#N/A#N/A#N/A518Sep-19518Dec-19518Mar-20543Jun-20550Sep-20555.23174626Dec-20557.461592631Mar-21450Jun-21450Sep-21400Dec-21400Mar-22Jun-22Sep-22Dec-22SOURCE:WISERANDBOLLINGER,2017;BNEF,2018ANDGLOBALDATA,2017;VestasWindSyste1432143214321437143714371437143714371437169816981698VestasAverageSellingPrice169816981698169816981698169816981698169816981698169816981941194119411941194119411941194119411941194119411786178617861786178617861786178617861786178615981598159815981598159815981598159815981637163716371637163716371637163716371637163716371637152915291529152915291486148614861486148614861486148614861486133213321332133213321332133211381138110711071107976976904904955875855911842912854830.225320058946.16917.264373707922.671467688961.011546386905.548708791ATA,2017;VestasWindSystemsA/S,2005-2018;Yangetal.,2017Figure2.4Totalinstalledcostsofonshorewindprojectsandglobalweighted-average,1983-2021Totalinstalledcosts(2021USD/kW)OnshorewindYear5thpercentile95thpercentile1983434154305771198440495136501919854087503150731986392444344524198737174288440519883285329333061989303730863342199034063479370819913058342236771992302733674441199318033370334119941515311932841995217828513029199622412713295119971493253929111998152825502769199915302379278320001029232526232001117421743396200211232155253920036512037240820041154206827652005122119502910200613171988284920071121201027022008123221162961200913352149292220101281204028792011128420092911201213112065304920131259190931552014128618593168201513181721299820161232171227142017121517062761201812131622249920191162154525682020108813972344202189313252144WeightedaverageFigure2.5Onshorewindweighted-averagetotalinstalledcostsin15countries,1984–2021Weightedaveragetotalinstalledcosts(2021USD/kW)OnshorewindCountry198419851986198719881989199019911992Denmark404940323891367933073183344034053210UnitedStates51905127455844443284301134063282Germany4049361235753370Sweden4049361235753370Italy334235753370UnitedKingdom3342361235753662India376037603418Spain361235753370Canada34062906France3575ChinaTürkiyeBrazilJapanMexico1993199419951996199719981999200020012002200320042005312226962608253825032361223721311830177716091777227921651935191618951634199217233278303625642455243325352412238523532380235623642338327830362831273926652628247922382222186622492222327830362831273926652628247923492238215422672109214131423036283127392665262824792030210419002267281622763418341831903076296228492735259821001872215019571679327830362831273926652628247923492220192118661981195615082172216520511781209218251849176332782739266526282479187922381921186120511929284928492735250723932279222218091891175918081839150734772896344133042453225020062007200820092010201120122013201420152016201720182029261724912679215923501993199318361995177320712391250425092485227421041996190919521767172322932287246824212381238121632137210820692030202919962222224524502574244122462443210622502012185016771338213922702442289326793286307421212079222518752683184322562239251816112330247424192431237523392193221619351885169415621319141512671521156314841336122912151216201622712223248925682499219221821838173817121879245320882290231623212824260528382739256226462478217619462051187128162486259723292113199118821877185721152043168915901637166615541512147914051426138513801307135515602534234618572048197720372054185419662599266226862888273527082750274322912021211918191828287824473635323930612435287925912737172414362367294126852329260926562274213020441584201920202021Country%decrease/increase19921992Denmark51%▼162814401382UnitedStates73%▼184818391712Germany58%▼140414071320Sweden67%▼175117941377Italy59%▼198818021940UnitedKingdom42%▼11051076926India75%▼162712771172Spain68%▼254814601368Canada60%▼185016061779France50%▼128213101157China59%▼176413961281Türkiye29%▼163415011150Brazil67%▼237233043131Japan28%▲185415891471Mexico15%▼Figure2.6Onshorewindweightedaveragetotalinstalledcostsinsmallermarketsbycountry,2010-2021Totalinstalledcosts(2021USD/kW)OnshorewindCountryYearArgentina20122461Argentina20132609Argentina20142319Argentina20152233Argentina20172302Argentina20181798Argentina20191566Argentina20201759Argentina20211783Australia20103647Australia20113854Australia20123286Australia20132439Australia20142660Australia20152482Australia20162316Australia20171799Australia20181674Australia20191630Australia20201798Australia20211243Austria20122159Austria20132684Austria20142242Austria20152179Austria20162230Austria20171789Austria20181700Chile20112875Chile20122160Chile20132171Chile20142310Chile20152383Chile20162084Chile20171879Chile20181831Chile20192586Chile20201589Chile20211574WeightedaverageCostaRica20112320CostaRica20123526CostaRica20142704CostaRica20152781CostaRica20162743CostaRica20172213Croatia20112138Croatia20121779Croatia20142606Croatia20151855Croatia20162058Croatia20172058Croatia20201733Croatia20211606Cyprus20101974Cyprus20112089Cyprus20122232Cyprus20132410Cyprus20162023DominicanRep20111479DominicanRep20122592DominicanRep20132273DominicanRep20142326DominicanRep20162638DominicanRep20172140DominicanRep20182193DominicanRep20191820DominicanRep20202136Egypt20101808Egypt20111191Egypt20152026Egypt20161936Egypt20181479Egypt20191518Egypt20201468Egypt20211468Ethiopia20112773Ethiopia20122599Ethiopia20152496Ethiopia20162741Ethiopia20191992Finland20131886Finland20142125Finland20152464Finland20162243Finland20172201Finland20182050Finland20191499Finland20201286Finland20211694Greece20102645Greece20111696Greece20122380Greece20142139Greece20152125Greece20161809Greece20172007Greece20182211Greece20191930Greece20201939Greece20211356Indonesia20172727Indonesia20182097Indonesia20192340Indonesia20202227Ireland20103731Ireland20112272Ireland20122272Ireland20132272Ireland20142301Ireland20152033Ireland20161921Ireland20172120Ireland20182126Ireland20192470Ireland20202320Morocco20101409Morocco20112173Morocco20122097Morocco20132491Morocco20142110Morocco20162201Morocco20181775Morocco2021936Netherlands20101901Netherlands20122319Netherlands20131803Netherlands20142170Netherlands20152754Netherlands20161943Netherlands20172750Netherlands20182494Netherlands20192223Netherlands20202135Netherlands20212156NewZealand20112025NewZealand20143060NewZealand20152605NewZealand20201387NewZealand20211339Norway20122325Norway20132209Norway20151802Norway20161936Norway20172001Norway20182027Norway20191864Norway20201313Norway20211541Pakistan20122854Pakistan20141669Pakistan20152788Pakistan20162873Pakistan20172784Pakistan20182229Pakistan20211870Panama20131984Panama20141815Panama20152192Panama20162193Peru20131863Peru20142976Peru20152635Peru20162096Peru20181311Philippines20133321Philippines20142985Philippines20152960Philippines20162944Philippines20173124Philippines20191958Poland20102755Poland20112370Poland20122363Poland20132429Poland20142189Poland20152034Poland20162023Poland20171507Poland20201532Poland20211691Portugal20102159Portugal20112534Portugal20122602Portugal20132112Portugal20142059Portugal20152092Portugal20161878Portugal20171945Portugal20181842RepublicofKo20102542RepublicofKo20112358RepublicofKo20122537RepublicofKo20152523RepublicofKo20162450RepublicofKo20172398RepublicofKo20182366RepublicofKo20192315RepublicofKo20212407RussianFeder20152478RussianFeder20182101RussianFeder20191614RussianFeder20201663RussianFeder20211468SouthAfrica20122345SouthAfrica20132586SouthAfrica20142473SouthAfrica20152270SouthAfrica20161949SouthAfrica20172096SouthAfrica20191967SouthAfrica20201793SouthAfrica20211884Ukraine20111255Ukraine20122612Ukraine20132692Ukraine20142159Ukraine20172088Ukraine20192187Ukraine20201528Ukraine20211235Uruguay20113604Uruguay20123462Uruguay20132457Uruguay20142520Uruguay20152186Uruguay20172434VietNam20112214VietNam20122909VietNam20132734VietNam20152194VietNam20162216VietNam20172324VietNam20192396VietNam20202412VietNam20211539Figure2.7Onshorewindweightedaverageturbinerotordiameterandhubheightbycountry,2010-2021YearBrazil201079832021112144Canada201078902021104139China201079752021100143France201084882021108118Germany2010106852021148137India20107077202190119Japan20107480202113499Netherlands2010-2021132132Sweden201095902021130144Türkiye201079912021105134UnitedKingdom20106887202171122UnitedStates20108084202196129Vietnam2010202185146HubHeight(m)RotorDiameter(m)Figure2.8Historicalonshorewindweightedaveragecapacityfactorsin15countries,1984–2021Capacityfactor(%)OnshorewindCountry198419851986198719881989199019911992Denmark20.7%22.0%22.0%22.0%19.2%20.5%21.7%22.8%22.1%UnitedStates19.0%20.0%20.0%20.0%20.0%20.0%20.0%20.0%Sweden20.7%21.7%22.8%20.0%Germany20.7%21.7%22.8%20.0%UnitedKingdom20.5%21.7%22.8%21.7%Italy20.5%22.8%20.0%India21.7%19.0%19.0%Spain27.7%27.7%27.7%Canada21.7%20.0%France22.8%ChinaTürkiyeJapanBrazilMexico1993199419951996199719981999200020012002200320042005200621.5%23.0%23.0%21.9%21.2%20.7%18.2%18.2%22.2%27.1%28.3%25.9%23.0%26.3%26.3%27.8%29.5%30.7%31.4%32.9%33.4%30.5%20.0%20.0%20.0%19.0%20.0%20.0%20.0%23.0%20.0%23.0%24.0%23.0%23.0%20.0%25.0%18.0%19.0%19.0%21.0%19.0%19.2%18.3%23.0%25.0%25.1%24.0%23.0%21.1%20.0%20.0%19.0%20.0%20.0%20.0%25.0%22.6%21.2%23.0%25.7%23.3%23.0%20.0%20.0%20.0%19.0%20.0%20.0%20.0%20.0%23.0%20.0%23.0%25.2%22.4%22.9%19.0%19.0%19.0%19.0%20.0%19.0%19.0%18.2%22.5%20.3%21.3%23.8%22.0%21.0%27.7%27.7%27.7%27.7%27.7%28.4%29.1%26.7%26.4%24.8%25.1%23.8%25.1%24.9%27.1%19.0%19.0%22.0%27.3%32.1%28.0%29.0%33.9%32.9%20.0%19.0%20.0%20.0%20.0%21.1%23.0%20.0%26.5%24.0%23.4%24.2%19.0%19.0%20.0%19.0%20.0%23.0%20.0%24.5%23.9%23.1%24.1%30.1%33.6%22.0%21.0%35.0%35.2%36.0%37.0%41.8%2007200820092010201120122013201420152016201720182019202029.0%27.0%28.0%29.0%30.0%34.0%35.0%36.7%39.4%39.0%39.0%34.2%33.5%30.9%32.9%30.5%31.3%34.6%40.0%39.4%41.0%42.1%43.6%43.8%42.5%25.9%24.0%27.2%28.6%27.8%29.6%31.3%29.9%30.3%32.8%33.6%37.0%37.9%37.8%25.0%22.0%23.1%24.0%24.0%24.0%24.1%25.3%26.1%26.9%27.1%31.3%31.1%34.0%24.1%24.0%31.4%30.1%29.5%31.8%30.1%30.0%31.0%33.1%33.4%40.4%32.8%36.8%24.1%23.9%25.3%25.4%25.3%25.5%25.3%25.0%26.0%28.7%30.4%33.0%33.0%32.6%25.2%22.1%24.1%24.7%23.2%23.2%23.4%22.7%23.3%23.6%28.2%34.7%32.2%33.3%23.7%23.5%26.8%26.7%26.7%26.7%26.7%26.7%30.2%31.0%33.5%28.2%38.5%37.9%31.6%31.1%31.2%32.4%33.2%30.4%31.1%32.5%35.3%32.7%34.2%35.7%39.3%38.1%24.1%24.1%26.4%26.5%26.4%26.3%26.5%26.5%26.8%27.6%26.2%30.8%33.0%32.2%25.9%24.7%25.6%25.4%25.2%24.1%23.7%24.9%23.7%25.1%26.6%26.9%31.4%39.4%34.7%25.8%32.6%30.4%32.1%30.6%32.5%37.0%36.8%34.6%34.3%37.3%24.0%24.0%25.0%25.0%25.0%25.0%19.7%25.3%24.7%25.0%34.6%40.8%45.9%37.1%36.0%42.9%44.1%45.6%45.6%45.5%47.4%47.5%46.7%51.2%49.0%41.8%42.1%40.7%40.2%40.9%45.4%41.6%40.7%38.0%35.6%38.9%43.5%35.0%36.1%2021Country%increaseDenmark88%▲45.1%UnitedStates137%▲36.9%Sweden78%▲27.7%Germany34%▲41.1%UnitedKingdom101%▲33.0%Italy61%▲35.2%India62%▲42.5%Spain54%▲45.2%Canada108%▲35.7%France56%▲36.1%China90%▲39.2%Türkiye30%▲24.3%Japan10%▲51.8%Brazil48%▲37.0%Mexico11%▼Figure2.9Onshorewindweightedaveragecapacityfactorsfornewprojectsinsmallermarketsbycountryandyear,2010-Capacityfactor(%)OnshorewindCountryYearArgentina201241%Argentina201343%Argentina201444%Argentina201544%Argentina201743%Argentina201849%Argentina201948%Argentina202048%Argentina202150%Australia201034%Australia201140%Australia201235%Australia201332%Australia201434%Australia201536%Australia201634%Australia201734%Australia201838%Australia201938%Australia202035%Australia202139%Austria201224%Austria201318%Austria201424%Austria201525%Austria201627%Austria201725%Austria201827%Chile201128%Chile201230%Chile201330%Chile201431%Chile201532%Chile201633%Chile201731%Chile201840%Chile201938%Chile202043%Chile202143%WeightedaverageCostaRica201132%CostaRica201232%CostaRica201448%CostaRica201549%CostaRica201647%CostaRica201754%Croatia201121%Croatia201221%Croatia201421%Croatia201528%Croatia201638%Croatia201738%Croatia202038%Croatia202136%Cyprus201024%Cyprus201123%Cyprus201219%Cyprus201317%Cyprus201623%DominicanRep201133%DominicanRep201232%DominicanRep201333%DominicanRep201422%DominicanRep201642%DominicanRep201752%DominicanRep201839%DominicanRep201943%DominicanRep202043%Egypt201040%Egypt201138%Egypt201546%Egypt201647%Egypt201844%Egypt201946%Egypt202046%Egypt202146%Ethiopia201138%Ethiopia201237%Ethiopia201536%Ethiopia201637%Ethiopia201936%Finland201336%Finland201429%Finland201533%Finland201636%Finland201738%Finland201839%Finland201951%Finland202038%Finland202138%Greece201025%Greece201126%Greece201227%Greece201426%Greece201526%Greece201627%Greece201729%Greece201829%Greece201932%Greece202029%Greece202126%Indonesia201729%Indonesia201838%Indonesia201926%Indonesia202032%Ireland201034%Ireland201133%Ireland201233%Ireland201333%Ireland201429%Ireland201540%Ireland201643%Ireland201738%Ireland201841%Ireland201939%Ireland202027%Morocco201021%Morocco201145%Morocco201242%Morocco201338%Morocco201431%Morocco201626%Morocco201838%Morocco202125%Netherlands201028%Netherlands201225%Netherlands201328%Netherlands201426%Netherlands201532%Netherlands201629%Netherlands201731%Netherlands201850%Netherlands201939%Netherlands202048%Netherlands202141%NewZealand201134%NewZealand201445%NewZealand201544%NewZealand202040%NewZealand202139%Norway201227%Norway201332%Norway201539%Norway201635%Norway201740%Norway201838%Norway201936%Norway202039%Norway202143%Pakistan201231%Pakistan201432%Pakistan201531%Pakistan201636%Pakistan201732%Pakistan201836%Pakistan202138%Panama201331%Panama201431%Panama201532%Panama201624%Peru201346%Peru201446%Peru201553%Peru201652%Peru201852%Philippines201329%Philippines201430%Philippines201529%Philippines201627%Philippines201735%Philippines201933%Poland201022%Poland201122%Poland201223%Poland201320%Poland201424%Poland201527%Poland201628%Poland201728%Poland202038%Poland202136%Portugal201027%Portugal201123%Portugal201227%Portugal201323%Portugal201428%Portugal201528%Portugal201624%Portugal201739%Portugal201839%RepublicofKo201026%RepublicofKo201127%RepublicofKo201225%RepublicofKo201524%RepublicofKo201634%RepublicofKo201734%RepublicofKo201840%RepublicofKo201937%RepublicofKo202137%RussianFeder201533%RussianFeder201845%RussianFeder201936%RussianFeder202037%RussianFeder202137%SouthAfrica201229%SouthAfrica201327%SouthAfrica201430%SouthAfrica201532%SouthAfrica201633%SouthAfrica201740%SouthAfrica201941%SouthAfrica202041%SouthAfrica202145%Ukraine2011Ukraine2012Ukraine201327%Ukraine201427%Ukraine201731%Ukraine201940%Ukraine202042%Ukraine202140%Uruguay201142%Uruguay201245%Uruguay201345%Uruguay201441%Uruguay201543%Uruguay201748%VietNam201132%VietNam201238%VietNam201335%VietNam201532%VietNam201638%VietNam201740%VietNam201934%VietNam202043%VietNam202134%bycountryandyear,2010-2021Brazil36%Canada18%France22%Germany42%Japan44%Netherlands73%Sweden32%Türkiye45%UnitedKingdom22%Figure2.10Changeintheweightedaveragecapacityfactorandwindspeedfornewprojectsbycountrybetween2010and2020Percentagechangecapacityfactorbetween2010-2020-1%-7%-15%-18%-11%7%-14%-20%-21%ndspeedfornewprojectsbycountrybetweenPercentagechangeinwindspeedbetween2010-2021O&Mcosts(2021USD/kW/year)OnshorewindCountryYear2021USD/kW/yearDenmark201355Denmark201445Denmark201553Denmark201641Denmark201735Denmark201837Denmark201949Germany200898Germany201088Germany201283Germany201663Germany201871Germany201953Ireland200852Ireland200970Ireland201094Ireland201183Ireland201258Ireland201361Ireland201491Ireland201545Ireland201639Japan201784Japan2018109Japan201999Norway200870Norway201166Norway201261Norway201364Norway201457Norway201547Norway201744Norway201846Norway201944Sweden200897Sweden2009115Sweden201070Sweden201174Sweden201270Sweden201361Sweden201463Figure2.11Full-service(initialandrenewal)O&Mpricingindexesandweighted-averageO&McostsinDenmark,Germany,Ireland,Japan,Norway,SwedenandtheUnitedStates,2008-2020Sweden201545Sweden201647UnitedStatesofAmerica200876UnitedStatesofAmerica200970UnitedStatesofAmerica201066UnitedStatesofAmerica201167UnitedStatesofAmerica201260UnitedStatesofAmerica201361UnitedStatesofAmerica201460UnitedStatesofAmerica201549UnitedStatesofAmerica201648UnitedStatesofAmerica201747UnitedStatesofAmerica201848UnitedStatesofAmerica201945Full-ServiceRenewalContracts201147Full-ServiceRenewalContracts201240Full-ServiceRenewalContracts201339Full-ServiceRenewalContracts201455Full-ServiceRenewalContracts201538Full-ServiceRenewalContracts201629Full-ServiceRenewalContracts201728Full-ServiceRenewalContracts201924Full-ServiceRenewalContracts202023InitialFull-ServiceContracts200849InitialFull-ServiceContracts200963InitialFull-ServiceContracts201055InitialFull-ServiceContracts201160InitialFull-ServiceContracts201242InitialFull-ServiceContracts201358InitialFull-ServiceContracts201433InitialFull-ServiceContracts201524InitialFull-ServiceContracts201629InitialFull-ServiceContracts201723InitialFull-ServiceContracts201819InitialFull-ServiceContracts201917InitialFull-ServiceContracts202017averageO&McostsinDenmark,Figure2.12LCOEofonshorewindprojectsandglobalweightedaverage,1983–2021LCOE(2021USD/kWh)Year19830.32819840.32019850.29719860.26419870.25619880.21219890.19619900.20919910.20019920.20119930.21119940.19819950.20819960.18619970.16319980.15319990.15120000.16220010.14220020.13120030.11520040.11720050.10920060.11220070.10220080.10820090.10520100.10220110.09620120.08820130.08920140.08020150.06920160.06420170.06020180.05120190.04520200.03720210.033WeightedaverageFigure2.13TheweightedaverageLCOEofcommissionedonshorewindprojectsin15countries,1984–2021LCOE(2021USD/kWh)OnshorewindCountry19841985198619871988198919901991Denmark0.237170.222350.215480.20560.215510.196470.197170.18659BrazilCanada0.194ChinaFrance0.20359Germany0.252980.220340.20862India0.237410.27127Italy0.204370.19419JapanMexicoSpain0.152760.15141Sweden0.252340.219720.20803TürkiyeUnitedKingdom0.204150.205010.19399UnitedStates0.323810.304410.275240.26940.210010.196020.216280.209891984–202119921993199419951996199719981999200020012002200320040.183290.184120.153270.149340.153410.156580.153730.167350.16140.118550.095190.084910.053080.140410.119210.135230.184950.09280.155130.154760.128350.097050.091420.092590.090750.181640.181640.166730.163220.149220.124690.140470.098670.104130.216360.198680.184960.183090.175470.139880.141840.14690.113810.127950.226820.222080.167750.206120.189440.188210.175290.186830.184140.192240.153130.139890.140.248650.248650.248650.233560.226020.207550.210940.203390.198190.152540.138030.149560.124230.210410.205670.193270.182790.187420.174260.172390.164780.158120.132540.148090.133850.115910.168650.143840.140420.131460.123890.120470.117730.113590.105630.109970.106440.100740.097390.107380.226160.221410.209020.198540.203990.190010.188130.180520.146230.167340.129670.140620.086580.078640.208470.191270.193050.182560.187180.174040.172160.164550.113160.128330.133850.133650.14030.120570.116130.101390.095340.090230.080110.0882520052006200720082009201020112012201320142015201620170.099560.123290.118740.119670.116850.091050.088960.063310.055430.045790.126950.091860.096920.08540.11260.109430.088390.08450.078260.064310.055250.053580.0450.082950.087880.099670.100120.099460.111040.098160.108820.100190.087570.080490.08070.065090.102070.096910.084960.089870.090990.082920.078290.076970.072260.068090.063240.058470.046080.126420.127280.119850.160040.132160.134570.118860.105980.096190.08810.082430.075590.082790.144920.149110.137070.164480.151930.142180.135950.121350.113350.101040.090760.08180.079380.115640.132970.104080.110580.085250.089880.082930.095940.0950.091140.077120.066950.053850.131260.128940.127950.136720.146290.135690.155770.140940.102450.097570.094150.072150.08740.166830.170230.148170.185250.16560.154810.12810.178430.12590.063690.056250.083630.098750.085090.066450.077420.075550.069460.069410.058090.101120.104390.12110.119310.114270.11690.110070.095030.091030.076080.061770.056990.056010.145510.145510.13180.149170.143670.114510.109070.105460.083970.090950.073760.063130.056850.067750.127970.094780.084220.084960.092710.080660.072150.065170.132690.133150.126350.138780.076750.102330.105030.093660.093230.088080.080430.069580.066070.078020.088190.086830.098850.110270.102650.108480.092060.075950.062690.056870.052280.045962018201920202021Country%decrease0.043740.045340.03998Denmark83%▼0.04430.034080.032230.02368Brazil83%▼0.053540.056970.03650.02963Canada85%▼0.048290.037570.034590.02801China85%▼0.064480.052890.046690.04346France79%▼0.066810.054780.046760.05136Germany80%▼0.042270.042110.038190.02991India87%▼0.057040.052480.052160.04085Italy80%▼0.142240.121830.107430.14056Japan17%▼0.041350.056750.0460.04214Mexico34%▼0.076940.038420.030920.02518Spain84%▼0.042380.040510.038620.03638Sweden86%▼0.072470.069260.050270.04463Türkiye48%▼0.046250.056470.045740.04224UnitedKingdom79%▼0.042360.038210.034140.02961UnitedStates91%▼Figure2.14OnshorewindweightedaverageLCOEinsmallermarketsbycountryandyear,2010-2021LCOE(2021USD/kWh)OnshorewindCountryYearArgentina20120.110Argentina20130.111Argentina20140.097Argentina20150.093Argentina20170.098Argentina20180.068Argentina20190.061Argentina20200.069Argentina20210.066Australia20100.129Australia20110.110Australia20120.108Australia20130.088Australia20140.085Australia20150.072Australia20160.069Australia20170.056Australia20180.044Australia20190.042Australia20200.047Australia20210.032Austria20120.112Austria20130.169Austria20140.105Austria20150.093Austria20160.083Austria20170.073Austria20180.062Chile20110.130Chile20120.092Chile20130.091Chile20140.089Chile20150.085Chile20160.072Chile20170.068Chile20180.051Chile20190.072Chile20200.039Chile20210.039WeightedaverageCostaRica20110.094CostaRica20120.129CostaRica20140.066CostaRica20150.065CostaRica20160.074CostaRica20170.046Croatia20110.151Croatia20120.125Croatia20140.159Croatia20150.086Croatia20160.085Croatia20170.063Croatia20200.048Croatia20210.046Cyprus20100.131Cyprus20110.133Cyprus20120.165Cyprus20130.193Cyprus20160.106DominicanRep20110.074DominicanRep20120.111DominicanRep20130.077DominicanRep20140.144DominicanRep20160.081DominicanRep20170.052DominicanRep20180.069DominicanRep20190.052DominicanRep20200.058Egypt20100.072Egypt20110.054Egypt20150.064Egypt20160.059Egypt20180.049Egypt20190.047Egypt20200.045Egypt20210.044Ethiopia20110.104Ethiopia20120.098Ethiopia20150.088Ethiopia20160.089Ethiopia20190.061Finland20130.063Finland20140.082Finland20150.077Finland20160.064Finland20170.055Finland20180.049Finland20190.028Finland20200.032Finland20210.037Greece20100.137Greece20110.091Greece20120.109Greece20140.098Greece20150.093Greece20160.078Greece20170.075Greece20180.078Greece20190.065Greece20200.066Greece20210.054Indonesia20170.122Indonesia20180.065Indonesia20190.099Indonesia20200.077Ireland20100.143Ireland20110.095Ireland20120.084Ireland20130.083Ireland20140.105Ireland20150.055Ireland20160.047Ireland20170.054Ireland20180.048Ireland20190.057Ireland20200.071Morocco20100.115Morocco20110.072Morocco20120.072Morocco20130.089Morocco20140.091Morocco20160.106Morocco20180.058Morocco20210.047Netherlands20100.095Netherlands20120.113Netherlands20130.081Netherlands20140.096Netherlands20150.089Netherlands20160.075Netherlands20170.082Netherlands20180.045Netherlands20190.050Netherlands20200.037Netherlands20210.042NewZealand20110.079NewZealand20140.073NewZealand20150.063NewZealand20200.034NewZealand20210.033Norway20120.109Norway20130.087Norway20150.056Norway20160.063Norway20170.054Norway20180.058Norway20190.057Norway20200.038Norway20210.037Pakistan20120.130Pakistan20140.081Pakistan20150.125Pakistan20160.109Pakistan20170.118Pakistan20180.086Pakistan20210.067Panama20130.088Panama20140.078Panama20150.084Panama20160.108Peru20130.057Peru20140.083Peru20150.061Peru20160.049Peru20180.031Philippines20130.154Philippines20140.130Philippines20150.129Philippines20160.129Philippines20170.101Philippines20190.066Poland20100.160Poland20110.138Poland20120.126Poland20130.147Poland20140.106Poland20150.086Poland20160.078Poland20170.059Poland20200.039Poland20210.044Portugal20100.108Portugal20110.139Portugal20120.116Portugal20130.112Portugal20140.086Portugal20150.083Portugal20160.086Portugal20170.052Portugal20180.048RepublicofKo20100.127RepublicofKo20110.120RepublicofKo20120.128RepublicofKo20150.122RepublicofKo20160.080RepublicofKo20170.077RepublicofKo20180.062RepublicofKo20190.064RepublicofKo20210.062RussianFeder20150.098RussianFeder20180.056RussianFeder20190.054RussianFeder20200.054RussianFeder20210.047SouthAfrica20120.116SouthAfrica20130.131SouthAfrica20140.113SouthAfrica20150.091SouthAfrica20160.083SouthAfrica20170.066SouthAfrica20190.057SouthAfrica20200.051SouthAfrica20210.047Ukraine2011Ukraine2012Ukraine20130.145Ukraine20140.119Ukraine20170.098Ukraine20190.077Ukraine20200.053Ukraine20210.048Uruguay20110.116Uruguay20120.101Uruguay20130.071Uruguay20140.075Uruguay20150.060Uruguay20170.052VietNam20110.102VietNam20120.103VietNam20130.105VietNam20150.086VietNam20160.071VietNam20170.067VietNam20190.076VietNam20200.056VietNam20210.048Table2.1TotalInstalledcostrangesandweightedaveragesforonshorewindprojectsbycountry/region,2010and2021Totalinstalledcosts(2021USD/kW)Onshorewind20102021(2021USD/kW)144016673145114926182776292215832534253425348881832251736711127196225633329107931763647401011361920260628601232251327392863114624612734300884213111554181996892714151673755Note:‘OtherAsia’isAsia,excludingChinaandIndia.‘OtherSouthAmerica’isSouthAmericaexcludingBrazil.5thpercentileWeightedaverage95thpercentile5thpercentileAfricaCentralAmericaandtheCaribbeanEurasiaEuropeNorthAmericaOceaniaOtherAsiaOtherSouthAmericaBrazilChinaIndiantry/region,2010and20212021)189229241583158313491738162321821388232512561371154522601663229211501960115715149261057mericaexcludingBrazil.Weightedaverage95thpercentileTable2.2Country-specificaveragecapacityfactorsfornewonshorewindprojects,2010and2021Capacityfactor(%)OnshorewindCountry20102021Brazil365244Canada324539China253642Denmark273944France263635Germany242815India253542Italy253330Japan2424-Mexico4037-8Spain274359Sweden293729Türkiye263952UnitedKingdom304137UnitedStates334537Countrieswithdataonlyavailableforprojectscommissionedin2020.Percentagechange2010-2021%Table2.3RegionalweightedaverageLCOEandrangesforonshorewind,2010and2021LCOE(2021USD/kWh)Onshorewind2010Weightedaverage(2021USD/kW)Africa0.070.0970.111CentralAmericaandtheCaribbean0.0910.0910.091Eurasia0.1280.1280.128Europe0.0860.130.195NorthAmerica0.0660.1030.14Oceania0.1140.1290.14OtherAsia0.1070.1480.16OtherSouthAmerica0.090.1050.136Brazil0.1090.1090.109China0.0670.0830.104India0.0550.090.1135thpercentile95thpercentile2021Weightedaverage(2021USD/kW)0.0410.0490.079---0.0290.0450.0710.0260.0420.0590.0240.0310.0550.0260.0320.040.0380.0480.0740.0340.050.0840.0180.0240.0360.020.0280.0380.0230.030.0345thpercentile95thpercentileFigure3.1Globalweightedaveragetotalinstalledcosts,capacityfactorsandLCOEforPV,2010-202120102011201220132014201520165thpercentile3501269721531760147312491070Weightedaverage480841043124274224781887171795thpercentile7838755066545526534041903386Capacityfactor(%)20102011201220132014201520165thpercentile11.0%10.1%10.5%11.9%10.8%10.8%10.7%Weightedaverage13.8%15.3%15.1%16.4%16.6%16.5%16.7%95thpercentile23.0%26.0%25.6%23.0%24.4%29.0%25.9%LCOE(2021USD/kWh)20102011201220132014201520165thpercentile0.2080.1750.1400.1220.0990.0790.073Weightedaverage0.4170.3110.2330.1790.1610.1210.10695thpercentile0.5210.5180.4160.3750.3570.2860.241Totalinstalledcost(2021USD/kW)20172018201920202021867835744593577148312671046916857312328792432243119602017201820192020202111.5%12.3%10.7%9.9%10.8%17.5%17.9%17.5%16.1%17.2%27.0%27.0%23.9%20.8%21.3%201720182019202020210.0530.0480.0460.0380.0290.0840.0710.0620.0550.0480.2100.1940.1650.1620.120Figure3.2AveragemonthlysolarPVmodulepricesbytechnologyandmanufacturingcountrysoldinEurope,2010to2021(TopchartBottomchart20132021CountryNames2021USD/W2021USD/WAustralia0.8330.356Brazil0.7750.263Canada1.0300.388China0.7870.216France0.7990.280Germany0.7640.339India0.7640.286Italy0.8330.344Japan0.9950.289RepublicofKorea0.7990.320Spain0.7900.309UnitedKingdom0.7640.369UnitedStates0.8680.341bytechnologyandmanufacturingcountrysoldinEurope,2010to2021(top)andaverageyearlymodulepricesbymarketin2013and2021USD/WDec09Jan10Feb10Mar10CrystallineEurope(Germany)3.7293.5703.3353.227CrystallineJapan3.7293.3593.0663.177CrystallineChina2.9472.7262.5602.508Thinfilma-Si3.0562.8312.6112.625Thinfilma-Si/u-SiorGlobalIndex(fromQ42013)2.6562.4272.2912.274ThinfilmCdS/CdTeAllblackHighefficiencyMainstreamLowcostBifacial2013-2021%Difference-57%-66%-62%-73%-65%-56%-63%-59%-71%-60%-61%-52%-61%ulepricesbymarketin2013and2021(bottom)Apr10May10Jun10Jul10Aug10Sep10Oct10Nov10Dec10Jan11Feb113.2113.0112.8872.9212.9572.9203.0963.0192.9122.7542.7493.2112.9802.8572.9062.8942.9363.0452.9682.8632.6252.6502.5162.4372.3912.5442.5602.5832.7202.6482.5542.3682.3212.5982.4682.4512.5292.5442.5032.6342.4622.3752.0132.0082.2342.1421.9852.0581.9872.0542.1552.1592.0832.0292.0241.7391.777Mar11Apr11May11Jun11Jul11Aug11Sep11Oct11Nov11Dec11Jan122.7192.8032.7162.6892.5192.4042.2142.1321.9341.7811.6332.6512.6812.5772.4292.3812.3012.1152.0161.8681.7491.6022.3132.2982.1622.0641.9331.7991.6321.5201.3931.2881.2051.9591.8981.7991.7871.7771.7131.5321.3881.2781.1611.0382.0772.0721.9721.8911.7261.6951.5481.4711.3931.3041.1601.7061.6371.6261.6311.5531.4701.2821.2231.0981.0180.915Feb12Mar12Apr12May12Jun12Jul12Aug12Sep12Oct12Nov12Dec121.6241.5951.5451.4591.3791.3261.2901.3081.2761.2451.2301.6081.5641.5291.4591.3941.3551.3341.3541.3371.3061.3081.2141.1571.1081.0480.9790.9320.8940.8820.8760.8610.8410.9930.9540.9520.9270.8900.8740.8650.8970.8910.8910.8881.1351.1101.0610.9880.9200.8590.8350.8520.8450.8300.8250.8990.8910.8740.8360.7860.7430.7330.7450.7220.7070.732Jan13Feb13Mar13Apr13May13Jun13Jul13Aug13Sep13Oct13Nov131.2261.1941.1781.1941.1781.1811.1711.1451.1491.1581.0981.3041.2551.2081.2401.2231.2121.1871.2071.1951.2051.1140.8330.8110.8200.8420.8150.8590.8520.8820.9000.9200.8940.8800.8260.8200.8420.8300.8740.8820.8980.9000.8170.7800.7600.7650.7550.7360.6850.7120.6990.6980.6980.6600.6430.6260.6120.6040.5980.5320.5570.543MDec13Jan14Feb14Mar14Apr14May14Jun14Jul14Aug14Sep14Oct141.1001.0721.0911.0741.0411.0030.9930.9890.9730.9130.8681.1161.0721.0761.0901.0721.0501.0241.0050.9730.9420.9110.9080.8850.9200.9000.8830.8780.8530.8500.8210.7950.7810.6980.6790.6790.6790.6760.6760.6760.6760.6760.6760.673MonthofdateNov14Dec14Jan15Feb15Mar15Apr15May15Jun15Jul15Aug15Sep150.8540.8440.7640.7340.7130.7090.7330.7250.6990.6960.7360.8830.8870.7770.7590.7480.7560.7940.7990.7830.7940.8120.7550.7580.6880.6720.6420.6500.6840.6880.6870.6960.7230.6730.6730.6510.6510.6510.6360.6360.6360.6210.6210.621Oct15Nov15Dec15Jan16Feb16Mar16Apr16May16Jun16Jul16Aug160.7360.7160.7250.7160.7190.7080.7220.7080.6910.6670.6630.8240.7890.7870.8010.8060.7820.8100.7960.7790.7420.7880.7100.6680.6760.6800.6820.6830.6960.6820.6650.6430.6380.6050.6050.6050.5910.5910.5910.5840.5840.5840.5760.576Sep16Oct16Nov16Dec16Jan17Feb17Mar17Apr17May17Jun17Jul170.6380.6290.6040.5890.5590.5490.5390.5400.5450.7510.7280.7000.6710.6630.6420.6330.6220.6420.6510.6170.5920.5890.5700.5720.5510.5400.5570.5760.5690.5690.5690.5260.5260.5260.5040.5040.4850.4690.6280.6120.5940.5950.6090.6100.6050.6140.6440.7120.6590.6520.6300.6210.6100.6300.6270.6440.5430.5180.5120.4900.4920.4930.5090.5040.5300.3860.3300.3380.3390.3050.3170.3270.3440.366Aug17Sep17Oct17Nov17Dec17Jan18Feb18Mar18Apr18May18Jun180.4690.4690.4540.4540.4540.4460.4460.4460.4370.4370.4370.6600.6660.6570.6430.6100.6130.6220.6210.6050.5830.5500.6600.6790.6570.6560.6230.6260.6220.6070.5790.5450.5250.5440.5490.5270.5020.4800.4830.4900.4750.4610.4310.4130.3750.3660.3610.3470.3370.3390.3440.3570.3290.3040.300Jul18Aug18Sep18Oct18Nov18Dec18Jan19Feb19Mar19Apr19May190.4290.4290.4290.4220.4220.4220.4120.4120.4120.4020.4020.5260.5190.4620.4570.4380.4500.4330.4300.4170.4500.4240.5010.4820.4490.4360.4380.4380.4210.4190.4170.4140.4010.4010.3830.3620.3580.3290.3280.3250.3110.3210.3080.3180.2750.2840.2620.2590.2440.2310.2160.2390.2380.2370.236Jun19Jul19Aug19Sep19Oct19Nov19Dec19Jan20Feb20Mar20Apr200.4020.3920.3920.3920.3830.3830.3830.3450.345260.345260.3157860.4520.4020.3750.4060.4070.3960.3980.3820.3862160.4033510.3960040.4040.3900.3980.3710.3840.3720.3860.3700.3748570.3918270.384690.3090.3190.3050.2900.2910.2910.2810.2890.2953420.2996320.2941750.2260.2360.2230.2200.2100.2210.2220.1970.2044670.2074380.1923450.4400.4540.4420.4680.4510.4430130.4494480.429947May20Jun20Jul20Aug20Sep20Oct20Nov20Dec20Jan21Feb210.3157860.3157860.3051880.3051880.3051880.2949530.2949530.2949530.253750.253750.3974610.3868740.3940520.3942680.3807940.3679720.3822630.4056550.4016380.3992310.3747490.3751510.370170.3696260.368510.3679720.3822630.3929780.3894670.3992310.2839010.2813630.2627010.2587380.2579570.257580.2712830.2788880.279930.290350.1930520.1875750.1791140.1848130.1965390.1839860.1849660.2028280.1947340.2056640.4088170.3985980.3940520.3942680.3807940.3802380.3945940.4183320.4138090.411329Mar21Apr21May21Jun21Jul21Aug21Sep21Oct21Nov21Dec210.253750.297750.297750.297750.254050.254050.254050.260750.260750.260750.392670.407260.4129460.4216020.413760.4237750.4237130.4175080.422320.4295440.3807710.3952820.40080.4095560.4019380.4120030.4001740.4059110.4109060.418240.2736790.2874770.3036360.3011440.2837210.2942880.2942450.3015340.3195930.3165060.2141840.203630.2064730.2168240.2127910.2001160.1883170.1971570.2054530.2034680.392670.407260.4250910.4456930.4492250.4473180.4354830.4407030.4451480.440848Jan22Feb22Mar22Apr22May220.4236170.4137550.4016650.4018930.4028670.4016650.4265280.44660.3041350.315760.3171040.3148180.3323540.1846530.1851010.1902620.1929530.1973350.4344790.4246430.422805FigureB3.1AverageyearlysolarPVmodulepricesbytechnologysoldinEurope,2010to2021and2022Q1.Average(left)a2021USD/W201720182019202020212022Q1Allblack0.6260.5370.4160.390.4140.413Highefficiency0.6410.5210.3980.3770.4020.402Mainstream0.5110.4090.3060.2780.2960.312Lowcost0.3430.2940.2270.1930.2040.187Bifacial0.4510.4120.430.4271and2022Q1.Average(left)andpercentageincrease(right)2021USD/W2017-20182018-20192019-20202020-20212021-2022Q1Allblack-14.10%-22.60%-6.30%6.20%-0.20%Highefficiency-18.70%-23.60%-5.30%6.70%0.00%Mainstream-19.90%-25.30%-9.20%6.50%5.70%Lowcost-14.30%-22.80%-15.10%5.80%-8.50%Bifacial-8.70%4.30%-0.50%Figure3.3TotalinstalledPVsystemcostandweightedaveragesforutility-scalesystems,2010-2021Totalinstalledcost(2021USD/kW)201020112012201320145thpercentile35012697215317601473Weightedaverage4808410431242742247895thpercentile78387550665455265340stems,2010-2021201520162017201820192020202112491070867835744593577188717171483126710469168574190338631232879243224311960Figure3.4Utility-scalesolarPVtotalinstalledcosttrendsinselectedcountries,2010-20212021USD/kW201020112012201320142015201620172018Australia724271055146302131532344201920661593China379635662875221918491428129312130922France573558635186340224841635138413001126Germany388530902455210416781342121811681167India529632632862294620001363117311700831Italy5430508926952134206710190912Japan56944108351032182328255523172203Netherlands120216231225RepublicofKorea942861882401279223182193216416581390Spain489834222818242224281253Türkiye164213171264Ukraine5160420712851409UnitedKingdom619949272915241720371603153613281428UnitedStates480547084631410430252696232919641624VietNam235830082019202020212010-2021130810991023-86%083306740628-83%102609760808-86%094207250694-82%064806170590-89%087008090785-86%217018981693117611261022131309830940-90%080307890816-83%096608570810091308861035106708760848-86%128011471085-77%110609830690Figure3.5Detailedbreakdownofutility-scalesolarPVtotalinstalledcostsbycountry,2021Totalinstalledcost(2021USD/kW)CategoryCostComponentJapanModuleandinverterhardwareModules456.9288.7Inverters125.4114.3BoShardwareRackingandmounting83.2121.7Gridconnection140.187.4Cabling/wiring60.180.1Safetyandsecurity16.813.7Monitoringandcontrol9.824.3InstallationMechanicalinstallation157.9406.3Electricalinstallation150303.3Inspection1854.7SoftcostsMargin147.8107.9Financingcosts10323.9Systemdesign46.413.2Permitting111.732.2Incentiveapplication58.121.5Customeracquisition10.40RussianFederationuntry,2021IndonesiaCroatiaUnitedStatesCanadaIrelandChileAustralia473.8334.1340.8388356323.5355.673.83460.658.639.242.343.955.313784.471.74570.681.262.836.253.45219.181.642.768.894.572.857.464.564.148.250.347.231.4810.528.111109.416.25.44.77.36.73285174.4153.516060.885.228.372.461.797.6125.548.690.715.331.512.720.616.935.542.8313.3126104.39778.5109.295.317.542.518.913.245.284.345.21434.624.934.49.621.91227.5639.17.575.13641.217013.11717.619.816.24.87.972.5029.75.1NetherlandsLatviaSaudiArabiaHungaryPortugalArgentina331.5399.6320.4376322.4343.9323.747.741.474.83244.630.654.9135.494.670.17863.875.478.970.137.889.711290.370.337.327.193.474.65438.667.874.437.523.710.3833.73.24.57.55.26.3226.16.25.110974.378.44532.665.664.289.274.748.95534.371.963.114.21015.22021.231.821.3118.590.2090103.970.789.1714.296.6714.115.29.89.814.216.5158.61024.78625.71183.124.327.83.61.713716.85.705.90003.37.41.5RepublicofKoreaMexicoBrazilSpainSlovakiaTürkiyeFrance359.2369.2263.1309.2289.2353.7280.256.43667.452.44854.648.56435.482.775.466.629.690.641.141.847.872.111030.910429.835.636.148.142.546.84514.812.723.64.4196.27.613.63.4164.79.11.23.252.785.21057532.156.577.624.360.75857.639.141.856.98.49.26.612.7123.38.2119.656.932.15397.141.74718.741.927.24.43.838.63.4178.823.84.87.99.68.77.438.225.633.420.653.512.937.7137.604.741.810.97.101.48.6903.5UnitedKingdomSloveniaDenmarkItalyBelgiumPolandLithuaniaRomania353.4316.2344316.4344.5298.3319.847.436.250.843.648.841.233.85184.660.695.978.584.478.654.645.757.839.371.576.348.625.622.240.916.519.921.135.217.12320.221.124.926.81154.64.45.23.33.56.288.573.360.969.54749.931.238.958.641.958.146.249.240.61.413.22.79.210.5721.864.386.261.581.259.764.773.28.76.87.35.233.211.69.911.297.68.23.812.6288.818.65.47.24.110.40003.401.103.804.241.12.70GreeceBulgariaGermanyAustriaChinaIndia329.9293.1339.4365.3216.328626.5254630.326.329.966.568.292.973.915.946.225.857.712.51572.72716.641.735.728.512.133.314.123.65.45.71215.27.897.612.87.335332.737.630.642.924.560.238.76563.541.919.714.212.64.24.39.15.673.169.838.331.884.328.619.97.32.62.337.738.411.17.739.913.55.95.220.21.85.4812.704.31.4011.310.52.92.70016.83.1Figure3.6Globalaverageinverterloadratiotrend,2010-2021Mounting20102011201220132014201520161-axis1.191.221.231.241.271.261.27Fixed1.191.21.211.211.241.241.23201720182019202020211.261.251.251.241.261.231.241.231.221.28FigureB3.2Behind-the-meterresidentiallithium-ionbatterysystempricesinGermany,Australia,France,ItaLithium-ionGerm2020USD/kWh201420152016Medianprice2803182812645thPercentile185180264995thPercentile438531862178Germany2020Q12021Q12022Q1Medianprice726974843Germany,Australia,France,ItalyandtheUnitedKingdom,2014-Q12022Germany201720182019202020212022Q111121024819809978843532521483472558477176016641422136815241219AustraliaItalyFrance2020Q12021Q12022Q12021Q12022Q12021Q12022Q16707507661106859988801UK2021Q12022Q1778765Figure3.7Globalutility-scalesolarPVprojectLCOEandrange,2010-2021LCOE(2021USD/kWh)20102011201220132014201520165thpercentile0.2080.1750.1400.1220.0990.0790.073Weightedaverage0.4170.3110.2330.1790.1610.1210.10695thpercentile0.5210.5180.4160.3750.3570.2860.241201720182019202020210.0530.0480.0460.0380.0290.0840.0710.0620.0550.0480.2100.1940.1650.1620.120FigureB3.3DriversofthedeclineofLCOEofutility-scalesolarPV(2010-2021)LCOE2021USD/kWh20100.417ModuleOthersoftcostsInstallation/EPC/developmentInverterRackingandmountingOtherBoShardwareCapacityfactorWACCAll-inO&M20210.048PV(2010-2021)Contributionbydriver2021USD/kWhShareOfDecline2010-20210.16445%0.05214%0.04412%0.0329%0.0236%0.0092%0.0195%0.0175%0.0093%100%Figure3.8Utility-scalesolarPVweightedaveragecostofelectricityinselectedcountries,2010-20212021USD/kWh201020112012201320142015Australia0.4240.4310.2610.1500.1240.107China0.3080.2700.1980.1550.1160.087France0.3960.4020.4090.2430.1620.114Germany0.3770.3190.2570.2040.1510.120India0.3520.2240.1910.1900.1240.081Italy0.4200.3950.2010.1780.147Japan0.4390.3140.2600.2310.165NetherlandsRepublicofKore0.4510.4720.1910.2250.1740.160Spain0.3260.2270.1830.1400.1350.079TürkiyeUkraine0.5190.404UnitedKingdom0.5340.4930.2900.2350.1920.150UnitedStates0.2210.2630.2270.2260.1550.143VietNamountries,2010-20212016201720182019202020212020-20210.0820.0900.0740.0710.0540.042-90%0.0750.0660.0500.0470.0400.034-89%0.0900.0810.0680.0630.0550.049-88%0.1060.0960.0920.0760.0660.061-84%0.0770.0700.0510.0400.0380.035-90%0.0730.0640.0590.0560.051-88%0.1660.1310.1210.1120.1040.0860.1190.1330.1010.0970.0910.0780.1530.1030.0850.0780.0600.056-88%0.0500.0460.048-85%0.1270.1200.0960.0870.0670.0640.1360.1390.0950.0930.1170.1420.1160.1180.0880.0750.069-87%0.1300.0950.0740.0620.0600.055-75%0.1760.2540.0740.0660.046201011.0%13.8%201110.1%15.3%201210.5%15.1%201311.9%16.4%201410.8%16.6%201510.8%16.5%201610.7%16.7%201711.5%17.5%201812.3%17.9%201910.7%17.5%20209.9%16.1%202110.8%17.2%Table3.1Globalweighted-averagecapacityfactorsforutility-scalePVsystemsbyyearofcommissioning,2010–2021Year5thpercentileWeightedaverageSource:IRENARenewableCostDatabaseNote:Thesecapacityfactorsarethealternatingcurrent(AC)-to-directcurrent(DC)capacityfactors,giventhatinstalledcostda23.0%26.0%25.6%23.0%24.4%29.0%25.9%27.0%27.0%23.9%20.8%21.3%byyearofcommissioning,2010–202195thpercentileDC)capacityfactors,giventhatinstalledcostdatainthisreportFigureB3.4Globalaverageutility-scalesolarPVlanduse,2010-2021HectaresperMWYearAverageMedian5thpercentile20102.692.371.200320112.572.30651.22220122.412.27951.065720132.452.2751.26420142.202.0341.203820152.121.95751.103720162.172.06851.075320172.051.9590.974420181.991.8620.903820191.941.83350.876320201.941.8680.848520211.941.8860.9258MW95thpercentile5.1274.83553.96774.14753.68543.61063.57993.42763.40823.2763.3232.8524OffshoreWind2010-202120102011201220135thpercentile3163315931982248Weightedaverage487655844942522395thpercentile6739711161866124Capacityfactor(%)20102011201220135thpercentile23%27%29%26%Weightedaverage38%38%40%45%95thpercentile49%42%44%54%LCOE(2021USD/kWh)20102011201220135thpercentile0.1120.1080.1140.092Weightedaverage0.1880.1960.1670.14195thpercentile0.3070.2460.2320.203Figure4.1Globalweighted-averageandrangeoftotalinstalledcosts,capacityfactorsandLCOEforoffshorewind,2010-2021Totalinstalledcost(2021USD/kW)2014201520162017201820192020202123423184299629102278304924162052549955154342490647983844325528586800672712257590560376228724356412014201520162017201820192020202120%28%29%31%25%30%29%30%35%42%40%45%43%43%38%39%45%48%47%51%48%53%47%46%201420152016201720182019202020210.1310.1040.1000.0920.0680.0660.0770.0540.1720.1410.1160.1060.1000.0860.0860.0750.2010.1760.3390.1510.2100.1190.2560.127ndLCOEforoffshoreFigure4.2AveragedistancefromshoreandwaterdepthforoffshorewindinChina,Europeandtherestoftheworld,2000-`Country(China/Europe/RestoftheWorld)YearCapacity(MW)Distancefromshore(m)Europe20106056.2Europe201520065.7Europe2015400115Europe2013400101Europe2020464.849.8Europe201916.898Europe200041Europe200010.512Europe200216020Europe2003234Europe2003607.2Europe200425.210Europe2004602.3Europe2005908.5Europe2006907.5Europe2007906.4Europe200710810Europe200710818Europe200812023Europe2009908Europe2009194.45Europe2009209.331.7Europe201016546Europe2010172.87Europe201018011Europe201030012Europe201148.316Europe2011183.619Europe2012183.619Europe2012316.823Europe201250436Europe201321638Europe20132708Europe2013399.621Europe201363020Europe201410829Europe201428889Europe2014388.814Europe201549.58.8Europe201512923Europe20152108Europe20152198Europe201528854Europe201528870Europe201530257Europe201557612.87Europe20161441.1Europe201658244.2Europe201711116Europe201716546Europe20172566Europe201728890Europe201733247.3Europe201740232Europe201740295Europe201760085Europe201830933Europe201833019Europe201833019Europe201835327Europe201840017Europe201857332Europe201920365.5Europe201925295Europe201937023Europe201938768Europe201939645Europe201940720.9Europe2019497100Europe20191,218120Europe2020301.5Europe2020112105Europe202021952Europe202023550Europe202025240Europe202075222Europe20211922.2Europe20213836.4Europe202160526.4Europe202173222.2Europe201528857Europe20071023Europe201215010Europe201329530Europe201529557Europe201735073Europe2018281Europe2018933Europe201825218.4Europe2019121.5Europe201933613.5Europe202071442Europe202194927.5Europe2001404.7Europe200316510.8Europe200450.6Europe200711011.3Europe20093030Europe20102078.8Europe2017421.55Europe201851.5Europe2001104RestoftheWorld20206012.4China2010328China201010213China201825211China201910010.7China20191858China20192506China20212005China2018905RestoftheWorld2021295RestoftheWorld2021299.2RestoftheWorld2021504.7RestoftheWorld2021753RestoftheWorld20211003China2016508.3China2018775China201730015China201830014China2019562.4China20191122.4China20191322.4China202030022.5China201820018China201930312China201930312China202040019.5China202130312RestoftheWorld20191206RestoftheWorld20201244.448RestoftheWorld2021503RestoftheWorld20211411China201520210China201615225China201815021China201815221China201840016China201912340China201917840China2019302.442China2021303.920China20213208RestoftheWorld2016304.8RestoftheWorld201782RestoftheWorld2017301RestoftheWorld202088RestoftheWorld20206012.4RestoftheWorld2021109.28China201812025China201830023RestoftheWorld20041.320.7RestoftheWorld2021601.84RestoftheWorld2021801.5China2019290.44.7China202110012erestoftheworld,2000-2021OffshoreWaterDepth(m)3033404128406101113122585201218202412.5111737131225182330223429.6151925232624524261822322428733.611361435292739.836363737394126354035373320403718404039.9383838.56353744452027.5254363055205548576931327.512153010254101662520253838158122525252528.310321530323525.4551214.6222218171715323828.2311020252811131323253815Figure4.3Distancefromshoreandwaterdepthforoffshorewindbycountry,2000-2025CountryYearCapacity(MW)Distancefromshore(m)Germany20106056.2Germany201520065.7Germany2015400115Germany2013400101Germany2020464.849.8Germany201916.898Germany201148.316Germany201410829Germany201428889Germany201528854Germany201528870Germany2015301.657Germany201658244.2Germany2017110.716Germany201728890Germany2017332.147.3Germany201740295Germany2019202.5665.5Germany2019252.295Germany201938768Germany201939645Germany2019497100Germany2020112105Germany202232547.6Germany2022865.215Germany202319251Germany202321050Germany202325238Germany202347630Germany202411041Germany201528857Germany2015295.257Germany201735073Germany202324719Germany20044.50.6Germany20221041Germany202424058Germany202424067Germany202425090Germany202440067Germany202548679Germany202558483Germany202590097Belgium201016546Belgium201321638Belgium201716546Belgium2018308.733Belgium2019369.623Belgium2020218.552Belgium2020235.250Belgium202025240Belgium2013295.230Belgium20093030Netherlands200710810Netherlands200710818Netherlands200812023Netherlands201512923Netherlands20161441.1Netherlands201760085Netherlands202075222Netherlands20211922.2Netherlands20213836.4Netherlands2021731.522.2Netherlands202277022.3Netherlands202377018.5Netherlands2025140050Netherlands202335022UnitedKingdom200041UnitedKingdom2003607.2UnitedKingdom2004602.3UnitedKingdom2005908.5UnitedKingdom2006907.5UnitedKingdom2007906.4UnitedKingdom2009908UnitedKingdom2009194.45UnitedKingdom2010172.87UnitedKingdom201018011UnitedKingdom201030012UnitedKingdom2011183.619UnitedKingdom2012183.619UnitedKingdom2012316.823UnitedKingdom201250436UnitedKingdom20132708UnitedKingdom201363020UnitedKingdom2014388.814UnitedKingdom201549.58.8UnitedKingdom20152108UnitedKingdom20152198UnitedKingdom201557612.87UnitedKingdom20172566UnitedKingdom201740232UnitedKingdom201833019UnitedKingdom201833019UnitedKingdom2018352.827UnitedKingdom2018400.217UnitedKingdom2018573.332UnitedKingdom20191218120UnitedKingdom202285532UnitedKingdom20231200131UnitedKingdom2023138689UnitedKingdom20241200131UnitedKingdom20241200165UnitedKingdom20071023UnitedKingdom201215010UnitedKingdom201893.23UnitedKingdom201825218.4UnitedKingdom2019121.5UnitedKingdom201933613.5UnitedKingdom202071442UnitedKingdom202194927.5UnitedKingdom202245015.5UnitedKingdom202457027UnitedKingdom202457038UnitedKingdom20231200165UnitedKingdom20252728UnitedKingdom202555022UnitedKingdom20252400121UnitedKingdom202760539UnitedKingdom202760539UnitedKingdom202761039UnitedKingdom2027360072UnitedKingdom202822522UnitedKingdom202856522Denmark200216020Denmark2003234Denmark2009209.331.7Denmark2013399.621Denmark2019406.720.9Denmark2021604.826.4Denmark20223504.2Denmark2018281Denmark2001404.7Denmark200316510.8Denmark20102078.8Denmark20232404Denmark202332015China2010328China201010213China201825211China201910010.7China20191858China20192506China20212005China2018905China2016508.3China201877.45China201730015China201830014China2019562.4China20191122.4China20191322.4China202030022.5China201820018China2019302.512China2019303.312China202040019.5China2021302.512China201520210China201615225China201815021China2018151.821China201840016China2019122.5540China2019178.240China2019302.442China2021303.920China20213208China201812025China201830023China2022401.520China2019290.44.7China202110012OffshoreWaterDepth(m)30334041284018232622322433.611352939.83540373340402520333445444044254346337333137353940393729.63636354039.93827.527.5182024247363838.56372825.33134.561285201212.51113122523302234152524526182814273737394126371835403636452030552055485755625840434870646464405757111317192035256691215204101662520253158122525252528.310321530321214.622221817171532381113263815Figure4.4Projectturbinesize,globalweightedaverageturbinesizeandwindfarmcapacityforoffshorewind,2000-2021Turbineratingandprojectcapacity(MW)OffshorewindTurbinecapacity(MW)Year5thpercentileWeightedaverage95thpercentile20001.51.62.0720012.02.02.02520022.02.02.016020032.02.22.38320040.72.43.42320053.03.03.09020063.03.03.09020072.02.93.58520082.02.02.012020092.53.24.811020102.13.14.713620112.43.23.58320123.64.04.928920131.74.15.726120142.23.63.620120153.04.26.423120161.75.36.014920173.25.56.923720182.55.48.323520193.816.88.423620203.856.88.56530420214.06.19.5262Averagewindfarmsize(MW)horewind,2000-2021Figure4.5Projectandweightedaverageturbinerotordiameterforoffshorewindbycountry,2010-2021OffshorewindYearWeightedaveragerotordiameter(m)20101123.12011933.220121074.020131194.120141163.620151204.220161415.320171445.520181425.420191576.820201586.820211606.1Weightedaverageturbinecapacity(MW)try,2010-2021Figure4.6Projectandweightedaveragetotalinstalledcostsforoffshorewind,2000-2021Totalinstalledcosts(2021USD/kW)OffshorewindYear20002173268528562001245325012743200236053605360520031064287831152004225832716374200525402540254020062179286328462007305446697215200851655712603120093235461762632010316348766739201131595584711120123198494261862013224852236124201423425499680020153184551567272016292742484753201729104880574720182266479558712019304938446228202024083221551220212052285856415thpercentileWeightedaverage95thpercentileSourceCostbreakdownShareoftotalinstalledcostsEurope(2015)Turbine40.6%Europe(2015)Installation17.3%Europe(2015)Foundations16.1%Europe(2015)ElectricalInterconnection15.7%Europe(2015)Development2.7%Europe(2015)Contingency&Other7.7%GenericOECDaverage(2019)Turbine37.5%GenericOECDaverage(2019)Installation14.1%GenericOECDaverage(2019)Foundations14.4%GenericOECDaverage(2019)ElectricalInterconnection17.0%GenericOECDaverage(2019)Development3.5%GenericOECDaverage(2019)Contingency&Other13.5%IEAWind,generic(2016)Turbine39.5%IEAWind,generic(2016)Installation12.9%IEAWind,generic(2016)Foundations16.9%IEAWind,generic(2016)ElectricalInterconnection14.6%IEAWind,generic(2016)Development6.5%IEAWind,generic(2016)Contingency&Other9.7%IEAWind,generic(2017)Turbine37.6%IEAWind,generic(2017)Installation15.9%IEAWind,generic(2017)Foundations15.9%IEAWind,generic(2017)ElectricalInterconnection13.3%IEAWind,generic(2017)Development2.9%IEAWind,generic(2017)Contingency&Other14.3%JRC(2017)Turbine43.0%JRC(2017)Installation14.0%JRC(2017)Foundations18.0%JRC(2017)ElectricalInterconnection8.0%JRC(2017)Development7.0%JRC(2017)Contingency&Other10.0%UnitedKingdom(2019)Turbine40.7%UnitedKingdom(2019)Installation17.9%UnitedKingdom(2019)Foundations13.8%UnitedKingdom(2019)ElectricalInterconnection13.2%UnitedKingdom(2019)Development2.7%UnitedKingdom(2019)Contingency&Other11.6%UnitedStates(2013)Turbine33.0%UnitedStates(2013)Installation19.0%UnitedStates(2013)Foundations22.0%UnitedStates(2013)ElectricalInterconnection12.0%UnitedStates(2013)Development2.0%UnitedStates(2013)Contingency&Other12.0%UnitedStates(2017)Turbine34.3%Figure4.7Representativeoffshorewindfarmtotalinstalledcostbreakdownsbycountry/region,2013,2016,2017and2019UnitedStates(2017)Installation8.4%UnitedStates(2017)Foundations13.5%UnitedStates(2017)ElectricalInterconnection24.4%UnitedStates(2017)Development5.0%UnitedStates(2017)Contingency&Other14.4%13,2016,2017and2019Figure4.8InstallationtimeperoffshorewindprojectinEurope,2010-2020Year20102.086.620110.859.420123.1161.920132.4143.620142.091.920152.2131.320161.7352.320171.4179.220181.5227.920191.7279.420201.3235.5OffshoreWindProjectAverageConstructionduration(Year)Averagedeliveredcapacityperyearyperproject(MW)Figure4.9Projectandweightedaveragecapacityfactorsforoffshorewind,2000-2021Capacityfactor(%)OffshorewindYear5thpercentile200041%41%41%200128%29%34%200243%43%43%200340%41%43%200430%32%39%200536%36%36%200628%38%38%200726%32%34%200838%39%41%200930%37%42%201023%38%49%201127%38%42%201229%40%44%201326%43%54%201420%35%45%201528%42%48%201630%40%44%201731%45%51%201825%43%49%201930%43%53%202029%38%47%202130%39%46%Weightedaverage95thpercentileFigure4.10Weightedaverageoffshorewindturbinerotordiameterandhubheight2010-2021Year2010831122011809320128010720139011920149011620158712020161041412017100144201810114220191081572020991582021105160Weightedaveragehubheight(m)WeightedAveragerotordiameter(m)Figure4.11CapacityfactorandwindspeedtrendsbyprojectinEurope,2010-2025Year20100%▲0%▲20111%▼5%▼20123%▲0%▼201312%▲1%▲20140%▼3%▲201510%▲3%▲201611%▲4%▲201720%▲3%▲201815%▲2%▲201922%▲4%▲20208%▲2%▲202113%▲3%▲202217%▲1%▼202324%▲0%▲202422%▲4%▲202520%▲5%▲PercentagedifferenceinWeightedAverageCF(%)inreferenceto2010PercentagedifferenceinWAVGWindspeed(M/s)inreferenceto2010Figure4.12OffshorewindcapacityfactorsandspecificpowerOffshorewindCountryTurbinecapacity(MW)CapacityfactorUnitedKingdom8.838%UnitedKingdom8.347%UnitedKingdom8.347%UnitedKingdom8.147%UnitedKingdom7.048%UnitedKingdom7.038%UnitedKingdom7.049%UnitedKingdom7.049%UnitedKingdom6.343%UnitedKingdom6.346%UnitedKingdom6.043%UnitedKingdom6.053%UnitedKingdom6.050%UnitedKingdom5.038%UnitedKingdom4.038%UnitedKingdom4.040%UnitedKingdom3.637%UnitedKingdom3.641%UnitedKingdom3.641%UnitedKingdom3.640%UnitedKingdom3.641%UnitedKingdom3.638%UnitedKingdom3.639%UnitedKingdom3.547%UnitedKingdom3.342%UnitedKingdom3.037%UnitedKingdom3.035%UnitedKingdom3.043%UnitedKingdom51%UnitedKingdom37%UnitedKingdom38%Netherlands8.047%Netherlands3.048%Netherlands40%Netherlands49%Germany8.447%Germany8.341%Germany8.147%Germany7.047%Germany7.047%Germany6.553%Germany6.345%Germany6.342%Germany6.239%Germany6.246%Germany6.245%Germany6.045%Germany6.050%Germany5.040%Germany5.040%Germany5.046%Germany5.035%Germany5.051%Germany4.050%Germany3.844%Germany3.638%Germany3.640%Germany3.648%Germany3.648%Germany3.651%Germany2.338%Germany46%Germany46%Germany40%Germany46%Germany46%Germany42%Germany48%Denmark8.350%Denmark7.040%Denmark3.654%Denmark2.344%Denmark50%Denmark54%Denmark36%Belgium9.543%Belgium8.440%Belgium8.440%Belgium8.443%Belgium7.441%Belgium6.236%Belgium3.345%Belgium3.045%Belgium3.038%Belgium47%Specificpowerofwindturbines417391391382376376376376338338322322445445400350335305365398393385376376346349337493493493322340349473473428401301333400318318318318339379376318450383383398395335305Figure4.13OffshorewindprojectandglobalweightedaverageLCOEsandauction/PPAprices,2000-2021LCOEandauction/PPAprices(2021USD/kWh)OffshorewindYear20000.1250.1710.30820010.1360.1610.16620020.1350.1350.13520030.0800.1260.13820040.1230.1780.19520050.1510.1510.15120060.1490.1490.17020070.1480.2140.39420080.1720.2110.23320090.1560.1950.24420100.1120.1880.30720110.1080.1980.65120120.1140.1670.23220130.0920.1670.43320140.1310.1720.20120150.1040.1410.17620160.1000.1160.33920170.0920.1060.15120180.0680.1000.21020190.0660.0860.11920200.0770.0860.25620210.0540.0750.1275thpercentileWeightedaverage95thpercentileTable4.1:ProjectcharacteristicsinChinaandEuropein2010,2015and20212010201520202021Projectsize(MW)China67109350245Europe155270347591Distancefromshore(km)China12102112Europe18494123Waterdepth(m)China9122931Europe21293939Hubheight(m)China90103102Europe838797108Rotordiameter(m)China130162163Europe112119162159Turbinesize(MW)China2.845.96.7Europe3.14.27.98.5TheaverageoffshorewindfarminChinavsEuropeTable4.2:Regionalandcountryweighted-averagetotalinstalledcostsandrangesforoffshorewind,2010and2021Totalinstalledcosts(2021USD/kW)Offshorewind2010(2021USD/kW)298146805240China291246385152Japan511351135113RepublicofKorean.a.n.a.n.a.368348836739Belgium633463346334Denmark342234223422Germany673967396739Netherlands429942994299UnitedKingdom422547535072Countrieswheredatawereonlyavailableforprojectscommissionedin2020,not2021.TheNetherlandshadnoprojectscommissionedin2010,sodataforprojectscommissioned5thpercentileWeightedaverage95thpercentileAsiaEuropehorewind,2010and20212021(2021USD/kW)185928766917240628573474520155506030523862787317185927756917337135453876228922892289360337394452169524496424236330576495missionedin2020,not2021.odataforprojectscommissionedin2015areshown.5thpercentileWeightedaverage95thpercentileTable4.3:Weighted-averagecapacityfactorsforoffshorewindprojectsinsixcountries,2010and2021Capacityfactor(%)Offshorewind20102021Belgium38418China303723Denmark445014Germany4642-9Japan28307Netherlands4846-4UnitedKingdom364833Countrieswheredatawereonlyavailableforprojectscommissionedin2020,not2021TheNetherlandshadnoprojectscommissionedin2010,sodataforprojectscommissionedin2015areshownPercentagechange2010-2021%15areshownTable4.4RegionalandcountryweightedaverageLCOEofoffshorewind,2010and2021LCOE(2021USD/kWh)Offshorewind2010(2021USD/kW)Asia0.1270.1870.219China0.1190.1780.196Japan0.1870.1870.187RepublicofKorean.a.n.a.n.a.Europe0.1270.1630.297Belgium0.2260.2260.226Denmark0.1080.1080.108Germany0.1770.1790.186Netherlandsn.a.n.a.n.a.UnitedKingdom0.2010.2100.217Countrieswheredatawereonlyavailableforprojectscommissionedin2020,not2021.5thpercentileWeightedaverage95thpercentile2021(2021USD/kW)0.0690.0830.1120.0640.0790.1030.1840.1960.2120.1330.1800.2270.0510.0650.1400.0820.0830.0860.0410.0410.0410.0800.0810.0830.0480.0590.1280.0490.0540.0922020,not2021.5thpercentileWeightedaverage95thpercentileFigure5.1Globalweightedaveragetotalinstalledcosts,capacityfactorsandLCOEforCSP,2010-20212010201120122013201420155thpercentile485482656428369929353847Weightedaverage942211101857967315777771895thpercentile129991846813573993174999373Capacityfactor(%)2010201120122013201420155thpercentile19.0%23.7%21.5%22.8%25.6%22.3%Weightedaverage30.0%35.5%27.4%31.0%28.5%40.4%95thpercentile38.8%53.1%38.8%43.6%31.6%50.5%LCOE(2021USD/kWh)2010201120122013201420155thpercentile0.2740.2520.2240.1680.1280.169Weightedaverage0.3580.3470.3380.2490.2160.22495thpercentile0.4060.4730.4480.3400.2680.289Totalinstalledcost(2021USD/kW)COEforCSP,2010-2021201620172018201920202021321341093618391844949091811376795508690047469091118739320719890165295909120162017201820192020202113.7%29.7%32.0%21.9%40.3%80.0%36.2%38.6%45.1%36.9%41.9%80.0%50.7%42.7%61.3%54.0%45.6%80.0%2016201720182019202020210.1720.1210.0810.1040.0970.1140.2470.2060.1490.2120.1070.1140.3070.2450.2220.3450.1110.114Figure5.2TotalinstalledcostbreakdownofCSPplantsbytechnology(2010/2011and2019/2020)Parabolictrough2021USD/kWShare2010Ownerscosts4345%Engineering4735%Balanceofplant5856%Contingencies7898%Thermalenergystorage8159%HTFsystem8869%Powerblock140115%Solarfield420944%Total9593100%2020Ownerscosts3999%Engineering1684%Balanceofplant2365%Contingencies3378%Thermalenergystorage66015%HTFsystem47011%Powerblock83419%Solarfield134530%Total4449100%nd2019/2020)Solartower2021USD/kWShare2011Tower2942%Ownerscosts9225%Contingencies14208%Thermalenergystorage16489%Powerblock218612%BoPandengineering280416%Receiver286816%Heliostatfield552831%Total17671100%2019Tower1222%Ownerscosts81014%Contingencies82014%Thermalenergystorage58110%Powerblock92816%BoPandengineering2053%Receiver81914%Heliostatfield165228%Total5938100%Figure5.3CSPtotalinstalledcostsbyprojectsize,collectortypeandamountofstorage,2010-20212021USD/kW20102011201220132014MINTotalinstalledcosts38758220651528283144MAXTotalinstalledcosts13304192641919799317738storage,2010-20212015201620172018201920202021805170389609333738844449909195201250996097640906453399091Figure5.4CapacityfactortrendsforCSPplantsbydirectnormalirradianceandstorageduration,2010-2021Capacityfactor5thPercentile95thPercentileNostorage22%30%0to4hours20%42%4to8hours32%45%8to10hours40%52%10+hours48%77%dstorageduration,2010-2021Figure5.5AverageprojectsizeandaveragestoragehoursofCSPprojects,2010-2021ProjectsizeMW201020112012201320145thpercentile50.020.029.643.850.0Average5445507516695thpercentile68.850.052.5163.8332.5Storagehours201020112012201320145thpercentile0.00.00.00.00.0Weightedaverage3.55.22.02.70.095thpercentile7.511.38.09.00.0201520162017201820192020202155.044.952.550.045.852.5110.08776751217075110109.0143.597.5200.0120.697.5110.020152016201720182019202020212.92.15.55.01.610.217.55.23.43.79.14.711.017.59.68.75.513.89.612.917.5Table5.1All-in(insuranceincluded)O&McostestimatesforCSPplantsinselectedmarkets,2019-2020(2021USD/kWh)Argentina0.026Australia0.028Brazil0.021China0.022France0.033India0.016Italy0.026Mexico0.017Morocco0.013RussianFederation0.025SaudiArabia0.012SouthAfrica0.013Spain0.025Türkiye0.019UnitedArabEmirates0.019UnitedStatesofAmerica0.025Source:IRENARenewableCostDatabaseCountryParabolictroughcollectorsets,2019-2020(2021USD/kWh)0.0240.0270.0210.0190.0280.0160.0240.0160.0120.0230.0110.0120.0230.0170.0210.022SolartowerFigure5.7LCOEforCSPprojectsbytechnologyandstorageduration,2010-20212021USD/kWh20102011201220132014MINLCOE0.2610.2330.2030.1220.142Weightedaverage0.3580.3470.3380.2490.216MAXLCOE0.4150.4820.5080.3590.29120152016201720182019202020210.1660.2590.2520.0760.1070.0960.1140.2240.2470.2060.1490.2120.1070.1140.2990.3140.2520.2340.4040.1120.114Figure5.8ReductioninLCOEforCSPprojects,2010-2020,bysource2021USD/kWhLCOE20100.358ShareTotalinstalledcost-0.16264%Capacityfactor-0.04417%O&M-0.02410%WACC-0.0229%LCOE20200.107FigureB5.1TroughaperturewidthtrendsforPTCCSPplants(2010-2018/2020)20102018-2020Weightedaveragetroughaperturewidth(m)5.697.04%Difference24%FigureB5.2ReceiveroutlettemperaturesandturbineefficiencytrendsforCSPplants(2010-2019)MeasureNamesYearoperatReceiveroTurbineefficiencypercentwav2010Turbineefficiencypercentwav2019ReceiveroutlettemperatureCelsiusWAV2010395.8971ReceiveroutlettemperatureCelsiusWAV2019485Weighedaveragereceiveroutlettemperature(°C)Weighedaverageturbineefficiency(2010-2019)Turbineefficiencypercentwav0.3813650.44Figure6.1Globalweightedaveragetotalinstalledcosts,capacityfactorsandLCOEforhydropower,2010-2021Hydropower2010-2021Totalinstalledcost(2021USD/kW)201020112012201320145thpercentile842890917920980Weightedaverage1315129613851566179595thpercentile30642847352836264602Capacityfactor(%)201020112012201320145thpercentile31%31%30%33%34%Weightedaverage44%44%46%50%49%95thpercentile66%66%68%71%75%LCOE(2021USD/kWh)201020112012201320145thpercentile0.0210.0210.0230.0230.023Weightedaverage0.0390.0370.0380.0430.04295thpercentile0.0870.0720.0840.0910.114er,2010-2021201520162017201820192020202198989299194910881174123515791871192015051787193921354613575170114111410974045071201520162017201820192020202133%31%23%27%35%29%32%51%50%47%46%48%45%45%80%69%69%70%70%74%74%20152016201720182019202020210.0230.0270.0280.0270.0240.0270.0320.0370.0480.0510.0400.0410.0460.0480.1070.1470.1790.0980.0990.1360.117Figure6.2Totalinstalledcostsbyprojectandglobalweightedaverageforhydropower,2010-2021Totalinstalledcosts(2021USD/kW)HydropowerYear2010842131530262011890129628162012917138535282013920156635992014980179546022015989157946132016892187157512017991192070112018938150541462019108617874040202011631939743320211232213542985thpercentileWeightedaverage95thpercentileTotalinstalledcosts(2021USD/kW)LargeHydropowerYear5thpercentileWeightedaverage95thpercentile201084612912861201188912612378201291613433239201391915853555201498916553797201510111501446520161075192745332017950187270112018104015123589201910851779350920201085193478552021118621353500SmallHydropowerYear5thpercentileWeightedaverage95thpercentile201085413883114201189114853038201291716053534201310061795328120149252399675820159741867294920161468232861432017248333304252201812282617366520199402349371720201424254854622021144220005201Figure6.3Totalinstalledcostsforsmallandlargehydropowerprojectsandtheglobalweighted-average,2010-2021ed-average,Figure6.4Distributionoftotalinstalledcostsoflargeandsmallhydropowerprojectsbycapacity,2010-2015and2016-2021LargeHydropower2010-2015Capacity(MW)4002.84%68494006004.53%1092960080010.59%25566800100026.05%628981000120016.47%39779120014009.97%24075140016007.10%17142160018006.85%16531180020004.19%10126200022002.32%5609220024001.76%4256240026001.34%3227260028002.40%5797280030000.58%1409300032000.29%690320034000.32%767340036000.52%1263360038000.26%625380040000.13%326400042000.27%653420044000.38%910440046000.20%488460048000.03%71480050000.03%73500052000.07%179520054000.04%108560056000.06%157580058000.08%196600060000.01%25620064000.06%136640066000.02%53680072000.01%22740074000.09%219780086000.03%80800092000.02%498400102000.01%308600108000.01%309200136000.02%409800152000.01%2911200174000.02%51Totalinvestment(Bins)2021USD/kWPercentageofcapacityTotalinvestment(Bins)2021USD/kWcapacity,2010-2015and2016-2021SmallHydropower2016-20212010-2015Capacity(MW)Capacity(MW)0.71%11436002.29%1073.59%582180015.84%7417.70%12477100018.11%84715.25%24706120015.63%73111.88%19250140013.67%6399.95%1612616007.78%36411.14%1803918005.43%2547.38%1194820003.89%1829.77%1582022003.86%1807.51%1215924002.00%941.93%311926001.74%812.21%357328001.30%611.83%297230001.75%821.24%200432001.44%671.45%235534000.95%451.99%322536000.67%310.32%52638000.40%190.79%127340000.64%300.25%41242000.44%210.12%19744000.18%80.84%136546000.07%30.67%108648000.08%40.19%30650000.16%80.01%1652000.18%80.08%12856000.22%110.05%8058000.07%30.03%5462000.13%60.01%2464000.02%10.04%6166000.09%40.45%73368000.06%30.13%21270000.20%90.06%9378000.20%90.05%8082000.21%100.01%1696000.17%80.03%46106000.11%50.01%160.01%110.31%5000.01%19PercentageofcapacityTotalinvestment(Bins)2021USD/kWPercentageofcapacitySmallHydropower2016-2021Capacity(MW)4001.04%108001.04%1010001.91%1812004.25%41140012.22%11716008.77%84180015.84%152200010.79%10422008.83%8524006.58%6326004.34%4228002.72%2630001.42%1432001.85%1834003.06%2936000.31%338001.93%1940002.32%2242001.43%1444003.81%3748000.83%850001.25%1256000.03%058000.70%762000.83%868000.29%370000.04%074000.19%288000.27%3138000.21%2160000.89%9Totalinvestment(Bins)2021USD/kWPercentageofcapacityTotalinstalledcosts(2021USD/kW)RegionPeriod5thpercentileWeightedaverageAfrica2010-20157031826Africa2016-202114372535Brazil2010-201512411809Brazil2016-202110951521CentralAmericaandtheCaribbean2010-201513732984CentralAmericaandtheCaribbean2016-202116493576China2010-20158741216China2016-20219261596Eurasia2010-201511231545Eurasia2016-202110332203Europe2010-201513372716Europe2016-20217902050India2010-20159761664India2016-20218081432MiddleEast2010-2015588770MiddleEast2016-202114131787NorthAmerica2010-201512232802NorthAmerica2016-202118963588Oceania2010-201527523967Oceania2016-202141284128OtherAsia2010-20159921561OtherAsia2016-202110161755OtherSouthAmerica2010-201511032238OtherSouthAmerica2016-202115882233Figure6.5Totalinstalledcostbyprojectandcapacityweightedaveragesforlargehydropowerprojectsbycountry/region,2010-202195thpercentile528366544651324741184597180834524406331492178367276228292315264371737961451341282961371541154954werprojectsTotalinstalledcosts(2021USD/kW)RegionPeriod5thpercentileWeightedaverageAfrica2010-201526693350Africa2016-202125803514Brazil2010-20159662399Brazil2016-202115882213CentralAmericaandtheCaribbean2010-201519253032China2010-20158501214China2016-202145254525Eurasia2010-201513523284Eurasia2016-202114162826Europe2010-201512594334Europe2016-202119823492India2010-201511631804India2016-202112751864Oceania2010-201533063485OtherAsia2010-201510831840OtherAsia2016-202112242322OtherSouthAmerica2010-201520202912Figure6.6Totalinstalledcostbyprojectandcapacityweightedaveragesforsmallhydropowerprojectsbycountry/region,2010-202195thpercentile47895028360928954023158745256038456587287655300425123989370845674157werprojectsFigure6.7LargehydropowerprojectLCOEandcapacityweightedaveragesbycountry/region,2010-2021LCOE(2021USD/kWh)RegionPeriod5thpercentileWeightedaverageAfrica2010-20150.0200.050Africa2016-20210.0290.063Brazil2010-20150.0280.035Brazil2016-20210.0340.038CentralAmericaandtheCaribbean2010-20150.0440.101CentralAmericaandtheCaribbean2016-20210.0450.080China2010-20150.0210.032China2016-20210.0220.036Eurasia2010-20150.0290.050Eurasia2016-20210.0320.060Europe2010-20150.0500.130Europe2016-20210.0470.079India2010-20150.0350.050India2016-20210.0260.044MiddleEast2010-20150.0430.043MiddleEast2016-20210.0440.069NorthAmerica2010-20150.0440.079NorthAmerica2016-20210.0410.066Oceania2010-20150.0720.140OtherAsia2010-20150.0280.046OtherAsia2016-20210.0260.045OtherSouthAmerica2010-20150.0250.046OtherSouthAmerica2016-20210.0330.046on,2010-202195thpercentile0.1250.1700.0900.0670.2290.1470.0510.0650.1170.1100.3620.1950.0770.1050.0430.1020.1490.1380.2160.0780.0860.0760.105Figure6.8SmallhydropowerprojectLCOEandcapacityweightedaveragesbycountry/region,2010-2021LCOE(2021USD/kWh)RegionPeriod5thpercentileWeightedaverageAfrica2010-20150.0840.100Africa2016-20210.0650.085Brazil2010-20150.0280.057Brazil2016-20210.0420.053CentralAmericaandtheCaribbean2010-20150.0550.077China2010-20150.0210.035China2016-20210.1290.129Eurasia2010-20150.0300.085Eurasia2016-20210.0290.059Europe2010-20150.0360.148Europe2016-20210.0530.086India2010-20150.0360.059India2016-20210.0400.050Oceania2010-20150.1110.111OtherAsia2010-20150.0340.054OtherAsia2016-20210.0330.055OtherSouthAmerica2010-20150.0380.062OtherSouthAmerica2016-20210.3220.322on,2010-202195thpercentile0.1390.1090.1270.0700.1030.0560.1290.1700.0820.4010.1910.1030.0680.1110.0970.1410.0960.322Table6.1Totalinstalledcostbreakdownbycomponentandcapacity-weightedaveragesfor25hydropowerprojectsinChinChina,IndiaandSriLanka2010-2016174518336161613Europe2021TypeofHydroShareoftotalinstalledcosts(%)CivilMechanicalLarge-scaleReservoirStorage(highhead)7010Large-scaleRunofriver(lowhead)5030Small-scaleRunofriver5030Pumpedstorage30-5020-30Source:IRENARenewableCostDatabaseandInternationalHydropowerAssociation(IHA)ProjectcomponentShareoftotalinstalledcosts(%)MinimumWeightedaverageCivilworksMechanicalequipmentPlanningandotherGridconnectionCostoflandgesfor25hydropowerprojectsinChina,IndiaandSriLanka,2010-2016andEurope2021656629178talinstalledcosts(%)Electrical20202030-40ociation(IHA)talinstalledcosts(%)MaximumTable6.2:Totalinstalledcostsforhydropowerbyprojectandweightedaveragebycapacityrange,2000-20212000-20210-5083851-100875101-150923151-200837201-250920251-300838301-350930351-400675401-450451-500988501-550551-600601-650651-700770701-750966751-800801-850851-900956901-950658Capacity(MW)5thpercentile(2021USD/kW)weightedaverage(2021USD/kW)1634184217561729178920861990169111971995159211141998135518291071145219971442107115741178183316281101tyrange,2000-2021133895thpercentile(2021USD/kW)356337623516313834043869449032943064257135002593335226852034222226261862Table6.3Hydropowerprojectcapacityfactorsandcapacityweightedaveragesforlargehydropowerprojectsbycountry/rLargeHydropower2016-2021Africa28477134Brazil51618039CentralAmerica27486333China31455735Eurasia28436129Europe14417016India29476321NorthAmerica18377834Oceania253847OtherAsia37466537OtherSouthAmerica466285472010-20155thpercentile(%)Weighted-average(%)95thpercentile(%)5thpercentile(%)n.a.werprojectsbycountry/region,2010-20212016-20215479455751554655426635584260527249746079Weighted-average(%)95thpercentile(%)n.a.n.a.Table6.4Hydropowerprojectcapacityfactorsandcapacityweightedaveragesforsmallhydropowerprojectsbycountry/rSmallHydropower2010-2015Africa335668Brazil426388CentralAmerica455975China334660Eurasia445874Europe234870India285071OtherAsia375079OtherSouthAmerica4365825thpercentile(%)Weighted-average(%)95thpercentile(%)orsmallhydropowerprojectsbycountry/region,2010-20212016-2021515565495459n.a.n.a.n.a.383838435871284366395461365676n.a.n.a.n.a.5thpercentile(%)Weighted-average(%)95thpercentile(%)Table6.5HydropowerO&Mcostbreakdownbyprojectforasampleof25projects20516113397451628344ProjectComponentShareoftotalO&Mcosts(%)MinimumWeightedaverageMaximumOperationcostsSalaryOtherMaterialFigure7.1Globalweightedaveragetotalinstalledcosts,capacityfactorsandLCOEsforgeothermal,2010-2021Geothermal2010-2021Totalinstalledcost(2021USD/kW)201020112012201320145thpercentile1721313322512053Weightedaverage271455093965374395thpercentile479613824128738834Capacityfactor(%)201020112012201320145thpercentile80%76%73%50%Weightedaverage87%83%82%84%95thpercentile92%94%91%91%LCOE(2021USD/kWh)201020112012201320145thpercentile0.0380.0560.0400.045Weightedaverage0.0500.0860.0640.06595thpercentile0.0770.1620.1700.220,2010-202120152016201720182019202020212486246018843353212017452190366538494014435441273483399175107358706486801076259256094201520162017201820192020202177%59%59%62%74%76%58%89%85%81%85%79%81%77%93%90%90%98%86%91%91%20152016201720182019202020210.0470.0520.0390.0540.0460.0380.0370.0590.0680.0710.0680.0670.0540.0680.1050.1140.1280.1470.1270.0830.099Figure7.2Geothermalpowertotalinstalledcostsbyproject,technologyandcapacity,2007-2021Totalinstalledcosts(2021USD/kW)GeothermalYear5thpercentileWeightedaverage95thpercentile200721872187218720081467333745352009359957753646720101721271447962012313355091382420132251396512873201420533743883420152486366575102016246038497358201718844014706420183353435486802019212041271076220201745348359252021219039916094Figure7.3Capacityfactorsofgeothermalpowerplantsbytechnologyandprojectsize,2007-2021Capacityfactors(%)GeothermalYear5thpercentileWeightedaverage95thpercentile200780%80%80%200882%88%90%200970%73%82%201080%87%92%201276%83%94%201373%82%91%201450%84%91%201577%89%93%201659%85%90%201759%81%90%201862%85%98%201974%79%86%202076%81%91%202158%77%91%Figure7.4LCOEofgeothermalpowerprojectsbytechnologyandprojectsize,2007-2021LCOE(2021USD/kWh)GeothermalYear5thpercentileWeightedaverage95thpercentile20070.0500.0500.05020080.0380.0550.06620090.0710.0950.46620100.0380.0500.07720120.0560.0860.16220130.0400.0640.17020140.0450.0650.22020150.0470.0590.10520160.0520.0680.11420170.0390.0710.12820180.0540.0680.14720190.0460.0670.12720200.0380.0540.08320210.0370.0680.099Figure8.1Globalweightedaveragetotalinstalledcosts,capacityfactorsandLCOEsforbioenergy,2010-2021Bioenergy2010-2021Totalinstalledcost(2021USD/kW)201020112012201320145thpercentile7415228181003939Weightedaverage2714136515673175312795thpercentile505854535036860314783Capacityfactor(%)201020112012201320145thpercentile31%38%43%41%43%Weightedaverage72%68%64%74%75%95thpercentile92%93%90%93%93%LCOE(2021USD/kWh)201020112012201320145thpercentile0.0400.0360.0390.0460.047Weightedaverage0.0780.0570.0620.0820.08295thpercentile0.1440.1550.1360.1770.3152010-2021201520162017201820192020202110731180135810751212111716752717228130381775227426342353167301350510350981910728620010940201520162017201820192020202163%60%65%44%62%51%60%75%67%86%76%70%70%68%93%89%94%93%94%88%82%20152016201720182019202020210.0390.0550.0550.0480.0530.0420.0610.0730.0710.0710.0550.0640.0720.0670.3570.2380.1970.2760.2390.1450.139Totalinstalledcosts(2021USD/kW)BioenergyBagasse5thpercentileWeightedaverageChina13181563Europe36914004India5331033NorthAmerica13941394Restoftheworld4591818Landfillgas5thpercentileWeightedaverageChina13352888Europe35493566India22692746NorthAmerica6193022Restoftheworld9641950Othervegetalandagriculturalwaste5thpercentileWeightedaverageChina9861464Europe18693973India9171253NorthAmerica32514677Restoftheworld7151632Ricehusks5thpercentileWeightedaverageChina6561399EuropeIndia7931168NorthAmericaRestoftheworld16172134Woodwaste5thpercentileWeightedaverageChina8271346Europe24624357India6001066NorthAmerica18544015Restoftheworld6152987RenewableMunicipalWaste5thpercentileWeightedaverageFigure8.2Totalinstalledcostsofbioenergypowergenerationprojectsbyselectedfeedstocksandcountry/region,2000-2021China17263569Europe12414762India11491461NorthAmerica27133816Restoftheworld10361036e95thpercentile17435749208013944882gas95thpercentile42933658451351094636riculturalwaste95thpercentile19676505163056373439sks95thpercentile190617813594aste95thpercentile21667694136165095062cipalWaste95thpercentileedfeedstocksand54976998222062901036Totalinstalledcosts(2021USD/kW)BioenergyBinsize(MW)ChinaIndiaEurope0-55thpercentile13082844505Weightedaverage21305222165495thpercentile3267699736865-105thpercentile15332377603Weightedaverage32824582121795thpercentile60067030196110-155thpercentile9963554860Weightedaverage22545432131395thpercentile38566832182515-205thpercentile9141114923Weightedaverage24743092129895thpercentile42184929210820-255thpercentile6434803581Weightedaverage17835892102595thpercentile33827322143325-305thpercentile9943906846Weightedaverage15945365107295thpercentile19507376128230-355thpercentile12731622628Weightedaverage1538485573695thpercentile1845702980735-405thpercentile44121211603Weightedaverage16874328160395thpercentile33646669160340-455thpercentile36143981483Weightedaverage3614506248395thpercentile3614608648345-505thpercentile142219601117Weightedaverage15014119111795thpercentile16276852111750-555thpercentile9432589Weightedaverage1600338895thpercentile29604512Figure8.3Totalinstalledcostsofbioenergypowergenerationprojectsfordifferentcapacityrangesbycountry/region,2000-2021NorthAmericaRestoftheworld5928973331242659975231133061533462055690833881412756361821975725579328521513370332945206543030788353817259047264715148693725511949423735173772139850692338636539324619616567617026687348325054254422136262002230406543784255466044444946230613553669306757534673acityrangesbyCapacityfactors(%)BioenergyChinaEuropeIndiaBagasse5thpercentile54%82%25%Weightedaverage59%82%51%95thpercentile62%90%87%Landfillgas5thpercentile33%83%46%Weightedaverage57%84%59%95thpercentile87%92%71%Othervegetalandagriculturalwaste5thpercentile52%78%57%Weightedaverage63%85%68%95thpercentile74%91%82%Ricehusks5thpercentile48%63%Weightedaverage61%72%95thpercentile75%90%Woodwaste5thpercentile52%62%72%Weightedaverage68%79%73%95thpercentile90%87%74%RenewableMunicipalWaste5thpercentile57%63%75%Weightedaverage63%77%75%95thpercentile65%90%75%Figure8.4Projectcapacityfactorsandweightedaveragesofselectedfeedstocksforbioenergypowergenerationprojectsbycountryandregion,2000-2021NorthAmericaRestoftheworld39%31%39%51%39%83%50%29%75%59%93%93%93%56%93%75%95%91%65%79%90%66%49%88%76%93%91%47%79%60%79%93%79%powergenerationLCOE(2021USD/kWh)Bioenergy5thpercentileWeightedaverage95thpercentileChina0.0450.0600.118Europe0.0510.0880.240India0.0390.0580.104NorthAmerica0.0480.0970.183Restoftheworld0.0380.0700.146Figure8.5LCOEbyprojectandweightedaveragesofbioenergypowergenerationprojectsbyfeedstockandcountry/region,2000-2021edstockandSelectedfeedstockprojectcapacityfactor(%)andLCOE(2021USD/kWh)BioenergyProductBagasse98%0.037Bagasse94%0.078Bagasse92%0.170Bagasse91%0.119Bagasse90%0.046Bagasse90%0.033Bagasse90%0.088Bagasse85%0.053Bagasse83%0.056Bagasse82%0.045Bagasse82%0.035Bagasse82%0.106Bagasse82%0.089Bagasse82%0.088Bagasse82%0.087Bagasse82%0.086Bagasse82%0.086Bagasse82%0.085Bagasse82%0.047Bagasse79%0.046Bagasse76%0.048Bagasse75%0.113Bagasse75%0.123Bagasse72%0.076Bagasse72%0.052Bagasse71%0.056Bagasse70%0.051Bagasse70%0.039Bagasse70%0.034Bagasse68%0.094Bagasse65%0.047Bagasse65%0.052Bagasse64%0.058Bagasse64%0.055Bagasse63%0.064Bagasse63%0.069Bagasse62%0.069Bagasse62%0.063Bagasse62%0.088Bagasse61%0.061Figure8.6LCOEandcapacityfactorbyprojectofselectedfeedstocksforbioenergypowergenerationprojects,2000-2021Capacityfactor(%)LCOE(2021USD/kWh)Bagasse61%0.061Bagasse60%0.061Bagasse60%0.059Bagasse60%0.185Bagasse60%0.075Bagasse60%0.064Bagasse60%0.058Bagasse60%0.044Bagasse60%0.083Bagasse59%0.042Bagasse59%0.042Bagasse57%0.046Bagasse56%0.054Bagasse54%0.058Bagasse54%0.057Bagasse52%0.055Bagasse52%0.074Bagasse52%0.038Bagasse51%0.067Bagasse51%0.049Bagasse49%0.060Bagasse49%0.078Bagasse49%0.162Bagasse49%0.118Bagasse46%0.079Bagasse46%0.082Bagasse45%0.063Bagasse45%0.124Bagasse44%0.074Bagasse44%0.075Bagasse44%0.038Bagasse44%0.038Bagasse44%0.042Bagasse41%0.071Bagasse41%0.068Bagasse41%0.067Bagasse41%0.066Bagasse40%0.048Bagasse40%0.057Bagasse39%0.070Bagasse39%0.069Bagasse39%0.062Bagasse39%0.057Bagasse39%0.073Bagasse38%0.070Bagasse34%0.046Bagasse34%0.085Bagasse32%0.073Bagasse32%0.071Bagasse32%0.054Bagasse32%0.054Bagasse30%0.066Bagasse30%0.082Bagasse30%0.071Bagasse28%0.059Bagasse28%0.092Bagasse27%0.055Bagasse26%0.062Bagasse23%0.086Bagasse19%0.074Bagasse16%0.147Bagasse16%0.216Bagasse16%0.108Bagasse14%0.262Landfillgas100%0.107Landfillgas97%0.054Landfillgas96%0.065Landfillgas95%0.052Landfillgas95%0.070Landfillgas93%0.076Landfillgas93%0.139Landfillgas93%0.097Landfillgas93%0.090Landfillgas93%0.080Landfillgas93%0.059Landfillgas93%0.051Landfillgas93%0.087Landfillgas92%0.075Landfillgas92%0.079Landfillgas91%0.070Landfillgas91%0.055Landfillgas91%0.042Landfillgas91%0.044Landfillgas89%0.070Landfillgas88%0.076Landfillgas88%0.074Landfillgas86%0.108Landfillgas85%0.102Landfillgas85%0.057Landfillgas85%0.065Landfillgas84%0.083Landfillgas84%0.080Landfillgas84%0.048Landfillgas84%0.037Landfillgas83%0.071Landfillgas83%0.042Landfillgas82%0.066Landfillgas82%0.060Landfillgas82%0.087Landfillgas82%0.086Landfillgas82%0.085Landfillgas82%0.085Landfillgas82%0.085Landfillgas82%0.083Landfillgas82%0.054Landfillgas82%0.051Landfillgas82%0.053Landfillgas82%0.061Landfillgas82%0.095Landfillgas81%0.035Landfillgas81%0.072Landfillgas80%0.086Landfillgas80%0.035Landfillgas80%0.063Landfillgas80%0.060Landfillgas80%0.089Landfillgas80%0.061Landfillgas79%0.032Landfillgas79%0.085Landfillgas79%0.047Landfillgas76%0.068Landfillgas76%0.074Landfillgas76%0.102Landfillgas76%0.052Landfillgas76%0.055Landfillgas76%0.098Landfillgas75%0.052Landfillgas75%0.060Landfillgas75%0.055Landfillgas74%0.148Landfillgas74%0.087Landfillgas74%0.056Landfillgas73%0.059Landfillgas73%0.091Landfillgas73%0.072Landfillgas73%0.065Landfillgas73%0.056Landfillgas72%0.082Landfillgas71%0.104Landfillgas71%0.092Landfillgas70%0.060Landfillgas70%0.054Landfillgas69%0.096Landfillgas69%0.076Landfillgas69%0.147Landfillgas69%0.076Landfillgas68%0.065Landfillgas67%0.054Landfillgas67%0.077Landfillgas67%0.056Landfillgas67%0.064Landfillgas67%0.062Landfillgas67%0.061Landfillgas66%0.085Landfillgas66%0.145Landfillgas66%0.072Landfillgas66%0.085Landfillgas65%0.115Landfillgas65%0.114Landfillgas65%0.062Landfillgas65%0.054Landfillgas65%0.096Landfillgas64%0.081Landfillgas64%0.085Landfillgas64%0.067Landfillgas64%0.070Landfillgas63%0.060Landfillgas63%0.074Landfillgas63%0.071Landfillgas63%0.068Landfillgas63%0.067Landfillgas63%0.067Landfillgas63%0.067Landfillgas63%0.067Landfillgas63%0.066Landfillgas63%0.066Landfillgas63%0.061Landfillgas63%0.081Landfillgas63%0.080Landfillgas62%0.112Landfillgas62%0.104Landfillgas61%0.057Landfillgas61%0.066Landfillgas61%0.079Landfillgas61%0.056Landfillgas61%0.093Landfillgas61%0.118Landfillgas60%0.068Landfillgas60%0.059Landfillgas60%0.096Landfillgas60%0.061Landfillgas60%0.099Landfillgas59%0.112Landfillgas59%0.071Landfillgas59%0.098Landfillgas58%0.051Landfillgas58%0.054Landfillgas58%0.051Landfillgas58%0.059Landfillgas58%0.123Landfillgas58%0.087Landfillgas58%0.061Landfillgas57%0.099Landfillgas57%0.100Landfillgas57%0.119Landfillgas57%0.096Landfillgas57%0.094Landfillgas57%0.122Landfillgas56%0.061Landfillgas56%0.133Landfillgas56%0.046Landfillgas56%0.107Landfillgas56%0.116Landfillgas56%0.103Landfillgas55%0.065Landfillgas55%0.095Landfillgas54%0.115Landfillgas54%0.167Landfillgas54%0.116Landfillgas54%0.109Landfillgas54%0.098Landfillgas54%0.083Landfillgas54%0.078Landfillgas54%0.113Landfillgas53%0.108Landfillgas53%0.063Landfillgas53%0.076Landfillgas53%0.090Landfillgas53%0.115Landfillgas53%0.049Landfillgas52%0.082Landfillgas52%0.112Landfillgas52%0.096Landfillgas51%0.107Landfillgas51%0.167Landfillgas51%0.097Landfillgas51%0.132Landfillgas51%0.072Landfillgas51%0.145Landfillgas51%0.058Landfillgas50%0.077Landfillgas50%0.140Landfillgas50%0.101Landfillgas49%0.072Landfillgas49%0.108Landfillgas49%0.052Landfillgas49%0.075Landfillgas49%0.088Landfillgas49%0.038Landfillgas49%0.060Landfillgas48%0.135Landfillgas48%0.134Landfillgas48%0.103Landfillgas47%0.109Landfillgas47%0.075Landfillgas46%0.067Landfillgas46%0.168Landfillgas46%0.095Landfillgas45%0.090Landfillgas45%0.105Landfillgas45%0.108Landfillgas44%0.106Landfillgas44%0.084Landfillgas43%0.072Landfillgas43%0.093Landfillgas43%0.055Landfillgas42%0.118Landfillgas42%0.098Landfillgas42%0.079Landfillgas42%0.145Landfillgas41%0.219Landfillgas40%0.071Landfillgas39%0.063Landfillgas39%0.517Landfillgas39%0.111Landfillgas39%0.104Landfillgas38%0.096Landfillgas38%0.168Landfillgas37%0.079Landfillgas36%0.090Landfillgas36%0.093Landfillgas33%0.196Landfillgas31%0.114Landfillgas31%0.083Landfillgas29%0.144Landfillgas29%0.191Landfillgas27%0.094Landfillgas27%0.063Landfillgas27%0.103Landfillgas27%0.094Landfillgas22%0.190Landfillgas21%0.120Otherveget96%0.093Otherveget93%0.047Otherveget93%0.152Otherveget93%0.110Otherveget93%0.108Otherveget93%0.078Otherveget93%0.076Otherveget93%0.070Otherveget92%0.069Otherveget91%0.117Otherveget91%0.118Otherveget91%0.098Otherveget91%0.087Otherveget91%0.084Otherveget91%0.037Otherveget91%0.033Otherveget90%0.051Otherveget90%0.082Otherveget89%0.084Otherveget87%0.251Otherveget87%0.122Otherveget87%0.097Otherveget87%0.083Otherveget87%0.052Otherveget87%0.032Otherveget85%0.044Otherveget85%0.164Otherveget85%0.103Otherveget85%0.067Otherveget85%0.057Otherveget84%0.051Otherveget83%0.079Otherveget83%0.153Otherveget82%0.066Otherveget82%0.103Otherveget82%0.084Otherveget81%0.051Otherveget81%0.047Otherveget81%0.041Otherveget81%0.045Otherveget81%0.068Otherveget81%0.057Otherveget80%0.088Otherveget80%0.068Otherveget80%0.141Otherveget80%0.087Otherveget80%0.069Otherveget80%0.066Otherveget80%0.062Otherveget80%0.056Otherveget80%0.053Otherveget80%0.053Otherveget80%0.051Otherveget80%0.050Otherveget80%0.047Otherveget80%0.045Otherveget80%0.042Otherveget80%0.041Otherveget80%0.038Otherveget80%0.127Otherveget80%0.051Otherveget79%0.047Otherveget78%0.038Otherveget78%0.038Otherveget78%0.075Otherveget78%0.114Otherveget78%0.050Otherveget77%0.051Otherveget76%0.053Otherveget76%0.051Otherveget75%0.053Otherveget75%0.050Otherveget75%0.066Otherveget75%0.050Otherveget74%0.051Otherveget74%0.050Otherveget74%0.048Otherveget74%0.048Otherveget74%0.048Otherveget73%0.081Otherveget73%0.044Otherveget73%0.063Otherveget73%0.046Otherveget73%0.059Otherveget73%0.060Otherveget73%0.049Otherveget72%0.053Otherveget72%0.048Otherveget72%0.054Otherveget72%0.062Otherveget72%0.051Otherveget72%0.052Otherveget72%0.051Otherveget72%0.051Otherveget72%0.057Otherveget72%0.055Otherveget72%0.055Otherveget72%0.055Otherveget72%0.053Otherveget72%0.051Otherveget72%0.051Otherveget72%0.051Otherveget72%0.051Otherveget72%0.050Otherveget72%0.050Otherveget72%0.050Otherveget72%0.048Otherveget72%0.054Otherveget72%0.078Otherveget72%0.060Otherveget72%0.046Otherveget71%0.031Otherveget71%0.052Otherveget71%0.052Otherveget71%0.052Otherveget71%0.052Otherveget71%0.052Otherveget71%0.052Otherveget71%0.052Otherveget71%0.051Otherveget71%0.045Otherveget70%0.053Otherveget70%0.053Otherveget70%0.050Otherveget70%0.073Otherveget70%0.061Otherveget70%0.055Otherveget70%0.053Otherveget70%0.053Otherveget70%0.051Otherveget70%0.048Otherveget70%0.047Otherveget70%0.066Otherveget70%0.053Otherveget70%0.070Otherveget70%0.047Otherveget70%0.053Otherveget69%0.059Otherveget69%0.059Otherveget69%0.059Otherveget69%0.033Otherveget69%0.049Otherveget69%0.043Otherveget69%0.044Otherveget68%0.054Otherveget68%0.051Otherveget68%0.050Otherveget68%0.049Otherveget68%0.054Otherveget68%0.079Otherveget68%0.053Otherveget67%0.050Otherveget67%0.052Otherveget67%0.081Otherveget67%0.054Otherveget66%0.048Otherveget66%0.052Otherveget65%0.064Otherveget65%0.062Otherveget65%0.056Otherveget65%0.055Otherveget65%0.055Otherveget65%0.054Otherveget65%0.054Otherveget65%0.053Otherveget65%0.053Otherveget65%0.053Otherveget65%0.053Otherveget65%0.052Otherveget65%0.052Otherveget65%0.052Otherveget65%0.052Otherveget65%0.052Otherveget65%0.052Otherveget65%0.049Otherveget65%0.059Otherveget65%0.058Otherveget65%0.055Otherveget65%0.054Otherveget65%0.054Otherveget65%0.052Otherveget65%0.052Otherveget65%0.051Otherveget65%0.050Otherveget65%0.071Otherveget65%0.062Otherveget65%0.059Otherveget65%0.057Otherveget65%0.055Otherveget65%0.054Otherveget65%0.047Otherveget65%0.034Otherveget65%0.053Otherveget65%0.051Otherveget65%0.068Otherveget65%0.055Otherveget64%0.040Otherveget64%0.063Otherveget64%0.159Otherveget64%0.161Otherveget64%0.066Otherveget64%0.055Otherveget64%0.053Otherveget64%0.052Otherveget64%0.050Otherveget64%0.051Otherveget64%0.053Otherveget64%0.053Otherveget64%0.051Otherveget64%0.055Otherveget63%0.043Otherveget63%0.044Otherveget63%0.061Otherveget63%0.059Otherveget63%0.073Otherveget63%0.072Otherveget63%0.058Otherveget63%0.055Otherveget63%0.053Otherveget63%0.057Otherveget63%0.064Otherveget63%0.056Otherveget62%0.054Otherveget62%0.032Otherveget62%0.049Otherveget62%0.044Otherveget62%0.066Otherveget62%0.062Otherveget62%0.058Otherveget62%0.055Otherveget62%0.054Otherveget62%0.051Otherveget62%0.050Otherveget62%0.044Otherveget62%0.056Otherveget61%0.047Otherveget61%0.047Otherveget61%0.058Otherveget61%0.057Otherveget61%0.036Otherveget61%0.052Otherveget60%0.052Otherveget60%0.037Otherveget60%0.061Otherveget60%0.060Otherveget60%0.060Otherveget60%0.059Otherveget60%0.057Otherveget60%0.056Otherveget60%0.056Otherveget60%0.056Otherveget60%0.055Otherveget60%0.054Otherveget60%0.054Otherveget60%0.053Otherveget60%0.058Otherveget60%0.059Otherveget60%0.049Otherveget60%0.058Otherveget59%0.067Otherveget59%0.058Otherveget59%0.069Otherveget58%0.057Otherveget58%0.071Otherveget58%0.058Otherveget58%0.059Otherveget58%0.069Otherveget58%0.065Otherveget58%0.056Otherveget57%0.049Otherveget57%0.056Otherveget57%0.061Otherveget57%0.071Otherveget57%0.057Otherveget57%0.034Otherveget56%0.061Otherveget56%0.065Otherveget55%0.067Otherveget55%0.064Otherveget55%0.060Otherveget55%0.059Otherveget55%0.064Otherveget55%0.064Otherveget55%0.089Otherveget55%0.060Otherveget55%0.059Otherveget55%0.061Otherveget54%0.062Otherveget53%0.068Otherveget53%0.049Otherveget53%0.059Otherveget51%0.048Otherveget50%0.061Otherveget50%0.074Otherveget49%0.083Otherveget46%0.053Otherveget46%0.076Otherveget46%0.068Otherveget44%0.123Otherveget43%0.065Otherveget43%0.134Otherveget37%0.107Otherveget23%0.235Otherveget19%0.132Ricehusks92%0.069Ricehusks90%0.059Ricehusks90%0.131Ricehusks90%0.039Ricehusks90%0.052Ricehusks90%0.038Ricehusks90%0.033Ricehusks90%0.030Ricehusks90%0.046Ricehusks90%0.072Ricehusks89%0.059Ricehusks88%0.056Ricehusks86%0.042Ricehusks85%0.060Ricehusks84%0.043Ricehusks83%0.048Ricehusks83%0.043Ricehusks83%0.051Ricehusks82%0.046Ricehusks82%0.086Ricehusks82%0.082Ricehusks82%0.063Ricehusks81%0.066Ricehusks81%0.050Ricehusks81%0.046Ricehusks81%0.065Ricehusks81%0.071Ricehusks80%0.099Ricehusks80%0.047Ricehusks80%0.040Ricehusks78%0.067Ricehusks77%0.056Ricehusks76%0.073Ricehusks76%0.054Ricehusks76%0.070Ricehusks73%0.052Ricehusks73%0.045Ricehusks73%0.066Ricehusks73%0.063Ricehusks73%0.046Ricehusks72%0.054Ricehusks72%0.046Ricehusks72%0.043Ricehusks72%0.050Ricehusks72%0.044Ricehusks72%0.042Ricehusks72%0.047Ricehusks71%0.056Ricehusks70%0.047Ricehusks70%0.058Ricehusks70%0.055Ricehusks70%0.053Ricehusks70%0.053Ricehusks70%0.053Ricehusks70%0.047Ricehusks70%0.045Ricehusks70%0.042Ricehusks70%0.035Ricehusks69%0.048Ricehusks69%0.043Ricehusks68%0.050Ricehusks68%0.071Ricehusks68%0.049Ricehusks68%0.043Ricehusks67%0.052Ricehusks67%0.055Ricehusks66%0.049Ricehusks66%0.068Ricehusks65%0.053Ricehusks65%0.035Ricehusks65%0.032Ricehusks65%0.065Ricehusks65%0.048Ricehusks65%0.048Ricehusks65%0.127Ricehusks65%0.058Ricehusks65%0.055Ricehusks65%0.054Ricehusks64%0.051Ricehusks64%0.033Ricehusks64%0.054Ricehusks64%0.049Ricehusks64%0.047Ricehusks63%0.054Ricehusks63%0.058Ricehusks63%0.070Ricehusks63%0.068Ricehusks61%0.044Ricehusks61%0.056Ricehusks61%0.046Ricehusks60%0.060Ricehusks60%0.059Ricehusks60%0.064Ricehusks60%0.060Ricehusks60%0.060Ricehusks60%0.060Ricehusks60%0.059Ricehusks60%0.059Ricehusks60%0.058Ricehusks60%0.058Ricehusks60%0.057Ricehusks60%0.057Ricehusks60%0.056Ricehusks58%0.061Ricehusks58%0.078Ricehusks57%0.073Ricehusks57%0.059Ricehusks55%0.062Ricehusks54%0.066Ricehusks49%0.050Ricehusks48%0.045Ricehusks34%0.285Ricehusks33%0.081Renewable93%0.195Renewable93%0.169Renewable93%0.159Renewable93%0.144Renewable93%0.124Renewable93%0.119Renewable93%0.104Renewable93%0.162Renewable92%0.124Renewable91%0.111Renewable91%0.173Renewable87%0.257Renewable87%0.242Renewable87%0.240Renewable87%0.222Renewable87%0.217Renewable87%0.203Renewable87%0.175Renewable87%0.166Renewable87%0.165Renewable87%0.160Renewable87%0.139Renewable87%0.129Renewable87%0.048Renewable87%0.039Renewable83%0.257Renewable82%0.088Renewable80%0.053Renewable80%0.288Renewable79%0.042Renewable77%0.104Renewable77%0.041Renewable75%0.069Renewable75%0.052Renewable75%0.048Renewable75%0.045Renewable74%0.149Renewable66%0.145Renewable66%0.142Renewable66%0.096Renewable65%0.137Renewable65%0.099Renewable65%0.043Renewable63%0.066Renewable63%0.052Renewable57%0.141Renewable56%0.058Renewable42%0.102Woodwast95%0.066Woodwast94%0.101Woodwast93%0.147Woodwast93%0.173Woodwast93%0.126Woodwast93%0.111Woodwast93%0.109Woodwast93%0.108Woodwast93%0.103Woodwast93%0.095Woodwast93%0.091Woodwast93%0.089Woodwast93%0.089Woodwast93%0.084Woodwast93%0.074Woodwast93%0.071Woodwast93%0.069Woodwast93%0.067Woodwast93%0.066Woodwast93%0.066Woodwast93%0.062Woodwast93%0.061Woodwast93%0.057Woodwast93%0.056Woodwast93%0.051Woodwast93%0.050Woodwast93%0.040Woodwast92%0.142Woodwast92%0.067Woodwast91%0.074Woodwast91%0.032Woodwast90%0.110Woodwast90%0.092Woodwast89%0.118Woodwast89%0.086Woodwast88%0.068Woodwast88%0.072Woodwast87%0.054Woodwast87%0.169Woodwast87%0.159Woodwast87%0.145Woodwast87%0.137Woodwast87%0.136Woodwast87%0.131Woodwast87%0.115Woodwast87%0.097Woodwast87%0.095Woodwast87%0.079Woodwast87%0.078Woodwast86%0.070Woodwast85%0.073Woodwast85%0.069Woodwast85%0.062Woodwast85%0.043Woodwast84%0.053Woodwast84%0.106Woodwast83%0.080Woodwast83%0.051Woodwast83%0.052Woodwast83%0.092Woodwast83%0.081Woodwast82%0.087Woodwast82%0.086Woodwast82%0.083Woodwast82%0.039Woodwast81%0.129Woodwast80%0.174Woodwast80%0.177Woodwast80%0.246Woodwast80%0.175Woodwast80%0.144Woodwast80%0.134Woodwast80%0.075Woodwast80%0.069Woodwast80%0.062Woodwast80%0.047Woodwast79%0.053Woodwast76%0.062Woodwast76%0.073Woodwast76%0.058Woodwast76%0.150Woodwast76%0.086Woodwast75%0.054Woodwast75%0.081Woodwast75%0.078Woodwast75%0.077Woodwast75%0.076Woodwast75%0.057Woodwast75%0.145Woodwast75%0.116Woodwast75%0.098Woodwast75%0.092Woodwast75%0.091Woodwast75%0.084Woodwast75%0.082Woodwast75%0.080Woodwast75%0.079Woodwast75%0.074Woodwast75%0.054Woodwast75%0.134Woodwast74%0.066Woodwast74%0.186Woodwast74%0.046Woodwast74%0.046Woodwast74%0.052Woodwast74%0.295Woodwast74%0.149Woodwast74%0.060Woodwast73%0.053Woodwast72%0.108Woodwast72%0.093Woodwast72%0.034Woodwast70%0.035Woodwast69%0.074Woodwast69%0.056Woodwast68%0.040Woodwast66%0.273Woodwast66%0.160Woodwast66%0.116Woodwast66%0.114Woodwast65%0.053Woodwast64%0.057Woodwast61%0.190Woodwast60%0.041Woodwast60%0.046Woodwast60%0.044Woodwast60%0.042Woodwast57%0.096Woodwast57%0.036Woodwast57%0.065Woodwast55%0.156Woodwast52%0.055Woodwast52%0.171Woodwast51%0.060Woodwast48%0.127Woodwast47%0.065Woodwast40%0.044Woodwast18%0.200onprojects,Table8.1:Projectweightedaveragecapacityfactorsofbioenergyfiredpowergenerationprojects,200020212000-2021396449823268438535675thpercentile(%)Weightedaverage(%)ChinaEuropeIndiaNorthAmericaRestoftheworldects,200020212021829287949295thpercentile(%)TableA1.1StandardisedassumptionsforLCOEcalculations252525302025TechnologyEconomiclife(years)Weightedaveragecostofcapital(real)OECDandChinaWindpower7.5%in2010fallingto5%in2020SolarPVCSPHydropowerBiomassforpowerGeothermalaveragecostofcapital(real)Restoftheworld10%in2010fallingto7.5%in2020FigureA1.1Countryandtechnology-specificrealafter-taxWACCassumptionsfor2021CountrySolarPVCountryOnshorewindAlgeria11%Algeria11.4%Argentina13.80%Argentina13.8%Australia2.90%Australia2.9%Austria3.40%Austria2.5%Azerbaijan7.00%Azerbaijan7.0%Bangladesh6.80%Bangladesh6.8%Belarus9.90%Belarus9.9%Belgium1.90%Belgium3.5%Bolivia8.70%Bolivia8.7%BosniaandHerzegovina10.40%BosniaandHerzegovina10.5%Brazil6.30%Brazil4.9%Bulgaria4.80%Bulgaria4.0%BurkinaFaso5.80%BurkinaFaso8.5%Canada4.30%Canada3.0%Chile3.50%Chile4.5%China2.50%China2.5%Colombia5.60%Colombia5.6%CostaRica6.40%CostaRica5.6%Croatia5.30%Croatia5.1%Cuba11.60%Cuba11.6%Cyprus4.90%Cyprus4.4%Czechia3.70%Czechia5.1%Denmark2.10%Denmark1.5%DominicanRepublic5.60%DominicanRepublic7.1%Ecuador12.20%Ecuador12.2%Egypt8.80%Egypt8.8%ElSalvador6.30%ElSalvador9.2%Estonia5.10%Estonia5.1%Ethiopia8.40%Ethiopia5.6%Finland4.80%Finland1.9%France1.80%France1.8%Germany1.30%Germany1.3%Ghana9.50%Ghana9.5%Greece4.10%Greece4.1%Guatemala6.30%Guatemala6.3%Honduras4.60%Honduras6.0%Hungary3.70%Hungary3.7%India5.90%India5.9%Indonesia6.00%Indonesia6.0%Iran11.40%Iran11.5%Iraq9.60%Iraq9.6%Ireland5.50%Ireland2.8%Israel3.70%Israel5.0%Italy3.10%Italy3.3%Jamaica7.20%Jamaica7.2%Japan2.30%Japan4.7%Jordan8.20%Jordan8.2%Kazakhstan6.30%Kazakhstan6.3%Kenya8.40%Kenya5.6%Kuwait5.30%Kuwait5.3%Latvia5.50%Latvia5.5%Lebanon21.00%Lebanon21.0%Lithuania5.70%Lithuania2.6%Luxembourg3.10%Luxembourg3.1%Malaysia5.40%Malaysia5.4%Malta1.80%Malta4.7%Mauritius4.60%Mauritius6.0%Mexico7.20%Mexico3.6%Mongolia8.00%Mongolia6.7%Montenegro8.80%Montenegro5.6%Morocco6.70%Morocco6.1%Myanmar9.50%Myanmar9.5%Namibia4.20%Namibia6.9%Netherlands1.40%Netherlands2.5%NewZealand4.30%NewZealand3.0%Nicaragua9.20%Nicaragua6.3%Norway4.50%Norway4.5%Pakistan9.20%Pakistan9.2%Panama4.30%Panama4.3%Peru5.20%Peru5.2%Philippines5.70%Philippines5.7%Poland3.90%Poland3.3%Portugal4.20%Portugal3.2%Romania5.10%Romania5.7%Russia6.30%Russia6.3%Rwanda5.60%Rwanda8.4%SaudiArabia6.20%SaudiArabia6.2%Senegal4.30%Senegal7.0%Singapore4.60%Singapore4.6%Slovakia3.80%Slovakia5.2%Slovenia4.20%Slovenia5.5%SouthAfrica5.20%SouthAfrica6.6%Spain3.60%Spain3.1%SriLanka10.30%SriLanka10.3%Sweden3.20%Sweden3.5%Switzerland1.70%Switzerland4.7%Taiwan3.70%Taiwan5.0%Thailand4.50%Thailand5.8%Tunisia9.30%Tunisia9.3%Türkiye7.50%Türkiye7.5%Uganda6.90%Uganda8.4%UK2.00%UK2.6%Ukraine9.90%Ukraine9.9%UnitedArabEmirates5.60%UnitedArabEmirates5.6%Uruguay4.20%Uruguay3.0%USA4.30%USA3.0%Venezuela18.70%Venezuela18.7%VietNam6.00%VietNam5.1%Yemen17.20%Yemen20.6%CountryOffshorewindBelgium3.5%China4.9%Denmark1.5%France4.7%Germany2.9%Italy6.1%Japan4.7%Korea4.8%Norway4.5%Poland5.2%Sweden4.5%Taiwan5.0%UK2.0%USA4.3%VietNam7.4%TableA1.2O&McostassumptionsfortheLCOEcalculationofonshorewindprojects2021USD/kW/yearSwedenIrelandGermanyDenmarkUnitedStatesNorwayJapanBrazilCanadaMexicoSpainUnitedKingdomFranceChinaIndiaAustraliaOtherOECDOthernon-OECDalculationofonshorewindprojects2021383244323837832735442637472621343631TableA1.3O&McostassumptionsfortheLCOEcalculationofonshorewindprojects2021USD/kW/yearBelgiumDenmarkNetherlandsGermanyUnitedKingdomFranceChinaUnitedStatesJapanOtherOECDOthernon-OECD202176698077748052701277562tionofonshorewindprojects201027.1201124.0201223.4201322.9201422.4201521.7201621.1201721.5201820.1201919.2202018.2202118.2TableA1.4O&McostassumptionsfortheLCOEcalculationofPVprojectsYearOECD2021USD/kW/year25.623.518.215.313.712.411.310.910.49.99.69.6VprojectsNon-OECD2021USD/kW/year429210322437799919833771162041102298220811024511026860149381211172591002119918027527012844126932112454TableA1.6O&McostassumptionsfortheLCOEcalculationofPVprojectsFuelPricefor2022(2021USD/MWh)Costasgenerated(2021USD/MWh)Periodofhistoricaldata(2022)HistoricaldatasourceArgentinaFossilgasAustraliaFossilgasBrazilFossilgasJan-AprImportdataChileFossilgasJan-AprImportdataChinaFossilgasJan-MayJKMgaspricingChinaCoalJan-MayDomesticpricing+Newcastle(5500kcal)pricingDenmarkFossilgasJan-MayDutchTTFEurope(generic)FossilgasJan-MayDutchTTFFinlandFossilgas/coalJan-MayDutchTTFFranceFossilgasJan-MayDutchTTFGermanyFossilgasJan-MayDutchTTFIndiaFossilgasJan-AprImportdataIndiaCoalJan-MarImportdataItalyFossilgasJan-AprDay-aheadgasprice(MGP)JapanFossilgasJan-AprJKMgaspricingRepublicofKoreaFossilgasJan-AprJKMgaspricingMexicoFossilgasJan-FebU.S.exportdataTürkiyeFossilgasJan-AprBOTAŞVietNamCoalJan-MarImportdataUnitedKingdomFossilgasJan-MayUKNBPUnitedStatesFossilgasJan-MayHenryHub(NYMEX)FuturedatasourcesBlendedLNG/BolivianimportcostLNGfuturesPipelineimportcost(Argentina)ForwardLNGcontractsChinacoalpricebandadvice+NewcastlecoalpricefuturesForwardmonthDutchTTFpricingForwardmonthDutchTTFpricingForwardmonthDutchTTFpricingForwardmonthDutchTTFpricingForwardmonthDutchTTFpricingConvergencewithAustraliannet-backLNGpricingNewcastlecoalpricefuturesForwardmonthDutchTTFpricingForwardLNGcontractsForwardLNGcontractsEIAShorttermOutlook(adjust-ed)LinkedtoDutchTTFforwardmonthpricingNewcastlecoalpricefuturesUKNBPforwardmonthpricingEIAShort-termEnergyOutlook,April2022All-inoperationsandmaintenancecostassumptionsOnshorewind2021USD/kW-year201020112012Sweden67.970.768.0Ireland90.779.855.7Germany85.382.880.3Denmark59.657.856.1UnitedStatesofAmerica63.364.658.3Norway65.163.959.0Japan99.797.094.3Brazil43.842.040.2Canada58.656.253.8Mexico72.669.766.7Spain43.041.339.5UnitedKingdom60.958.455.9France78.675.372.1China43.241.539.7India34.433.031.6Australia57.054.752.4201020112012OtherOECD61.959.756.6Othernon-OECD52.650.648.2Offshorewind2021USD/kW-year201020112012Belgium184.2169.5154.7Denmark110.5105.2100.0Netherlands136.7129.2121.8Germany183.4169.0154.5UnitedKingdom243.0219.5196.0France192.6177.2161.8China51.751.751.7UnitedStates125.3118.1110.9Japan201020112012OtherOECD155.5144.7133.9Othernon-OECD103.451.751.7SolarPV2021USD/kW-year201020112012OECD27.12423.4Non-OECD25.623.518.2CSP(PTC)2021USD/kWh201020112012Argentina0.0390.0380.036Australia0.0420.0410.039Brazil0.0310.0300.029China0.0330.0320.030France0.0500.0480.046India0.0230.0230.022Italy0.0390.0380.036Mexico0.0250.0240.023Morocco0.0200.0200.019RussianFederation0.0370.0360.035SaudiArabia0.0190.0180.017SouthAfrica0.0200.0200.019Spain0.0370.0360.035Türkiye0.0280.0270.026UnitedArabEmirates0.0280.0270.026UnitedStatesofAmerica0.0370.0360.035CSP(PTC)2021USD/kWh201020112012OtherOECD0.0370.0360.034Othernon-OECD0.0280.0270.026CSP(ST)2021USD/kWh201020112012Argentina0.0360.0350.033Australia0.0400.0390.038Brazil0.0310.0300.029China0.0280.0270.026France0.0420.0410.039India0.0230.0230.022Italy0.0360.0350.033Mexico0.0230.0230.022Morocco0.0190.0180.017RussianFederation0.0340.0330.032SaudiArabia0.0170.0170.016SouthAfrica0.0190.0180.017Spain0.0340.0330.032Türkiye0.0250.0240.023UnitedArabEmirates0.0310.0300.029UnitedStatesofAmerica0.0330.0320.030CSP(ST)2021USD/kWh201020112012OtherOECD0.0330.0320.031Othernon-OECD0.0260.0260.02520132014201520162017201820192020202159.161.443.145.045.646.543.340.038.058.988.142.637.636.535.434.333.132.075.570.765.961.165.169.150.646.744.352.742.651.040.034.235.646.635.032.059.358.047.346.245.646.543.340.038.061.354.745.644.142.744.742.739.437.491.789.086.483.781.0105.095.888.483.938.436.634.933.131.329.527.725.926.851.449.046.644.241.839.437.034.635.463.760.757.854.851.848.845.842.944.237.736.034.232.430.728.927.125.425.953.450.948.445.943.440.938.435.936.868.965.762.559.256.052.849.646.447.437.936.134.432.630.829.127.325.525.730.228.827.426.024.623.121.720.321.050.047.745.443.040.738.336.033.734.320132014201520162017201820192020202155.351.847.745.443.241.839.536.836.946.644.041.039.037.035.433.431.131.3201320142015201620172018201920202021139.9125.2110.495.780.979.377.776.176.194.789.484.178.873.572.170.669.269.2114.3106.999.592.084.682.981.279.679.6140.0125.5111.196.682.180.578.977.377.3172.5148.9125.4101.978.476.975.373.873.8146.3130.9115.5100.084.682.981.279.679.651.751.751.751.751.751.751.751.751.7103.696.489.282.074.873.371.870.470.4134.8132.1129.5126.9126.9201320142015201620172018201920202021123.2112.4101.690.980.178.576.975.475.451.751.751.751.751.751.751.751.751.720132014201520162017201820192020202122.922.421.721.121.520.119.218.218.215.313.712.411.310.910.49.99.69.62013201420152016201720182019202020210.0350.0340.0320.0310.0300.0280.0270.0260.0260.0380.0360.0350.0340.0320.0310.0290.0280.0280.0280.0270.0260.0250.0240.0230.0220.0210.0210.0290.0280.0270.0260.0250.0240.0230.0220.0220.0450.0430.0410.0400.0380.0360.0350.0330.0330.0210.0200.0190.0190.0180.0170.0160.0160.0160.0350.0340.0320.0310.0300.0280.0270.0260.0260.0220.0220.0210.0200.0190.0180.0170.0170.0170.0180.0180.0170.0160.0150.0150.0140.0130.0130.0340.0320.0310.0300.0290.0270.0260.0250.0250.0170.0160.0160.0150.0140.0140.0130.0120.0120.0180.0180.0170.0160.0150.0150.0140.0130.0130.0340.0320.0310.0300.0290.0270.0260.0250.0250.0250.0240.0230.0220.0210.0210.0200.0190.0190.0250.0240.0230.0220.0210.0210.0200.0190.0190.0340.0320.0310.0300.0290.0270.0260.0250.0252013201420152016201720182019202020210.0330.0320.0310.0290.0280.0270.0260.0245690.0250.0250.0240.0230.0220.0210.0200.0190.0185340.0192013201420152016201720182019202020210.0320.0310.0300.0290.0270.0260.0250.0240.0240.0360.0350.0340.0320.0310.0300.0280.0270.0270.0280.0270.0260.0250.0240.0230.0220.0210.0210.0250.0240.0230.0220.0210.0210.0200.0190.0190.0380.0360.0350.0340.0320.0310.0290.0280.0280.0210.0200.0190.0190.0180.0170.0160.0160.0160.0320.0310.0300.0290.0270.0260.0250.0240.0240.0210.0200.0190.0190.0180.0170.0160.0160.0160.0170.0160.0160.0150.0140.0140.0130.0120.0120.0310.0300.0280.0270.0260.0250.0240.0230.0230.0150.0150.0140.0140.0130.0130.0120.0110.0110.0170.0160.0160.0150.0140.0140.0130.0120.0120.0310.0300.0280.0270.0260.0250.0240.0230.0230.0220.0220.0210.0200.0190.0180.0170.0170.0170.0280.0270.0260.0250.0240.0230.0220.0210.0210.0290.0280.0270.0260.0250.0240.0230.0220.0222013201420152016201720182019202020210.0300.0290.0280.0270.0260.0240.0230.0222010.0220.0240.0230.0220.0210.0200.0190.0180.0176130.018
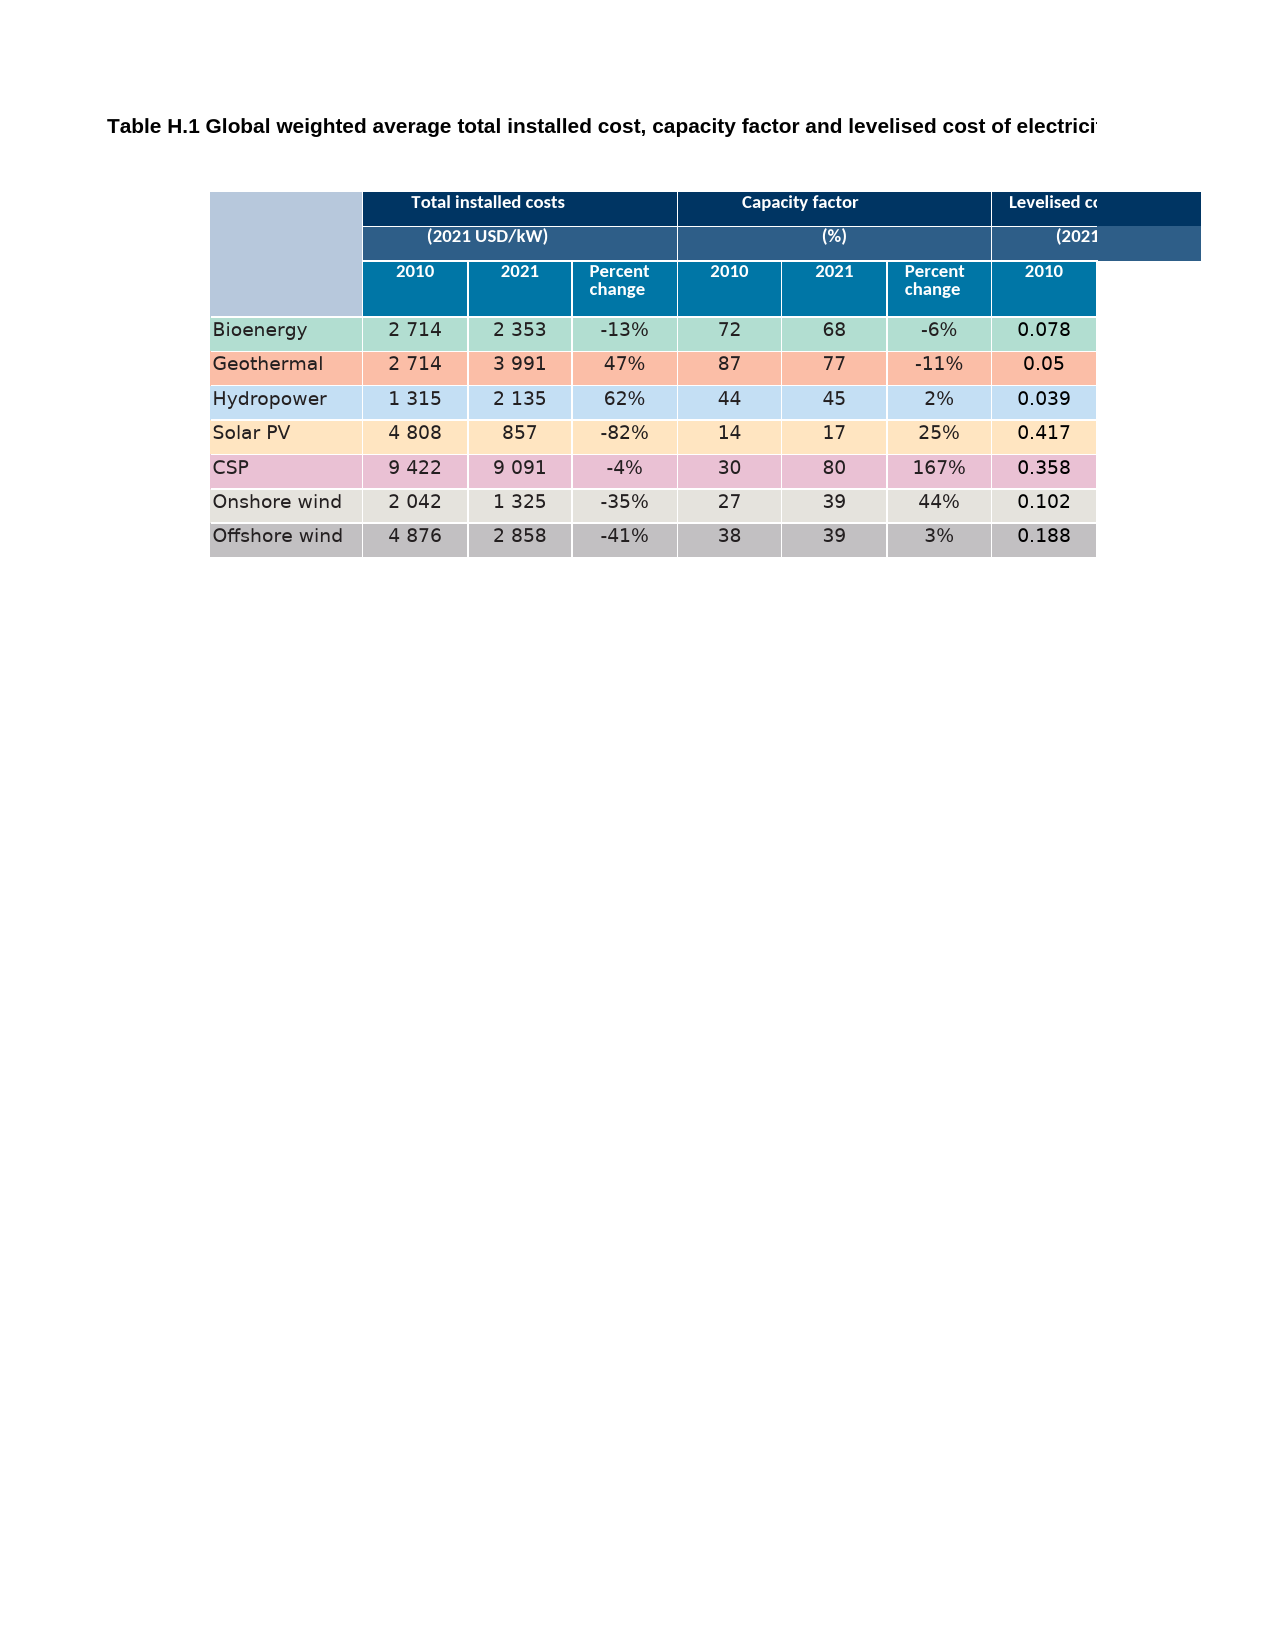
 VIP
VIP


