【推荐】全球EV展望2023-英-22页VIP专享VIP免费

© Bloomberg Finance L.P.2023
No portion of this document may be reproduced, scanned into an electronic system, distributed, publicly
displayed or used as the basis of derivative works without the prior written consent of Bloomberg Finance
L.P. For more information on terms of use, please contact sales.bnef@bloomberg.net. Copyright and
Disclaimer notice on page 22 applies throughout.
1
Executive Summary
The transportation and automotive sectors are undergoing a period of profound
transformation. Electrification is now spreading rapidly in almost all segments of road
transport, from passenger cars to commercial vehicles, buses and two- and three-
wheelers. Each country has its own unique mix of vehicles and while progress varies
across them, the overall direction of travel is increasingly clear.
Technology changes are at the core of this transition as battery prices have fallen
dramatically over the last decade. Battery prices rose for the first time in 2022 but
innovation in the area is not slowing down, with advances in areas like solid-state
batteries, next-generation cathode and anode chemistries, and sodium-ion technology
all reaching commercialization in the next few years.
Yet technology changes alone are not enough to keep the road transport sector on track
for net-zero emissions by mid-century. Policymakers have an important role to play in
driving the automotive market toward zero-emissions options, improving fuel efficiency,
getting the power system ready for electric vehicles, and in reducing overall car
dependency. Eliminating emissions from road transport will require all hands on deck,
including automakers, battery manufacturers, charging companies, grid operators,
miners, large fleet operators and consumers.
As momentum grows, new economic opportunities are taking shape. Batteries and
electric vehicles have taken center stage in new discussions on industrial policy, with
countries now competing to attract investment and build new clusters of high-value
manufacturing. Meanwhile, regulators and grid operators are looking at ways to ensure
EVs benefit the power system.
Electrification is not the only vector of change. Shared mobility, vehicle connectivity and,
eventually, autonomous vehicles are also set to reshape automotive and freight markets
around the world. Urbanization also continues its steady march, leading to increased
concerns around vehicle congestion and urban air quality.
This report draws on BloombergNEF’s team of sectoral and regional experts around the
world. It updates our outlook for how road transport could evolve over the next 30 years.
It includes analysis on EV adoption in passenger vehicles, commercial vans and trucks,
two- and three-wheeled vehicles and buses globally. It also looks at other drivetrains,
including hybrids, natural gas and fuel cells, and then explores the resulting impacts of
all of these on electricity markets, oil demand, battery materials, charging infrastructure
and CO2 emissions.
The key findings are as follows:
Direct electrification via batteries is the most efficient, cost-effective and commercially
available route to fully decarbonizing road transport. Fuel cell vehicles play a role in
some hard-to-electrify long-haul trucking applications but play no meaningful role in the
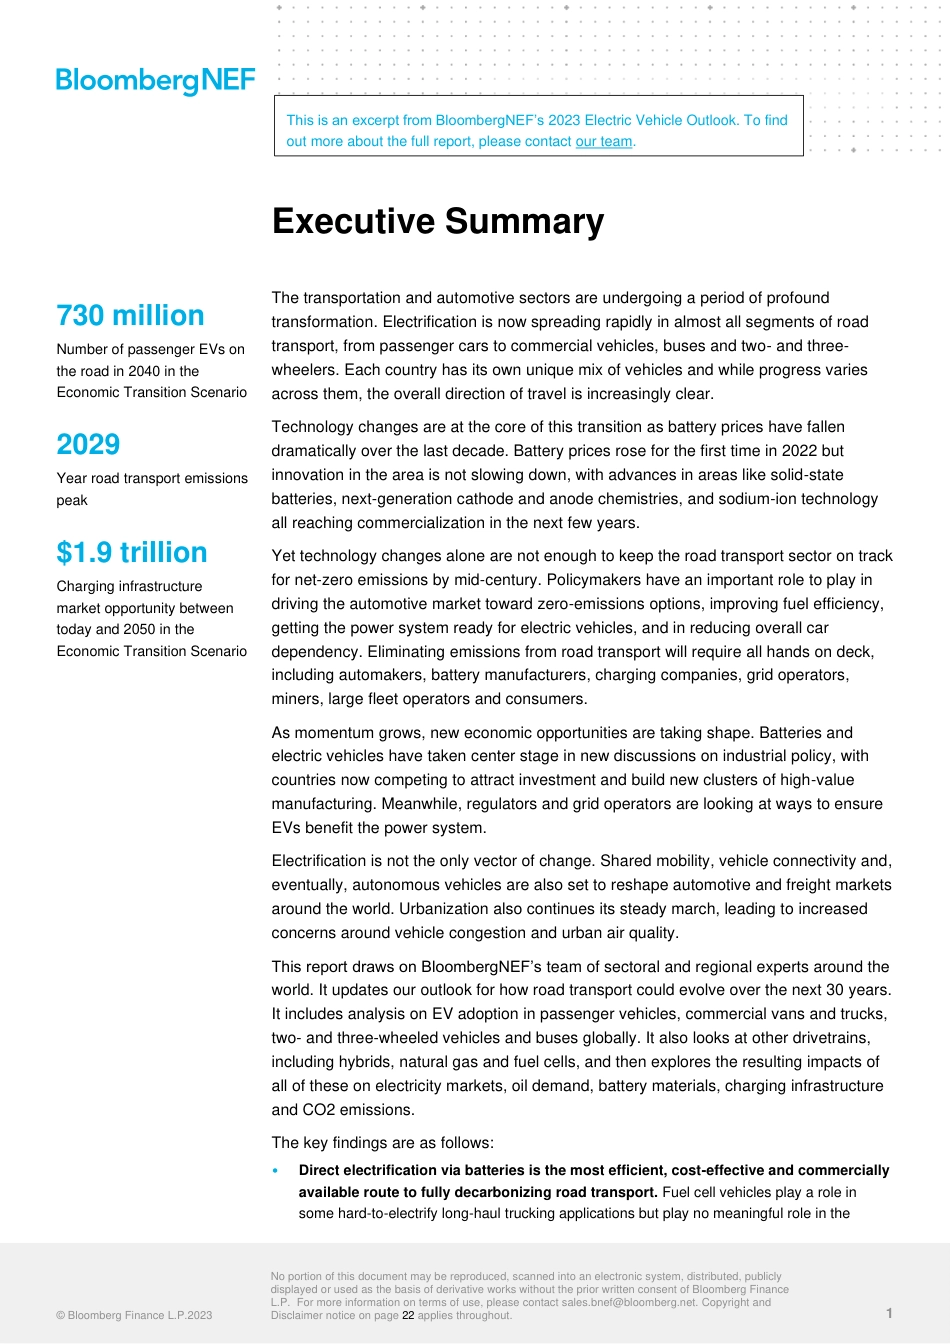
730 million
Number of passenger EVs on
the road in 2040 in the
Economic Transition Scenario
2029
Year road transport emissions
peak
$1.9 trillion
Charging infrastructure
market opportunity between
today and 2050 in the
Economic Transition Scenario
© Bloomberg Finance L.P.2023
No portion of this document may be reproduced, scanned into an electronic system, distributed, publicly
displayed or used as the basis of derivative works without the prior written consent of Bloomberg Finance
L.P. For more information on terms of use, please contact sales.bnef@bloomberg.net. Copyright and
Disclaimer notice on page 22 applies throughout.
2
passenger vehicle market. Synthetic fuels do not arrive at scale in time or at a price point
needed to have a material impact on road transport.
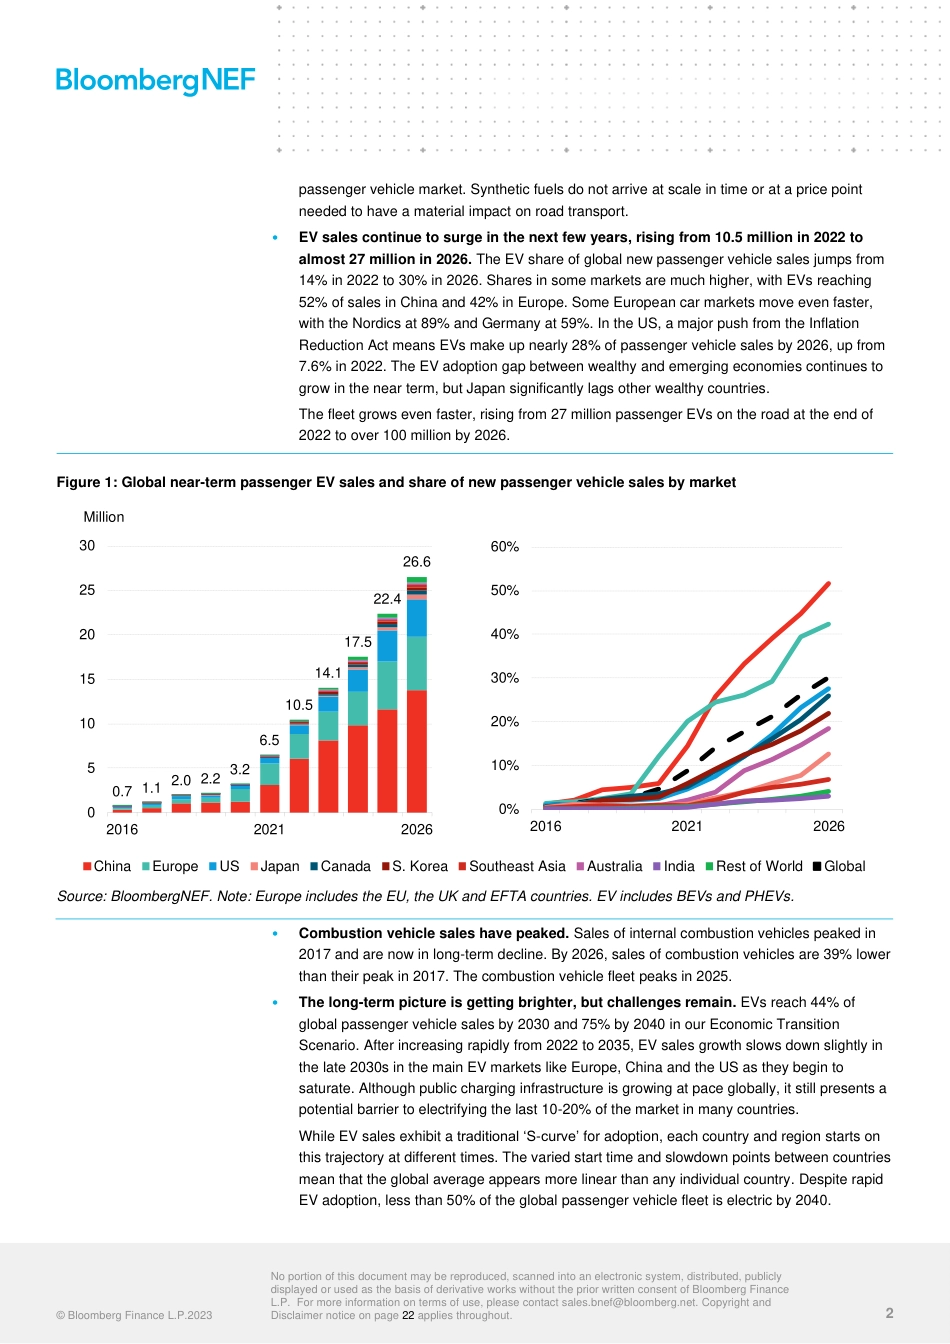
EV sales continue to surge in the next few years, rising from 10.5 million in 2022 to
almost 27 million in 2026. The EV share of global new passenger vehicle sales jumps from
14% in 2022 to 30% in 2026. Shares in some markets are much higher, with EVs reaching
52% of sales in China and 42% in Europe. Some European car markets move even faster,
with the Nordics at 89% and Germany at 59%. In the US, a major push from the Inflation
Reduction Act means EVs make up nearly 28% of passenger vehicle sales by 2026, up from
7.6% in 2022. The EV adoption gap between wealthy and emerging economies continues to
grow in the near term, but Japan significantly lags other wealthy countries.
The fleet grows even faster, rising from 27 million passenger EVs on the road at the end of
2022 to over 100 million by 2026.
Figure 1: Global near-term passenger EV sales and share of new passenger vehicle sales by market
Source: BloombergNEF. Note: Europe includes the EU, the UK and EFTA countries. EV includes BEVs and PHEVs.
Combustion vehicle sales have peaked. Sales of internal combustion vehicles peaked in
2017 and are now in long-term decline. By 2026, sales of combustion vehicles are 39% lower
than their peak in 2017. The combustion vehicle fleet peaks in 2025.
The long-term picture is getting brighter, but challenges remain. EVs reach 44% of
global passenger vehicle sales by 2030 and 75% by 2040 in our Economic Transition
Scenario. After increasing rapidly from 2022 to 2035, EV sales growth slows down slightly in
the late 2030s in the main EV markets like Europe, China and the US as they begin to
saturate. Although public charging infrastructure is growing at pace globally, it still presents a
potential barrier to electrifying the last 10-20% of the market in many countries.
While EV sales exhibit a traditional ‘S-curve’ for adoption, each country and region starts on
this trajectory at different times. The varied start time and slowdown points between countries
mean that the global average appears more linear than any individual country. Despite rapid
EV adoption, less than 50% of the global passenger vehicle fleet is electric by 2040.
0.7 1.1 2.0 2.2 3.2
6.5
10.5
14.1
17.5
22.4
26.6
0
5
10
15
20
25
30
2016 2021 2026
Million
China Europe US Japan Canada S. Korea Southeast Asia Australia India Rest of World Global
0%
10%
20%
30%
40%
50%
60%
2016 2021 2026
ThisisanexcerptfromBloombergNEF’s2023ElectricVehicleOutlook.Tofindoutmoreaboutthefullreport,pleasecontactourteam.ExecutiveSummary730millionThetransportationandautomotivesectorsareundergoingaperiodofprofoundtransformation.ElectrificationisnowspreadingrapidlyinalmostallsegmentsofroadNumberofpassengerEVsontransport,frompassengercarstocommercialvehicles,busesandtwo-andthree-theroadin2040inthewheelers.EachcountryhasitsownuniquemixofvehiclesandwhileprogressvariesEconomicTransitionScenarioacrossthem,theoveralldirectionoftravelisincreasinglyclear.2029Technologychangesareatthecoreofthistransitionasbatterypriceshavefallendramaticallyoverthelastdecade.Batterypricesroseforthefirsttimein2022butYearroadtransportemissionsinnovationintheareaisnotslowingdown,withadvancesinareaslikesolid-statepeakbatteries,next-generationcathodeandanodechemistries,andsodium-iontechnologyallreachingcommercializationinthenextfewyears.$1.9trillionYettechnologychangesalonearenotenoughtokeeptheroadtransportsectorontrackCharginginfrastructurefornet-zeroemissionsbymid-century.Policymakershaveanimportantroletoplayinmarketopportunitybetweendrivingtheautomotivemarkettowardzero-emissionsoptions,improvingfuelefficiency,todayand2050inthegettingthepowersystemreadyforelectricvehicles,andinreducingoverallcarEconomicTransitionScenariodependency.Eliminatingemissionsfromroadtransportwillrequireallhandsondeck,includingautomakers,batterymanufacturers,chargingcompanies,gridoperators,miners,largefleetoperatorsandconsumers.Asmomentumgrows,neweconomicopportunitiesaretakingshape.Batteriesandelectricvehicleshavetakencenterstageinnewdiscussionsonindustrialpolicy,withcountriesnowcompetingtoattractinvestmentandbuildnewclustersofhigh-valuemanufacturing.Meanwhile,regulatorsandgridoperatorsarelookingatwaystoensureEVsbenefitthepowersystem.Electrificationisnottheonlyvectorofchange.Sharedmobility,vehicleconnectivityand,eventually,autonomousvehiclesarealsosettoreshapeautomotiveandfreightmarketsaroundtheworld.Urbanizationalsocontinuesitssteadymarch,leadingtoincreasedconcernsaroundvehiclecongestionandurbanairquality.ThisreportdrawsonBloombergNEF’steamofsectoralandregionalexpertsaroundtheworld.Itupdatesouroutlookforhowroadtransportcouldevolveoverthenext30years.ItincludesanalysisonEVadoptioninpassengervehicles,commercialvansandtrucks,two-andthree-wheeledvehiclesandbusesglobally.Italsolooksatotherdrivetrains,includinghybrids,naturalgasandfuelcells,andthenexplorestheresultingimpactsofalloftheseonelectricitymarkets,oildemand,batterymaterials,charginginfrastructureandCO2emissions.Thekeyfindingsareasfollows:•Directelectrificationviabatteriesisthemostefficient,cost-effectiveandcommerciallyavailableroutetofullydecarbonizingroadtransport.Fuelcellvehiclesplayaroleinsomehard-to-electrifylong-haultruckingapplicationsbutplaynomeaningfulroleintheNoportionofthisdocumentmaybereproduced,scannedintoanelectronicsystem,distributed,publiclydisplayedorusedasthebasisofderivativeworkswithoutthepriorwrittenconsentofBloombergFinanceL.P.Formoreinformationontermsofuse,pleasecontactsales.bnef@bloomberg.net.Copyrightand1©BloombergFinanceL.P.2023Disclaimernoticeonpage22appliesthroughout.passengervehiclemarket.Syntheticfuelsdonotarriveatscaleintimeoratapricepointneededtohaveamaterialimpactonroadtransport.•EVsalescontinuetosurgeinthenextfewyears,risingfrom10.5millionin2022toalmost27millionin2026.TheEVshareofglobalnewpassengervehiclesalesjumpsfrom14%in2022to30%in2026.Sharesinsomemarketsaremuchhigher,withEVsreaching52%ofsalesinChinaand42%inEurope.SomeEuropeancarmarketsmoveevenfaster,withtheNordicsat89%andGermanyat59%.IntheUS,amajorpushfromtheInflationReductionActmeansEVsmakeupnearly28%ofpassengervehiclesalesby2026,upfrom7.6%in2022.TheEVadoptiongapbetweenwealthyandemergingeconomiescontinuestogrowinthenearterm,butJapansignificantlylagsotherwealthycountries.Thefleetgrowsevenfaster,risingfrom27millionpassengerEVsontheroadattheendof2022toover100millionby2026.Figure1:Globalnear-termpassengerEVsalesandshareofnewpassengervehiclesalesbymarketMillion60%3026.62522.450%2017.540%30%1514.120%10%10.5100%20166.550.71.12.02.23.2020212026202120262016ChinaEuropeUSJapanCanadaS.KoreaSoutheastAsiaAustraliaIndiaRestofWorldGlobalSource:BloombergNEF.Note:EuropeincludestheEU,theUKandEFTAcountries.EVincludesBEVsandPHEVs.•Combustionvehiclesaleshavepeaked.Salesofinternalcombustionvehiclespeakedin2017andarenowinlong-termdecline.By2026,salesofcombustionvehiclesare39%lowerthantheirpeakin2017.Thecombustionvehiclefleetpeaksin2025.•Thelong-termpictureisgettingbrighter,butchallengesremain.EVsreach44%ofglobalpassengervehiclesalesby2030and75%by2040inourEconomicTransitionScenario.Afterincreasingrapidlyfrom2022to2035,EVsalesgrowthslowsdownslightlyinthelate2030sinthemainEVmarketslikeEurope,ChinaandtheUSastheybegintosaturate.Althoughpubliccharginginfrastructureisgrowingatpaceglobally,itstillpresentsapotentialbarriertoelectrifyingthelast10-20%ofthemarketinmanycountries.WhileEVsalesexhibitatraditional‘S-curve’foradoption,eachcountryandregionstartsonthistrajectoryatdifferenttimes.Thevariedstarttimeandslowdownpointsbetweencountriesmeanthattheglobalaverageappearsmorelinearthananyindividualcountry.DespiterapidEVadoption,lessthan50%oftheglobalpassengervehiclefleetiselectricby2040.Noportionofthisdocumentmaybereproduced,scannedintoanelectronicsystem,distributed,publiclydisplayedorusedasthebasisofderivativeworkswithoutthepriorwrittenconsentofBloombergFinanceL.P.Formoreinformationontermsofuse,pleasecontactsales.bnef@bloomberg.net.Copyrightand2©BloombergFinanceL.P.2023Disclaimernoticeonpage22appliesthroughout.Figure2:Globalpassengervehiclesalesbydrivetrain–Figure3:Globalpassengervehiclefleetbydrivetrain–EconomicTransitionScenarioEconomicTransitionScenarioMillionInternalBillionBattery100combustion1.6electric90Hybrid1.4Plug-in80hybrid70Plug-in1.260hybridHybrid50140BatteryInternal30electric0.8combustion20100.600.40.220222025203020352040020252030203520402020Source:BloombergNEF.Source:BloombergNEF.•Electrificationisnowspreadingquicklytoallareasofroadtransport.LightcommercialEVsalesaresettorisequicklyduetoattractiveeconomics,moremodelsavailable,growingfleetcommitmentsandcitypolicies,reachingalmost70%ofglobalsalesby2040,ledbyChina.Theeconomicsofelectricheavytrucksimproverapidlythroughoutthe2020sandbecomeascheapasdieselequivalentsevenforlong-haulapplications.However,fuelcostsstillmatterandnaturalgasremainseconomicallycompetitive.Fuelcelltruckcostsdeclineaswell,butuncertaintyontheirtrajectoryishigh.Overallroadfreightdemandrises46%from2020to2040,highlightingtheneedforcompetitivezero-emissionsoptionsinthissegment.Municipalbusesarealsoelectrifyingquickly.EuropeandtheUSbegintocatchupwithChinainthismarketandEVsreach36%and24%ofmunicipalbussalesrespectivelyby2026.Two-andthree-wheeledvehiclesalesalsocontinuetoriseinemergingeconomiesandaresettobealmostallelectricgloballyby2040.Figure4:Totalcostofownershipofheavy-dutytruckinlong-hauldutycyclein2030$/km0.80.70.6Diesel0.5Naturalgas0.40.3Battery0.2electricFuelcell0.10.0ChinaGermanyUSSource:BloombergNEF.Note:Theheavy-dutytruckismodeledonaClass8vehiclewith800kilometersofreal-worlddrivingrange.Noportionofthisdocumentmaybereproduced,scannedintoanelectronicsystem,distributed,publiclydisplayedorusedasthebasisofderivativeworkswithoutthepriorwrittenconsentofBloombergFinanceL.P.Formoreinformationontermsofuse,pleasecontactsales.bnef@bloomberg.net.Copyrightand3©BloombergFinanceL.P.2023Disclaimernoticeonpage22appliesthroughout.•Reachingnet-zeroroadtransportemissionsby2050isstillpossiblebutmuchfasterprogressisneeded.ThegapbetweenBNEF’sEconomicTransitionScenarioandtheNetZeroScenarioissmallerthaninanyofourpreviousprojections.ThisisduetonewstrongerpolicysupportintheUS,earlyEVprogressinafewemergingeconomieslikeIndia,ThailandandIndonesia,growingglobalinvestmentincharginginfrastructureandthebatterysupplychain,andtechnologyinnovationslikesodium-ionbatteries.Astrongerpushisstillneeded.Heavytrucksinparticulararefarbehindthenet-zerotrajectoryandshouldbeapriorityfocusforpolicymakers.Gridinvestments,gridconnectionsandpermittingprocessesalsoneedtobestreamlinedtosupportthelargenumberofchargingpointsneededforthetransition.Table1:RoadtransportsegmentprogresstowardnetzeroSegmentCurrentshareofCurrentZero-emissionvehicle(ZEV)LevelofpolicyinterventionThree-wheeledroadtransportestimatedfleetsharein2050–EconomicneededtohitNetZeroScenariovehiclesCO2emissionsglobalfleetsizeTransitionScenario(100%ZEVshare)by2050<1%119million95%OntrackTwo-wheeled5%1billion78%Almostontrack:minoradditionalvehiclesmeasuresneededMunicipalbuses1%3.5million87%Almostontrack:minoradditionalmeasuresneededLightcommercial11%165million76%Positivetrajectory:moderatevehiclesadditionalmeasuresneededPassengervehicles53%1.3billion70%Positivetrajectory:moderateadditionalmeasuresneededMedium+heavy30%82million32%Notontrack:strongadditionalcommercialvehiclesmeasuresneededurgentlySource:BloombergNEF,variousgovernmentsources.Note:FleetsizerepresentsvehiclesofalldrivetraintypesandareestimatesbasedonvarioussourcesandBNEFdata.Somevaluesrounded.Currentemissionsandfleetsizedataarefor2022.•Theshifttoelectrificationcreatesaverylargeeconomicopportunity.ThecumulativevalueofEVsalesacrossallsegmentshits$8.8trilliondollarsby2030and$57trillionby2050intheEconomicTransitionScenario.Thisjumpstoover$88trillionby2050intheNetZeroScenario.EVsandbatteriesarenowacentralpartofmanycountries’industrialpolicyandcompetitiontoattractinvestmentislikelytoincreaseinthecomingyears.Figure5:CumulativeglobalEVmarketopportunitybyregion–EconomicTransitionScenario2030204020509%16%22%2%21%$8.8trillion43%3%35%31%24%3%$30.1trillion21%3%$56.7trillion3%22%20%21%ChinaUS$9.7tril22l3i02o%23E%%n11u%%ropeIndiaJapanOtherSource:BloombergNEF.Estimatesarecumulativespendingstartingin2023.Dollarsareinreal2022.Noportionofthisdocumentmaybereproduced,scannedintoanelectronicsystem,distributed,publiclydisplayedorusedasthebasisofderivativeworkswithoutthepriorwrittenconsentofBloombergFinanceL.P.Formoreinformationontermsofuse,pleasecontactsales.bnef@bloomberg.net.Copyrightand4©BloombergFinanceL.P.2023Disclaimernoticeonpage22appliesthroughout.•Largeinvestmentsareneededinallareasofthebatterysupplychain.Annuallithium-batterydemandgrowsrapidly,approaching5.7TWhannuallyby2035inourEconomicTransitionScenario.Meetingthisdemandrequireslargebutachievableincreasesinmaterials,componentsandcellproduction.Thereisover7.4TWhofnameplatecellmanufacturingcapacityplannedby2025.Thisismorethanprojecteddemandinthesameyear,butactualexcesssupplywillbelowerduetovaryingutilizationrates,commissioningdelaysandabandonments.Increasingly,governmentsandautomakersareseekingtolocalizetheirrespectivesupplychainsthroughanumberofpoliciesrangingfromdirectsubsidiestobattery‘passports’.Sustainedinvestmentwillberequiredinthesecondhalfofthedecadetokeepupwithdemand.Atleast$188billionneedstobeinvestedinbatterycellandcomponentplantsbytheendofthedecade.Figure6:Annualbatteryfactoryinvestmentbyscenario$billion8058.957.2604044.4Separators27.8Electrolytes2023.5CathodesAnodes0Batterycells2022Actual2023-302031-402023-302031-40ETS-yearlyNZS-yearlySource:BloombergNEF.Note:ETS=EconomicTransitionScenario.NZS=NetZeroScenario.BatteryfactoryrequirementsincludeinvestmentneededtomeetEVdemandaswellasstationaryenergystorage.UndertheNetZeroScenario,newdemandforlithium-ionbatteriesis1.7timesthatofourEconomicTransitionScenario,reaching244TWhcumulativelyby2050.Thankstoincreasingreservesandareductioninuseinbatteries,cobaltandnickelreservesarenowenoughtosupplybothourEconomicTransitionandNetZeroScenarios.LithiumlooksmorechallengingandcurrentlyknownreserveswouldbedepletedinourNetZeroScenarioevenwithrecycling.Newbatterychemistriesandreductionsinpacksizescanhelpoffsetthispressure.Scalingnewresourcedevelopmentandrefiningcapacitywillbekeytokeepupwithdemandinanygivenyear.Noportionofthisdocumentmaybereproduced,scannedintoanelectronicsystem,distributed,publiclydisplayedorusedasthebasisofderivativeworkswithoutthepriorwrittenconsentofBloombergFinanceL.P.Formoreinformationontermsofuse,pleasecontactsales.bnef@bloomberg.net.Copyrightand5©BloombergFinanceL.P.2023Disclaimernoticeonpage22appliesthroughout.Figure7:Annualmetalsdemandfromlithium-ionbatteriesundertheNetZeroScenarioMillionmetrictons2022vs20506050Cobalt3x4030Manganese29x2010Phosphorus22x0Iron26x20202025Graphite5xNickel9xLithium22xAluminum12xCopper16x20302035204020452050Source:BloombergNEF.Note:Lithiumisexpressedinmillionmetrictonslithiumcarbonateequivalent(LCE).Demandoccursattheminemouth,oneyearbeforebatterydemand.Multiplesbetween2022and2050arebasedonannualdemandinthegivenyear.•Oildemandfromroadtransportisverynearitspeak.Electricvehiclesofalltypesarealreadydisplacing1.5millionbarrels/dayofoildemand.Thisrisesdramaticallyintheyearsahead,leadingtoapeakinoverallroadfueldemandin2027.DemandintheUSandEuropehasalreadypeaked,whiledemandinChinaissettopeakin2024.Globaloildemandfromtwo-wheelers,three-wheelersandbuseshasalsoalreadypeakedanddemandfrompassengercarsissettopeakin2025.Commercialvehiclestakelongertoshiftasheavytruckscontinuetorelyondieseltomoveboomingfreightdemand.Figure8:Globaloildemand–EconomicTransitionScenarioFigure9:OildemandfromroadtransportbyscenarioMillionbarrelsperdayMillionbarrelsperday12060100Peakdemand:50802027:Roadtransport602027:TransportOther40402029:Globaloilsectors20300Other2000transport20Road10EconomicTransitionScenariotransportNetZeroScenario0201020202030204020502021203020402050Source:BloombergNEF.Note:Includesbiofuels.Source:BloombergNEF.Note:Includesbiofuels.IntheEconomicTransitionScenario,oildemandfromroadtransportdeclinesto33.5millionb/din2040,some21%lowerthan2022levels.Fuelefficiencyimprovementofcombustionvehiclesandtheuptakeofsharedmobilityalsoplayanimportantroleinreducingoildemand.Noportionofthisdocumentmaybereproduced,scannedintoanelectronicsystem,distributed,publiclydisplayedorusedasthebasisofderivativeworkswithoutthepriorwrittenconsentofBloombergFinanceL.P.Formoreinformationontermsofuse,pleasecontactsales.bnef@bloomberg.net.Copyrightand6©BloombergFinanceL.P.2023Disclaimernoticeonpage22appliesthroughout.Thefallinoildemanddoesnotnecessarilymeanacollapseinoilprices.Ifinvestmentsinnewsupplycapacityfallfasterthandemand,pricescouldremainelevatedandvolatile.TheNetZeroScenarioseesamuchsharperdeclineinoildemandenroutetoafullphase-outfromroadtransportin2050.•AdditionalelectricitydemandfromEVsispartofabroaderelectrificationpushtoreachnetzero.GlobalelectricitydemandfromalltypesofEVsincreasesfivetimesfrom210TWhin2022to1,027TWhin2030intheEconomicTransitionScenario,beforeafurthertriplingindemandto3,251TWhin2040.EVsaddabout14%toglobalelectricitydemandin2050intheEconomicTransitionScenario,butonly12%intheNetZeroScenariodespitemorevehiclesontheroad.ThisisbecausetheNetZeroScenarioincludesadditionalelectricitydemandfromelectrificationofheating,industryandelectrolyzeruseforhydrogenproductionusedinothersectors.Formore,seeourNewEnergyOutlook(webterminal).Insomefast-growingcountrieslikeIndiaEVsaddjust9-10%tototalelectricitydemand.Over$1trillionincumulativeinvestmentinEVcharginginfrastructureisrequiredgloballyoverthisperiod.Therearegrowingreasonsforoptimismthatthiscanbeachieved,withsomecountriesnowbuildingchargersaheadoftherequiredpace.Therequiredchargerinvestmentisstillsmallcomparedtooverallautosales.Forexample,Chinarequires$453billionofcumulativeinvestmentincharginginfrastructureto2040,comparedtoautomotivesalesrevenuefromdomesticcarsalesandexportsof$750billionin2022alone.Figure10:ElectricitydemandoutlookforselectedregionsbyscenarioGlobalChinaUSETSETSNZSETSNZSNZS12%10%14%TWhTWhTWh202018,00020209,00070,00060,00015,00013%50,00014%12,00040,0006,00020%30,00020,0009,00010,0006,0003,00003,000202020502050020502050020502020205020202020EuropeGermanyTWhIndia8,000ETSNZSETSNZS6,000ETSNZS24%18%27%13%4,000TWhTWh2,00010%8,0001,5009%06,0001,00020204,0005002,0000205020202050020502020205020502020205020202020GeneraldemandElectricvehicleelectricitydemandSource:BloombergNEF.Note:UsesgeneralelectricitydemandprojectionsfromBNEF’sNewEnergyOutlook2022.Thisisfinalenergyconsumptionandexcludesanylossesintransmission.PercentagesrefertopercentageofEVelectricitydemandoftotalin2050.NetZeroScenarioincludesadditionaldemandfromelectrificationofheating,industry,andelectrolyzeruseforhydrogen.Noportionofthisdocumentmaybereproduced,scannedintoanelectronicsystem,distributed,publiclydisplayedorusedasthebasisofderivativeworkswithoutthepriorwrittenconsentofBloombergFinanceL.P.Formoreinformationontermsofuse,pleasecontactsales.bnef@bloomberg.net.Copyrightand7©BloombergFinanceL.P.2023Disclaimernoticeonpage22appliesthroughout.•Thisyear’sEVOutlookincludesfivenewThematicHighlights,eachofwhichexploresadifferentpartofthetransitioninvehiclemarketsaroundtheworld.Thetopicsare:–EVpriceparityunderdifferentbatterypricescenarios–WillaverageEVrangeskeeprising?–Emergingbatterytechnologies:sodium-ionbatteries,solid-statebatteries,andnext-generationanodetechnologies–High-poweredchargingfortruckingfleets–Theimpactofautonomousvehicles•EVpriceparityisgettingcloserbutprogressvariesbysegmentandcountry.Pricesforlithium-ionbatteriesincreasedforthefirsttimein2022andarelikelytoremainelevatedin2023.Thisdelaystheupfrontpriceparityofbatteryelectricvehicleswithcombustioncars.Despitethenear-termincrease,EVsstillreachup-frontpriceparitywithcomparablecombustionvehicles,withoutsubsidies,bytheendofthedecadeinmostsegments.EveninBNEF’sbase-casescenariothereisawidevariationinpurchaseeconomicsbetweengeographies,dictatedbythedifferencesintheaveragebatterysizeofBEVssoldorhowprice-sensitiveanygivencarmarketis.WhileelectricSUVsinEuropestartachievingpriceparityasearlyas2025,BEVsinthesamesegmentinIndiadonothitparityuntilafter2030,duetoverylowaveragepurchasepricesinthesesegments.LargerbatteriesinUSelectriccarsmeanthatupfrontpriceparityinthecountryisonetothreeyearslaterthanforBEVsinEurope.Acceleratingbattery-packpricedeclines–usingan18%learningratescenario–pushesupfrontpriceparityofEVsforwardbyanaverageofonetotwoyears.Delayingitusinga16%learningratescenariowouldsettheindustrybackbyanaverageoftwotothreeyears.Ifpricesremainelevatedforlonger,EVadoptionwillslow.Regardlessofthescenariodiscussed,regionaldifferencesremain,andthosewilldictatethepaceofelectrificationandthetypeofBEVsadoptedineachregion.Figure11:Impactoflithium-ionbatterylearningratescenariosonyearofpriceparitybetweenEVsandcombustionvehiclesbyregionandsegmentEuropeUSSmallSmallMediumMediumLargeLargeSUV202520302035SUV20252030203520202020RangeBasecase16%lithium-ionbatterylearningrate18%lithium-ionbatterylearningrateSource:BloombergNEF.Note:Dotsrepresentyearofup-frontpriceparitywithoutsubsidies.Priceparityyearforbase-caseoverlapswiththe16%learningratescenarioforlargeandSUVsegmentsinEurope,SUVinUSandSUVinJapan.Noportionofthisdocumentmaybereproduced,scannedintoanelectronicsystem,distributed,publiclydisplayedorusedasthebasisofderivativeworkswithoutthepriorwrittenconsentofBloombergFinanceL.P.Formoreinformationontermsofuse,pleasecontactsales.bnef@bloomberg.net.Copyrightand8©BloombergFinanceL.P.2023Disclaimernoticeonpage22appliesthroughout.•AverageEVrangesarerisingquickly,addingpressuretothebatterysupplychain.Globally,BEVmodelslaunchedin2022hadanaveragerangeof337kilometers,upfrom230kmin2018.Averagebatterypacksizeshaveincreased10%annuallyoverthisperiod,goingfrom40kWhto60kWh.Still,rangesremainbelowconsumerexpectationsinmostmarketsandsegments,promptingautomakerstolaunchlonger-rangemodelstoeaserangeanxiety.Continuedimprovementsinbatteryandpowertraintechnologiescouldquicklypushrangeuptoconsumerexpectations,whileimprovedchargerdensityandchargingspeedcouldreducerangerequirementsinthelongterm.IncreasingBEVrangeswillfurtherboostdemandforlithium-ionbatteriesasEVadoptionaccelerates,puttingmorepressureonthebatterymaterialssupply.AnannualBEVrangeincreaseof5%inChina,theUSandEuropefrom2023to2030wouldaddnearly50%moredemandforlithium,nickelandcobaltinthosemarkets,comparedtoourbasecasescenariowhereBEVrangesremainflat.ThiswouldalsopushoutthedateforEVpriceparity.WideadoptionofadvancedbatterytechnologiesandrecyclingcouldhelpmitigatematerialssupplyconstraintswhileenablingautomakerstodeliverlongBEVranges.Governmentsshoulddirectinvestmenttowardsupportingdensepublicchargingnetworksasacost-effectivewaytohelpavoidanEVrange‘armsrace’Figure12:Lithium-ionbatterydemandforpassengerBEVsFigure13:LithiumdemandforpassengerBEVsinChina,inChina,theUSandEuropebybatterypacksizescenariotheUSandEuropebybatterypacksizescenarioGWhBasecaseThousandmetrictonsLCEBasecase5,000scenario2,500scenario4,0003,000Growth2,000Growth2,000scenarioscenario1,0001,500DeclineDecline0scenario1,000scenarioHistorical500Historical202220252030203502035202220252030Source:BloombergNEF.Note:Growthscenarioassumes5%growthinaverageBEVrangefrom2023to2030.Declinescenarioassumes2%annualdeclineinaveragerangefrom2025onwards.Includeslithiumcarbonateandlithiumhydroxide.•Severalimportantnext-generationbatterytechnologiesareenteringthecommercializationphase.Thesewilldrivefurtherperformanceandcostimprovements.Improvementsinbatteryenergydensitytodatehavebeendrivenbyadvancesincathodematerials,suchasthemovetowardchemistrieswithhighernickelcontent.Next-generationtechnologiesincludingsiliconanodes,solid-statebatteriesandsodium-ionbatterieswillbringfurtherimprovementsinperformanceandcost.Theywillalsoshiftrawmaterialsupplychains.Thenextgenerationanodetechnologiesinourbasecasedisplace46%ofgraphitein2035comparedwithanall-graphitescenario.Similarly,inourbasecasesodium-ioncellsdisplace7%oflithiumdemandin2035,comparedtoanosodium-ionscenario.However,inthecaseofsolid-statebatteries,BNEFestimatesthat45%to130%morelithiumwouldbeneededonabattery-celllevelifthesolid-stateelectrolyteweretosubstituteboththeliquidelectrolyteandseparator.Solidelectrolytescontainmorelithiumduetoslowerdiffusionoflithiumionsthroughthesolidelectrolytethanaliquidone.Noportionofthisdocumentmaybereproduced,scannedintoanelectronicsystem,distributed,publiclydisplayedorusedasthebasisofderivativeworkswithoutthepriorwrittenconsentofBloombergFinanceL.P.Formoreinformationontermsofuse,pleasecontactsales.bnef@bloomberg.net.Copyrightand9©BloombergFinanceL.P.2023Disclaimernoticeonpage22appliesthroughout.Thesenewertechnologieseitherinvolvenewbatterycomponentsorproducts,newmanufacturingprocessesorestablishingnewrawmaterialsupplychains.Theirsuccesswillbedeterminedbyhoweasilytheycanbescaledupandintegratedintocurrentmanufacturingtechnologyandprocesses.Figure14:Impactofsodium-ionbatteryuptakescenariosonlithiumdemandMillionmetrictons(LCE)5.04.0Nosodium-ion3.0Base-case(ETS)2.0Aggressivesodium-ion1.00.02025203020352020Source:BloombergNEF.Note:LCE=lithiumcarbonateequivalent.ETS=EconomicTransitionScenario.•Chargingisachallengeandopportunityforlong-haulelectrictrucking.Thetotalownershipcostsofelectricheavycommercialvehiclesaresettoapproachthoseofdieselequivalentsaround2030,evenforlong-haulapplications.Creatingasufficientchargingnetwork,however,bringschallengesforvehicleowners,chargingstationdevelopers,utilitiesandgridoperators.Truckchargingstationswilldrawmulti-megawattsofpowerandoperatorstodayarealreadydevelopingstationsexceeding25MW.Developingsuchstationscangeneratehighreturns,butthiswillbebasedonmanylocationalfactors,suchastheavailabilityofagridconnection,thecosttoacquireasiteandthestructureofelectricitytariffs.Thereiscurrentlyawidevariabilityinpricingforpeak-timeelectricityconsumptionthatchangesthebusinessmodel.Theinternalrateofreturnofsuchprojectsvarieswidely.Itcanexceed40%withmoderateupfrontinvestmentandelectricitytariffsbutcanalsoquicklybecomenegativewhentrucksattempttochargeatpeaktimesanddemandchargeshit.Tosmooththeroll-outofchargingfortrucks,gridoperatorsshouldfocusonelectricitytariffsthataresuitableforhighpowerconsumptionandregulatorsshouldassesshow‘leastregret’investmentsingridinfrastructurecanbemadeaheadoftimetolimitroll-outdelays.Suchinvestmentscanbelargeand,dependingonwhethertheyaredoneonthedistributionorthetransmissionlevel,canrangefrom$100,000to$800,000perkilometer.•Autonomousvehiclesarestillawildcardfortheglobalvehiclemarket.Steadyprogressisstillbeingmadeonautonomousvehicle(AV)technology.AVfleetscoveredover80millionkilometersin2022andoperatorsareexpandingservicestonewcities.TherolloutofAVscouldhavebigimpactsonthesizeanddistributionofthepassengervehiclefleet.Duetotheuncertaintyaroundautonomousvehicledeployment,wehavelaidouttwoscenariosinwhichthetimelineofAVadoptionvariessignificantlyfromourEconomicTransitionScenario(ETS).Dependingontheregioninwhichtheyoperate,robotaxiscancoverthreetofivetimestheannualdistancecomparedtoprivatepassengervehicles,meaningthatinahighAVadoptionscenario,fewervehiclesarerequiredtoofferthesamelevelofmobilitytoconsumers.OurNoportionofthisdocumentmaybereproduced,scannedintoanelectronicsystem,distributed,publiclydisplayedorusedasthebasisofderivativeworkswithoutthepriorwrittenconsentofBloombergFinanceL.P.Formoreinformationontermsofuse,pleasecontactsales.bnef@bloomberg.net.Copyrightand10©BloombergFinanceL.P.2023Disclaimernoticeonpage22appliesthroughout.high-AVscenarioresultsina2050fleetthatis29%smallerthaninourETS.Ourlow-AVscenarioresultsinthepassengervehiclefleetcontinuingtogrowoutto2050,endingupatover1.8billionvehicles,over29%greaterthanintheETS.Thiswillhaveanimpactoninvestmentdecisionsacrossalltransportinfrastructure.Inparticular,charginginfrastructurecompanieswillneedtomakestrategicchoicesonthenumber,typeandlocationofchargersbasedondifferentAVuptakescenarios.Thehigh-AVscenariorequires40%fewerEVchargersthanthelow-AVscenarioby2050.Approximately200millionlow-speedchargerscanbeeliminatedfromtheoutlookthroughtheadditionoflessthan1millionhigh-speedchargersthatareoptimizedforalargerobotaxifleet.Figure15:GlobalpassengervehiclefleetoutlookunderFigure16:OutlookfornumberofchargingconnectorsvaryingautonomousvehicleadoptionscenariosundervaryingautonomousvehicleadoptionscenariosBillionsMillions2.06005001.5400LowAVLowAV1.0ETS300ETSHighAV200HighAV0.51000.0020202025203020352040204520502020202520302035204020452050Source:BloombergNEF.Note:ETSisBNEF’sEconomicSource:BloombergNEF.ETSisBNEF’sEconomicTransitionTransitionScenario.HighandLowAVscenariosreflectvaryingScenario.HighandLowAVscenariosreflectvaryingAVAVadoption.adoption.Noportionofthisdocumentmaybereproduced,scannedintoanelectronicsystem,distributed,publiclydisplayedorusedasthebasisofderivativeworkswithoutthepriorwrittenconsentofBloombergFinanceL.P.Formoreinformationontermsofuse,pleasecontactsales.bnef@bloomberg.net.Copyrightand11©BloombergFinanceL.P.2023Disclaimernoticeonpage22appliesthroughout.ListoffiguresinthereportFigure1:Globalnear-termpassengerEVsalesandshareofnewpassengervehiclesalesbymarketFigure2:Globalpassengervehiclesalesbydrivetrain–EconomicTransitionScenarioFigure3:Globalpassengervehiclefleetbydrivetrain–EconomicTransitionScenarioFigure4:Totalcostofownershipofheavy-dutytruckinlong-hauldutycyclein2030Figure5:CumulativeglobalEVmarketopportunitybyregion–EconomicTransitionScenarioFigure6:AnnualbatteryfactoryinvestmentbyscenarioFigure7:Annualmetalsdemandfromlithium-ionbatteriesundertheNetZeroScenarioFigure8:Globaloildemand–EconomicTransitionScenarioFigure9:OildemandfromroadtransportbyscenarioFigure10:ElectricitydemandoutlookforselectedregionsbyscenarioFigure11:Impactoflithium-ionbatterylearningratescenariosonyearofpriceparitybetweenEVsandcombustionvehiclesbyregionandsegmentFigure12:Lithium-ionbatterydemandforpassengerBEVsinChina,theUSandEuropebybatterypacksizescenarioFigure13:LithiumdemandforpassengerBEVsinChina,theUSandEuropebybatterypacksizescenarioFigure14:Impactofsodium-ionbatteryuptakescenariosonlithiumdemandFigure15:GlobalpassengervehiclefleetoutlookundervaryingautonomousvehicleadoptionscenariosFigure16:OutlookfornumberofchargingconnectorsundervaryingautonomousvehicleadoptionscenariosFigure17:Marketsbystatusofnet-zeroemissionstargetsFigure18:TotalglobalCO2emissionsfromroadtransportationbyenergysource–EconomicTransitionScenarioFigure19:Roadtransportemissionsavoidedbythepenetrationofelectricandfuelcellvehicles–EconomicTransitionScenarioFigure20:Changeinroadtransportemissionsbetween2022and2050Figure21:GlobalCO2emissionsfromroadtransportbyregion–EconomicTransitionScenarioFigure22:GlobalCO2emissionsfromroadtransportbysegment–EconomicTransitionScenarioFigure23:CO2emissionsintensityofelectricitygenerationFigure24:Shareofglobalpowergenerationfromzero-emissionsourcesandshareofpassengerkilometerstravelledinzero-emissionvehicles–EconomicTransitionScenario.Figure25:EVchargingemissionsCO2intensity–2023Figure26:EVchargingemissionsCO2intensity–2030Figure27:CO2tailpipeemissionsfromroadtransport–EconomicTransitionScenarioandNetZeroScenarioFigure28:Zero-emissionvehiclefleetshareoutlooks–ETSversusNZSFigure29:Zero-emissionvehiclesalesshareoutlooks–ETSversusNZSFigure30:EVshareofpassengervehiclesales,selectedcountriesFigure31:SoutheastAsiaEVshareofpassengervehiclesalesscenariocomparison,EVO2023andEVO2022Figure32:CumulativeglobalEVmarketopportunitybysegment–EconomicTransitionScenarioFigure33:CumulativeglobalEVmarketopportunitybyregion–EconomicTransitionScenarioNoportionofthisdocumentmaybereproduced,scannedintoanelectronicsystem,distributed,publiclydisplayedorusedasthebasisofderivativeworkswithoutthepriorwrittenconsentofBloombergFinanceL.P.Formoreinformationontermsofuse,pleasecontactsales.bnef@bloomberg.net.Copyrightand12©BloombergFinanceL.P.2023Disclaimernoticeonpage22appliesthroughout.Figure34:EstimatedglobalEVmarketopportunityby2050–EconomicTransitionScenariovs.NetZeroScenarioFigure35:GlobalelectricvehiclefleetintheEconomicTransitionScenarioandthegaptomeetNetZeroScenarioFigure36:GlobalelectricroadvehiclesalesintheEconomicTransitionScenarioandthegaptoNetZeroScenarioFigure37:Globalkilometerstraveledbyselectedvehiclesegments,2022Figure38:Globalpassengervehiclefleet,2022Figure39:Globalpassengervehiclesales,2022Figure40:Globaltwo-wheelersales,2022Figure41:Globalcommercialvehiclesales,2022Figure42:GlobalpassengerEVsalesbymarketFigure43:GlobalpassengerEVsalesbydrivetrainFigure44:PassengerBEVandPHEVshareoftotalcarsalesinselectedmarkets,2022Figure45:Annualgrowthrateforpassengervehiclesales,2021to2022Figure46:GlobalEVfleetsizesbysegmentandmarketFigure47:Cumulativelithium-ionbatterycellmanufacturingcapacityFigure48:Annuallithium-ionbatterydemandbyapplicationFigure49:Volume-weightedaveragelithium-ionpackpriceFigure50:CumulativeglobalpublicchargingconnectorsFigure51:AnnualpubliccharginginstallationsbycountryFigure52:DensityofpublicchargingperelectricvehicleacrossselectedcountriesFigure53:Ultra-fastchargingshareofpublicchargingroll-outin2022Figure54:Averagepublicchargingpriceforselectedcountriesin2022Figure55:Valueperunitofelectricityfromcarboncreditprograms(October2022)Figure56:ShareofpassengervehiclessoldbyautomakerswithanICEphase-outannouncementFigure57:Automakers’drivetraindevelopmenttargetsFigure58:SimplifiedpassengerEVoutlookmethodologyFigure59:Breakdownofvehiclekilometerstraveledbysegmentandmarket,2022Figure60:OutlookforannualkilometerstraveledbytheglobalpassengervehiclefleetbymarketFigure61:OutlookforannualkilometerstraveledbytheglobalpassengervehiclefleetbytypeFigure62:GlobalpassengervehiclefleetoutlookbymarketFigure63:GlobalpassengervehiclefleetoutlookbytypeFigure64:GlobalannualpassengervehiclesalesoutlookbymarketFigure65:GlobalannualpassengervehiclesalesoutlookbytypeFigure66:Globalnear-termpassengerEVsalesandEVshareofnewpassengervehiclesalesbymarketFigure67:GlobalpassengervehiclesalesbycountryFigure68:GlobalpassengervehiclesalesbydrivetrainFigure69:Globalnear-termpassengerEVfleetbymarketFigure70:Globalnear-termEVshareofpassengervehiclefleetbymarketFigure71:Comparisonofgasoline,residentialelectricity,andaveragepublicchargingpricesFigure72:Globalpassengervehiclesalesbydrivetrain–EconomicTransitionScenarioFigure73:Globalpassengervehicleshareofsalesbydrivetrain–EconomicTransitionScenarioFigure74:ChinapassengerPHEVsalesbysegmentFigure75:ChinapassengerPHEVsalesbypricerangeFigure76:Globallong-termpassengerEVsalesbymarket–EconomicTransitionScenarioNoportionofthisdocumentmaybereproduced,scannedintoanelectronicsystem,distributed,publiclydisplayedorusedasthebasisofderivativeworkswithoutthepriorwrittenconsentofBloombergFinanceL.P.Formoreinformationontermsofuse,pleasecontactsales.bnef@bloomberg.net.Copyrightand13©BloombergFinanceL.P.2023Disclaimernoticeonpage22appliesthroughout.Figure77:Globallong-termEVshareofnewpassengervehiclesalesbymarket–EconomicTransitionScenarioFigure78:GlobalEVshareofnewpassengervehiclesales–EconomicTransitionScenarioFigure79:EVshareofnewpassengervehiclesalesinselectedEuropeancountries–EconomicTransitionScenarioFigure80:USEVshareofnewpassengervehiclesales–EconomicTransitionScenarioFigure81:PassengerEVsalesintheUS–EconomicTransitionScenarioFigure82:EVshareofnewpassengervehiclesalesintheUS–EconomicTransitionScenarioFigure83:GlobalpassengerEVsalesbymarket–EconomicTransitionScenarioFigure84:Globalpassengervehiclefleetbydrivetrain–EconomicTransitionScenarioFigure85:Globalpassengervehicleshareoffleetbydrivetrain–EconomicTransitionScenarioFigure86:Globallong-termpassengerEVfleetbymarket–EconomicTransitionScenarioFigure87:Globallong-termEVshareofpassengervehiclefleetbymarket–EconomicTransitionScenarioFigure88:Passengervehiclefleetsplitoutlooksbydrivetrain–EconomicTransitionScenarioandNetZeroScenarioFigure89:Passengervehiclefleetoutlookbydrivetrain–EconomicTransitionScenarioFigure90:Passengervehiclefleetoutlookbydrivetrain–NetZeroScenarioFigure91:Zero-emissionvehicleshareoftotalpassengervehiclesales–EconomicTransitionScenarioandNetZeroScenarioFigure92:PassengerEVsalesandfleetintheEconomicTransitionScenarioandNetZeroScenarioFigure93:NationaltargetstophaseoutinternalcombustionvehiclesalesFigure94:Country-levelEVshareofsales–EconomicTransitionScenarioandNetZeroScenarioFigure95:Passengerfuel-cellvehiclesalesFigure96:BatterypackpricesscenariosFigure97:EuropemediumBEVpre-taxpricebreakdown,ICEpre-taxpriceandshareofbatterycostsFigure98:Base-casebatterypackpricescenarioFigure99:Priceparityunderthebase-casescenariobyregionandsegmentFigure100:ImplicationsforbatterypackpriceparitypointFigure101:LearningratebatterypackpricescenariosFigure102:Volume-weightedaverageregionalandglobalbatterypackpricesin2022Figure103:RegionalbatterypackpricescenariosFigure104:Impactoflithium-ionbatterylearningratescenariosonyearofupfrontpriceparitybetweenEVsandcombustionvehiclesbyregionandvehiclesegmentFigure105:Impactoflearningratescenariosonyearofupfrontpriceparitybypackregion,vehiclesegment,packsizeandmarketshareFigure106:ImpactofregionalscenariosonyearofupfrontpriceparitybyregionandvehiclesegmentFigure107:ImpactofPTCscenariosonyearofupfrontpriceparityintheUSFigure108:USBEVpre-taxpriceunderselectscenariosandUSICE,pre-taxpriceFigure109:GlobalaverageBEVrangebysegmentFigure110:BEVsalesbymarketandsegmentFigure111:AverageBEVrangebymarketandsegmentFigure112:EVsperpublicchargingconnectorbymarketFigure113:GlobalaverageBEVpacksizebysegmentFigure114:AverageBEVbatterypacksizebymarketandsegmentNoportionofthisdocumentmaybereproduced,scannedintoanelectronicsystem,distributed,publiclydisplayedorusedasthebasisofderivativeworkswithoutthepriorwrittenconsentofBloombergFinanceL.P.Formoreinformationontermsofuse,pleasecontactsales.bnef@bloomberg.net.Copyrightand14©BloombergFinanceL.P.2023Disclaimernoticeonpage22appliesthroughout.Figure115:GlobalaverageBEVefficiencyFigure116:AverageBEVefficiencybymarketandsegmentFigure117:Consumers’mainconcernsoverBEVsbymarket,2022Figure118:Consumers’expectedBEVdrivingrangebymarket,2023Figure119:EuropeBEVsalesbyrangeFigure120:ChinaBEVsalesbyrangeFigure121:NumberofBEVmodelsavailablewithrangesofmorethan400kmFigure122:BEVmodelrangeforselectedcarmanufacturersFigure123:Lithium-ionbatterydemandforpassengerBEVsbymarketandscenarioFigure124:LithiumcarbonatedemandforpassengerBEVbatteriesbymarketandscenarioFigure125:LithiumhydroxidedemandforpassengerBEVbatteriesbymarketandscenarioFigure126:CobaltsulfatedemandforpassengerBEVbatteriesbymarketandscenarioFigure127:NickelsulfatedemandforpassengerBEVbatteriesbymarketandscenarioFigure128:Commercialvanandtrucksalesoutlookbyclass-EconomicTransitionScenarioFigure129:Commercialvanandtruckfleetoutlookbyclass-EconomicTransitionScenarioFigure130:Globalelectricandfuelcellcommercialvan,truck,andbusesnear-termsalesoutlookFigure131:Historicalandshort-termforecastofcombinedelectricandfuelcellcommercialvan,truck,andbussalessharebycountryFigure132:Low-andzero-emissioncommercialvanandtruckmodelavailabilityFigure133:Low-andzero-emissioncommercialvanandtruckrangeinzero-emissionmodeFigure134:Technologyandsupplychainstrategiesforzero-emissiontruckmanufacturersFigure135:Electricandfuelcellvanandlight-dutytrucksalesinChinaFigure136:Electricandfuelcellmedium-andheavy-dutytrucksalesinChinaFigure137:Electricvanandlight-trucksalesandshareinSouthKoreaFigure138:Totalcostofownershipofheavy-dutytruckinlong-hauldutycyclein2030Figure139:HistoricalandforecastbatterypricesforelectriccommercialvehiclesFigure140:FuelcellstackcostFigure141:HydrogenpumpcostFigure142:EfficiencyandweightofavailablebatteryelectrictruckmodelsFigure143:Electricandfuelcellcommercialvan,truck,andbussalesglobaloutlookFigure144:Electricandfuelcellcommercialvan,truck,andbusfleetglobaloutlookFigure145:Medium-andheavy-dutyfuelcelltruckfleetbydutycycleFigure146:Hydrogendemand–EconomicTransitionScenarioFigure147:Hydrogendemand–NetZeroScenarioFigure148:ElectricandfuelcellcommercialvanandtruckadoptionoutlookinCaliforniaandcomparisonwiththeAdvancedCleanTrucktargetsFigure149:Lightcommercialvanandtruckfleetshareoutlooksbydrivetrain–EconomicTransitionandNetZeroScenarioFigure150:Medium/heavycommercialvanandtruckfleetshareoutlooksbydrivetrain–EconomicTransitionandNetZeroScenarioFigure151:Lightcommercialvanandtrucksalesshareoutlooksbydrivetrain–EconomicTransitionandNetZeroScenarioFigure152:Medium/heavycommercialvanandtrucksalesshareoutlooksbydrivetrain–EconomicTransitionandNetZeroScenarioFigure153:Zero-emissionbusshareoftotalbussales–NetZeroScenarioandEconomicTransitionScenarioFigure154:Zero-emissionbusshareoftotalbusfleet–NetZeroScenarioandEconomicTransitionScenarioFigure155:CommercialvehiclefleetsizesintheUSNoportionofthisdocumentmaybereproduced,scannedintoanelectronicsystem,distributed,publiclydisplayedorusedasthebasisofderivativeworkswithoutthepriorwrittenconsentofBloombergFinanceL.P.Formoreinformationontermsofuse,pleasecontactsales.bnef@bloomberg.net.Copyrightand15©BloombergFinanceL.P.2023Disclaimernoticeonpage22appliesthroughout.Figure156:Distributionofthe300largestcommercialvehiclefleets(excludingheavy-dutytrucks)intheUSFigure157:Distributionofthe200largestheavy-dutycommercialvehiclefleetsintheUSFigure158:DailydistancedistributionfortractorsanddeliverytrucksintheUSFigure159:VanandtruckutilizationinGermanyin2021Figure160:AnnualaveragetrafficflowinGermanyin2021Figure161:Shareofelectricityconsumptionoccurringinthepeakdemandperiod(4pm–9pm)byscenarioFigure162:Capitalandenergycostover10yearsfordieselandelectrictrucksinCaliforniaFigure163:ChargingstationIRRbasedonthefeetotruckdrivers,theutilitytariffandsitecosts(non-peakscenario)Figure164:Monthlydemandchargesandenergycostsdependingontariff–peakscenarioFigure165:TypicalpeakdemandofvariouspowerusersFigure166:GridvoltagesofEuropeandistributionnetworksandsuitabilitytoaccommodate20MWtruckstopFigure167:Globaltwo-wheelersalesbymarketFigure168:Globaltwo-wheelersalesoutlookbymarketFigure169:Globaltwo-wheelerfleetoutlookbymarketFigure170:Two-wheelersalesoutlookbysegmentinChina,Indonesia,VietnamandIndiaFigure171:Electrictwo-wheelersalesoutlookbymarketFigure172:Electricshareoftwo-wheelersalesoutlookbymarketFigure173:Long-termelectrictwo-wheelersalesoutlookbymarket–EconomicTransitionScenarioFigure174:Long-termelectrictwo-wheelerfleetoutlookbymarket–EconomicTransitionScenarioFigure175:Globalelectricshareoftwo-wheelersalesoutlookbysegment–EconomicTransitionScenarioFigure176:Globallong-termtwo-wheelersalesoutlookbydrivetrain–EconomicTransitionScenarioFigure177:Globalshareoftwo-wheelersalesbydrivetrain–EconomicTransitionScenarioFigure178:Globalshareoftwo-wheelerfleetbydrivetrain–EconomicTransitionScenarioFigure179:Two-wheelerfleetsplitbydrivetrain–EconomicTransitionScenarioandNetZeroScenarioFigure180:Two-wheelerfleetoutlookbydrivetrain–NetZeroScenarioFigure181:Two-wheelerfleetoutlookbydrivetrainandmarket–NetZeroScenarioFigure182:Globalthree-wheelersalesbymarketFigure183:Globalthree-wheelersalesoutlookbymarketFigure184:Globalthree-wheelerfleetoutlookbymarketFigure185:Long-termelectricthree-wheelersalesoutlookbymarket–EconomicTransitionScenarioFigure186:Long-termelectricthree-wheelerfleetoutlookbymarket–EconomicTransitionScenarioFigure187:Globalthree-wheelersalesoutlookbydrivetrain–EconomicTransitionScenarioFigure188:Globalshareofthree-wheelersalesbydrivetrainFigure189:Globalshareofthree-wheelerfleetbydrivetrainFigure190:Three-wheelerfleetsplitbydrivetrain–EconomicTransitionScenarioandNetZeroScenarioFigure191:Three-wheelerfleetoutlookbydrivetrain–NetZeroScenarioFigure192:Three-wheelerfleetoutlookbydrivetrainandmarket–NetZeroScenarioNoportionofthisdocumentmaybereproduced,scannedintoanelectronicsystem,distributed,publiclydisplayedorusedasthebasisofderivativeworkswithoutthepriorwrittenconsentofBloombergFinanceL.P.Formoreinformationontermsofuse,pleasecontactsales.bnef@bloomberg.net.Copyrightand16©BloombergFinanceL.P.2023Disclaimernoticeonpage22appliesthroughout.Figure193:Lithium-ionbatterydemandoutlook–EconomicTransitionScenarioFigure194:Lithium-ionbatterypackpriceoutlookFigure195:Log-loglithium-ionbatterypackexperiencecurveFigure196:Volume-weightedaveragelithium-ionbatterypricein2022Figure197:Publiclyannouncedlithium-ioncellpricesFigure198:Publiclyannouncedlithium-ionpackpricesFigure199:Annuallithium-ionbatterycellmanufacturingcapacityFigure200:LithiumcellandcomponentmanufacturingcapacitybyregionofplantlocationFigure201:Historicalandestimatedchangestobattery-packenergydensityFigure202:EvolutionofcathodechemistryacrossallpassengerelectricvehiclesegmentsFigure203:Metalcontentofselectedlithium-ionbatterycathodematerialsFigure204:EvolutionofcathodechemistryacrossallcommercialelectricvehiclesegmentsFigure205:Evolutionofcathodechemistryfore-busesFigure206:Evolutionofelectrictwo-wheelerbatterymixbyshareofbatterydemandFigure207:Evolutionofcathodechemistryfortwo-andthree-wheeledelectricvehiclesFigure208:Lithium-andsodium-ionelectricvehiclebatteryanodechemistryoutlookFigure209:LithiumcarbonatesupplyanddemandbalanceFigure210:LithiumhydroxidesupplyanddemandbalanceFigure211:CobaltsulfatesupplyanddemandbalanceFigure212:Refinedbattery-gradenickelsupplyanddemandbalanceFigure213:ManganesesulfatesupplyanddemandbalanceFigure214:AnnualbatterydemandoutlookunderBNEF’sEconomicTransitionScenarioandNetZeroScenarioFigure215:BatteryfactoryinvestmentbyscenarioFigure216:Annualmetalsdemandfromlithium-ionbatteriesundertheNetZeroScenarioFigure217:CumulativelithiumdemandandreservesFigure218:CumulativecobaltdemandandreservesFigure219:Cumulativeclass1nickeldemandandreserveFigure220:CumulativemanganesedemandandreserveFigure221:Statusofbatteryperformancemetricsin2022Figure222:Outlookforbatteryperformancemetricsin2035Figure223:Selectedcellenergydensitytargetsfrom2010-2035Figure224:Specificcapacitybyanodematerial,benchmarksandselectedcompanyannouncementsFigure225:Anodechemistrymixscenarios,basedongigawatt-hoursFigure226:ImpactofanodechemistrymixscenariosonrawmaterialdemandFigure227:Companies’announcedplansonsolid-stateelectrolytesforlithium-ionbatteriesFigure228:Sodium-ionbatterydemandinelectricvehicles–EconomicTransitionScenarioFigure229:Timelineofcompanies’announcementsonsodium-ionEVtechnologyFigure230:Sodium-ionbatteryuptakescenariosconsideredinresourcefootprintanalysisFigure231:Impactofsodium-ionbatteryuptakescenariosonlithiumdemandFigure232:Roaddemandandfueldisplacedbyelectricandfuelcellvehicles–EconomicTransitionScenarioFigure233:Evolutionofoildemandfromroadtransport–EconomicTransitionScenarioFigure234:Oildemandavoidedbyelectricandfuelcelldrivetrainsacrosssegments–EconomicTransitionScenarioFigure235:Chinaroadfueldemand–EconomicTransitionScenarioFigure236:Oildemandgrowthbyregion–EconomicTransitionScenarioFigure237:Oildemandbyfuel–EconomicTransitionScenarioNoportionofthisdocumentmaybereproduced,scannedintoanelectronicsystem,distributed,publiclydisplayedorusedasthebasisofderivativeworkswithoutthepriorwrittenconsentofBloombergFinanceL.P.Formoreinformationontermsofuse,pleasecontactsales.bnef@bloomberg.net.Copyrightand17©BloombergFinanceL.P.2023Disclaimernoticeonpage22appliesthroughout.Figure238:OildemandfromroadtransportbyscenarioFigure239:OildemandgrowthfromroadtransportbyscenarioFigure240:OildemandfromroadtransportbyscenarioandsegmentFigure241:Globaloildemand–EconomicTransitionScenarioFigure242:Globalelectricvehicleelectricitydemandbyscenarioto2050Figure243:GlobalelectricvehicleelectricitydemandsplitbyvehiclesegmentFigure244:AssumedefficiencyofpassengerelectricvehiclesbycountryandvehiclesegmentFigure245:AssumedefficiencyofcommercialtrucksbyvehicleclassFigure246:ElectricitydemandoutlookforselectedregionsbyscenarioFigure247:PeakelectricitydemandbymarketandEVshareofpeakdemandFigure248:PeakdemandperelectricvehicleshiftedduetosmartchargingFigure249:PublicfastchargingdemandbyhourforFastnedFigure250:AnnualgridexpenditureonelectricvehicleintegrationFigure251:Outlookforannualkilometerstraveledbytheglobalpassengervehiclefleetbytype–EconomicTransitionScenarioFigure252:Globalpassengervehiclefleetoutlookbytype–EconomicTransitionScenarioFigure253:GlobalpassengervehiclefleetoutlookundervaryingautonomousvehicleadoptionscenariosFigure254:OutlookfornumberofchargingconnectorsundervaryingautonomousvehicleadoptionscenariosFigure255:VenturecapitalandprivateequityinvestmentsinautonomousvehicleandrelatedtechnologiesFigure256:NotablepoliciesonautonomousvehicledeploymentFigure257:CumulativeautonomouskilometerstestedonpublicroadsFigure258:Discloseddriverlesskilometerscompleted,bycompanyFigure259:ShareofautonomouskilometerstestedinCalifornia,bydrivetrainFigure260:Shareofvehiclekilometerstraveledbyroadtype,CaliforniaFigure261:RobotaxishareofpassengervehiclekilometersinahighAVadoptionscenarioFigure262:RobotaxishareofpassengervehiclekilometersinalowAVadoptionscenarioFigure263:GlobalpassengervehiclefleetoutlookundervaryingautonomousvehicleadoptionscenariosFigure264:ElectrickilometersasashareoftotalFigure265:PassengervehicleelectricitydemandbyscenarioFigure266:ElectricvehiclecharginginfrastructurerolloutinthehighAVuptakescenarioFigure267:ElectricvehiclecharginginfrastructurerolloutinthelowAVuptakescenarioFigure268:Globalelectricvehicledemandforelectricity,charginginfrastructureandinvestmentFigure269:Averageannualelectricvehiclechargersalesbyregionandchargertype–EconomicTransitionScenarioFigure270:Globalelectricvehicledemandforelectricity,charginginfrastructureandinvestmentto2050Figure271:Regionaloverviewofpassengerelectricvehicledemandforcharginginfrastructure–EconomicTransitionScenarioFigure272:Shareofcommercialelectricvehicleswithadepotcharger–EconomicTransitionScenarioFigure273:Assumedaveragedailytraveldistanceandelectricitydemandofcommercialelectricvehicles–EconomicTransitionScenarioFigure274:Heavy-dutytruckshareoftotalkilometersbydutycycleFigure275:Annualchargerinvestmentbyregion–EconomicTransitionScenarioFigure276:Annualchargerinvestmentbycategory–EconomicTransitionScenarioNoportionofthisdocumentmaybereproduced,scannedintoanelectronicsystem,distributed,publiclydisplayedorusedasthebasisofderivativeworkswithoutthepriorwrittenconsentofBloombergFinanceL.P.Formoreinformationontermsofuse,pleasecontactsales.bnef@bloomberg.net.Copyrightand18©BloombergFinanceL.P.2023Disclaimernoticeonpage22appliesthroughout.Figure277:ShareoftotalcoststodeploycharginginfrastructureincludinggridsupportcostsFigure278:AnnouncedEuropeanpublicultra-fastchargingconnectorscomparedwiththeEconomicTransitionScenarioFigure279:Fastned’selectricitydemandandnetworkutilizationFigure280:ElectricitydemandfromTeslavehiclesbylocationin2022Figure281:ElectricitydemandfrompublicchargersinChinaFigure282:ComparisonofChina’scharginginvestmentandautomotivesalesrevenueFigure283:ShareofChina’spassengercarsalesbyautomakercategoryFigure284:ExampleofpublicchargingnetworkgrowthcurveandinfluencesFigure285:Europe’sannualpublicchargersalesbynewandreplacementchargersFigure286:ElectricvehiclecharginginfrastructurerolloutinEuropeto2040–EconomicTransitionScenarioFigure287:PublicchargingelectricitydemandbycountryinEurope–EconomicTransitionScenarioFigure288:PublicchargingnetworksizebycountryinEurope–EconomicTransitionScenarioFigure289:ElectricvehiclecharginginfrastructurerolloutintheUSto2040–EconomicTransitionScenarioFigure290:California’sshareofUSelectricvehicleelectricitydemandFigure291:California’selectricvehicleelectricitydemand–EconomicTransitionScenarioFigure292:ComparisonofBNEFandCalifornia’schargeroutlooks(excludinghomes)Figure293:AnnualprivatechargerinstallationsinChinaFigure294:AnnualpublicchargerinstallationsinChinaFigure295:ElectricvehiclecharginginfrastructurerolloutinChinato2040–EconomicTransitionScenarioFigure296:ComparisonofweightedaveragebatterypacksizesforEVO2023andEVO2022Figure297:Comparisonofglobalpassengervehiclekilometerstraveled,passengervehiclefleetandannualsalesinEVO2023andEVO2022Figure298:ComparisonofAustralia,SoutheastAsiaandIndiapassengerEVsalesoutlookbetweenEVO2023andEVO2022Figure299:ComparisonofglobalEVsalesoutlookbetweenEVO2023andEVO2022Figure300:ComparisonofglobalEVshareofsalesbetweenEVO2023andEVO2022Figure301:CaliforniaannualEVsalesoutlookFigure302:NordicsannualEVsalesoutlookFigure303:Comparisonofglobalcommercialvehiclekilometerstraveled,commercialvehiclefleetandannualsalesinEVO2023andEVO2022–EconomicTransitionScenarioFigure304:Comparisonofelectricbussharesofvehiclekilometerstraveled,vehiclesonroadandsalesinEVO2023andEVO2022Figure305:Comparisonofglobaltwo-wheelervehiclekilometerstraveled,vehiclesonroadandannualsalesinEVO2023andEVO2022Figure306:Comparisonofelectricthree-wheelersharesofvehiclekilometerstraveled,vehiclesonroadandsalesinEVO2023andEVO2022Figure307:ComparisonofcriticalbatterymetalsdemandinEVO2023andEVO2022Figure308:SimplifiedpassengerEVoutlookmethodologyFigure309:Simplifiedoutlookmethodologyforpassengervehicledemand,salesandfleetFigure310:HistoricalannualdistancetraveledbypassengervehiclesintheUSdividedbyGDPpercapitaFigure311:AnnualdistancetraveledbytheUSpassengervehiclefleetFigure312:Shared-mobilityserviceandrobotaxishareofannualdistancetraveledbytheUSpassengervehiclefleetNoportionofthisdocumentmaybereproduced,scannedintoanelectronicsystem,distributed,publiclydisplayedorusedasthebasisofderivativeworkswithoutthepriorwrittenconsentofBloombergFinanceL.P.Formoreinformationontermsofuse,pleasecontactsales.bnef@bloomberg.net.Copyrightand19©BloombergFinanceL.P.2023Disclaimernoticeonpage22appliesthroughout.Figure313:AnnualdistancetraveledbytheUSpassengervehiclefleetbytypeFigure314:USpassengervehiclefleetbytypeFigure315:USpassengervehiclesalesbytypeFigure316:Near-termEVadoptionforecastmethodologyFigure317:SUVsegmentBEVandICEpre-taxpricesandshareofbatterycostinEuropeFigure318:TotalcostofownershipofmediumICEsandBEVsintheUSandChinaFigure319:GlobalprivatepassengerEVsalesoutlookbysegment–EconomicTransitionScenarioFigure320:Thetruckingmarketandcurrentactivityofalternativefuels,bytrucksegmentFigure321:Freightdemand,commercialvehiclesalesandfleetsimplifiedoutlookmethodologyFigure322:RoadfreightdemandoutlookintheEconomicTransitionScenarioFigure323:OutlookforGDPandroadfreightdemandindexedto2022Figure324:Simplifiedtwo-wheeleroutlookmethodologyFigure325:SimplifiedcharginginfrastructureforecastmethodologyFigure326:DistributionofpopulationbyhousingtypeacrossEuropeFigure327:ShareofhousingbytypeforselectcountriesFigure328:Energydemandsplitforbattery-electricpassengervehiclesandvansbychargerlocationforallcountriesexceptChina,IndiaandSouthKoreaFigure329:Energydemandsplitforbattery-electricpassengervehiclesandvansbychargerlocationforChina,IndiaandSouthKoreaFigure330:Energydemandsplitforplug-inhybridelectricpassengervehiclesandvansbychargerlocationforallcountriesexceptChina,IndiaandSouthKoreaFigure331:Energydemandsplitforbattery-electricmedium-andheavy-dutycommercialEVsande-busesbychargerlocationFigure332:ShareofelectricitysuppliedtoEVsfromdifferentchargers,bypowerratingandlocationFigure333:UsageassumptionsforpassengervehicleandvanchargersFigure334:Usageassumptionsfore-busandtruckchargersatdepotsFigure335:Usageassumptionsfore-busandtruckchargersinpublicFigure336:7-22kWchargerpricesandinstallationcostassumptions,excludingChinaFigure337:50-1,000kWchargerpricesandinstallationcostassumptions,excludingChinaNoportionofthisdocumentmaybereproduced,scannedintoanelectronicsystem,distributed,publiclydisplayedorusedasthebasisofderivativeworkswithoutthepriorwrittenconsentofBloombergFinanceL.P.Formoreinformationontermsofuse,pleasecontactsales.bnef@bloomberg.net.Copyrightand20©BloombergFinanceL.P.2023Disclaimernoticeonpage22appliesthroughout.AboutusContactdetailsClientenquiries:•BloombergTerminal:press<Help>keytwice•Email:support.bnef@bloomberg.netColinMcKerracherManager,AdvancedTransportandStorageCopyright©BloombergFinanceL.P.2023.ThispublicationisthecopyrightofBloombergFinanceL.P.inconnectionwithBloombergNEF.Noportionofthisdocumentmaybephotocopied,reproduced,scannedintoanelectronicsystemortransmitted,forwardedordistributedinanywaywithoutpriorconsentofBloombergNEF.DisclaimerTheBloombergNEF("BNEF"),service/informationisderivedfromselectedpublicsources.BloombergFinanceL.P.anditsaffiliates,inprovidingtheservice/information,believethattheinformationitusescomesfromreliablesources,butdonotguaranteetheaccuracyorcompletenessofthisinformation,whichissubjecttochangewithoutnotice,andnothinginthisdocumentshallbeconstruedassuchaguarantee.Thestatementsinthisservice/documentreflectthecurrentjudgmentoftheauthorsoftherelevantarticlesorfeatures,anddonotnecessarilyreflecttheopinionofBloombergFinanceL.P.,BloombergL.P.oranyoftheiraffiliates(“Bloomberg”).Bloombergdisclaimsanyliabilityarisingfromuseofthisdocument,itscontentsand/orthisservice.NothinghereinshallconstituteorbeconstruedasanofferingoffinancialinstrumentsorasinvestmentadviceorrecommendationsbyBloombergofaninvestmentorotherstrategy(e.g.,whetherornotto“buy”,“sell”,or“hold”aninvestment).Theinformationavailablethroughthisserviceisnotbasedonconsiderationofasubscriber’sindividualcircumstancesandshouldnotbeconsideredasinformationsufficientuponwhichtobaseaninvestmentdecision.Youshoulddetermineonyourownwhetheryouagreewiththecontent.Thisserviceshouldnotbeconstruedastaxoraccountingadviceorasaservicedesignedtofacilitateanysubscriber’scompliancewithitstax,accountingorotherlegalobligations.Employeesinvolvedinthisservicemayholdpositionsinthecompaniesmentionedintheservices/information.Thedataincludedinthesematerialsareforillustrativepurposesonly.TheBLOOMBERGTERMINALserviceandBloombergdataproducts(the“Services”)areownedanddistributedbyBloombergFinanceL.P.(“BFLP”)except(i)inArgentina,AustraliaandcertainjurisdictionsinthePacificislands,Bermuda,China,India,Japan,KoreaandNewZealand,whereBloombergL.P.anditssubsidiaries(“BLP”)distributetheseproducts,and(ii)inSingaporeandthejurisdictionsservicedbyBloomberg’sSingaporeoffice,whereasubsidiaryofBFLPdistributestheseproducts.BLPprovidesBFLPanditssubsidiarieswithglobalmarketingandoperationalsupportandservice.Certainfeatures,functions,productsandservicesareavailableonlytosophisticatedinvestorsandonlywherepermitted.BFLP,BLPandtheiraffiliatesdonotguaranteetheaccuracyofpricesorotherinformationintheServices.NothingintheServicesshallconstituteorbeconstruedasanofferingoffinancialinstrumentsbyBFLP,BLPortheiraffiliates,orasinvestmentadviceorrecommendationsbyBFLP,BLPortheiraffiliatesofaninvestmentstrategyorwhetherornotto“buy”,“sell”or“hold”aninvestment.InformationavailableviatheServicesshouldnotbeconsideredasinformationsufficientuponwhichtobaseaninvestmentdecision.ThefollowingaretrademarksandservicemarksofBFLP,aDelawarelimitedpartnership,oritssubsidiaries:BLOOMBERG,BLOOMBERGANYWHERE,BLOOMBERGMARKETS,BLOOMBERGNEWS,BLOOMBERGPROFESSIONAL,BLOOMBERGTERMINALandBLOOMBERG.COM.AbsenceofanytrademarkorservicemarkfromthislistdoesnotwaiveBloomberg’sintellectualpropertyrightsinthatname,markorlogo.Allrightsreserved.©2023Bloomberg.Noportionofthisdocumentmaybereproduced,scannedintoanelectronicsystem,distributed,publiclydisplayedorusedasthebasisofderivativeworkswithoutthepriorwrittenconsentofBloombergFinanceL.P.Formoreinformationontermsofuse,pleasecontactsales.bnef@bloomberg.net.Copyrightand21©BloombergFinanceL.P.2023Disclaimernoticeonpage22appliesthroughout.

1、当您付费下载文档后,您只拥有了使用权限,并不意味着购买了版权,文档只能用于自身使用,不得用于其他商业用途(如 [转卖]进行直接盈利或[编辑后售卖]进行间接盈利)。
2、本站所有内容均由合作方或网友上传,本站不对文档的完整性、权威性及其观点立场正确性做任何保证或承诺!文档内容仅供研究参考,付费前请自行鉴别。
3、如文档内容存在违规,或者侵犯商业秘密、侵犯著作权等,请点击“违规举报”。

碎片内容

碳中和
已认证
内容提供者

碳中和

确认删除?
回到顶部
微信客服
  • 管理员微信
QQ客服
  • QQ客服点击这里给我发消息
客服邮箱