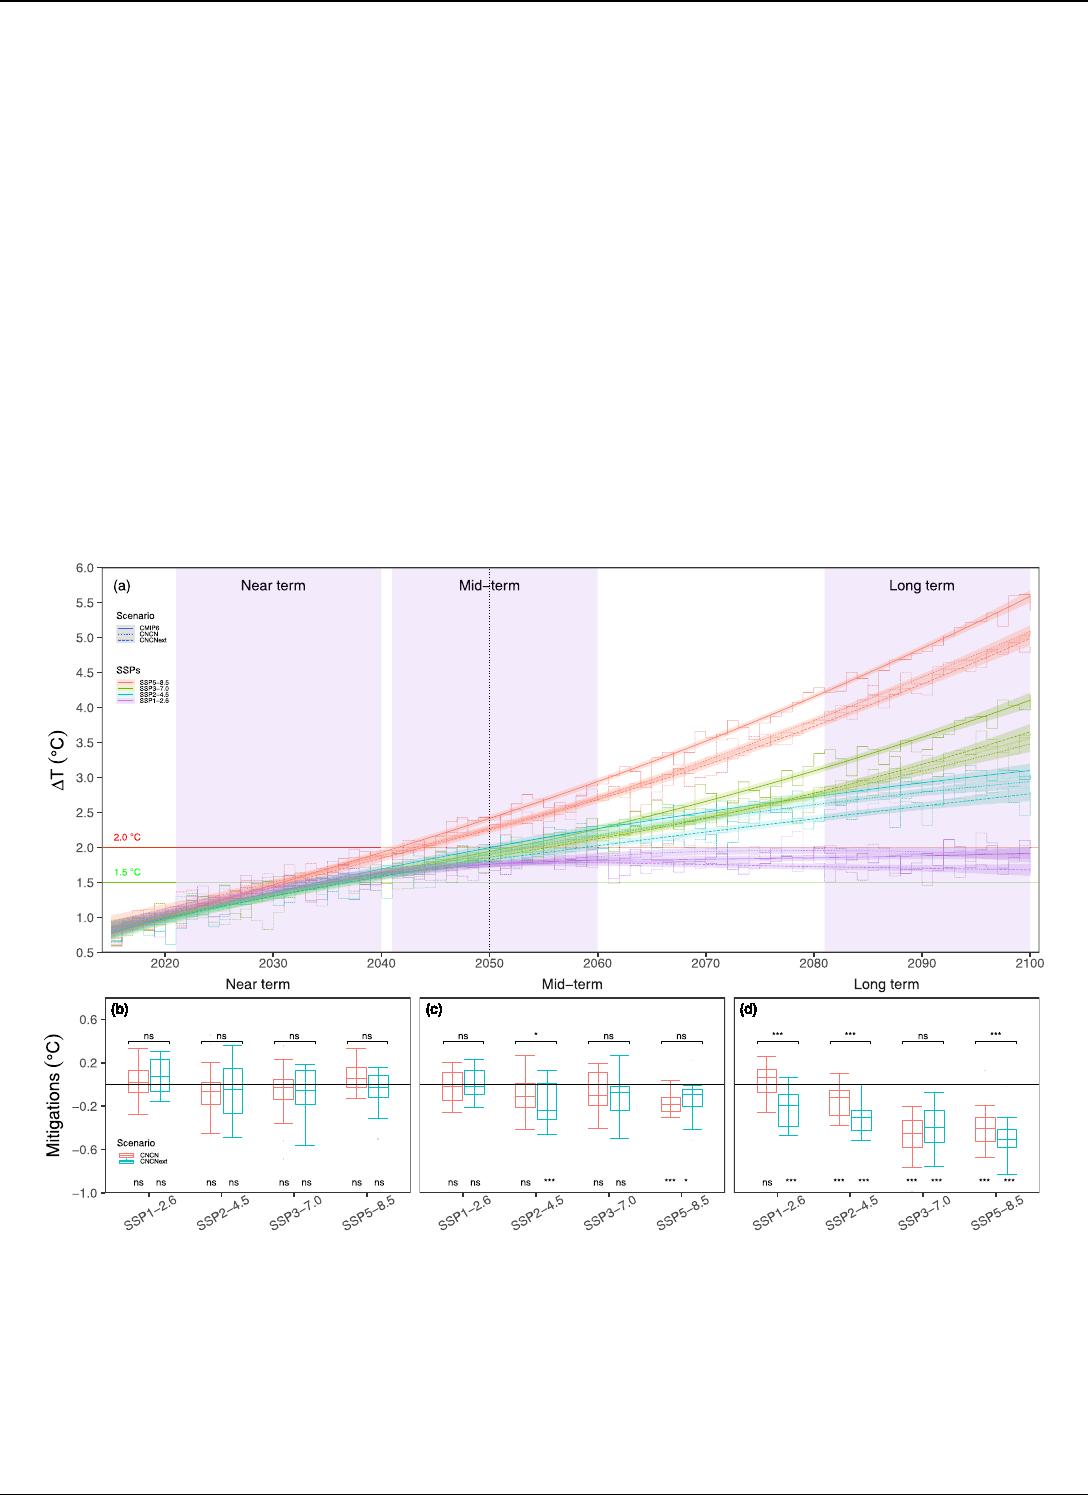
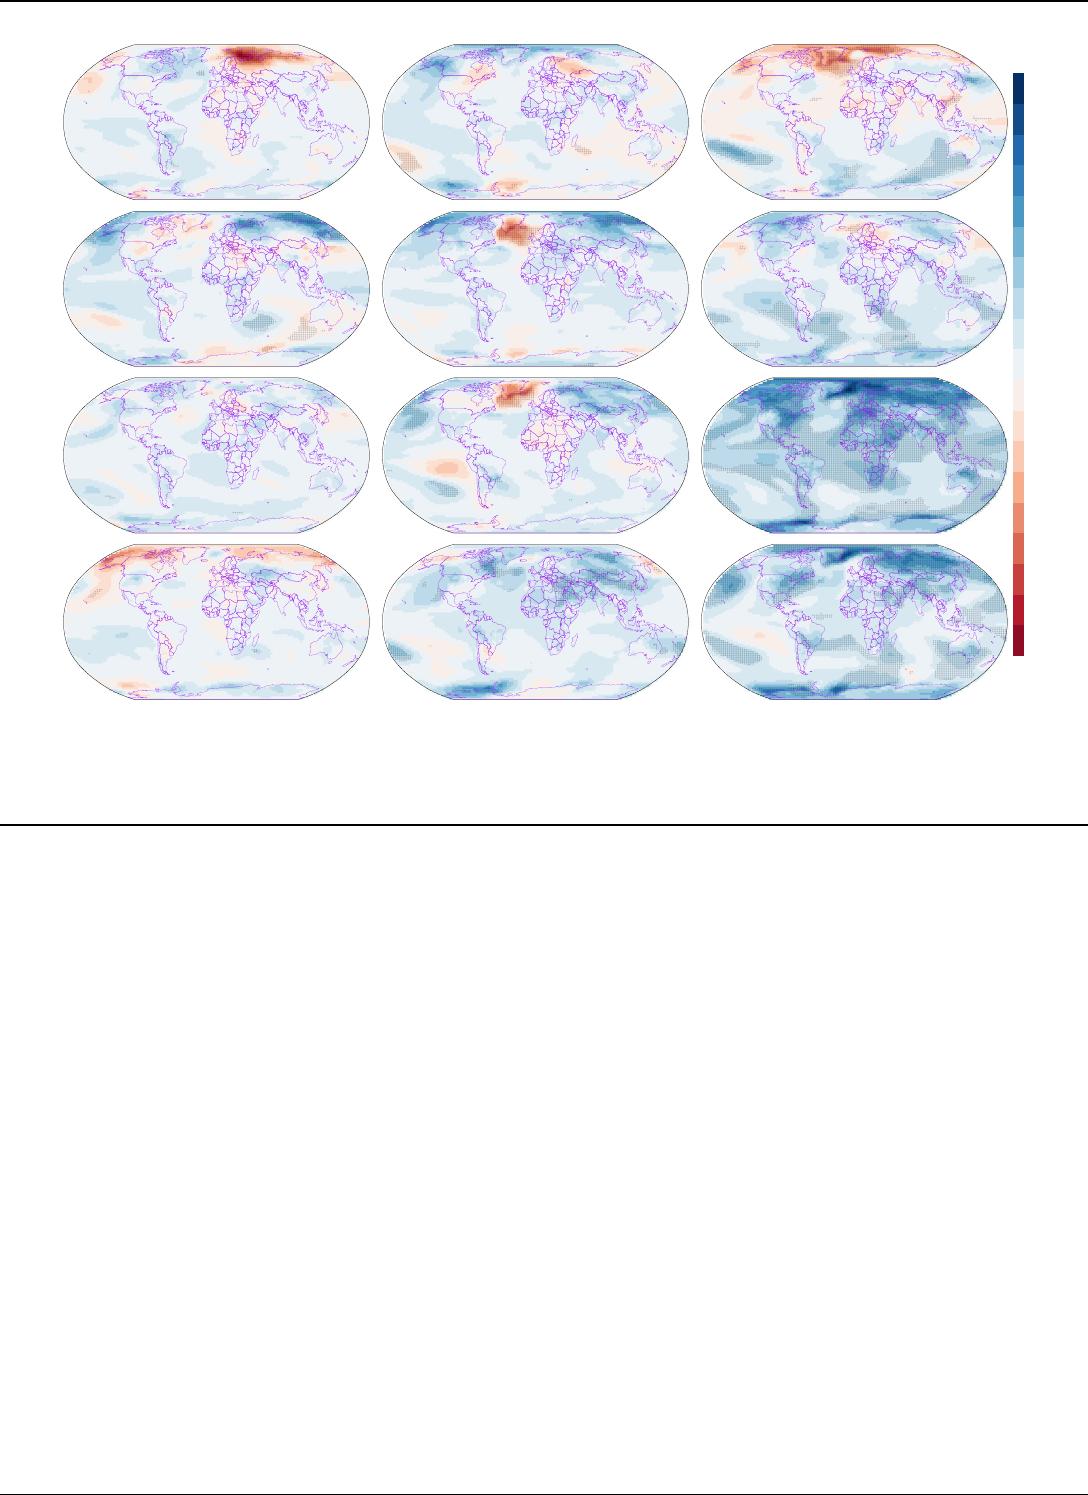
naturecommunicationsArticlehttps://doi.org/10.1038/s41467-022-33047-9MitigationofChina’scarbonneutralitytoglobalwarmingLonghuiLi1,2,3,YueZhang1,2,3,TianjunZhou4,KaicunWang5,CanWang6,TaoWang7,LinwangYuan1,2,3,KangxinAn6,ChenghuZhou8&GuonianLü1,2,3Projectingmitigationsofcarbonneutralityfromindividualcountriesinrela-tiontofutureglobalwarmingisofgreatimportancefordepictingnationalclimateresponsibilitybutispoorlyquantified.Here,weshowthatChina’scarbonneutrality(CNCN)canindividuallymitigateglobalwarmingby0.48°Cand0.40°C,whichaccountfor14%and9%oftheglobalwarmingoverthelongtermunderthesharedsocioeconomicpathway(SSP)3-7.0and5-8.5scenarios,respectively.FurtherincorporatingchangesinCH4andN2OemissionsinassociationwithCNCNtogetherwillalleviateglobalwarmingby0.21°Cand0.32°CforSSP1-2.6andSSP2-4.5overthelongterm,andevenby0.18°CforSSP2-4.5overthemid-term,butnosignificantimpactsareshownforallSSPsinthenearterm.Divergentresponsesinalleviatedwarmingareseenatregionalscales.Theresultsprovideausefulreferencefortheglobalstocktake,whichassessesthecollectiveprogresstowardstheclimategoalsoftheParisAgreement.Globalwarmingsincethepreindustrialerahasbeenprimarilyattrib-utedtotheincreaseinatmosphericCO2concentrations,whichmainlyresultsfromthecarbonemissionsoffossilfuelcombustion1,2.Thelikelyrangeofthetotalhuman-causedglobalsurfacetemperatureincreasefrom1850–1900to2010–2019is0.8°Cto1.3°C,withabestestimateof1.07°C2.Thecontributionsofhistoricalanthropogeniccarbonemissionshavebeenquantified,althoughthecurrentlyexistingqualificationsarebasedondifferentcriteriaanddifferinestimation3,4.Ifworldwidecarbonemissionscontinueatthecurrentrate,globalwarmingislikelytoexceed1.5°Cbetween2030and2052,andevenmorethan3–5°Cattheendofthe21stcentury2.Globalwarminghascausedarangeofbroadthreatstobothnaturalsystemandhumanity,includingincreasingextremeclimateevents,risingsealevels,andshiftingwildlifepopulationsandhabitats5.Tolimittheincreaseinglobalmeantemperaturebelow1.5°Cabovepreindustriallevels,reachingnetzeroofglobalCO2emissionsin2055andlimitingnon-CO2greenhousegas(GHG)emissionsafter2030arecrucialmitigationstrategies6.SincetheIntendedNationallyDeterminedContributionstomitigatingglobalwarmingagreeduponinthe2015ParisAgreement,morethan120countrieshavepledgedtoachievecarbonneutralityanddeclaredadate7.Inthecontextofthisuniqueopportunity,pro-jectingmitigationsofpledgedcarbonneutralitytofutureglobalwarmingisofthesameimportanceaspreviouseffortsdevotedtoquantifyinghistoricalclimateresponsibilities,whichcaninformtheimplementationofglobalclimatemitigationstrategiesandequalityindevelopmentfromnations’carbonemissions.AsoneofthelargeannualemittersofCO2emissions8,Chinahascommittedtopeakitscarbonemissionsbefore2030andattaincarbonneutralitybefore20607,9.SuchanambitiouspolicytargetforCO2emissionreductionisexpectedtomitigateglobalwarming.ArecentstudybasedonaverysimplifiedclimatemodelreportedthatChina’scarbonneutralityalonewillcontributea0.16–0.21°CavoidedglobalwarmingattheendoftheReceived:14October2021Accepted:25August2022Checkforupdates1JiangsuCenterforCollaborativeInnovationinGeographicalInformationResourceDevelopmentandApplication,Nanjing210023,China.2KeyLaboratoryofVirtualGeographicEnvironment(NanjingNormalUniversity),MinistryofEducation,Nanjing210023,China.3SchoolofGeographicalSciences,NanjingNormalUniversity,Nanjing210023,China.4LASG,InstituteofAtmosphericPhysics,ChineseAcademyofSciences,Beijing,China.5Sino-FrenchInstituteforEarthSystemScience,CollegeofUrbanandEnvironmentalSciences,PekingUniversity,Beijing100871,China.6SchoolofEnvironment,TsinghuaUniversity,Beijing,China.7StateKeyLaboratoryofTibetanPlateauEarthSystemandResourcesEnvironment(TPESRE),InstituteofTibetanPlateauResearch,ChineseAcademyofSciences,Beijing,China.8InstituteofGeographicalInformationScienceandNaturalResources,ChineseAcademyofScience,Beijing,China.e-mail:gnlu@njnu.edu.cnNatureCommunications(2022)13:531511234567890():,;1234567890():,;21stcentury10.However,themagnitudeofsuchmitigationhasnotyetbeenquantifiedusingafullycoupledEarthsystemmodelthatincor-poratesallcrucialcomponentsoftheclimatesystem.Inthiswork,weemploytheNCARCommunityEarthSystemModel(CESM)11toprojectthemitigationofChina’scarbonneutrality(CNCN)toglobalwarmingbycomparingfourpairsofsimulationscorrespondingtofoursharedsocioeconomicpathways(SSPs),includingSSP1-2.6,SSP2-4.5,SSP3-7.0andSSP5-8.5,whichrepresentdifferentanthropogenicsurfaceCO2emissionsinfuturescenariosofsocioeconomicdevelopment,populationgrowth,andlandandwaterrequirementsforfoodsupplies12.EachpairofsimulationsconsistsofonedefaultfromthesixthphaseofCoupledModelIntercomparisonProject(CMIP6)built-inCESMandanotheroneinwhichanthro-pogenicsurfaceCO2emissionsinChina’sdomainarereplacedwithvaluesinthepolicytargetofCNCNreleasedbyTsinghuaUniversityin202113(SupplementaryFig.S1).TheresultsshowthatChina’scarbonneutrality(CNCN)canindividuallymitigateglobalwarmingby0.48°Cand0.40°C,whichaccountfor14%and9%oftheaverageincreaseinglobalmeansurfacetemperature(GMST)overthelongterm(2081–2100)undertheSSP3-7.0andSSP5-8.5scenarios,respectively.WhenfurtherincorporatingchangesinCH4andN2OemissionsinassociationwithCNCN(CNCNext),thecombinedeffectsofthreepri-maryGHGswillslowdowntheGMSTby0.21°Cand0.32°CforSSP1-2.6andSSP2-4.5overthelongterm,andevenby0.18°CforSSP2-4.5overthemid-term(2041–2060).ResultsTemporalevolutionsofmitigationsofChina’scarbonneutralitytoglobalwarmingFollowingtheIPCCAR62,weexaminetheprojectedchangesinGMSTforthenearterm(2021–2040),mid-term(2041–2060)andlongterm(2081–2100)relativeto1850–1900(preindustrialperiod).Comparedtothepreindustrialperiod,theGMSTaveragedover2081–2100isprojectedtoincreaseby1.7°CunderthelowGHGemissionsscenario(SSP1-2.6),by2.7°Cand3.4°Cunderthetwointermediatescenarios(SSP2-4.5andSSP3-7.0),andby4.7°CundertheveryhighGHGemissionsscenario(SSP5-8.5)(Fig.1a).ThesimulatedGMSTsforthepolicytargetoftheCNCNscenariodonotsignificantlydifferfromthoseforthecorrespondingSSPsoverthenearterm(Fig.1b),andtheinsignificantresponseinthenear-termprojectioniscausedmainlybytheCESM’sinternalvariability14.Suchinsignificantmitigationisalsothecaseoverthemid-termexceptforSSP5-8.5,inwhichCNCNmiti-gatestheimpactofglobalwarmingby0.17°C(±0.05°C)(Fig.1c).Overthelongterm,theGMSTinthepolicytargetofCNCNscenariosissignificantlydifferent(p<0.01)fromthatinthedefaultSSPscenarios,exceptforSSP1-2.6(Fig.1d).ForSSP2-4.5,China’scarbonneutralityFig.1MitigationsofChina’scarbonneutrality(CNCN)andextensionscenarioswithadditionalCH4andNO2emissionreductionsaccompaniedbytheCO2emissionreductionsforCNCN(CNCNext)toglobalmeansurfacetemperature(GMST).aEvolutionofGMSTchangesrelativetothepreindustrialperiod(1850–1900average)(ΔT,unitin°C)forthedefaultCMIP6,CNCNandCNCNextscenariosfrom2015to2100.b–drepresentmitigationsoftheCNCNandCNCNextscenariosforeachsharedsocioeconomicpathway(SSP)overthenearterm(2021–2040),mid-term(2041–2060)andlongterm(2081–2100).ThemitigationeffectiscalculatedasthedifferenceinGMSTbetweentheCNCN(orCNCNext)andthedefaultCMIP6scenarios.Thesegmentlinesrepresenttheoriginalvaluesandtheshadedareasaroundthesmoothlinerepresenttheconfidenceatlevelof0.05foreachscenario.Theboxplotsinpanelsb–dshowthe25th,themedianandthe75thpercentilerange(box)andtheminimum–maximumrange(whiskers).Thesymbolsandrepresentstatis-ticalsignificanceatlevelsof0.01and0.001,respectively.“ns”representssta-tisticalinsignificanceatlevelof0.01.Symbolswithunderscoresshownabovetheheadoftheboxinb–drepresentcomparisonsbetweentheCNCNandCNCNextscenariosandthoseshownabovethex-axisarereferredtoascom-parisonsbetweentheCNCN(orCNCNext)andthedefaultCMIP6scenarios.Thepairedttestwasusedtocalculatethesignificance.Articlehttps://doi.org/10.1038/s41467-022-33047-9NatureCommunications(2022)13:53152reducestheGMSTby0.14°C(±0.07°C)inthelongterm.FortheSSP3-7.0andSSP5-8.5scenarios,CNCNpotentiallyreducesthelong-termGMSTby0.48(±0.09)°Cand0.40(±0.09)°C(p<0.01),respectively(Fig.1d).Suchmitigationsaccountfor14%and9%oftheaverageincreaseintheGMSTduringthelasttwodecadesofthe21stcentury,respectively.WhenfurtherincorporatingthechangesinCH4andN2Oaccom-paniedbythereductionsincarbonemissions(i.e.,CNCNext),theCNCNextscenariodoesnotresultinsignificantchangesinGMSTforallfourSSPsoverthenearandmid-termsexceptforSSP2-4.5,whichshows~0.09°Clesswarmingoverthemid-term(p<0.01)comparedwiththeCNCNscenario(Fig.1b,c).Overthelongterm,changesinCH4andN2OemissionspreventsignificantfurtherGMSTwarmingrelativetotheCNCNscenarioforallSSPsexceptforSSP3-7.0(Fig.1d).Con-sequently,changesinthethreeGHGemissionunderthepledgeofChina’scarbonneutralityresultinsignificantandlargenetdeclinesinGMSTby0.21(±0.17),0.32(±0.13),0.50(±0.21)and0.39(±0.17)°CoverthelongtermforSSP1-2.6,SSP2-4.5,SSP3-7.0andSSP5-8.5,respectively(Fig.1d).SuchimpactsontheGMSTaresignificantforSSP2-4.5(0.18±0.09°C)andSSP5-8.5(0.13±0.07°C)overthemid-termbutinsignificantforallSSPsoverthenearterm.ForthosepairsofsimulatedGMSTwithoutsignificantdifferences,underlyingcausesmainlycomefromeithersmallerdifferencesamongthedefaultCMIP6,CNCNandCNCNextscenarios(SupplementaryFigs.S3,S4)orhistoricalCO2accumulationuptothesimulationyears4,aswellastheinternalvariability14.Aspreviouslyreported,theinternalvariabilityoftheCESMrangesfrom0.06to0.09°C15,andthemagnitudesofmitigationsonglobalwarmingfromCNCNandCNCNextfortheSSP3-7.0(0.48and0.39°C)andSSP5-8.5(0.4and0.5°C)scenariosoverthelongtermarelargerthantheinternalvariability,indicatingarobustresponse.SpatialdivergencesofmitigationsofChina’scarbonneutralitytoglobalwarmingTheeffectofanthropogenicCO2emissionsonGMSTisevidentatbothglobalandregionalorlocalscales16.Thechangeofsurfacetempera-tureinducedbyCNCN(dT)isscenario-dependent,spatiallynotuni-formandvarieswithtime.ThemagnitudesofdTattheglobalscalerangefrom−1.84to1.76°C(Fig.2).Remarkabledifferencesareseenatregionalscale.Overtheneartermandmid-terms,only0.2–4%ofgridsshowsignificantdifferencesindTattheglobalscale(Fig.2a–d).AstrongwarmingisseenintheneartermunderSSP1-2.6overtheBarentsSeaanditssouthernregionsadjacenttowesternRussia(Fig.2a).SuchkindofwarmingcanbeexplainedbythefactthattheSSP1-2.6undertheCNCNscenariohassignificantlylargercarbonemissionsthanthedefaultscenariooverthenearterm(Supplemen-taryFig.S2).Overthemid-term,CNCNleadstoastrongincreaseinsurfacetemperatureinsouthofGreenlandunderboththeSSP2-4.5andSSP3-7.0scenariosbutasignificantdecreaseineastofSiberianseaandadjacenttoeasternRussiaundertheSSP2-4.5scenario(Fig.2f,g),whichishighlyconsistentwiththereportofasignificantregionaltransientresponseoflocaltemperaturetoCO2emissions16.Overthelongterm,gridswithsignificantdifferencesindTaccountforupto10%and9%oftheglobalvaluesforSSP1-2.6andSSP2-4.5,respectively,butthesignsofCNCN-inducedsurfacetemperaturechangeareregionallydependent(Fig.2i–l).WarmingeffectsoverthelongterminGreenlandandtheArcticfromSSP1-2.6areprimarilycausedbyhigher(a)(b)(c)(d)(e)(f)(g)(h)(i)(j)(k)(l)NeartermMid–termLongtermSSP1–2.6SSP2–4.5SSP3–7.0SSP5–8.5dT–1.9–1.7–1.5–1.3–1.1–0.9–0.7–0.5–0.3–0.10.10.30.50.70.91.11.31.51.71.9Fig.2MeansurfacetemperaturedifferencebetweenChina’scarbonneutrality(CNCN)anddefaultCMIP6scenariosforfoursharedsocioeconomicpathways(SSPs).Panelsfromlefttorightrepresentthenearterm(2021–2040,a–d),mid-term(2041–2060,e–h)andlongterm(2081–2100,i–l),andpanelsfromtoptobottomrepresentSSP1-2.6,SSP2-4.5,SSP3-7.0andSSP5-8.5,respectively.Themeansurfacetemperaturedifference(dT,unitin°C)iscal-culatedasthevalueofCNCNminusthedefaultCMIP6foreachcombinationofthestudytermandSSPs.PixelsoverlayedbydotsindicatethatthedTissta-tisticallysignificantatalevelof0.01.Thepairedttestwasusedtocalculatethesignificance.Articlehttps://doi.org/10.1038/s41467-022-33047-9NatureCommunications(2022)13:53153anthropogenicCO2emissionsthanthedefaultscenario(Supplemen-taryFig.S2).TheavoidedwarmingfromSSP2-4.5ismainlylocatedintheSouthernOcean(Fig.2j).ForSSP3-7.0andSSP5-8.5,53%and34%oftheglobalvaluesshowsignificantdifferencesindT,respectively(Fig.2k–l).Generally,theavoidedwarminginducedbyCNCNoverthelongtermunderSSP3-7.0scenariofeaturesapolaramplificationpat-tern,withstrongeravoidedwarmingintheArcticandhigh-latitudes,andweakavoidedwarminginlowlatitudes(Fig.2k).UndertheSSP5-8.5scenario,strongavoidedwarmingisseenineasternGreenland,theGreenlandSea,largeregionsofRussiaandsomefractionsofregionsoflandandoceansfromlowtohighlatitudes(Fig.2l).ComparedtotheCNCNscenario,thejointeffectsofCH4andN2Ofurtherresultinadditionalnear-termwarmingunderbothSSP1-2.6andSSP2-4.5scenariosbutsignificantlylesswarmingunderSSP5-8.5scenarioinhighlatitudesoftheNorthernHemi-sphere(SupplementaryFig.S7),whichismainlyduetothediffer-enceinN2Oemissionsbetweenthetwoscenarios(SupplementaryFig.S4).FurtheravoidedwarmingsfromthecombinedeffectsofCH4andN2OaremoreevidentunderbothSSP1-2.6andSSP2-4.5scenariosinthelongterminhighlatitudesoftheNorthernHemisphere.However,significantwarminginducedbyCH4andN2OemissionsisobservedoverthelongtermunderSSP3-7.0scenariointheregionssurroundingtheMediterraneanSeaandtheBarentsSea(SupplementaryFig.S7).TakingcomprehensivecovariationsofthreeprimaryGHGswithintheChina’scarbonneutralitypledgeintoaccountresultsinastrongwarmingeffectinnear-termGMSToveralargeareacoveringthemajorityoftheBarentsSea,RussiaanditsnorthernoceansovertheneartermforSSP1-2.6(Fig.3a).Theresponseofsurfacetemperatureinthenear-termisnotevidentunderallotherscenarios(Fig.3a–d).Theavoidedwarminginthemid-termunderCNCNextscenarioisonlyevidentinsmallregions,whichcoversonly3%(SSP1-2.6)to10%(SSP2-4.5)ofglobalarea(Fig.3e,f).Incontrast,aremarkableavoidedwarmingisseeninthelongterm,whichaccountsfor8%,22%,25%and36%oftheglobalareaforSSP1-2.6,SSP2-4.5,SSP3-7.0andSSP5-8.5,respectively(Fig.3i–l).DiscussionHere,wemakeafirstattempttoprojecttheeffectofpledgedcarbonneutralityfromanindividualcountry,takingthecurrentlylargestemittingcountryasanexample,onfutureglobalwarmingmitigationbasedonafullycoupledEarthsystemmodel.TheavoidedwarmingsfromCNCNaresignificantunderSSP3-7.0andSSP5-8.5scenariosoverthelongtermbutinsignificantorsignificantinonlylessthan10%ofglobalregionsunderotherscenariosforneartermandmid-term.MitigationscausedbyCNCNalonewouldreduceglobalwarmingby0.48(±0.09)°Cand0.40(±0.09)°Cinthesetwoscenarios,respec-tively.Suchmitigationmagnitudesaccountfor14%and9%ofglobalwarminginthesameperiod.WhenfurtherchangesinCH4andN2OemissionsinassociationwithChina’scarbonneutralityareincorpo-rated,thecombinedeffectsofthethreeprimaryGHGsslowedthewarmingofGMSTinthelongtermby0.21–0.50°CforthefourSSPs,whichaccountedforapproximately11–12%ofglobalwarming.CNCNextalsocontributeavoidedwarmingsforSSP2-4.5(0.18°C)and(a)(b)(c)(d)(e)(f)(g)(h)(i)(j)(k)(l)NeartermMid–termLongtermSSP1–2.6SSP2–4.5SSP3–7.0SSP5–8.5dT–2.5–2.1–1.9–1.7–1.5–1.3–1.1–0.9–0.7–0.5–0.3–0.10.10.30.50.70.91.11.31.51.71.92.12.5Fig.3MeansurfacetemperaturedifferencebetweenextensionscenarioswithadditionalCH4andNO2emissionreductionsaccompaniedbytheCO2emissionreductionsforChina’scarbonneutrality(CNCNext)anddefaultCMIP6scenariosforfoursharedsocioeconomicpathways(SSPs).Panelsfromlefttorightrepresentthenearterm(2021–2040,a–d),mid-term(2041–2060,e–h)andlongterm(2081–2100,i–l),andpanelsfromtoptobottomrepresentSSP1-2.6,SSP2-4.5,SSP3-7.0andSSP5-8.5,respectively.Themeansurfacetemperaturedif-ference(dT,unitin°C)iscalculatedasthevalueofCNCNextminusthedefaultCMIP6foreachcombinationofthestudytermandSSPs.PixelsoverlayedbydotsindicatethatthedTisstatisticallysignificantatalevelof0.01.Thepairedttestwasusedtocalculatethesignificance.Articlehttps://doi.org/10.1038/s41467-022-33047-9NatureCommunications(2022)13:53154SSP5-8.5(0.12°C)overthemid-termbutdoesnothaveanysignificantimpactsontheGMSTforallfourSSPsinthenearterm.Wealsoacknowledgetheuncertaintiesinourstudy.First,inournumericalexperiments,weassumedthatothercountriesdonottakeanysignificantmitigationactions,whichisfardifferentfromfuturereality,asmorethan120countrieshavepledgedsuchactions7.GiventhatmanyeffortstoreduceGHGemissionsworld-widehavebeenpledged,China’sshareofthemitigationofglobalwarmingwilllargelydecline.Second,theemissionpathwayusedtodrivetheEarthsystemmodelinthisstudyisonlyoneofvariouspossiblepathwaystoattaincarbonneutrality,andemissionpath-waysforcarbonneutralityarequitesensitivetovariationsinnations’policyinterventions,thedecarbonizationprogressinelectricityandindustrialsectors,andestablishmentofrenewableenergyandtechnologyinnovationsforcarboncaptureandstorageorcarbondioxideremoval17.Third,changesinatmosphericaerosols,suchasshortlivedGHGscooccurringwithfossilfuelcombustionsanddiversehumanactivities,arenottakenintoaccountinthesimula-tions,althoughthecombinedeffectofvariouskindsofaerosolsisreportedtohaveconflictingeffectsthatrangefromsignificantreductionintemperaturetoamodestimpactandevenanetfuturewarmingeffect18–21.Finally,mitigationeffectsarederivedbypairsimulationsofasinglefactor,CO2onlyoracombinationofCO2,CH4andN2O,whichessentiallycannotsortoutanindividualcountry’seffectsonglobalwarmingbecausetheglobalwarmingiscausedbythecumulativeanthropogenicCO2emissionsfromthepreindustrialeraandthehistoricalemissionwillstillworkinfuturewarming.Inaddition,multiplesimulationsforthesamescenariowouldreducetheuncertaintyinducedbythemodel’sinternalvariabilityandmaketheresultsmorerobust.ItiswellknownthatCO2emissionpathwaysforcarbonneu-tralityandGHGneutralityaredifferent.Carbonneutralitytargetsabalancebetweenanthropogenicemissionsbysourcesandremovalsbysinksofcarbon,butGHGneutralityreferstoallgreenhousegases,whichmeansthatadditionalnegativeCO2emissionsandsomenon-CO2GHGemissionshavetocancelouteachotherforGHGneutrality22–24.Chinahasdeliveredaseriesofdomesticstrategiesandpoliciesincludingabatedcoalconsumption25,clearenergydevelopment26–28,nationwideecologicalrestoration29,30andothervariousnegative-emissiontechnologies31aspotentialcounter-measurestoachievecarbonneutralityby2060.MostoftheseChi-na’songoingemissionactionsalsocontributetoreductionsinsomenon-CO2GHGemissionsandincreasesinnegative-emissionofCO2,whichimpliesthatChina’sfutureemissionpathwayisultimatelytargetingforaGHGneutrality,althoughcarbonneutralityiscur-rentlyclaimed7,9.China’srapidgrowthinanthropogenicCO2emis-sionsoccurredafter2000(SupplementaryFig.S2),andthetimespanstocarbonpeaking(2030)andneutrality(2060)arequiteshort,comparedtothoseofdevelopedcountries4.ThiscreatesgreatchallengesforChinatoachievecarbonorGHGneutrality.However,China’sdeterminationandambitionforcarbonorGHGneutralityareverystrongbecauseimpellingforcarbonandGHGneutralitywillnotonlycontributetomitigatingfurtherglobalwarmingbutalsotofacilitatingeconomictransformationandupgradeformoresus-tainabledevelopment,includingimprovingdomesticairqualityandprotectingpublichealth32.ThisstudyquantifiestherelativecontributionofChina’scarbonneutralitypledgetofutureglobalwarming,whichisinformativeandinsightfulforquantifyinganindividualcountry’smitigationofcarbonemissionsonscalesofbothtimehorizonsandspatialdistributions.Ourresultsprovideausefulreferencefortheglobalstocktake,whichassessesthecollectiveprogresstowardstheclimategoalsoftheParisAgreement.Thisalsoimpliesthatjointeffortsfromallcountriesintheworldareurgentlyneededtomitigatefurtherglobalwarmingthroughnet-zerocarbonactions.MethodsCommunicationearthsystemmodelTheNCAR’sCommunityEarthSystemModel(CESM)11isafullycoupledearthsystemmodelconsistingofsevenprognosticcomponents,namelyatmosphere,land,landice,ocean,seaice,riverandacouplerthatcomputesfluxesbetweencomponents.TheCESM2.1.3versionincorporatesasuiteofcasesforCMIP6simulationswithseveralsharedsocioeconomicpathway(SSP)scenarios.FourSSPswereusedinthisstudy.ThefirstisSSP1-2.6,whichrepresentsthelowendoftherangeoffutureforcingpathwaysandupdatestheRCP2.6(RCP,representativeconcentrationpathways).ThesecondisSSP2-4.5,whichrepresentsthemediumpartoftherangeoffutureforcingpathwaysandupdatestheRCP4.5pathway.ThethirdisSSP3-7.0,whichrepresentsthemediumtohighendoftherangeoffutureforcingpathways.ThefourthisSSP5-8.5,whichrepresentsthehighendoftherangeoffuturepathwaysandupdatestheRCP8.512,althoughtheSSP5-8.5scenarioiscriticisedasoverestimatingfuturecumulativefossilfuelandindustryCO2emissions33.EachdefaultCMIP6SSPincorporatescorrespondingspatiallyanthropogenicsurfaceCO2emissionsproducedwiththeIntegratedAssessmentModel(IAM).GlobalCO2forcingdataunderCNCNscenarioTheCNCNscenario13ismainlybasedoncarbonemissionsconsistentwiththeIPCC1.5°Ctarget,butitrequiresfurtherreductionsinnationaltotalenergyconsumptionandlargeincreasesinthepropor-tionofnonfossilenergyinprimaryenergyconsumption.TheCNCNscenarioalsorequiressignificantdecreasesinnon-CO2GHGemissionsandincreasesinterrestrialecosystemcarbonsinksandlarge-scaleimplementationsofcarboncaptureandstorage(CCS)andcarbondioxideremoval(CDR).UnlikeIAMs,itisnotpossibletogeneratespatiallyexplicitanthropogenicsurfaceCO2emissionsfortheCNCNscenario,butaroadmapwiththeexpectedamountoftotallydomesticCO2emissionsforCNCNupto2050isgenerated13.WeassumethatfutureanthropogenicCO2emissionsforeachgridundertheCNCN(CO2ði,jÞ)scenarioarelinearlyproportionaltotheiroriginalvaluesinthedefaultSSPs(CO2,SSPði,jÞ),i.e.,theEq.(1).CO2ði,jÞ=CO2,CNN∑n1CO2,SSPði,jÞ×CO2,SSPði,jÞð1ÞGeneratedspatialCO2emissionsthenreplacethevaluesindefaultSSPsinChinabutremainunchangedoutsideofChina,andanthro-pogenicCO2emissionsfortheCNCNscenarioafter2050remainunchangedasitsvaluein2050.ThenewdatasetsofCO2emissionsforCNCNareusedtodrivetheCESMandrepresenttheCNCNscenarios.Therefore,fourpairsofsimulationsareformed,andthedifferenceineachpairofsimulationsrepresentsthemitigationsofglobalwarmingfromCNCN.FromtheCNCNreport13,China’santhropogeniccarbonemissionswillpeakat10.5GtCO2year−1in2030anddropto1.2GtCO2year−1in2050.Underthecarbonneutralitypathway13,Chinawillreduceitscarbonemissionsby89%in2050,whichisroughlyconsistentwitharecentsynthesisforthe1.5°Ctargetbasedonmultipleintegratedassessmentmodels17.ComparedwiththedefaultCMIP6scenario,CNCNhasadifferencerangingfrom−3.70to18.03GtCO2year−1inanthropogenicsurfaceCO2(SupplementaryFigs.S2–S3).GlobalCH4andN2OforcingdataunderCNCNscenarioBecausebothCH4andN2O,twootherkindsofgreenhousegases,areemittedalongwiththefossilfuelproduction,transportationorcom-bustionandotheranthropogenicactivities9,34,changesinCH4andN2OconcomitantwithCNCNarealsoincorporatedtodrivetheCESM(referredtoasCNCNext).UndertheCNCNextscenario,China’scumu-lativeCH4emissionsduringtheperiod2015-2100havedifferencesof−785,810,3552,and661MtCH4comparedtothedefaultSSP1-2.6,Articlehttps://doi.org/10.1038/s41467-022-33047-9NatureCommunications(2022)13:53155SSP2-4.5,SSP3-7.0andSSP5-8.5,respectively.Incontrast,theCNCNextscenarioresultsinchangesincumulativeN2Oemissionsof−19.4,8.2,24.1and30.4MtN2OcomparedtothefourdefaultSSPs,respectively.BothCH4andN2OforcingdataoftheCESMareprescribedasgloballyuniformsurfaceconcentrations,ratherthantheirsurfacefluxes.ConversionfromfluxestoconcentrationsgenerallyrequiresrunningasimpleclimatemodellikeMAGICC35.UnderscenariosoffourdefaultSSPs,concentrationsofCH4andN2Ocanbeeasilyextracted.However,reimplementinganMAGICCfortheCNCNscenarioessen-tiallyinvolvesalargenumberofsimulationtasks.Fortunately,dependencesofbothCH4andN2Oconcentrationsontheircumulativeemissionsinthetroposphereduringtheperiod2015-2100canbeempiricallyfittedbycubicfunctionsforfourSSPsunderthedefaultCMIP6scenario(R2closeto1,SupplementaryFig.S5),althoughtheirfittingequationsarelargelydifferentamongvariablesandSSPs,sowehavehighconfidenceinderivingcorrespondingsurfaceconcentra-tionsofCH4andN2Obasedontheircumulativeemissionsduringaspecifiedperiod(2015–2100)(SupplementaryFig.S5).AsChinahasyetspecifiednon-CO2GHGemissionreductiontargetsandtimelinesforGHGneutrality,theGlobalChangeAssessmentModel36(GCAM,version5.4)isusedtoprojectemissionsofCH4andN2OundertheCNCNscenariofrom2015to2100,inwhichemissionsofCO2undertheCNCNscenarioareusedasconstraints,andanequalmarginalcostofemissionreductionsbetweenCO2andnon-CO2GHGsisassumed.Therefore,concentrationsofCH4andN2OcanbederivedunderbothscenariosofthedefaultCMIP6andCNCN(SupplementaryFig.S6).SuchCESMsimulationsdrivenbycombinedvariationsinCO2,CH4andN2OundertheCNCNscenariorepresenttheCNCNextscenario,whosedifferencesinsimulatedGSMTfromCNCNsimulationsareregardedasrelativecontributionstoglobalwarmingbybothCH4andN2ObutthosedifferencesinsimulatedGMSTfromthedefaultCMIP6simulationsareregardedascontributionsbyCNCNext.PriorvalidationofthecommunityearthsystemmodelPriortobeginningsimulations,theCESM2.1.3wasrunwithfullycoupledcomponentsfromboth1850and1900to2014,andnosig-nificantdifferenceinthesimulatedGMSTwasfound(SupplementaryFig.S8),whichallowedustousethespin-upsimulationfrom1850to2014forthestart-upsimulation.ThesimulatedGMSTfromspin-uprunswasalsocomparedwiththreeglobalhistoricaltemperaturedatasets,andtheconsistencyidentifiedbycross-corelationwashigh(Rrangingfrom0.78to0.99)(SupplementaryFig.S9),provingtherobustnessofthemodelinsimulatingtheresponseofglobalmeantemperaturetoanthropogenicCO2emissions.DataavailabilityDatasetoffutureCH4andN2OemissionsfordifferentSSPsarearchivedinIIASAwebsite(https://tntcat.iiasa.ac.at/SspDb).DuetotheextremelylargesizeoftheoutputrawdatafromCESMsimulations,thesefileswerenotdepositedinapublicrepository,butareavailablefromthecorrespondingauthorsonreasonablerequest.CodeavailabilityTheRcodesforvisualizingtheresultsinthisstudyareavailablefromthecorrespondingauthorsonrequest.References1.IPCC.ClimateChange2014:SynthesisReport.ContributionofWorkingGroupsI,IIandIIItotheFifthAssessmentReportoftheIntergovernmentalPanelonClimateChange[CoreWritingTeam,R.K.PachauriandL.A.Meyer(eds.)].IPCC,Geneva,Switzerland.151(2014).2.IPCC.SummaryforPolicymakers.In:ClimateChange2021:ThePhysicalScienceBasis.ContributionofWorkingGroupItotheSixthAssessmentReportoftheIntergovernmentalPanelonClimateChange[Masson-Delmotte,V.,P.Zhai,A.Pirani,S.L.Connors,C.Péan,S.Berger,N.Caud,Y.Chen,L.Goldfarb,M.I.Gomis,M.Huang,K.Leitzell,E.Lonnoy,J.B.R.Matthews,T.K.Maycock,T.Waterfield,O.Yelekçi,R.Yu,andB.Zhou(eds.)].CambridgeUniversityPress,Cambridge,UnitedKingdomandNewYork,NY,USA.3−32(2021).3.Rive,N.&Fuglestvedt,J.S.Introducingpopulation-adjustedhis-toricalcontributionstoglobalwarming.Glob.Environ.Change18,142–152(2008).4.Matthews,H.D.Quantifyinghistoricalcarbonandclimatedebtsamongnations.Nat.Clim.Change6,60–64(2016).5.Mora,C.etal.Broadthreattohumanityfromcumulativeclimatehazardsintensifiedbygreenhousegasemissions.Nat.Clim.Change8,1062–1071(2018).6.IPCC.SummaryforPolicymakers.In:GlobalWarmingof1.5°C.AnIPCCSpecialReportontheimpactsofglobalwarmingof1.5°Cabovepre-industriallevelsandrelatedglobalgreenhousegasemissionpathways,inthecontextofstrengtheningtheglobalresponsetothethreatofclimatechange,sustainabledevelopment,andeffortstoeradicatepoverty[Masson-Delmotte,V.,P.Zhai,H.-O.Pörtner,D.Roberts,J.Skea,P.R.Shukla,A.Pirani,W.Moufouma-Okia,C.Péan,R.Pidcock,S.Connors,J.B.R.Matthews,Y.Chen,X.Zhou,M.I.Gomis,E.Lonnoy,T.Maycock,M.Tignor,andT.Water-field(eds.)].6(2018).7.Editorials.Net-zerocarbonpledgesmustbemeaningful.Nature592,8(2021).8.Friedlingstein,P.etal.Globalcarbonbudget2020.EarthSyst.Sci.Data12,3269–3340(2020).9.Cornwall,W.Fiveyearsin,Parispactstillaworkinprogress.Sci-ence370,1390(2020).10.Chen,J.,Cui,H.,Xu,Y.,Ge,Q.Long-termtemperatureandsea-levelrisestabilizationbeforeandbeyond2100:EstimatingtheadditionalclimatemitigationcontributionfromChina’srecent2060carbonneutralitypledge.Environ.Res.Lett.16,074032(2021).11.Danabasoglu,G.,etal.Thecommunityearthsystemmodelversion2(CESM2).J.Adv.Model.EarthSyst.12,e2019MS001916(2020).12.O’Neill,B.C.etal.Thescenariomodelintercomparisonproject(ScenarioMIP)forCMIP6.Geosci.ModelDev.9,3461–3482(2016).13.TsinghuaUniversityIoCCaSD.SynthesisreportonChina’slongtermlowcarbondevelopmentandtransmissionpathways.ChinaPopul.,Resour.Dev.30,1–25(2021).14.Hawkins,E.&Sutton,R.Thepotentialtonarrowuncertaintyinprojectionsofregionalprecipitationchange.Clim.Dyn.37,407–418(2011).15.Lu,J.W.,Zhou,T.J.,Huang,X.,Zhang,W.X.&LW,Z.Acomparisonofthreemethodsforestimatinginternalvariabilityofnear-surfaceairtemperature.Chin.J.Atmos.Sci.44,105–121(2020).16.Leduc,M.,Matthews,H.D.&deElía,R.RegionalestimatesofthetransientclimateresponsetocumulativeCO2emissions.Nat.Clim.Change6,474–478(2016).17.Duan,H.etal.AssessingChina’seffortstopursuethe1.5°Cwarminglimit.Science372,378–385(2021).18.Andreae,M.O.,Jones,C.D.&Cox,P.M.Strongpresent-dayaerosolcoolingimpliesahotfuture.Nature435,1187–1190(2005).19.Allen,R.J.,etal.Significantclimatebenefitsfromnear-termclimateforcermitigationinspiteofaerosolreductions.Environ.Res.Lett.,(2021).20.Collins,W.J.etal.Globalandregionaltemperature-changepotentialsfornear-termclimateforcers.Atmos.Chem.Phys.13,2471–2485(2013).21.Fu,B.etal.Short-livedclimateforcershavelong-termclimateimpactsviathecarbon–climatefeedback.Nat.Clim.Change10,851–855(2020).22.Tanaka,K.&O’Neill,B.C.TheParisAgreementzero-emissionsgoalisnotalwaysconsistentwiththe1.5°Cand2°Ctemperaturetar-gets.Nat.Clim.Change8,319–324(2018).Articlehttps://doi.org/10.1038/s41467-022-33047-9NatureCommunications(2022)13:5315623.Fuglestvedt,J.,etal.Implicationsofpossibleinterpretationsof‘greenhousegasbalance’intheParisAgreement.Philos.Trans.AMath.Phys.Eng.Sci.376,20160445(2018).24.vanSoest,H.L.,denElzen,M.G.J.&vanVuuren,D.P.Net-zeroemissiontargetsformajoremittingcountriesconsistentwiththeParisAgreement.Nat.Commun.12,2140(2021).25.Cui,R.Y.etal.Aplant-by-plantstrategyforhigh-ambitioncoalpowerphaseoutinChina.Nat.Commun.12,1468(2021).26.Xing,X.etal.SpatiallyexplicitanalysisidentifiessignificantpotentialforbioenergywithcarboncaptureandstorageinChina.Nat.Commun.12,3159(2021).27.Wang,P.,Zhang,S.,Pu,Y.,Cao,S.&Zhang,Y.Estimationofpho-tovoltaicpowergenerationpotentialin2020and2030usinglandresourcechanges:AnempiricalstudyfromChina.Energy219,119611(2021).28.Zhou,S.,Wang,Y.,Zhou,Y.,Clarke,L.E.&Edmonds,J.A.RolesofwindandsolarenergyinChina’spowersector:Implicationsofintermittencyconstraints.Appl.Energy213,22–30(2018).29.Lu,F.etal.EffectsofnationalecologicalrestorationprojectsoncarbonsequestrationinChinafrom2001to2010.Proc.NatlAcad.Sci.USA115,4039–4044(2018).30.Wang,J.etal.LargeChineselandcarbonsinkestimatedfromatmosphericcarbondioxidedata.Nature586,720–723(2020).31.Liu,Z.etal.ChallengesandopportunitiesforcarbonneutralityinChina.Nat.Rev.EarthEnviron.3,141–155(2022).32.Cheng,J.,etal.PathwaysofChina’sPM2.5airquality2015–2060inthecontextofcarbonneutrality.Natl.Sci.Rev.8,nwab078(2021).33.Hausfather,Z.&Peters,G.P.RCP8.5isaproblematicscenariofornear-termemissions.Proc.NatlAcad.Sci.USA117,27791–27792(2020).34.Tian,H.etal.Acomprehensivequantificationofglobalnitrousoxidesourcesandsinks.Nature586,248–256(2020).35.Meinshausen,M.etal.Thesharedsocio-economicpathway(SSP)greenhousegasconcentrationsandtheirextensionsto2500.GeoscientificModelDev.13,3571–3605(2020).36.Calvin,K.etal.GCAMv5.1:representingthelinkagesbetweenenergy,water,land,climate,andeconomicsystems.GeoscientificModelDev.12,677–698(2019).AcknowledgementsThisstudyissupportedbytheNationalKeyResearchandDevelopmentProgramofChina(2017YFA0603603)andtheNationalNaturalScienceFoundationofChina(U2003201).AuthorcontributionsL.L.andG.L.designedresearchanddraftedthepaper;L.L.,Y.Z.,andK.A.performedthenumericalsimulations;L.L.,Y.Z.,andT.Z.analyzedtheresults;andL.L.,T.Z.,K.W.,C.W.,T.W,L.Y.,andC.Z.revisedthepaper.L.L.,Y.Z.,T.Z.,K.W.,C.W.,T.W.,L.Y.,C.Z.,andG.L.contributedtotheinterpretationoftheresultsandtothetext.CompetinginterestsTheauthorsdeclarenocompetinginterests.AdditionalinformationSupplementaryinformationTheonlineversioncontainssupplementarymaterialavailableathttps://doi.org/10.1038/s41467-022-33047-9.CorrespondenceandrequestsformaterialsshouldbeaddressedtoGuonianLü.PeerreviewinformationNatureCommunicationsthankstheanon-ymousreviewer(s)fortheircontributiontothepeerreviewofthiswork.Peerreviewerreportsareavailable.Reprintsandpermissioninformationisavailableathttp://www.nature.com/reprintsPublisher’snoteSpringerNatureremainsneutralwithregardtojur-isdictionalclaimsinpublishedmapsandinstitutionalaffiliations.OpenAccessThisarticleislicensedunderaCreativeCommonsAttribution4.0InternationalLicense,whichpermitsuse,sharing,adaptation,distributionandreproductioninanymediumorformat,aslongasyougiveappropriatecredittotheoriginalauthor(s)andthesource,providealinktotheCreativeCommonslicense,andindicateifchangesweremade.Theimagesorotherthirdpartymaterialinthisarticleareincludedinthearticle’sCreativeCommonslicense,unlessindicatedotherwiseinacreditlinetothematerial.Ifmaterialisnotincludedinthearticle’sCreativeCommonslicenseandyourintendeduseisnotpermittedbystatutoryregulationorexceedsthepermitteduse,youwillneedtoobtainpermissiondirectlyfromthecopyrightholder.Toviewacopyofthislicense,visithttp://creativecommons.org/licenses/by/4.0/.©TheAuthor(s)2022Articlehttps://doi.org/10.1038/s41467-022-33047-9NatureCommunications(2022)13:53157


 VIP
VIP VIP
VIP VIP
VIP VIP
VIP VIP
VIP VIP
VIP VIP
VIP VIP
VIP VIP
VIP VIP
VIP