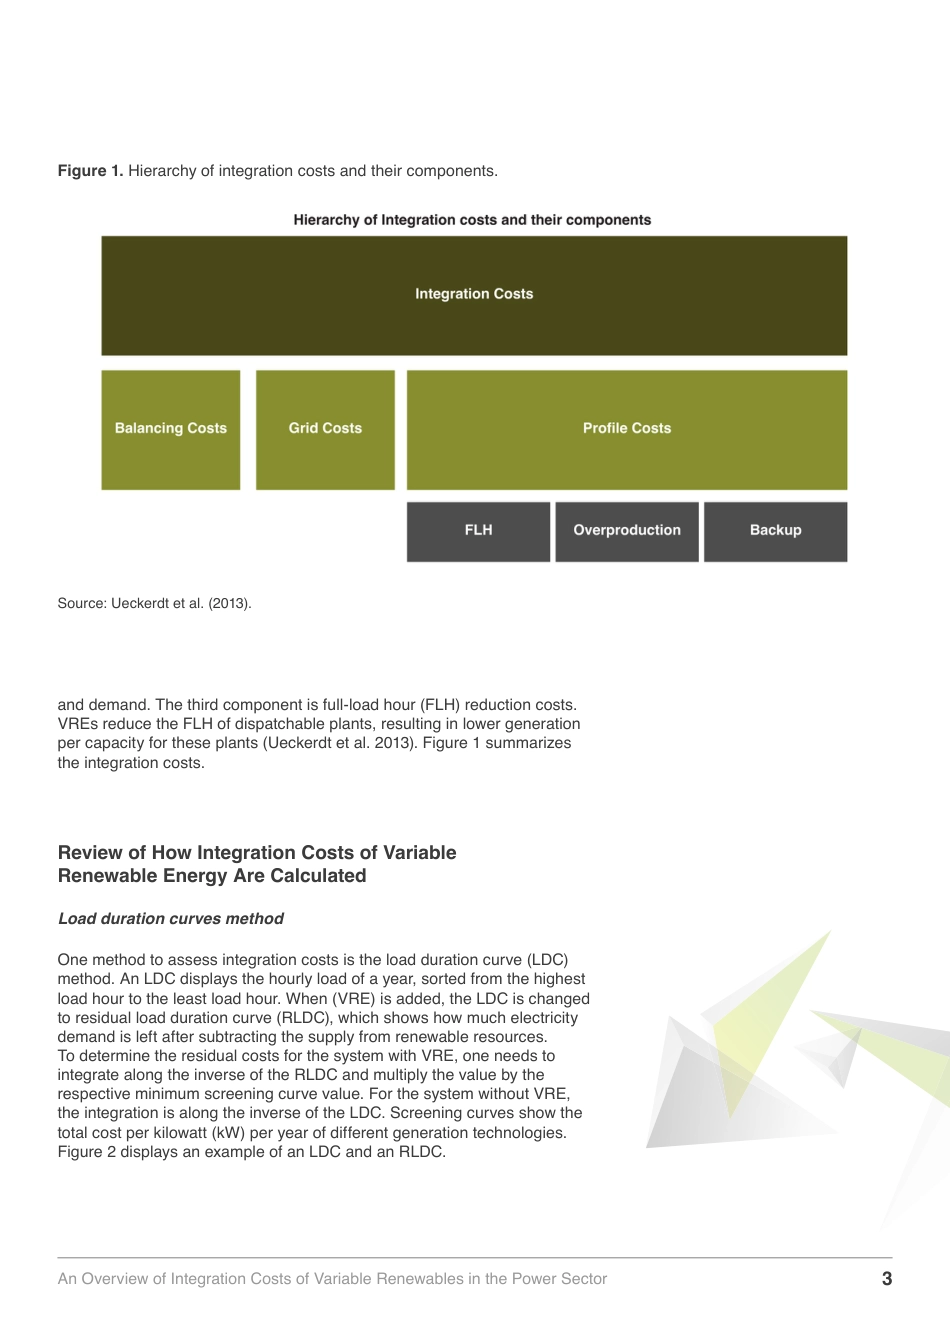
An Overview of Integration Costs of Variable Renewables in the Power SectorFaris F. Aljamed, Frank A. Felder, Amro M. ElshurafaCommentaryJune 20232An Overview of Integration Costs of Variable Renewables in the Power SectorIntroductionIn recent years, the cost of electricity generated by renewables has significantly decreased to the point where it is cost competitive with conventional plants (Heptonstall and Gross, 2021). However, incorporating variable renewable energy (VRE) technologies like wind and solar photovoltaics (PV) into the power system creates intermittency. By adding intermittent sources of generation, demand and supply will not always match. This means that the system requires more backup generators and more flexibility to balance the mismatch between supply and demand. Integration costs must be factored in to determine the optimal share of VRE and the total system cost.Traditionally, the levelized cost of energy (LCOE) has been used to compare the costs of different power generators. LCOE calculates the total lifetime discounted costs of constructing and operating a plant and divides it by the projected total energy produced during its assumed lifespan. However, LCOE does not consider the costs that arise due to VRE intermittency or the expenses associated with adapting the power system to the changes brought by VRE. Therefore, LCOE alone cannot capture the total system costs when VRE is introduced to the grid (Loth et al., 2022). This commentary provides a brief overview of how VRE integration costs are calculated by examining various methods available in the literature.Definition of Integration Costs and their ComponentsIntegration costs are categorized into three components: balancing costs, gri...