高盛-中国经济新三大动能:电池、电车、可再生能源(英)-2023.10.19-12页VIP专享VIP免费

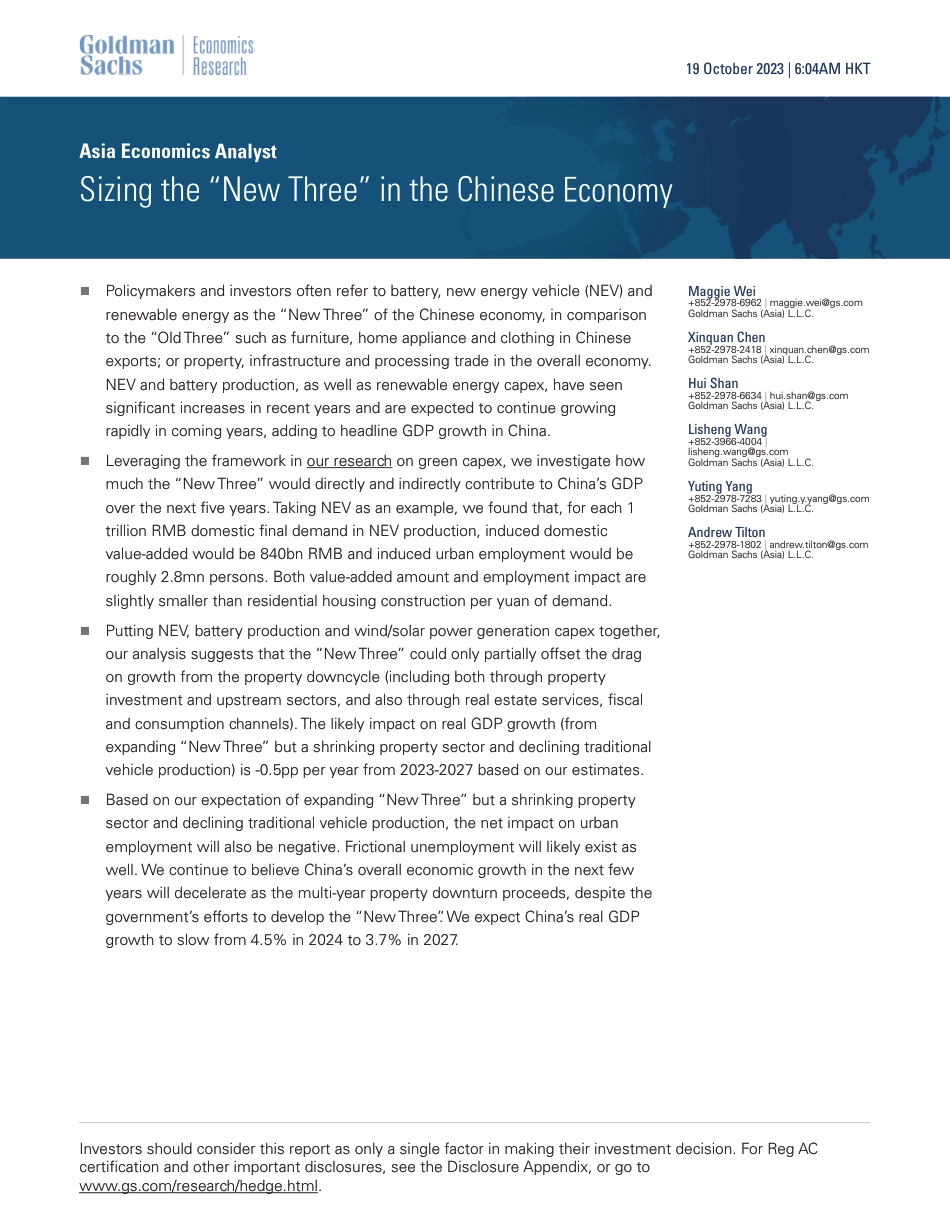
Policymakers and investors often refer to battery, new energy vehicle (NEV) andn
renewable energy as the “New Three” of the Chinese economy, in comparison
to the Old Three” such as furniture, home appliance and clothing in Chinese
exports; or property, infrastructure and processing trade in the overall economy.
NEV and battery production, as well as renewable energy capex, have seen
significant increases in recent years and are expected to continue growing
rapidly in coming years, adding to headline GDP growth in China.
Leveraging the framework in our research on green capex, we investigate hown
much the “New Three” would directly and indirectly contribute to China’s GDP
over the next five years. Taking NEV as an example, we found that, for each 1
trillion RMB domestic final demand in NEV production, induced domestic
value-added would be 840bn RMB and induced urban employment would be
roughly 2.8mn persons. Both value-added amount and employment impact are
slightly smaller than residential housing construction per yuan of demand.
Putting NEV, battery production and wind/solar power generation capex together,n
our analysis suggests that the “New Three” could only partially offset the drag
on growth from the property downcycle (including both through property
investment and upstream sectors, and also through real estate services, fiscal
and consumption channels). The likely impact on real GDP growth (from
expanding “New Three” but a shrinking property sector and declining traditional
vehicle production) is -0.5pp per year from 2023-2027 based on our estimates.
Based on our expectation of expanding “New Three” but a shrinking propertyn
sector and declining traditional vehicle production, the net impact on urban
employment will also be negative. Frictional unemployment will likely exist as
well. We continue to believe China’s overall economic growth in the next few
years will decelerate as the multi-year property downturn proceeds, despite the
government’s efforts to develop the “New Three. We expect China’s real GDP
growth to slow from 4.5% in 2024 to 3.7% in 2027.
Maggie Wei
+852-2978-6962 | maggie.wei@gs.com
Goldman Sachs (Asia) L.L.C.
Xinquan Chen
+852-2978-2418 | xinquan.chen@gs.com
Goldman Sachs (Asia) L.L.C.
Hui Shan
+852-2978-6634 | hui.shan@gs.com
Goldman Sachs (Asia) L.L.C.
Lisheng Wang
+852-3966-4004 |
lisheng.wang@gs.com
Goldman Sachs (Asia) L.L.C.
Yuting Yang
+852-2978-7283 | yuting.y.yang@gs.com
Goldman Sachs (Asia) L.L.C.
Andrew Tilton
+852-2978-1802 | andrew.tilton@gs.com
Goldman Sachs (Asia) L.L.C.
Asia Economics Analyst
Sizing the “New Three” in the Chinese Economy
19 October 2023 | 6:04AM HKT
Investors should consider this report as only a single factor in making their investment decision. For Reg AC
certification and other important disclosures, see the Disclosure Appendix, or go to
www.gs.com/research/hedge.html.
a3194d4bc6d047f488bef73494dfc726
Sizing the “New Three” in the Chinese Economy
China’s decarbonization efforts boosted growth in new energy vehicle (NEV), battery and
renewable energy sectors. These sectors are often referred to as the “New Three” of
the Chinese economy, which highlights their significance in policymakers’ pursuit of
“high-quality growth”, explains their exponential growth in recent years, and suggests
their increasing importance to the overall economy in future years. Our analysis
suggests that the “New Three” could only partially offset the drag on growth from the
property downcycles (including both through property investment and upstream
sectors, and also through real estate services, fiscal and consumption channels). The
impact on real GDP growth (from expanding “New Three” but a shrinking property
sector and declining traditional vehicle production) is -0.5pp per year from 2023-2027
based on our estimates, with the drag being most negative this year and fading
gradually towards -0.2 in 2027.
Although these sectors are often discussed together, the channels through which they
contribute to the Chinese economy differ somewhat. Renewable energy involves large
investment in wind and solar power generation, which mostly adds to GDP growth
through investment induced production across upstream sectors. NEV and battery
production are playing increasingly important roles in the total production chain of the
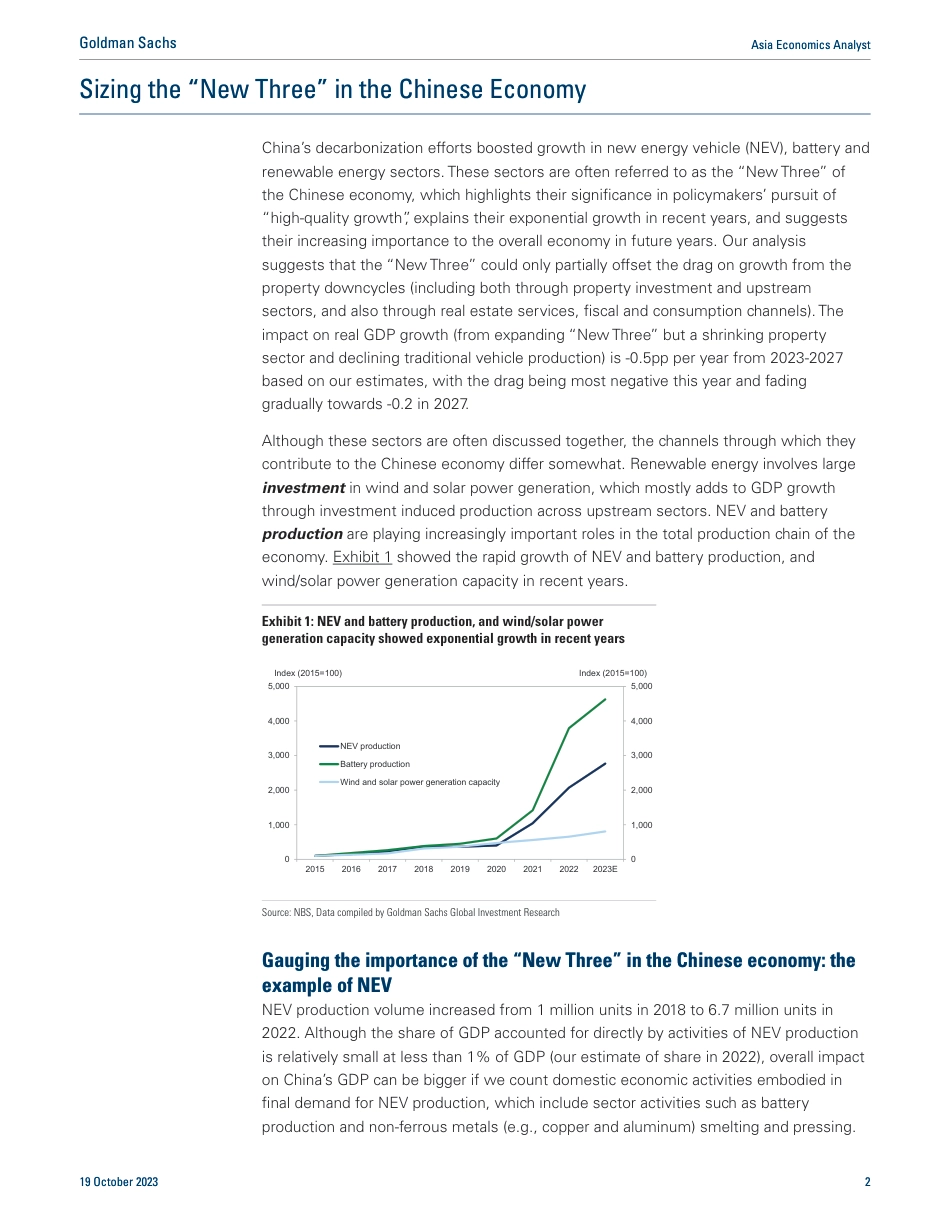
economy. Exhibit 1 showed the rapid growth of NEV and battery production, and
wind/solar power generation capacity in recent years.
Gauging the importance of the “New Three” in the Chinese economy: the
example of NEV
NEV production volume increased from 1 million units in 2018 to 6.7 million units in
2022. Although the share of GDP accounted for directly by activities of NEV production
is relatively small at less than 1% of GDP (our estimate of share in 2022), overall impact
on China’s GDP can be bigger if we count domestic economic activities embodied in
final demand for NEV production, which include sector activities such as battery
production and non-ferrous metals (e.g., copper and aluminum) smelting and pressing.
Exhibit 1: NEV and battery production, and wind/solar power
generation capacity showed exponential growth in recent years
0
1,000
2,000
3,000
4,000
5,000
0
1,000
2,000
3,000
4,000
5,000
2015 2016 2017 2018 2019 2020 2021 2022 2023E
NEV production
Battery production
Wind and solar power generation capacity
Index (2015=100) Index (2015=100)
Source: NBS, Data compiled by Goldman Sachs Global Investment Research
19 October 2023 2
Goldman Sachs Asia Economics Analyst
a3194d4bc6d047f488bef73494dfc726
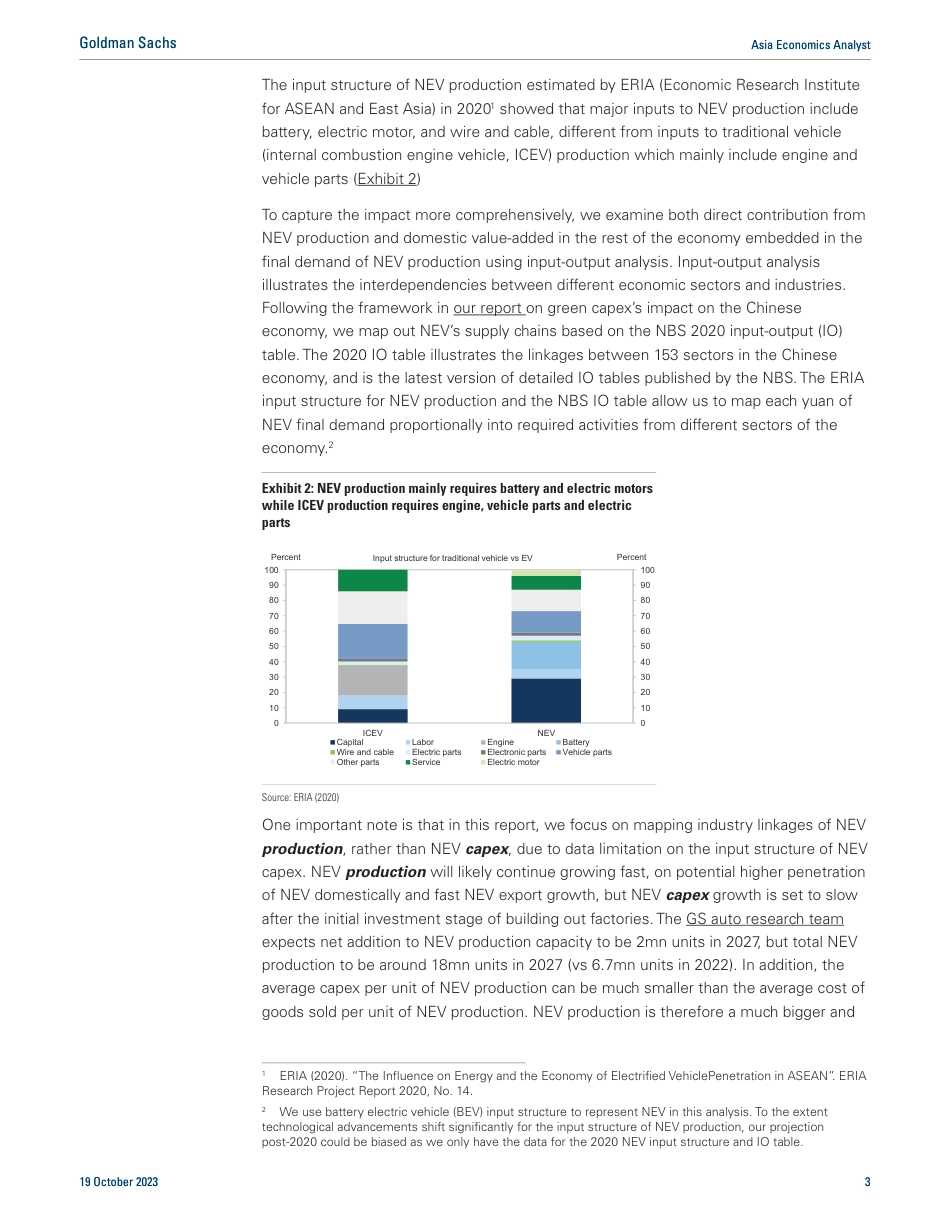
The input structure of NEV production estimated by ERIA (Economic Research Institute
for ASEAN and East Asia) in 20201 showed that major inputs to NEV production include
battery, electric motor, and wire and cable, different from inputs to traditional vehicle
(internal combustion engine vehicle, ICEV) production which mainly include engine and
vehicle parts (Exhibit 2)
To capture the impact more comprehensively, we examine both direct contribution from
NEV production and domestic value-added in the rest of the economy embedded in the
final demand of NEV production using input-output analysis. Input-output analysis
illustrates the interdependencies between different economic sectors and industries.
Following the framework in our report on green capex’s impact on the Chinese
economy, we map out NEV’s supply chains based on the NBS 2020 input-output (IO)
table. The 2020 IO table illustrates the linkages between 153 sectors in the Chinese
economy, and is the latest version of detailed IO tables published by the NBS. The ERIA
input structure for NEV production and the NBS IO table allow us to map each yuan of
NEV final demand proportionally into required activities from different sectors of the
economy.2
One important note is that in this report, we focus on mapping industry linkages of NEV
production, rather than NEV capex, due to data limitation on the input structure of NEV
capex. NEV production will likely continue growing fast, on potential higher penetration
of NEV domestically and fast NEV export growth, but NEV capex growth is set to slow
after the initial investment stage of building out factories. The GS auto research team
expects net addition to NEV production capacity to be 2mn units in 2027, but total NEV
production to be around 18mn units in 2027 (vs 6.7mn units in 2022). In addition, the
average capex per unit of NEV production can be much smaller than the average cost of
goods sold per unit of NEV production. NEV production is therefore a much bigger and
1ERIA (2020). “The Influence on Energy and the Economy of Electrified VehiclePenetration in ASEAN”. ERIA
Research Project Report 2020, No. 14.
2We use battery electric vehicle (BEV) input structure to represent NEV in this analysis. To the extent
technological advancements shift significantly for the input structure of NEV production, our projection
post-2020 could be biased as we only have the data for the 2020 NEV input structure and IO table.
Exhibit 2: NEV production mainly requires battery and electric motors
while ICEV production requires engine, vehicle parts and electric
parts
0
10
20
30
40
50
60
70
80
90
100
0
10
20
30
40
50
60
70
80
90
100
ICEV NEV
Input structure for traditional vehicle vs EV
Capital Labor Engine Battery
Wire and cable Electric parts Electronic parts Vehicle parts
Other parts Service Electric motor
Percent
Percent
Source: ERIA (2020)
19 October 2023 3
Goldman Sachs Asia Economics Analyst
a3194d4bc6d047f488bef73494dfc726
19October20236:04AMHKTAsiaEconomicsAnalystSizingthe“NewThree”intheChineseEconomynPolicymakersandinvestorsoftenrefertobattery,newenergyvehicle(NEV)andMaggieWeirenewableenergyasthe“NewThree”oftheChineseeconomy,incomparisontothe“OldThree”suchasfurniture,homeapplianceandclothinginChinese+852-2978-6962maggie.wei@gs.comexports;orproperty,infrastructureandprocessingtradeintheoveralleconomy.GoldmanSachs(Asia)L.L.C.NEVandbatteryproduction,aswellasrenewableenergycapex,haveseensignificantincreasesinrecentyearsandareexpectedtocontinuegrowingXinquanChenrapidlyincomingyears,addingtoheadlineGDPgrowthinChina.+852-2978-2418xinquan.chen@gs.comnLeveragingtheframeworkinourresearchongreencapex,weinvestigatehowGoldmanSachs(Asia)L.L.C.muchthe“NewThree”woulddirectlyandindirectlycontributetoChina’sGDPoverthenextfiveyears.TakingNEVasanexample,wefoundthat,foreach1HuiShantrillionRMBdomesticfinaldemandinNEVproduction,induceddomesticvalue-addedwouldbe840bnRMBandinducedurbanemploymentwouldbe+852-2978-6634hui.shan@gs.comroughly2.8mnpersons.Bothvalue-addedamountandemploymentimpactareGoldmanSachs(Asia)L.L.C.slightlysmallerthanresidentialhousingconstructionperyuanofdemand.LishengWangnPuttingNEV,batteryproductionandwind/solarpowergenerationcapextogether,ouranalysissuggeststhatthe“NewThree”couldonlypartiallyoffsetthedrag+852-3966-4004ongrowthfromthepropertydowncycle(includingboththroughpropertylisheng.wang@gs.cominvestmentandupstreamsectors,andalsothroughrealestateservices,fiscalGoldmanSachs(Asia)L.L.C.andconsumptionchannels).ThelikelyimpactonrealGDPgrowth(fromexpanding“NewThree”butashrinkingpropertysectoranddecliningtraditionalYutingYangvehicleproduction)is-0.5ppperyearfrom2023-2027basedonourestimates.+852-2978-7283yuting.y.yang@gs.comnBasedonourexpectationofexpanding“NewThree”butashrinkingpropertyGoldmanSachs(Asia)L.L.C.sectoranddecliningtraditionalvehicleproduction,thenetimpactonurbanemploymentwillalsobenegative.FrictionalunemploymentwilllikelyexistasAndrewTiltonwell.WecontinuetobelieveChina’soveralleconomicgrowthinthenextfewyearswilldecelerateasthemulti-yearpropertydownturnproceeds,despitethe+852-2978-1802andrew.tilton@gs.comgovernment’seffortstodevelopthe“NewThree”.WeexpectChina’srealGDPGoldmanSachs(Asia)L.L.C.growthtoslowfrom4.5%in2024to3.7%in2027.a3194d4bc6d047f488bef73494dfc726Investorsshouldconsiderthisreportasonlyasinglefactorinmakingtheirinvestmentdecision.ForRegACcertificationandotherimportantdisclosures,seetheDisclosureAppendix,orgotowww.gs.com/research/hedge.html.GoldmanSachsAsiaEconomicsAnalystSizingthe“NewThree”intheChineseEconomyChina’sdecarbonizationeffortsboostedgrowthinnewenergyvehicle(NEV),batteryandrenewableenergysectors.Thesesectorsareoftenreferredtoasthe“NewThree”oftheChineseeconomy,whichhighlightstheirsignificanceinpolicymakers’pursuitof“high-qualitygrowth”,explainstheirexponentialgrowthinrecentyears,andsuggeststheirincreasingimportancetotheoveralleconomyinfutureyears.Ouranalysissuggeststhatthe“NewThree”couldonlypartiallyoffsetthedragongrowthfromthepropertydowncycles(includingboththroughpropertyinvestmentandupstreamsectors,andalsothroughrealestateservices,fiscalandconsumptionchannels).TheimpactonrealGDPgrowth(fromexpanding“NewThree”butashrinkingpropertysectoranddecliningtraditionalvehicleproduction)is-0.5ppperyearfrom2023-2027basedonourestimates,withthedragbeingmostnegativethisyearandfadinggraduallytowards-0.2in2027.Althoughthesesectorsareoftendiscussedtogether,thechannelsthroughwhichtheycontributetotheChineseeconomydiffersomewhat.Renewableenergyinvolveslargeinvestmentinwindandsolarpowergeneration,whichmostlyaddstoGDPgrowththroughinvestmentinducedproductionacrossupstreamsectors.NEVandbatteryproductionareplayingincreasinglyimportantrolesinthetotalproductionchainoftheeconomy.Exhibit1showedtherapidgrowthofNEVandbatteryproduction,andwind/solarpowergenerationcapacityinrecentyears.Exhibit1:NEVandbatteryproduction,andwind/solarpowergenerationcapacityshowedexponentialgrowthinrecentyearsIndex(2015=100)Index(2015=100)5,0005,0004,000NEVproduction4,000a3194d4bc6d047f488bef73494dfc7263,000Batteryproduction3,0002,000Windandsolarpowergenerationcapacity2,0001,0001,00000201520162017201820192020202120222023ESource:NBS,DatacompiledbyGoldmanSachsGlobalInvestmentResearchGaugingtheimportanceofthe“NewThree”intheChineseeconomy:theexampleofNEVNEVproductionvolumeincreasedfrom1millionunitsin2018to6.7millionunitsin2022.AlthoughtheshareofGDPaccountedfordirectlybyactivitiesofNEVproductionisrelativelysmallatlessthan1%ofGDP(ourestimateofsharein2022),overallimpactonChina’sGDPcanbebiggerifwecountdomesticeconomicactivitiesembodiedinfinaldemandforNEVproduction,whichincludesectoractivitiessuchasbatteryproductionandnon-ferrousmetals(e.g.,copperandaluminum)smeltingandpressing.19October20232GoldmanSachsAsiaEconomicsAnalyst19October2023TheinputstructureofNEVproductionestimatedbyERIA(EconomicResearchInstituteforASEANandEastAsia)in20201showedthatmajorinputstoNEVproductionincludebattery,electricmotor,andwireandcable,differentfrominputstotraditionalvehicle(internalcombustionenginevehicle,ICEV)productionwhichmainlyincludeengineandvehicleparts(Exhibit2)Tocapturetheimpactmorecomprehensively,weexaminebothdirectcontributionfromNEVproductionanddomesticvalue-addedintherestoftheeconomyembeddedinthefinaldemandofNEVproductionusinginput-outputanalysis.Input-outputanalysisillustratestheinterdependenciesbetweendifferenteconomicsectorsandindustries.Followingtheframeworkinourreportongreencapex’simpactontheChineseeconomy,wemapoutNEV’ssupplychainsbasedontheNBS2020input-output(IO)table.The2020IOtableillustratesthelinkagesbetween153sectorsintheChineseeconomy,andisthelatestversionofdetailedIOtablespublishedbytheNBS.TheERIAinputstructureforNEVproductionandtheNBSIOtableallowustomapeachyuanofNEVfinaldemandproportionallyintorequiredactivitiesfromdifferentsectorsoftheeconomy.2Exhibit2:NEVproductionmainlyrequiresbatteryandelectricmotorswhileICEVproductionrequiresengine,vehiclepartsandelectricpartsPercentInputstructurefortraditionalvehiclevsEVPercent10010090908080707060605050404030302020101000BatteryVehiclepartsICEVLaborNEVa3194d4bc6d047f488bef73494dfc726CapitalElectricpartsEngineWireandcableServiceElectronicpartsOtherpartsElectricmotorSource:ERIA(2020)Oneimportantnoteisthatinthisreport,wefocusonmappingindustrylinkagesofNEVproduction,ratherthanNEVcapex,duetodatalimitationontheinputstructureofNEVcapex.NEVproductionwilllikelycontinuegrowingfast,onpotentialhigherpenetrationofNEVdomesticallyandfastNEVexportgrowth,butNEVcapexgrowthissettoslowaftertheinitialinvestmentstageofbuildingoutfactories.TheGSautoresearchteamexpectsnetadditiontoNEVproductioncapacitytobe2mnunitsin2027,buttotalNEVproductiontobearound18mnunitsin2027(vs6.7mnunitsin2022).Inaddition,theaveragecapexperunitofNEVproductioncanbemuchsmallerthantheaveragecostofgoodssoldperunitofNEVproduction.NEVproductionisthereforeamuchbiggerand1ERIA(2020).“TheInfluenceonEnergyandtheEconomyofElectrifiedVehiclePenetrationinASEAN”.ERIAResearchProjectReport2020,No.14.2Weusebatteryelectricvehicle(BEV)inputstructuretorepresentNEVinthisanalysis.TotheextenttechnologicaladvancementsshiftsignificantlyfortheinputstructureofNEVproduction,ourprojectionpost-2020couldbebiasedasweonlyhavethedataforthe2020NEVinputstructureandIOtable.3GoldmanSachsAsiaEconomicsAnalystmoresustainabledriverforgrowthinChina,comparedwithNEVcapex.Sectorsmosta3194d4bc6d047f488bef73494dfc726affectedbythefinaldemandofNEVproductioninvolvebatteryandwireandcableasdiscussedabove,whileNEVcapexinvolvesmachinery,factories,andconstructionofassemblylines.3WefoundthatforeachyuanoffinaldemandofNEVproduction,totaldomesticvalue-addeddirectlyandindirectlyis0.84yuan.NEVproductionalsodrivesimports-theinducedvalue-addedcontentinimports(boththroughautosectoritselfandthroughrelatedsectors)wouldamountto0.16yuan.ComparingNEVproductionvsresidentialhousingconstructionAsinvestorsoftenaskwhichsectorscanatleastpartiallyoffsetthenegativeimpactongrowthfromdecliningpropertyinvestment,wecomparetotaldomesticvalue-addedfromfinaldemandofNEVproductiontothatofresidentialhousingconstruction.Insum,ouranalysissuggestseachyuanoffinaldemandinNEVproductiongeneratesslightlylowerdomesticvalue-addedvspropertyinvestment(0.84vs0.88).TherelevantindustriescontributingtoNEVproductionandresidentialhousingconstructionarequitedifferent.Forexample,motorvehicleparts,batteryandwholesaletradearethetopthreebroadindustriesthatwouldbenefitthemostinvalue-addedtermsfromeachyuanfinaldemandofNEVproduction(Exhibit3).Incontrast,financialservices,wholesaletradeandsmeltingandprocessingofferrousmetalwouldbenefitthemostinvalue-addedtermsfromeachyuanofinvestmentinresidentialhousingconstruction(Exhibit4).Asaresult,inashiftfromRMB1trillionfinaldemandinresidentialhousingconstructiontoRMB1trilliondomesticfinaldemandofNEVproduction,theindustrieswiththelargestincreaseindomesticvalue-addedwouldbebattery,vehiclepartsandnon-ferrousmetalsmeltingandprocessing,whilecement,ferrousmetalsmelting,andfinancialserviceswouldseethelargestdeclineinvalue-added(Exhibit5).NEVproductionalsotendstocreatefewerjobscomparedwithresidentialhousingconstruction:for1trillionRMBfinaldemandofNEVproduction,2.8mnjobswouldbecreatedwhileforeach1trillioninvestmentinresidentialhousingconstruction,3.7mnjobswouldbecreated,reflectingthefactthatconstructionactivitiesaremorelaborintensivecomparedwithmanufacturingactivities.Acrossthebroadeconomicsectors,switchingfrom1trillionRMBfinaldomesticdemandinpropertyinvestmenttofinaldemandinNEVproduction,lessthan1madditionaljobswouldbecreatedinthemanufacturingsector,butaround1.4mjobswouldbelostintheconstructionsector.Theimpactonprimaryindustry,servicesandutilitiesemploymentwouldbenegativeaswell(Exhibit6).19October20233Limitedbydataavailability,wedonotconsiderNEVdownstreamsectorssuchaschargingstationsinthisreport.4GoldmanSachsAsiaEconomicsAnalystExhibit3:Motorvehicleparts,wholesaletradeandbatterywouldExhibit4:…whileresidentialhousinginvestmentbenefitsfinancialbenefitthemostfromNEVproduction…services,wholesaletradeandferrousmetalprocessingandsmeltingthemostDomesticVA(top10sectors)forRMB1tndomesticfinaldemandinNEVproductionDomesticVA(top10sectors)forRMB1tndomesticfinaldemandinresidentialhousingconstructionRoadcargotransportRealestateMetalproductsUtilitiesRealestateCommercialservicesMiningandwashingofcoalNon-ferrousmetalsandtheiralloysCementFinancialservicesRetailtradeRetailtradeUtilitiesBatteryPlasterWholesaletradeSmeltingandprocessingof…MotorvehiclepartsandaccessoriesWholesaletrade0Financialservices1020304050010203040506070RMBbnRMBbnSource:NBS,DatacompiledbyGoldmanSachsGlobalInvestmentResearchSource:NBS,DatacompiledbyGoldmanSachsGlobalInvestmentResearchExhibit5:Cementandrelatedproducts,ferrousmetals,andExhibit6:Onlythemanufacturingsectorwouldseejobgainsinafinancialserviceswillbehitthemostbyashiftfromresidentialshiftfrom1tnRMBofdemandfromresidentialinvestmenttoNEVinvestmenttoNEVproductionproductionDifferenceofVAforRMB1tndomesticfinaldemandshiftfromNEVtoresidentialhousingThouspersonsThouspersonsFinancialservicesPlaster1,500EmploymentimpactofshiiftingRMB1tnofdemandfromresidentialinvestment1,500Cement1,000toNEVproduction1,000FerrousmetalsBuildingmaterials500500…Retailtrade00ElectricMotor-500-500Non-ferrousmetalsandtheiralloysMotorvehiclepartsandaccessories-1,000-1,000Battery-30-20-10010203040-1,500ConstructionManufacturing-1,500RMBbnServicesPrimaryUtilitiesSource:NBS,DatacompiledbyGoldmanSachsGlobalInvestmentResearchSource:NBS,DatacompiledbyGoldmanSachsGlobalInvestmentResearcha3194d4bc6d047f488bef73494dfc726Extendingtheanalysistocoverbatteryproduction4andwind/solarpowergenerationcapex,wecomparethetotaldomesticvalue-added,inducedvalue-addedimports,andinducedemploymentfromNEVproduction,batteryproduction,andwind/solarpowercapextothoseofICEVproductionandresidentialhousingconstruction.Ourinput-outputanalysissuggeststhedomesticvalue-addedratioforeachunitoffinaldemandwouldbethehighestforresidentialhousingconstruction(0.88)andthelowestforbattery(0.75).Theemploymentcontributionisthebiggestforresidentialhousing,andlowestforNEV(Exhibit7).19October20234BatteryisaseparatesectorinChina’s2020IOtable,thereforenoinputstructureassumptionisneeded.5GoldmanSachsAsiaEconomicsAnalyst19October2023Exhibit7:“NewThree”inducesmodestlylessdomesticvalue-added,morevalue-addedimports,andfewerjobscomparedwithresidentialhousingconstructionTnRMB%ofurbanemployment1.51.51.0TotaleconomicimpactfromRMB1tndemandinEV,wind/solarpower,batteryvsICEVandresidentialhousingNEVWind/solar1.0BatteryICEVResidentialhousingconstruction0.50.50.00.0Domesticvalue-addedInducedvalue-addedimportsEmploymentimpact(rhs)Source:NBS,DatacompiledbyGoldmanSachsGlobalInvestmentResearchThefuturepathof“NewThree”andtheircontributiontoGDPgrowtha3194d4bc6d047f488bef73494dfc726DecarbonizationeffortswilllikelycontinuedrivingfastgrowthofNEVandbatteryproductionandrenewableenergycapexinChina.WhileweareoptimisticaboutNEVproductioninthenextfewyears,totalpassengercarconsumptionandproductioninChinahingeonbothmacrofactorssuchashouseholdincomeandconsumerconfidenceandmicrofactorssuchaswhetherfamilieswillwanttoowntwocarsinthefuture,oneICEVforlong-distancedrivingandoneNEVforurbandriving.Aspropertydowncyclemightcontinueweighingonconsumersentimentinthenextfewyears,barringmajorconsumptionstimulativepoliciessuchasdirecttransferstohouseholds,weexpecthouseholdconsumptiongrowthtodeceleratefrom2023through2027.Itmightbechallengingtoseeoveralldomesticpassengercardemandgrowingataveryfastpaceasaresult.China’stotalpassengercarproductionroseby2.3%yoyperyearonaveragefrom2015-2019.Werunascenarioanalysisonprojectingfuturetotalpassengercarproduction:nInalowgrowthscenario,weexpecttotalpassengercarproductiontogrowby2%peryearfrom2024to2027.Inahighgrowthscenario,weadoptourequityresearchteam’sexpectationontotalpassengercarproduction,whichwouldgrowby4.7%yoyperyearoverthesametimehorizon.nInbothscenarios,weremainpositiveonNEV’spenetrationinChinaandforecastNEVproductiontoaccountfor60%oftotalpassengercarproductioninChinaby2027,upfrom29%in2022.China’smarketshareinglobalNEVexportswentupto60%in2023accordingtoChinaPassengerCarAssociation(CPCA).LargeDMssuchastheEuroAreastartedtoconsiderrestrictingChineseexportsofNEV,sothemarketsharegainofChineseNEVmaybeslowerincomingyears.However,incomparisonwithtotalNEVproduction,exportvolumetookaround16%intotalChinaNEVproductionin2022,sodomesticdemandremainsthebiggerpartforChinaNEVproductionrelativetoexportsinthenextfewyears(Exhibit8).Therefore,6GoldmanSachsAsiaEconomicsAnalystweuseourequityresearchteam’sforecastsforChineseNEVexportsandICEVexportsinbothscenarios.5Ourassumptiononthelowgrowthscenariothusimpliestotalpassengercarproductionnotforexportswouldremainbroadlyunchangedoverthenextfewyears,whileinhighgrowthscenario,totalpassengercarproductionnotforexportsgraduallygrowsbyaround2%peryear.nIncontrast,wethinkresidentialhousinginvestmentissettodeclineincomingyears.Propertyinventoriesstayhighinlower-tiercitiesandconfidencetowardsthepropertymarketoutlookremainsweak.Inbothscenarios,weexpectpropertyinvestmenttodeclinebyanaveragerateof4%peryearoverthenextfiveyears,consistentwithourpropertycontributiontoGDPmodel.nWeadoptpublishedGSequityresearchforecastforbatteryproductionandwind/solarpowergenerationcapexinbothscenarios.GSequityforecastsassumebatteryproduction,andwind/solarpowergenerationrelatedcapextogrowbyaround150%and120%cumulativelyby2027relativeto2022(Exhibit9).Inthelowgrowthscenario,grossdomesticvalue-addedofthe“NewThree”(namelyexpectedNEVandbatteryproduction,aswellasexpectedcapexinwind/solarpowergeneration)canincreasefrom3trillionRMB(in2020price)in2022to7.5trillionRMB(in2020price)in2027.(Toavoiddoublecounting,weonlyincludebatteryproductionnotusedforNEVorrenewableenergygeneration.Thiswouldmainlyincludebatteryproductionforconsumerelectronics,whichisroughly40%oftotalbatterydemandinChinacurrently.)Exhibit8:DomesticconsumptionwilllikelyremainthedominantExhibit9:NEVproductionislikelytoexpandquicklyoverthenextdriverforNEVproductionincomingyearsfewyearsMillionunitsMillionunitsRMBtn(2020price)RMBtn(2020price)357735Grossvalue-addedfromNewThree6Chinapassengercardata30654(historicalandforecastlowgrowthscenario)253302201ICEVtotalproduction025NEVproductionexclexports52026E2027ENEVexportsNEV(highgrowth)a3194d4bc6d047f488bef73494dfc72620NEV(lowgrowth)4ICEV(highgrowth)1515ICEV(lowgrowth)3Wind/solar1010Battery255102020202120220020192023E2024E2025E2026E2027E20202023onwardsdataareGSforecasts202120222023E2024E2025ESource:CPCA,GoldmanSachsGlobalInvestmentResearchSource:NBS,DatacompiledbyGoldmanSachsGlobalInvestmentResearchMappingthegrossvalue-addedfrom“NewThree”toGDPcontribution,togetherwiththatfromtraditionalsectorssuchasICEVproductionandproperty,wefindthatthestrongexpansionof“NewThree”isstillnotenoughtooffsetthenegativedragongrowthfromshrinkingpropertysectoranddecliningICEVproduction.Propertysector’sshareinChina’sGDPthroughallchannelswilllikelyshrinkfromcloseto30%in2020(seeourreporthereformoredetaileddiscussions),toaround17%by2027(Exhibit10).Thedeclinecannotbefullyoffsetby“NewThree”basedonourcalculation.Inourlow19October20235Notethatinbothscenarios,ourexpectationfor2023productionisthesame,whichismarkedtomarketbasedonyear-to-dateperformance.7GoldmanSachsAsiaEconomicsAnalystgrowthscenario,thecombinedimpactonrealGDPyear-over-yeargrowthoverthenexta3194d4bc6d047f488bef73494dfc726fiveyearswouldbe-0.5pp,withthenetimpactbeingthemostnegativein2023,at-0.8ppofGDP,beforegraduallyfadingto-0.7ppin2024andfinallyonly-0.2ppby2027.Inthehighgrowthscenario,theaveragenetimpactonrealGDPgrowthwouldbe-0.3ppoverthenextfiveyears,withthenetimpactbeingonly-0.07ppby2027(Exhibit12).Ouranalysisoninducedemploymentbydifferentsectorshowedthat,inlowgrowthscenario,urbanemploymentwouldbedownbymorethan3mnpersonsin2024.Inparticular,therewillbemanyjoblosses(around6mnpersons)inpropertyandICEVproduction,despitethearound3.7mnjobgainsin“NewThree”relatedjobs.Additionally,thenegativeimpactonemploymentmaybelargerthanimpliedbythesemechanicalcalculationsduetofrictionalunemployment,astheskillsetrequiredfromworkingin“NewThree”relatedjobswouldbevastlydifferentfromthoserequiredfromworkinginpropertyrelatedjobs.FrictionalunemploymentcanlowerconfidenceandweighonconsumptionandoverallGDPgrowth.Oneimportantcaveathereisouranalysisisbasedon2020input-outputtable.Wethereforehaveassumedtheinput-outputstructureforNEV,batteryproductionandrenewableenergygenerationcapexremainunchangedinfutureyears.Inreality,technologyadvancementaroundNEVandbatterycouldsignificantlyaltertheinputstructureoftheseindustries,aswellasotherindustriesintheChineseeconomypotentially.WeaimtoupdateouranalysisinthefuturewhenupdatedERIAdataandNBSIOtablebecomeavailable.Anothercaveatisthatouranalysismaynotcaptureallthelinkagesbetweenthe“NewThree”andthebroadereconomy.Forexample,NEVproductiondownstreamsectorssuchaschargingfacilitieswilllikelybenefitfromrapidgrowthofNEVproductionandaddfurthertoourestimateof“NewThree”contributiontoGDPgrowthinfutureyears.Ontheotherhand,wealsodonotincludethenegativedragtoGDPfromfallinginfrastructureinvestmentassociatedwithpropertyinvestment(e.g.,roadsnearnewlybuiltapartmentcomplexes)orfromfallingservicesoutputassociatedwithICEV(e.g.,oilchangeservices).Exhibit10:PropertysectormaycontinueshrinkingrelativetototalExhibit11:TheexpansionofNewThreecanonlypartiallyoffsetthesizeofGDPincomingyearsnegativedragongrowthfrompropertydowncycleandlowerICEVproductionPercentPercentpppp5050ShareofChinaGDPbyNewThree,ICEVandproperty(lowgrowthscenario)3.03.04040ImpactonrealGDPgrowthfromtotalvalue-addedbysector(lowgrowthscenario)Property(allchannels)NEVNEVICEVICEVWind/solarBattery2.0Property(allchannels)Wind/solar2.0BatterySum1.01.030300.00.02020-1.0-1.01010-2.0-2.00202120222023E2024E2025E2026E0-3.020222023E2024E2025E2026E-3.020202027E20212027ESource:NBS,GoldmanSachsGlobalInvestmentResearchSource:GoldmanSachsGlobalInvestmentResearch19October20238GoldmanSachsAsiaEconomicsAnalystExhibit12:EveninhighgrowthscenarioofChina’stotalpassengercarproduction,thenetimpactonrealGDPgrowthwillstillbenegativeoverthenextfewyearspppp0.2NetcontributionfromNewThree,property(allchannels)andICEVproductionto0.20.0China'srealGDPgrowthunderdifferentscenarios0.0-0.2HighgrowthLowgrowth-0.2-0.4-0.4-0.6-0.6-0.8-0.8-1.0-1.0-1.2-1.2-1.42023E2024E2025E2026E-1.420222027ESource:GoldmanSachsGlobalInvestmentResearchWethankTinaHouandEricSheninGSequityresearchteam,andSabrinaLukinAsiaeconomicsresearchteamfortheircontributionstothisreport.MaggieWeiandXinquanChena3194d4bc6d047f488bef73494dfc72619October20239GoldmanSachsAsiaEconomicsAnalystDisclosureAppendixRegACa3194d4bc6d047f488bef73494dfc726We,MaggieWei,XinquanChen,HuiShan,LishengWang,YutingYangandAndrewTilton,herebycertifythatalloftheviewsexpressedinthisreportaccuratelyreflectourpersonalviews,whichhavenotbeeninfluencedbyconsiderationsofthefirm’sbusinessorclientrelationships.Unlessotherwisestated,theindividualslistedonthecoverpageofthisreportareanalystsinGoldmanSachs’GlobalInvestmentResearchdivision.DisclosuresRegulatorydisclosuresDisclosuresrequiredbyUnitedStateslawsandregulationsSeecompany-specificregulatorydisclosuresaboveforanyofthefollowingdisclosuresrequiredastocompaniesreferredtointhisreport:managerorco-managerinapendingtransaction;1%orotherownership;compensationforcertainservices;typesofclientrelationships;managed/co-managedpublicofferingsinpriorperiods;directorships;forequitysecurities,marketmakingand/orspecialistrole.GoldmanSachstradesormaytradeasaprincipalindebtsecurities(orinrelatedderivatives)ofissuersdiscussedinthisreport.Thefollowingareadditionalrequireddisclosures:Ownershipandmaterialconflictsofinterest:GoldmanSachspolicyprohibitsitsanalysts,professionalsreportingtoanalystsandmembersoftheirhouseholdsfromowningsecuritiesofanycompanyintheanalyst’sareaofcoverage.Analystcompensation:AnalystsarepaidinpartbasedontheprofitabilityofGoldmanSachs,whichincludesinvestmentbankingrevenues.Analystasofficerordirector:GoldmanSachspolicygenerallyprohibitsitsanalysts,personsreportingtoanalystsormembersoftheirhouseholdsfromservingasanofficer,directororadvisorofanycompanyintheanalyst’sareaofcoverage.Non-U.S.Analysts:Non-U.S.analystsmaynotbeassociatedpersonsofGoldmanSachs&Co.LLCandthereforemaynotbesubjecttoFINRARule2241orFINRARule2242restrictionsoncommunicationswithsubjectcompany,publicappearancesandtradingsecuritiesheldbytheanalysts.AdditionaldisclosuresrequiredunderthelawsandregulationsofjurisdictionsotherthantheUnitedStatesThefollowingdisclosuresarethoserequiredbythejurisdictionindicated,excepttotheextentalreadymadeabovepursuanttoUnitedStateslawsandregulations.Australia:GoldmanSachsAustraliaPtyLtdanditsaffiliatesarenotauthoriseddeposit-takinginstitutions(asthattermisdefinedintheBankingAct1959(Cth))inAustraliaanddonotprovidebankingservices,norcarryonabankingbusiness,inAustralia.Thisresearch,andanyaccesstoit,isintendedonlyfor“wholesaleclients”withinthemeaningoftheAustralianCorporationsAct,unlessotherwiseagreedbyGoldmanSachs.Inproducingresearchreports,membersofGlobalInvestmentResearchofGoldmanSachsAustraliamayattendsitevisitsandothermeetingshostedbythecompaniesandotherentitieswhicharethesubjectofitsresearchreports.InsomeinstancesthecostsofsuchsitevisitsormeetingsmaybemetinpartorinwholebytheissuersconcernedifGoldmanSachsAustraliaconsidersitisappropriateandreasonableinthespecificcircumstancesrelatingtothesitevisitormeeting.Totheextentthatthecontentsofthisdocumentcontainsanyfinancialproductadvice,itisgeneraladviceonlyandhasbeenpreparedbyGoldmanSachswithouttakingintoaccountaclient’sobjectives,financialsituationorneeds.Aclientshould,beforeactingonanysuchadvice,considertheappropriatenessoftheadvicehavingregardtotheclient’sownobjectives,financialsituationandneeds.AcopyofcertainGoldmanSachsAustraliaandNewZealanddisclosureofinterestsandacopyofGoldmanSachs’AustralianSell-SideResearchIndependencePolicyStatementareavailableat:https://www.goldmansachs.com/disclosures/australia-new-zealand/index.html.Brazil:DisclosureinformationinrelationtoCVMResolutionn.20isavailableathttps://www.gs.com/worldwide/brazil/area/gir/index.html.Whereapplicable,theBrazil-registeredanalystprimarilyresponsibleforthecontentofthisresearchreport,asdefinedinArticle20ofCVMResolutionn.20,isthefirstauthornamedatthebeginningofthisreport,unlessindicatedotherwiseattheendofthetext.Canada:Thisinformationisbeingprovidedtoyouforinformationpurposesonlyandisnot,andundernocircumstancesshouldbeconstruedas,anadvertisement,offeringorsolicitationbyGoldmanSachs&Co.LLCforpurchasersofsecuritiesinCanadatotradeinanyCanadiansecurity.GoldmanSachs&Co.LLCisnotregisteredasadealerinanyjurisdictioninCanadaunderapplicableCanadiansecuritieslawsandgenerallyisnotpermittedtotradeinCanadiansecuritiesandmaybeprohibitedfromsellingcertainsecuritiesandproductsincertainjurisdictionsinCanada.IfyouwishtotradeinanyCanadiansecuritiesorotherproductsinCanadapleasecontactGoldmanSachsCanadaInc.,anaffiliateofTheGoldmanSachsGroupInc.,oranotherregisteredCanadiandealer.HongKong:FurtherinformationonthesecuritiesofcoveredcompaniesreferredtointhisresearchmaybeobtainedonrequestfromGoldmanSachs(Asia)L.L.C.India:FurtherinformationonthesubjectcompanyorcompaniesreferredtointhisresearchmaybeobtainedfromGoldmanSachs(India)SecuritiesPrivateLimited,ResearchAnalyst-SEBIRegistrationNumberINH000001493,951-A,RationalHouse,AppasahebMaratheMarg,Prabhadevi,Mumbai400025,India,CorporateIdentityNumberU74140MH2006FTC160634,Phone+912266169000,Fax+912266169001.GoldmanSachsmaybeneficiallyown1%ormoreofthesecurities(assuchtermisdefinedinclause2(h)theIndianSecuritiesContracts(Regulation)Act,1956)ofthesubjectcompanyorcompaniesreferredtointhisresearchreport.Investmentinsecuritiesmarketaresubjecttomarketrisks.Readalltherelateddocumentscarefullybeforeinvesting.RegistrationgrantedbySEBIandcertificationfromNISMinnowayguaranteeperformanceoftheintermediaryorprovideanyassuranceofreturnstoinvestors.GoldmanSachs(India)SecuritiesPrivateLimitedInvestorGrievanceE-mail:india-client-support@gs.com.ComplianceOfficer:AnilRajputTel:+912266169000Email:anil.m.rajput@gs.com.Japan:Seebelow.Korea:Thisresearch,andanyaccesstoit,isintendedonlyfor“professionalinvestors”withinthemeaningoftheFinancialServicesandCapitalMarketsAct,unlessotherwiseagreedbyGoldmanSachs.FurtherinformationonthesubjectcompanyorcompaniesreferredtointhisresearchmaybeobtainedfromGoldmanSachs(Asia)L.L.C.,SeoulBranch.NewZealand:GoldmanSachsNewZealandLimitedanditsaffiliatesareneither“registeredbanks”nor“deposittakers”(asdefinedintheReserveBankofNewZealandAct1989)inNewZealand.Thisresearch,andanyaccesstoit,isintendedfor“wholesaleclients”(asdefinedintheFinancialAdvisersAct2008)unlessotherwiseagreedbyGoldmanSachs.AcopyofcertainGoldmanSachsAustraliaandNewZealanddisclosureofinterestsisavailableat:https://www.goldmansachs.com/disclosures/australia-new-zealand/index.html.Russia:ResearchreportsdistributedintheRussianFederationarenotadvertisingasdefinedintheRussianlegislation,butareinformationandanalysisnothavingproductpromotionastheirmainpurposeanddonotprovideappraisalwithinthemeaningoftheRussianlegislationonappraisalactivity.ResearchreportsdonotconstituteapersonalizedinvestmentrecommendationasdefinedinRussianlawsandregulations,arenotaddressedtoaspecificclient,andarepreparedwithoutanalyzingthefinancialcircumstances,investmentprofilesorriskprofilesofclients.GoldmanSachsassumesnoresponsibilityforanyinvestmentdecisionsthatmaybetakenbyaclientoranyotherpersonbasedonthisresearchreport.Singapore:GoldmanSachs(Singapore)Pte.(CompanyNumber:198602165W),whichisregulatedbytheMonetaryAuthorityofSingapore,acceptslegalresponsibilityforthisresearch,andshouldbecontactedwithrespecttoanymattersarisingfrom,orinconnectionwith,thisresearch.Taiwan:Thismaterialisforreferenceonlyandmustnotbereprintedwithoutpermission.Investorsshouldcarefullyconsidertheirowninvestmentrisk.Investmentresultsaretheresponsibilityoftheindividualinvestor.UnitedKingdom:PersonswhowouldbecategorizedasretailclientsintheUnitedKingdom,assuchtermisdefinedintherulesoftheFinancialConductAuthority,shouldreadthisresearchinconjunctionwithpriorGoldmanSachsresearchonthecoveredcompaniesreferredtohereinandshouldrefertotheriskwarningsthathavebeensenttothembyGoldmanSachsInternational.Acopyoftheseriskswarnings,andaglossaryofcertainfinancialtermsusedinthisreport,areavailablefromGoldmanSachsInternationalonrequest.EuropeanUnionandUnitedKingdom:DisclosureinformationinrelationtoArticle6(2)oftheEuropeanCommissionDelegatedRegulation(EU)(2016/958)supplementingRegulation(EU)No596/2014oftheEuropeanParliamentandoftheCouncil(includingasthatDelegatedRegulationis19October202310GoldmanSachsAsiaEconomicsAnalystimplementedintoUnitedKingdomdomesticlawandregulationfollowingtheUnitedKingdom’sdeparturefromtheEuropeanUnionandtheEuropeana3194d4bc6d047f488bef73494dfc726EconomicArea)withregardtoregulatorytechnicalstandardsforthetechnicalarrangementsforobjectivepresentationofinvestmentrecommendationsorotherinformationrecommendingorsuggestinganinvestmentstrategyandfordisclosureofparticularinterestsorindicationsofconflictsofinterestisavailableathttps://www.gs.com/disclosures/europeanpolicy.htmlwhichstatestheEuropeanPolicyforManagingConflictsofInterestinConnectionwithInvestmentResearch.Japan:GoldmanSachsJapanCo.,Ltd.isaFinancialInstrumentDealerregisteredwiththeKantoFinancialBureauunderregistrationnumberKinsho69,andamemberofJapanSecuritiesDealersAssociation,FinancialFuturesAssociationofJapanTypeIIFinancialInstrumentsFirmsAssociation,TheInvestmentTrustsAssociation,Japan,andJapanInvestmentAdvisersAssociation.Salesandpurchaseofequitiesaresubjecttocommissionpre-determinedwithclientsplusconsumptiontax.Seecompany-specificdisclosuresastoanyapplicabledisclosuresrequiredbyJapanesestockexchanges,theJapaneseSecuritiesDealersAssociationortheJapaneseSecuritiesFinanceCompany.Globalproduct;distributingentitiesGoldmanSachsGlobalInvestmentResearchproducesanddistributesresearchproductsforclientsofGoldmanSachsonaglobalbasis.AnalystsbasedinGoldmanSachsofficesaroundtheworldproduceresearchonindustriesandcompanies,andresearchonmacroeconomics,currencies,commoditiesandportfoliostrategy.ThisresearchisdisseminatedinAustraliabyGoldmanSachsAustraliaPtyLtd(ABN21006797897);inBrazilbyGoldmanSachsdoBrasilCorretoradeTítuloseValoresMobiliáriosS.A.;PublicCommunicationChannelGoldmanSachsBrazil:08007275764and/orcontatogoldmanbrasil@gs.com.AvailableWeekdays(exceptholidays),from9amto6pm.CanaldeComunicaçãocomoPúblicoGoldmanSachsBrasil:08007275764e/oucontatogoldmanbrasil@gs.com.Horáriodefuncionamento:segunda-feiraàsexta-feira(excetoferiados),das9hàs18h;inCanadabyGoldmanSachs&Co.LLC;inHongKongbyGoldmanSachs(Asia)L.L.C.;inIndiabyGoldmanSachs(India)SecuritiesPrivateLtd.;inJapanbyGoldmanSachsJapanCo.,Ltd.;intheRepublicofKoreabyGoldmanSachs(Asia)L.L.C.,SeoulBranch;inNewZealandbyGoldmanSachsNewZealandLimited;inRussiabyOOOGoldmanSachs;inSingaporebyGoldmanSachs(Singapore)Pte.(CompanyNumber:198602165W);andintheUnitedStatesofAmericabyGoldmanSachs&Co.LLC.GoldmanSachsInternationalhasapprovedthisresearchinconnectionwithitsdistributionintheUnitedKingdom.GoldmanSachsInternational(“GSI”),authorisedbythePrudentialRegulationAuthority(“PRA”)andregulatedbytheFinancialConductAuthority(“FCA”)andthePRA,hasapprovedthisresearchinconnectionwithitsdistributionintheUnitedKingdom.EuropeanEconomicArea:GSI,authorisedbythePRAandregulatedbytheFCAandthePRA,disseminatesresearchinthefollowingjurisdictionswithintheEuropeanEconomicArea:theGrandDuchyofLuxembourg,Italy,theKingdomofBelgium,theKingdomofDenmark,theKingdomofNorway,theRepublicofFinlandandtheRepublicofIreland;GSI-SuccursaledeParis(Parisbranch)whichisauthorisedbytheFrenchAutoritédecontrôleprudentieletderesolution(“ACPR”)andregulatedbytheAutoritédecontrôleprudentieletderesolutionandtheAutoritédesmarchesfinanciers(“AMF”)disseminatesresearchinFrance;GSI-SucursalenEspaña(Madridbranch)authorizedinSpainbytheComisiónNacionaldelMercadodeValoresdisseminatesresearchintheKingdomofSpain;GSI-SwedenBankfilial(Stockholmbranch)isauthorizedbytheSFSAasa“thirdcountrybranch”inaccordancewithChapter4,Section4oftheSwedishSecuritiesandMarketAct(Sw.lag(2007:528)omvärdepappersmarknaden)disseminatesresearchintheKingdomofSweden;GoldmanSachsBankEuropeSE(“GSBE”)isacreditinstitutionincorporatedinGermanyand,withintheSingleSupervisoryMechanism,subjecttodirectprudentialsupervisionbytheEuropeanCentralBankandinotherrespectssupervisedbyGermanFederalFinancialSupervisoryAuthority(BundesanstaltfürFinanzdienstleistungsaufsicht,BaFin)andDeutscheBundesbankanddisseminatesresearchintheFederalRepublicofGermanyandthosejurisdictionswithintheEuropeanEconomicAreawhereGSIisnotauthorisedtodisseminateresearchandadditionally,GSBE,CopenhagenBranchfilialafGSBE,Tyskland,supervisedbytheDanishFinancialAuthoritydisseminatesresearchintheKingdomofDenmark;GSBE-SucursalenEspaña(Madridbranch)subject(toalimitedextent)tolocalsupervisionbytheBankofSpaindisseminatesresearchintheKingdomofSpain;GSBE-SuccursaleItalia(Milanbranch)totherelevantapplicableextent,subjecttolocalsupervisionbytheBankofItaly(Bancad’Italia)andtheItalianCompaniesandExchangeCommission(CommissioneNazionaleperleSocietàelaBorsa“Consob”)disseminatesresearchinItaly;GSBE-SuccursaledeParis(Parisbranch),supervisedbytheAMFandbytheACPRdisseminatesresearchinFrance;andGSBE-SwedenBankfilial(Stockholmbranch),toalimitedextent,subjecttolocalsupervisionbytheSwedishFinancialSupervisoryAuthority(Finansinpektionen)disseminatesresearchintheKingdomofSweden.GeneraldisclosuresThisresearchisforourclientsonly.OtherthandisclosuresrelatingtoGoldmanSachs,thisresearchisbasedoncurrentpublicinformationthatweconsiderreliable,butwedonotrepresentitisaccurateorcomplete,anditshouldnotbereliedonassuch.Theinformation,opinions,estimatesandforecastscontainedhereinareasofthedatehereofandaresubjecttochangewithoutpriornotification.Weseektoupdateourresearchasappropriate,butvariousregulationsmaypreventusfromdoingso.Otherthancertainindustryreportspublishedonaperiodicbasis,thelargemajorityofreportsarepublishedatirregularintervalsasappropriateintheanalyst’sjudgment.GoldmanSachsconductsaglobalfull-service,integratedinvestmentbanking,investmentmanagement,andbrokeragebusiness.WehaveinvestmentbankingandotherbusinessrelationshipswithasubstantialpercentageofthecompaniescoveredbyGlobalInvestmentResearch.GoldmanSachs&Co.LLC,theUnitedStatesbrokerdealer,isamemberofSIPC(https://www.sipc.org).Oursalespeople,traders,andotherprofessionalsmayprovideoralorwrittenmarketcommentaryortradingstrategiestoourclientsandprincipaltradingdesksthatreflectopinionsthatarecontrarytotheopinionsexpressedinthisresearch.Ourassetmanagementarea,principaltradingdesksandinvestingbusinessesmaymakeinvestmentdecisionsthatareinconsistentwiththerecommendationsorviewsexpressedinthisresearch.Weandouraffiliates,officers,directors,andemployeeswillfromtimetotimehavelongorshortpositionsin,actasprincipalin,andbuyorsell,thesecuritiesorderivatives,ifany,referredtointhisresearch,unlessotherwiseprohibitedbyregulationorGoldmanSachspolicy.TheviewsattributedtothirdpartypresentersatGoldmanSachsarrangedconferences,includingindividualsfromotherpartsofGoldmanSachs,donotnecessarilyreflectthoseofGlobalInvestmentResearchandarenotanofficialviewofGoldmanSachs.Anythirdpartyreferencedherein,includinganysalespeople,tradersandotherprofessionalsormembersoftheirhousehold,mayhavepositionsintheproductsmentionedthatareinconsistentwiththeviewsexpressedbyanalystsnamedinthisreport.Thisresearchisfocusedoninvestmentthemesacrossmarkets,industriesandsectors.Itdoesnotattempttodistinguishbetweentheprospectsorperformanceof,orprovideanalysisof,individualcompanieswithinanyindustryorsectorwedescribe.Anytradingrecommendationinthisresearchrelatingtoanequityorcreditsecurityorsecuritieswithinanindustryorsectorisreflectiveoftheinvestmentthemebeingdiscussedandisnotarecommendationofanysuchsecurityinisolation.Thisresearchisnotanoffertosellorthesolicitationofanoffertobuyanysecurityinanyjurisdictionwheresuchanofferorsolicitationwouldbeillegal.Itdoesnotconstituteapersonalrecommendationortakeintoaccounttheparticularinvestmentobjectives,financialsituations,orneedsofindividualclients.Clientsshouldconsiderwhetheranyadviceorrecommendationinthisresearchissuitablefortheirparticularcircumstancesand,ifappropriate,seekprofessionaladvice,includingtaxadvice.Thepriceandvalueofinvestmentsreferredtointhisresearchandtheincomefromthemmayfluctuate.Pastperformanceisnotaguidetofutureperformance,futurereturnsarenotguaranteed,andalossoforiginalcapitalmayoccur.Fluctuationsinexchangeratescouldhaveadverseeffectsonthevalueorpriceof,orincomederivedfrom,certaininvestments.19October202311GoldmanSachsAsiaEconomicsAnalystCertaintransactions,includingthoseinvolvingfutures,options,andotherderivatives,giverisetosubstantialriskandarenotsuitableforallinvestors.InvestorsshouldreviewcurrentoptionsandfuturesdisclosuredocumentswhichareavailablefromGoldmanSachssalesrepresentativesorathttps://www.theocc.com/about/publications/character-risks.jspandhttps://www.fiadocumentation.org/fia/regulatory-disclosures_1/fia-uniform-futures-and-options-on-futures-risk-disclosures-booklet-pdf-version-2018.Transactioncostsmaybesignificantinoptionstrategiescallingformultiplepurchaseandsalesofoptionssuchasspreads.Supportingdocumentationwillbesupplieduponrequest.DifferingLevelsofServiceprovidedbyGlobalInvestmentResearch:ThelevelandtypesofservicesprovidedtoyoubyGoldmanSachsGlobalInvestmentResearchmayvaryascomparedtothatprovidedtointernalandotherexternalclientsofGS,dependingonvariousfactorsincludingyourindividualpreferencesastothefrequencyandmannerofreceivingcommunication,yourriskprofileandinvestmentfocusandperspective(e.g.,marketwide,sectorspecific,longterm,shortterm),thesizeandscopeofyouroverallclientrelationshipwithGS,andlegalandregulatoryconstraints.Asanexample,certainclientsmayrequesttoreceivenotificationswhenresearchonspecificsecuritiesispublished,andcertainclientsmayrequestthatspecificdataunderlyinganalysts’fundamentalanalysisavailableonourinternalclientwebsitesbedeliveredtothemelectronicallythroughdatafeedsorotherwise.Nochangetoananalyst’sfundamentalresearchviews(e.g.,ratings,pricetargets,ormaterialchangestoearningsestimatesforequitysecurities),willbecommunicatedtoanyclientpriortoinclusionofsuchinformationinaresearchreportbroadlydisseminatedthroughelectronicpublicationtoourinternalclientwebsitesorthroughothermeans,asnecessary,toallclientswhoareentitledtoreceivesuchreports.Allresearchreportsaredisseminatedandavailabletoallclientssimultaneouslythroughelectronicpublicationtoourinternalclientwebsites.Notallresearchcontentisredistributedtoourclientsoravailabletothird-partyaggregators,norisGoldmanSachsresponsiblefortheredistributionofourresearchbythirdpartyaggregators.Forresearch,modelsorotherdatarelatedtooneormoresecurities,marketsorassetclasses(includingrelatedservices)thatmaybeavailabletoyou,pleasecontactyourGSrepresentativeorgotohttps://research.gs.com.Disclosureinformationisalsoavailableathttps://www.gs.com/research/hedge.htmlorfromResearchCompliance,200WestStreet,NewYork,NY10282.©2023GoldmanSachs.Nopartofthismaterialmaybe(i)copied,photocopiedorduplicatedinanyformbyanymeansor(ii)redistributedwithoutthepriorwrittenconsentofTheGoldmanSachsGroup,Inc.a3194d4bc6d047f488bef73494dfc72619October202312

1、当您付费下载文档后,您只拥有了使用权限,并不意味着购买了版权,文档只能用于自身使用,不得用于其他商业用途(如 [转卖]进行直接盈利或[编辑后售卖]进行间接盈利)。
2、本站所有内容均由合作方或网友上传,本站不对文档的完整性、权威性及其观点立场正确性做任何保证或承诺!文档内容仅供研究参考,付费前请自行鉴别。
3、如文档内容存在违规,或者侵犯商业秘密、侵犯著作权等,请点击“违规举报”。

碎片内容

碳中和
已认证
内容提供者

碳中和

确认删除?
回到顶部
微信客服
  • 管理员微信
QQ客服
  • QQ客服点击这里给我发消息
客服邮箱