【推荐】处在十字路口的能源转型(英)VIP专享VIP免费

Deloitte’s Energy
Transition Monitor
Energy transition at
a crossroads
A Deloitte Netherlands publication
September 2023
02
Deloitte's Energy Transition Monitor
The energy transition is arguably the most challenging undertaking of this generation. The Netherlands has made good progress, so far, but
the country has come to a crossroads. Most of its progress has come from picking the low-hanging fruit, and reducing industrial output, but
to achieve the emission goals for 2030 and beyond, fundamental choices need to be made around the structure of the Dutch economy and
the energy system that enables it. The Netherlands has excellent oshore wind potential, a long-established industrial sector, and a leading
educational system, so the country is well-placed to create a global blueprint for a successful energy transition.
A successful energy transition depends on the right decisions being made, which require the right information. This Energy Transition
Monitor therefore provides a common fact-base, with which to assess the transition’s progress. However, true progress requires more than
just reducing emissions (because have we really been successful if we relocate emissions to other countries?). This report therefore provides
a holistic perspective, and brings together statistical data, stakeholder perspectives (NGOs, journalists, industry professionals, academics
and government ocials) and an analysis of public sentiment.
Using these sources, this report examines the transition’s progress from 1990 to 2022, toward the country’s statutory (Klimaatakkoord)
targets for 2030 and overall goal of net-zero emissions by 2050. Some key highlights:
01. The industry sector has reduced its emissions the most, but through lower production output and by reducing non-CO2 greenhouse
gases, so the real transition still needs to start.
02. National energy-related emissions have reduced by 32% in 2022 (relative to 1990). However, this ignores emissions from international
aviation and shipping, and imported products, which together exceed the reported national emissions.
03. 15% of energy consumed in the Netherlands comes from renewables – mainly biomass, but with strong growth in wind and solar sources
for generating clean electricity.
04. Electrication oers the greatest potential for increasing the use of renewables, but progress has been limited. For instance, electric
vehicles represented only 1.5% of the mobility sectors energy consumption.
05. One in three households on average now uses at least one clean energy technology (solar panels, EVs or heat pumps), and the adoption
rate is growing fast.
06. Although public sentiment is mixed, the Dutch energy transition has achieved some notable successes, such as the EU’s highest
adoption of solar panels and per capita provision of EV charging stations, and 40% of the country’s electricity now being generated from
renewables.
The current rate of progress is too slow to meet the Dutch 2030 targets, so the energy transition must accelerate, and tough decisions lay
ahead. To help make a successful transition, the following approaches to the transition are proposed.
01. Develop the path together
Combine private and public interests, to benet Dutch society and economy, as well as the global climate. In particular,
industrial emissions should be considered alongside domestic production, possibly including a target for manufacturing output.
02. Take full responsibility
The eect on greenhouse gas emissions from international aviation and shipping and imported goods should be taken into account
when designing and evaluating emission-reduction policies and incentives.
03. Take the public along
Public support can be harnessed by celebrating the transition’s successes, and by using public policy to set new behavioral norms, rather
than focusing purely on nancial incentives.
04. Decarbonize molecular energy demand
Although electrication should remain the main focus, the remaining demand for molecular sources should be decarbonized more
actively, by promoting the use of clean hydrogen and making optimal use of the limited biomass resources.
05. Prioritize impact in scaling
Incentives have proved an eective way to promote the household take-up of some clean energy technologies, and should now focus on
initiatives where the Dutch government is leading and where the greatest impact on emissions can be achieved. For instance changing
domestic heating from gas to new renewable technologies, which will create the demand, momentum and condence for the private
sector to scale up production.
The Energy Transition Monitor provides an overview of the status of the energy transition and proposes bold ideas to accelerate it further
and creates a starting point for discussion, allowing professionals in the eld to work together and make the right decisions for future
progress.
Executive Summary
03
Deloitte's Energy Transition Monitor
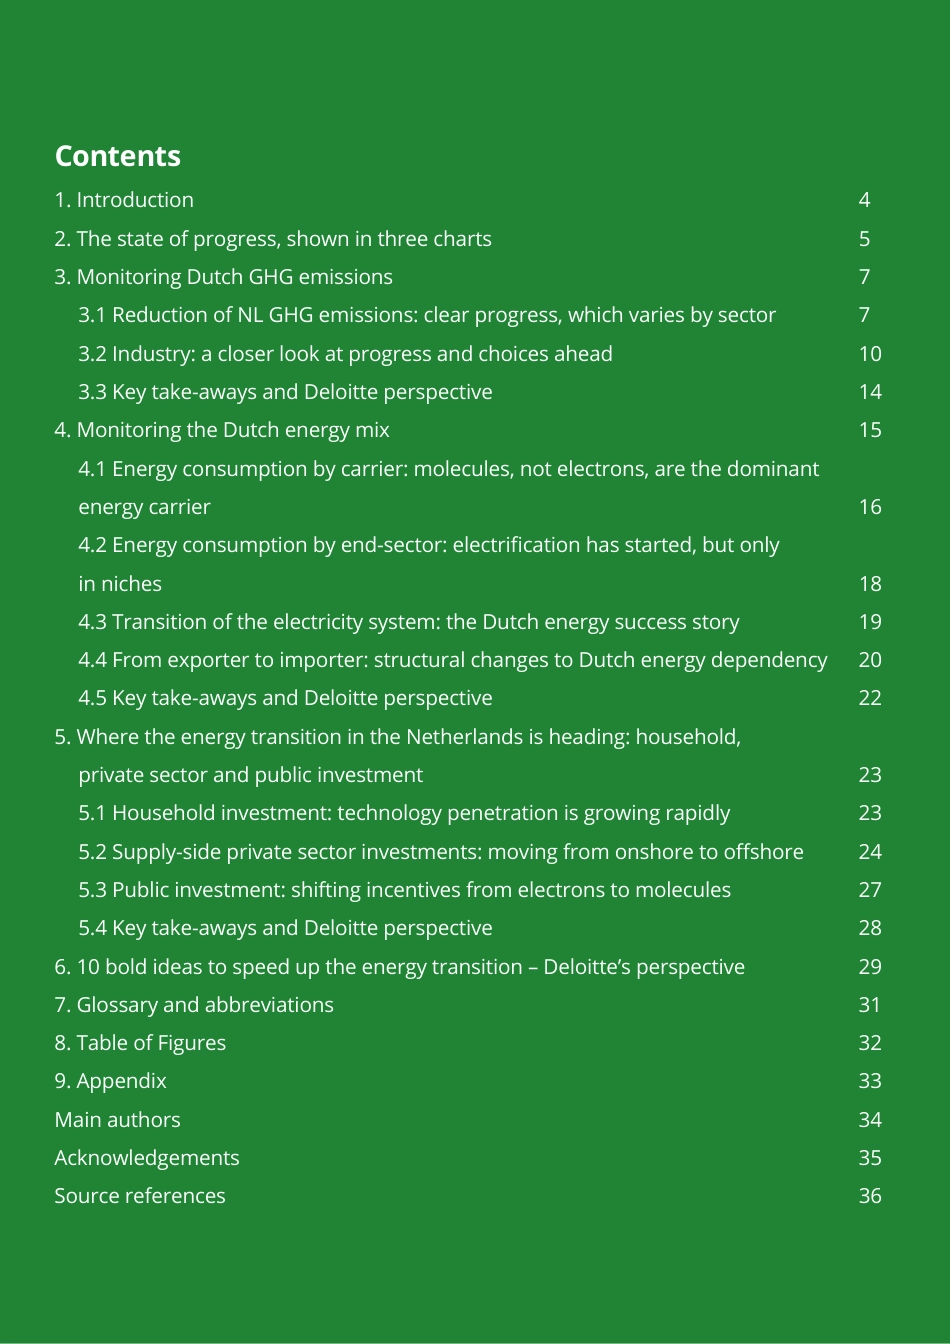
1. Introduction 4
2. The state of progress, shown in three charts 5
3. Monitoring Dutch GHG emissions 7
3.1 Reduction of NL GHG emissions: clear progress, which varies by sector 7
3.2 Industry: a closer look at progress and choices ahead 10
3.3 Key take-aways and Deloitte perspective 14
4. Monitoring the Dutch energy mix 15
4.1 Energy consumption by carrier: molecules, not electrons, are the dominant
energy carrier 16
4.2 Energy consumption by end-sector: electrication has started, but only
in niches 18
4.3 Transition of the electricity system: the Dutch energy success story 19
4.4 From exporter to importer: structural changes to Dutch energy dependency 20
4.5 Key take-aways and Deloitte perspective 22
5. Where the energy transition in the Netherlands is heading: household,
private sector and public investment 23
5.1 Household investment: technology penetration is growing rapidly 23
5.2 Supply-side private sector investments: moving from onshore to oshore 24
5.3 Public investment: shifting incentives from electrons to molecules 27
5.4 Key take-aways and Deloitte perspective 28
6. 10 bold ideas to speed up the energy transition – Deloitte’s perspective 29
7. Glossary and abbreviations 31
8. Table of Figures 32
9. Appendix 33
Main authors 34
Acknowledgements 35
Source references 36
Contents
Deloitte’sEnergyTransitionMonitorEnergytransitionatacrossroadsADeloitteNetherlandspublicationSeptember202302Deloitte'sEnergyTransitionMonitorTheenergytransitionisarguablythemostchallengingundertakingofthisgeneration.TheNetherlandshasmadegoodprogress,sofar,butthecountryhascometoacrossroads.Mostofitsprogresshascomefrompickingthelow-hangingfruit,andreducingindustrialoutput,buttoachievetheemissiongoalsfor2030andbeyond,fundamentalchoicesneedtobemadearoundthestructureoftheDutcheconomyandtheenergysystemthatenablesit.TheNetherlandshasexcellentoffshorewindpotential,along-establishedindustrialsector,andaleadingeducationalsystem,sothecountryiswell-placedtocreateaglobalblueprintforasuccessfulenergytransition.Asuccessfulenergytransitiondependsontherightdecisionsbeingmade,whichrequiretherightinformation.ThisEnergyTransitionMonitorthereforeprovidesacommonfact-base,withwhichtoassessthetransition’sprogress.However,trueprogressrequiresmorethanjustreducingemissions(becausehavewereallybeensuccessfulifwerelocateemissionstoothercountries?).Thisreportthereforeprovidesaholisticperspective,andbringstogetherstatisticaldata,stakeholderperspectives(NGOs,journalists,industryprofessionals,academicsandgovernmentofficials)andananalysisofpublicsentiment.Usingthesesources,thisreportexaminesthetransition’sprogressfrom1990to2022,towardthecountry’sstatutory(Klimaatakkoord)targetsfor2030andoverallgoalofnet-zeroemissionsby2050.Somekeyhighlights:01.Theindustrysectorhasreduceditsemissionsthemost,butthroughlowerproductionoutputandbyreducingnon-CO2greenhousegases,sotherealtransitionstillneedstostart.02.Nationalenergy-relatedemissionshavereducedby32%in2022(relativeto1990).However,thisignoresemissionsfrominternationalaviationandshipping,andimportedproducts,whichtogetherexceedthereportednationalemissions.03.15%ofenergyconsumedintheNetherlandscomesfromrenewables–mainlybiomass,butwithstronggrowthinwindandsolarsourcesforgeneratingcleanelectricity.04.Electrificationoffersthegreatestpotentialforincreasingtheuseofrenewables,butprogresshasbeenlimited.Forinstance,electricvehiclesrepresentedonly1.5%ofthemobilitysector’senergyconsumption.05.Oneinthreehouseholdsonaveragenowusesatleastonecleanenergytechnology(solarpanels,EVsorheatpumps),andtheadoptionrateisgrowingfast.06.Althoughpublicsentimentismixed,theDutchenergytransitionhasachievedsomenotablesuccesses,suchastheEU’shighestadoptionofsolarpanelsandpercapitaprovisionofEVchargingstations,and40%ofthecountry’selectricitynowbeinggeneratedfromrenewables.ThecurrentrateofprogressistooslowtomeettheDutch2030targets,sotheenergytransitionmustaccelerate,andtoughdecisionslayahead.Tohelpmakeasuccessfultransition,thefollowingapproachestothetransitionareproposed.01.DevelopthepathtogetherCombineprivateandpublicinterests,tobenefitDutchsocietyandeconomy,aswellastheglobalclimate.Inparticular,industrialemissionsshouldbeconsideredalongsidedomesticproduction,possiblyincludingatargetformanufacturingoutput.02.TakefullresponsibilityTheeffectongreenhousegasemissionsfrominternationalaviationandshippingandimportedgoodsshouldbetakenintoaccountwhendesigningandevaluatingemission-reductionpoliciesandincentives.03.TakethepublicalongPublicsupportcanbeharnessedbycelebratingthetransition’ssuccesses,andbyusingpublicpolicytosetnewbehavioralnorms,ratherthanfocusingpurelyonfinancialincentives.04.DecarbonizemolecularenergydemandAlthoughelectrificationshouldremainthemainfocus,theremainingdemandformolecularsourcesshouldbedecarbonizedmoreactively,bypromotingtheuseofcleanhydrogenandmakingoptimaluseofthelimitedbiomassresources.05.PrioritizeimpactinscalingIncentiveshaveprovedaneffectivewaytopromotethehouseholdtake-upofsomecleanenergytechnologies,andshouldnowfocusoninitiativeswheretheDutchgovernmentisleadingandwherethegreatestimpactonemissionscanbeachieved.Forinstancechangingdomesticheatingfromgastonewrenewabletechnologies,whichwillcreatethedemand,momentumandconfidencefortheprivatesectortoscaleupproduction.TheEnergyTransitionMonitorprovidesanoverviewofthestatusoftheenergytransitionandproposesboldideastoaccelerateitfurtherandcreatesastartingpointfordiscussion,allowingprofessionalsinthefieldtoworktogetherandmaketherightdecisionsforfutureprogress.ExecutiveSummary03Deloitte'sEnergyTransitionMonitor1.Introduction42.Thestateofprogress,showninthreecharts53.MonitoringDutchGHGemissions73.1ReductionofNLGHGemissions:clearprogress,whichvariesbysector73.2Industry:acloserlookatprogressandchoicesahead103.3Keytake-awaysandDeloitteperspective144.MonitoringtheDutchenergymix154.1Energyconsumptionbycarrier:molecules,notelectrons,arethedominantenergycarrier164.2Energyconsumptionbyend-sector:electrificationhasstarted,butonlyinniches184.3Transitionoftheelectricitysystem:theDutchenergysuccessstory194.4Fromexportertoimporter:structuralchangestoDutchenergydependency204.5Keytake-awaysandDeloitteperspective225.WheretheenergytransitionintheNetherlandsisheading:household,privatesectorandpublicinvestment235.1Householdinvestment:technologypenetrationisgrowingrapidly235.2Supply-sideprivatesectorinvestments:movingfromonshoretooffshore245.3Publicinvestment:shiftingincentivesfromelectronstomolecules275.4Keytake-awaysandDeloitteperspective286.10boldideastospeeduptheenergytransition–Deloitte’sperspective297.Glossaryandabbreviations318.TableofFigures329.Appendix33Mainauthors34Acknowledgements35Sourcereferences36Contents04Deloitte'sEnergyTransitionMonitorTheenergytransitionisarguablythemostchallengingundertakingofthisgeneration.Withtheexcellentoffshorewindpotential,thelong-establishedindustrialsector,andaleadingeducationsystem,theNetherlandsiswell-placedtofacethischallengeandcreateaglobalblueprintforasuccessfulenergytransition.Thecountryhasmadesubstantialprogresssofar,buttheNetherlandshascometoacrossroads.Mostofitsprogresshascomefrompickingthelow-hangingfruit,suchasefficiencymeasures,reducingindustrialoutputandmakingmoreuseofexistingtechnologies,includingsolarandwindpower.Thenextdecade,however,willrequirethecountrytomakefundamentalchoices,aroundwhethertomeetitsnetzerotargetbycurbingdemand,replacinggreydomesticproductionwithimports,ortransformingtheeconomytobecomegreen.ThesechoiceswillhaveprofoundimplicationsforthefutureoftheDutchcountry,societyandeconomy.ItwilldeterminehowtheDutchlive,createeconomicwealth,andinteractwiththeirenvironment.Moreover,abalanceneedstobefoundbetweenreducingemissions,ensuringsecurityofenergysupplyandmaintainingeconomicaffordability,whichisalsoreferredtoastheenergytrilemma.Tomaketherightchoices,industryprofessionals,academics,policy-makersandsocietyasawholeneedaclearviewandcommonfact-baseonthestatusoftheenergytransitionintheNetherlands.Butthisviewmustencompassmorethansimplymeasuringnationalemissions,becausehasthetransitionbeensuccessfulifemissionshavejustrelocated?TheEnergyTransitionMonitorprovidesacomprehensiveviewofthecurrentstateoftheenergytransitionintheNetherlandsandshowswhatliesahead,bycombiningstatisticalanalysis(e.g.,datafromCentraalBureauvoordeStatistiek(CBS),Eurostat,NederlandseEmissieautoriteit(NEa)–withstakeholdersentiment–basedon37industryinterviewsandsocialmediaanalysis.AsthisreportfocusesontheDutchenergytransition,itsscopeislimitedtotheenergy-relatedgreenhousegas(GHG)emissionsthatareemittedintheNetherlands(seeFigure1).aTheEnergyTransitionMonitorispublishedin2023,roughlyhalf-wayalongthetransitiontimescale:from1990,thecommonreferenceyear,to2050,whennetzeroemissionsneedtobeachieved.bAstheimplicationsofclimatechangebecomemorewidespreadglobally,andcountrieslookaheadto2050,thisisaveryrelevanttimetotakestockofprogresstodateanddevelopaclearviewonwhatneedstohappennext.ThenextchaptersummarizestheDutchenergytransitionintermsofthreemetrics:energy-relatedemissions,cenergymixandinvestmentincleanenergytechnology,whichareexaminedinmoredepthinthefollowingchapters.TheconclusionofthisreportpresentsDeloitte’sperspectiveontheDutchenergytransitionandthewayforward.aEmissionsfromagricultureandlanduseareoutsidethescopeofthereport,becausetheyarenotenergy-related;itisacknowledgedthattheseemissionsplayalargeroleoutsideoftheenergytransition.bEuropeanClimateLawandEUGreenDealstatethegoalofnet-zeroemissionsby2050,whiletheDutchClimateLaw(Klimaatwet)requiresa95%reductioninGHGemissionsby2050comparedto1990levels.cNon-energyemissionsareemissionsfromagricultureandland-usechange(e.g.,emissionsfromcrops,livestockandconversionoflandintoagriculturalland);thesewillbeshownbutnotanalyzedindepth–seemoredetailsinthechapter“MonitoringDutchEmissions”.Figure1:ScopeoftheEnergyTransitionMonitor(energy-relatedGHGemissionsingreen)Ifwecan’tmakeithappenintheNetherlands,wherewillwe?PersonNGORepresentativeWehavepickedthelow-hangingfruitandarenowatacrossroadsIndustryprofessionalTheenergytransitionismorethanjustaquesttoreducemegatonnesGovernmentOfficialLanduseAgricultureElectricityIndustryMobilityEnergy-relatedGHGNon-energyGHGNationalemissionsBuiltenvironment1.Introduction05Deloitte'sEnergyTransitionMonitorThestateofprogressoftheenergytransitionintheNetherlandscanbesummarizedinthreemetrics:GHGemissionsreduction,shareofrenewableenergy,andinvestmentincleantech,whichthefollowingthreechapterswillanalyzeinmoredepth.Energy-relatedGHGemissionsreductionmeasuresprogresstowardtheoverallgoalofnetzeroby2050.Energy-relatedGHGemissionshavedecreasedby32%(1990to2022).ThisrelatestotheNetherlands’legally-bindingtargettoachieveareductionof55%by2030(aspartoftheEU’s55%overalltarget).a,1Shareofrenewableenergymeasuresprogressintheenergysystemtransition.In2022,renewableenergymadeup15%oftotalfinalenergyconsumptionintheenergymix,comparedwithonly1%in1990.2Thisrelatestothe2023targetof16.7%(Energieakkoord),andtheEuropean2030targetof27%fortheNetherlands(32%fortheEUoverall).b,3,4,5InvestmentsincleantechnologyreflecttheadoptionofcleanenergytechnologiesbyDutchhouseholds.Dutchhouseholdsareinvestingatafastgrowthrateinthreecleanenergytechnologies:rooftopsolarpanels,electricvehiclesandheatpumps.Shareofrenewableenergyconsumption(NL,2022)Sourcesofenergy15%2,500PJTechnologypenetration33%40%ofhouseholds00Reductioninemissions-32%1002000300MtAverageatleast1SolarOther‘90‘22‘90‘22‘90‘221,000RenewableNaturalgasOilOtherEnergysystemOthersectorsEnergy-relatedGHGemissionsreduction(NL,2022)Averageshareofhouseholdsusingatleastonecleanenergytechnology(NL,2022)EMISSIONSENERGYMIXINVESTMENTS20%CoalErrormargin10%30%1,5005002,0002.Thestateofprogress,showninthreechartsa(1)ThetargetforthenationalemissionreductionoftheNetherlandsuntil2030includeslanduseandagriculture.(2)The55%emissionreductiongoalislaiddownintheKlimaatwet.AccordingtotheEUclimatelaw,theNetherlandshastoachieveandemissionreductionof49%.bLowerlimitoftheNationalEnergyandClimatePlan(NECP)oftheNetherlands.Theupperlimitis35%.InMarch2023theEuropeanParliamentandCouncilreachedaprovisionalagreementtoraisethetargetofrenewableenergytoatleast42.5%by2030.c(1)2022dataonemissionsfromlanduseandinternationalaviationandinternationalshippingemissionsbasedon2021data.(2)TheaverageofDutchhouseholdsthathaveinvestedincleanenergytechnologywascalculatedusingthestatisticalaveragewhichcalculatestheaverageofhouseholdsthathaveatleastoneofthethreetechnologies.Average=1–[(1–shareofhouseholdswithsolarpanels)(1–shareofhouseholdswithEVs)(1–shareofhouseholdswithheatpump)](3)Errormarginindicatestherangeofstatisticalpossibilitiesofhouseholdshavingatleastonetechnologies,giventheuptakeofthetechnologiesindividually.Figure2.ThreegraphsshowingthestatusoftheDutchenergytransition:energy-relatedGHGemissions,shareofrenewableenergyintotalfinalenergyconsumptionandinvestmentsincleantechnologybyhouseholdsinNL.c,2,9,10,11,20,2206Deloitte'sEnergyTransitionMonitorTheenergytransitionnotonlyaffectseveryone,butitsprogressdependsonsocietalsupport.ItisthereforeimportanttounderstandtheattitudeoftheDutchpopulationtowardtheenergytransition.Asaproxy,asentimentanalysiswasconducted,of10,000selectedpoststhatwerepublishedbetween2012and2022onthesocialmediaplatformformerlyknownasTwitter.aComparedwithtenyearsago,sixtimesasmanytweetsexpressednegativefeelingstowardtheenergytransition.Almosthalfoftherecenttweetsanalyzedexpresseddoubtsorconcerns,forexample,oncurrent(insufficient)pace,thefeasibility,costsanddrawbacksoftheenergytransition.Onlyatenthofthetweetsanalyzedexpressedpositiveattitudesontopicssuchascurrentprogress,thecurrentdirectionoftheNetherlands,andtheeffectivenessoftheenergytransition.Thiscontrastswithtweetsfromgovernmentofficialsandotherpolicy-makers,whosenegativesentimentsabouttheenergytransitionhavedecreasedbytwo-thirdsoverthepasttenyears.However,theenergytransitioncannothappenwithoutsocietalsupport,sopublicsentimentmustberecognized.Throughoutthetransition,affordabilityandenergysecurityfortoday’ssocietyneedstobebalancedwiththesustainabilityneedsoffuturepopulations.Call-outA.Theenergytransition–mixedfeelingsamongsttheDutchaFordetailedmethodologyofthesentimentanalysis,seeAppendix.bTheneutralsentimentsaredividedequallyoverpositiveandnegativesentiments.Figure3.Changingsentimentintweetsmentioningtheenergytransition,originatingfromthegeneralpublicandgovernmentbodiesoragencies(2012vs.2022)b,7TweetsfromGeneralpublicneutralpositivenegativeneutral20%20%40%60%TweetsfromGovernmentofficials2012202220122022ThebehaviorchangerequiredfromoursocietyrepresentsakeybarriertodecarbonizetheeconomyAcademicIt’sthebiggesttransitionofourtime,sowecan’tleaveanypeopleoutNGORepresentative07Deloitte'sEnergyTransitionMonitorBy2022,theNetherlandshasreduced32%ofitsenergy-relatednationalemissionscomparedto1990.Lookingatemissionsintheenergysystem,themobilitysectorhasmadetheleastprogress,especiallywheninternationalaviationandshippingareincluded,whileindustryhasmadegreatestprogress,andalmosthalveditstotalGHGemissions.However,theprogressachievedbyindustrydoesnotshowsignsofarealtransitionyet,andmostreductionhasbeenachievedbyreducingnon-CO2greenhousegassesandproductionoutput.Therefore,Dutchindustryfacesimportantchoicesthatmustbalancegreenerdomesticproductionwithsuitableimportpolicies,toachievetherightoutcomesfortheeconomy,society,andtheplanet.Finally,Dutchcitizensandbusinessesareindirectlyresponsibleforthesignificantemissionscausedbyimportedproducts,rawmaterialsandsemi-finishedgoods,whichareroughlyaslargeastotalnationalemissions.3.MonitoringDutchGHGemissionsaTheKlimaatwetisthetranslationoftheEUClimateLawintoDutchnationallawandhadpreviouslyatargetof49%.Basedontheeffort-sharingpolicyoftheEU,theNetherlandsdoesnothavetoachieveareductionof55%,However,theDutchCabinetunderRutteIVhasagreedtoatargetof55%for2030,withtheambitiontoreach60%.The55%targethasbeenenteredintoDutchLawbeforethecoalitionwasdissolvedandisnowlegallybindingasofbeginning2023.bIn2022theDutchCabinetincreasedthistargetintheCoalitionAgreementunderRutteIVareductionof55%ofGHGemission,withtheambitiontoreach60%by2030,whichalsoraisedtheemissiontargetspersector.However,thesetargetsarenotchangedintheKlimaatakkoord,andarenotdefinitivebysector.c2022dataonemissionsfromlanduseandinternationalaviationandinternationalshippingemissionsarebasedon2021data.Figure4:NLGHGemissions,coveringnationalemissionsandemissionsfrominternationalaviationandshipping(MtCO2-eq,1990–2022)c,8,9,10,113.1ReductionofNLGHGemissions:clearprogress,whichvariesbysectorEnergy-relatedemissionsaccountforthemajorityofDutchGHGemissions,andhavedecreasedby32%since1990,toatotalof128MtCO2-eq(0.4%ofglobalenergy-relatedemissions).However,nationalemissionsexcludeemissionsfromimportedproducts(whicharehardtoassess),andemissionsfrominternationalaviationandshipping,whichhavegrownsince1990toanadditional45MtCO2-eqin2022(seeCall-outB).Thismeansthattheoverallreductioninemissions,includinginternationalaviationandshipping,isonly24%.ThisreductionrelatestothebindingtargetforDutchnationalemissions,setbytheDutchnationalclimatelaw(Klimaatwet),awhichmeansthecountryislegallyobligedtoachievea55%reductioninnationalGHGemissions(i.e.,excludinginternationalaviationandshipping,includingagricultureandlanduse)by2030,comparedto1990levels.bBasedon2022emissionlevels,theNetherlandsmustthereforemakeafurtherreductionof54MtCO2-eqinthenextsevenyears.However,emissionshavereducedbyanaverageofonly21Mtperdecadesince1990,soamajoraccelerationofemissionsreductionisneedediftheNetherlandsistoachieveits2030goals.Dutchenergy-relatedGHGemissions‘90‘22200128GHGemissionsintheNetherlands(MtCO2-eq)Dutchenergy-relatedGHGemissions,includinginternationalaviationandshipping100173LanduseAgricultureEnergysystemAviationShippingTheenergysystemisthedominantsourceofemissions300MtCO2-eq(-32%)(-24%)008Deloitte'sEnergyTransitionMonitorDutchGHGemissionsincludenationalemissions–emittedintheNetherlands,asaccountedforbytheCBS–andnon-nationalemissions,whichrelatetoDutchactivities,butareemittedoutsidetheNetherlands.•NationalGHGemissionsincludeenergy-relatedandnon-energyemissions(e.g.,agricultureandlanduse).•Nationalenergy-relatedGHGemissionsaresplitintofourmainsectors,asdefinedbytheintergovernmentalpanelonclimatechange(IPCC).•Non-nationalemissionsincludeemissionsfrominternationalaviationandshipping,andimportedproducts.•Internationalaviationandshippingemissionsdonotcounttowardofficialnationalemissionsfigures.However,theyarenotedherebecausetheydorelatetoDutcheconomicandsocialactivity.In2022,theemissionsfrominternationalaviationandshippingwere45MtCO2-eq,whichwouldmakeitthesectorwiththesecond-highestemissions.InternationalaviationbunkeringemissionscanreasonablybeattributedtoDutchactivities,asplanestypicallytakeonfuelatstopsontheirroute,soemissionsfromfuelingintheNetherlandshavealogicalconnectiontothecountry.Internationalshippingbunkeringemissionsaremoredifficulttoassign:whilesomebunkeringisaconsequenceofDutchtradeactivity,theNetherlands’locationandthePortofRotterdam’sinfrastructureallowmanycargovesselstobunkeroff-route,sonotallbunkeringemissionsarisingintheNetherlandscanbeattributedtoDutchactivities.•Emissionsrelatedtoimportedgoodsandservices(includingelectricity)areexcludedfromofficialnationalaccountsofemissionsbecausetheyarenotreleasedwithinnationalborders.However,thereisacasetobemadethatDutchbusinessesandcitizensaredirectlyresponsiblefortheseemissionsthroughconsumptionofgoodsproducedabroadandimportofrawmaterialsandsemi-finishedgoods:theseemissionscontributetothewelfareofDutchsociety,whileimpactingtheglobalclimate.Togiveanindicationofthesize,CO2emissions(excludingnon-CO2gases)fromimportedgoodsareroughlyaslarge(168MtCO2)asallemissionsmadeonDutchsoil(nationalemissions).Forthepurposesofconsistencywithstandardaccountingpractice,emissionsfromimportsarebeyondthescopeofthisreport.bAdditionally,includingimportedgoodsintonationalemissionswouldleadtodoubleaccountingofemissionsamongstcountries.Call-outB.Nationalversusnon-nationalenergy-relatedGHGemissionsoftheNetherlandsaNote(1)thatduetoroundingenergy-relatedemissionsaddupto129and(2)emissionsofimportedproductsisextrapolatedfrom2018databytakingtheaverageofthepreviousfiveyears.bStandardaccountingpracticeherereferstothereportingrequirementsoftheIPCC,whichmeasuresCO2-eqemissionsthatareemittedduringactivitiesthathappenwithinthenationalboards,includingemissionsrelatedtoexportproducts.Theemissionfiguresarebrokendownintosixclimatesectors(Industry,Electricity,Mobility,Builtenvironment,Agriculture&Landuse).Figure5.ScopeoftheEnergyTransitionMonitora,8,12Landuse(24Mt)Agriculture(3Mt)Int.aviation&shipping(45Mt)EnergyrelatedGHG(128Mt)Non-energyGHG(27Mt)Nationalemissions(155Mt)Non-nationalemissions(213Mt)Products(168Mt)Totalemissions(~368Mt)Industry(48Mt)Mobility(30Mt)Builtenvironment(20Mt)Electricity(31Mt)TotalDutchemissions58%42%09Deloitte'sEnergyTransitionMonitorTheKlimaatakkoordispartofDutchclimatepolicy.ItisanagreementbetweenmanyorganizationsandcompaniesintheNetherlandstocombatgreenhousegasemissions.Itcategorizesnationalemissionsintosixsectors,eachwithitsownemissionsreductiontargets:builtenvironment,mobility,industry,electricity,agriculture,andlanduse.Thefirstfoursectorsrepresentthenationalenergysystem.In2022theserepresented128MtCO2-eqemissions(-32%since1990),meaningtheNetherlandsneedstoreduce36Mt(-28%)fromthe2022emissionleveltoreachthe2030target.Ofthesefoursectors,industryhasprogressedmostsince1990,inbothabsoluteandrelativeterms,witha39MtCO2-eqreduction(-44%relativeto1990).Thismeansagapof16%relativeto2022emissionsneedstobeclosedby2030.ItshouldbenotedthatsomeindustrialreductionsarosefromthespecialcircumstancesthattheNetherlandsexperiencedlastyear.Forinstance,thewarinUkrainecausedgassupplyshocksandsubsequenthighgasprices,whichledsomecompaniestohaltproduction,andthereforereducetheiremissions.Thebuiltenvironmenthasachieveda10MtCO2-eqreduction(-35%relativeto1990).Thismeansagapof28%relativeto2022emissionsstillneedstobeclosedby2030.Thereductionhasbeendrivenmainlybyefficiencymeasures,extensionofheatnetworksandtheinitialadoptionofheatpumps,whichreduceddependencyonnaturalgas.Therelativelyhighpriceofgasinrecentyearsalsohas(involuntarily)reducedconsumptionsubstantially(-15%),andthusemissions.13Electricityhasmadesimilarprogress,andreduced9MtCO2-eq(-22%relativeto1990).Thismeansagapof26%relativeto2022emissionsstillneedstobecloseduntil2030.Thebuiltenvironmentandelectricitythereforestillhavetomakeroughlyhalftheirtargetedreductionsinthenextsevenyears.Surprisingly,themobilitysectorhasreducedjust3MtCO2-eq(-11%relativeto1990).Thismeansagapof13%relativeto2022emissionsstillneedstobecloseduntil2030.Thisis37%ofitstotaltargetedreduction.Giventheincreasedadoptionandhighpublicvisibilityofelectricvehicles(in202224%ofcarsaleswerezero-emissioncars),andloweraverageCO2emissionsfornewpassengerscars(since2000CO2emissionsdecreasedfrom172gCO2/kmto108gCO2/kmin2020)thisslowprogressseemsunexpected.Itisclearthattheenergytransitioninthemobilitysectormustinvolvemuchmorethansimplyelectriccarsontheroad.aTargetsarebasedontheKlimaatakkoordgoalthatsetsareductionof49%inemissionscomparedtothe1990emissionlevel.Thetotalemissiongoalfortheenergysystemin2030isthus92MtCO2-eq.ItisnotedthattherecentincreaseofthetargetsbythecoalitionunderRutteIVsetsareductiontargetof1MtCO2-eqmoreinbuiltenvironment,industryandmobilitysectoremissionsand14Mtmoreforelectricity.However,thisreportfocusesontheKlimaatakkoordgoalspersectorasthesewereagreeduponanddevelopedbybusinessesandotherstakeholdersFigure6.DutchenergyrelatedGHGemissionsbysectorandsub-sector,showingcurrentandtargetemissions(MtCO2-eq,1990–2022)a,15Energysystememissionsdecreasedby32%19902022Energysystem128MtGHGemissions(MtCO2-eq)-32%gaptoclose:28%2030targetIndustryhasreducedemissionsalmostbyhalfGHGemissionsbysector(MtCO2-eq)ElectricityBuiltenvironment‘90‘22IndustryMobility100500‘302030target13%28%26%‘90‘22‘30‘90‘22‘30‘90‘22‘30-44%-11%-22%-35%gaptoclose:16%10Deloitte'sEnergyTransitionMonitor3.2Industry:acloserlookatprogressandchoicesaheadIndustrywasthelargestemitterinabsoluteterms(seeFigure6),buthasalsomadethegreatestreductions.aThissectionlooksmorecloselyatwherethesereductionshavebeenachieved,andhowtheDutchindustrialsectorcanmakefurtherprogresstowarditstarget.TypesofGHGAlthoughthesectoralmosthalveditstotalGHGemissions,thereductioncamemostlyfromreducingnon-CO2GHGemissions,suchasmethane(CH4),nitrousoxide(N2O)andF-gasessuchastetrafluoromethane(CF4)Thesenon-CO2emissionshavereducedbyalmost80%,from33MtCO2-eqin1990to7Mtin2022,partlythroughefficiencymeasures,suchastacklingflaringandleakage.However,relativelylittleprogresshasbeenmadeonreducingCO2,withonlya25%reductionsince1990,from54Mtto42Mt.IndustrialactivitiesWithinindustry,thevastmajority(85%)ofGHGemissionsarosefrommanufacturing–particularlyfoursub-sectorsinwhichenergyisfundamentalforproductionprocesses:chemicals,cokeandpetroleumrefining,basemetalsprocessing,andnon-metallicmineralsprocessing.Chemicalsproducedthehighestemissions,representingalmosthalfofthemanufacturingtotal.aIndustrycontainsManufacturing,CokeandPetroleum,BaseMetals,ChemicalsandNon-metallicMinerals,aseeFigure9.Figure7:NLGHGemissionsfromindustryandothersectorsbytypeofgas(MtCO2-eq,1990–2022)8,9,16TherealtransitionstillneedstostartNGORepresentative1tCF4=6,630tCO21tN20=265tCO21tCH4=28tCO21tonneequals...‘90‘2287MtCO2-eq48MtCO2-eq-39MtCH4F-gassesN2O5442‘90‘22103MtCO2-eq80MtCO2-eq-23MtCO210178Non-industryIndustryCH4N2OCO2CO2CO2Reductioncamefromnon-CO2GHGemissionsGHGemissionsfromindustryandothersectors(MtCO2-eq)11Deloitte'sEnergyTransitionMonitorAlthoughindustryhasmadegoodprogressinreducingitsemissions,thishasbeenmainlyaconsequenceofadeclineinproductionoutput,probablycausedbychangesinlocalandglobaleconomiessince2000,suchasdecliningdemandvolumesandproductionshiftstolower-costlocationsoutsidetheNetherlands.Figure9showsthattotalmanufacturingemissionsintheNetherlandshavedecreasedby30%since2000,bwhileproductionoutputdecreasedbyonly25%overthesameperiod.cThisimpliesatrendofreducingcarbonintensity,witha7%improvementby2022.dCarbonintensitymeasuresemissionsperunitofactivity,andthuslinksenvironmentalandeconomicperformance.Areductionincarbonintensitythereforemeansthatemissionsarereducingmorethanproductionlevels–typicallybyadoptingtechnologiesthatdeliverthesameoutputwithloweremissions.Ofthefourmost-pollutingmanufacturingsegments,onlynon-metallicmineralshasreduceditscarbonintensityinthelastcoupleofyears.aSmalldiscrepancyinemissionsdataduetodifferenceinmethodologies–IPCCversusNACERev.2;NACEisastatisticalclassificationofeconomicactivitiesthatiscommonlyusedacrosstheEU.ItsdifferentsegmentsaccountforemissionsbyNLcitizenswhereasIPCCaccountsforemissionsinNL.RelevantNACEsegmentsherereportedaredefinedwiththefollowingactivities:Manufactureofcokeandrefinedpetroleumproducts:Manufactureofcokeovenproducts–Manufactureofrefinedpetroleumproductsandfossilfuelproducts.Manufactureofchemicalsandchemicalproducts:Manufactureofbasicchemicals,fertilizersandnitrogencompounds,plasticsandsyntheticrubberinprimaryforms–Manufactureofpesticides,disinfectantsandotheragrochemicalproducts–Manufactureofpaints,varnishesandsimilarcoatings,printinginkandmastics–Manufactureofsoapanddetergents,cleaningandpolishingpreparations–Manufactureofotherchemicalproducts–Manufactureofliquidbiofuels–Manufactureofman-madefibers.Manufactureofothernon-metallicmineralproducts:Manufactureofglassandglassproducts–Manufactureofrefractoryproducts–Manufactureofclaybuildingmaterials–Manufactureofcement,limeandplaster-Cutting,shapingandfinishingofstone–Manufactureofabrasiveproductsandnon-metallicmineralproductsN.E.C.Manufactureofbasicmetals:Manufactureofbasicironandsteelandofferro-alloys–Manufactureoftubes,pipes,hollowprofilesandrelatedfittings,ofsteel–Manufactureofotherproductsoffirstprocessingofsteel–Manufactureofbasicpreciousandothernon-ferrousmetals–Castingofmetals.b2000isusedasthebaselinereferenceyear,ratherthan1990,asthisistheearliestyearforwhichthisdatabreakdownisavailable.cProductionoutputismeasuredastheshareofGDPandadjustedforprice.dCarbonintensityimprovedby5%whileoutputdecreasedby25%,implyinganetimprovementincarbonefficiencyof5%(75/100)=6.7%.e2022emissionsdataextrapolatedduetoavailability:Manufacturingemissionsfromindustryemissions2021–2022(Manufacturingemissionswere85%oftotalindustryemissions)–sub-sectoremissiondataextrapolatedfromemissionsoftop-20emitters(non-electricityandheat)in2022.No2022emissionsdataforNon-metallicmineralsasnotop-20emitterbelongstothesub-sector.Figure8.BreakdownofNLGHGemissionsinmanufacturingsegments(MtCO2-eq,2022)a,8,9,10,11,17Figure9.Developmentofeconomicoutput(volume)andNLGHGemissions(%,indexyear2000,2000–2022)e,17,18,19,23Manufacturingaccountsfor85%ofindustryemissionsGHGemissionsper(sub-)sector(%,NL,2022)NLenergy-relatedGHGemissionsIndustryemissionsManufacturingemissions38%Chemicals85%48%IndustryManufacturing‘00‘221007570Twoforcesatplay:emissionreductionandproductionoutputDevelopmentofeconomicoutputandGHGemissions(indexed)EmissionsOutput‘00‘22‘00‘22‘00‘22‘00‘22CokeandpetroleumBasemetalsNon-metallicmineralsChemicals100100100100347069795200002022forecastoutputdeclinecarbonintensitydeclineTwoforcesatplay:emissionreductionandproductionoutputDevelopmentofeconomicoutputandGHG-emissions(indexed)EmissionsOutput12Deloitte'sEnergyTransitionMonitorTypesofcompanyTounderstandhowdifferentcompanytypeshavecontributedtothereductioninemissions,industrialemitterscanbedividedintotwobroadcategories,accordingtowhetherornottheyparticipateintheEU’sEmissionTradingSystem(ETS),whichismandatoryforthelargestemittersintheNetherlands(intheindustryandelectricitysector).WithintheETSparticipants,the20highest-emittingcompaniesaretypicallyassessedintheNetherlandsasaseparategroup.FigureshowsasignificantdifferenceinGHGemissionsreductionsbetweenthesethreegroups.SincetheETScameintoeffectin2013,thetop20emittershavemadea10%(3MtCO2-eq)reduction,andotherETSparticipants15%(7MtCO2-eq),whilenon-ETScompanieshavereducedemissionsby21%(35MtCO2-eq).TheelectricityproducersthatarepartoftheETSdecreasedtheiremissionsby28%(12MtCO2-eq)since2013.Thelowerreductionbythetop20groupismostlikelybecauseproductionprocessesinheavyindustryareharder(orimpossible)todecarbonizeand/orelectrifywithoutlargeinvestments.Toreducethesebarriers,thegovernmenthasstartedbilateraltalkswithcompaniesinthetop20emitters,tounderstandhowprogressonreducingtheiremissionscanbeimproved.OnanEUlevel,thetighteningoftheETSmeansthatcompanieswithintheETStradingschememustbeemission-freeby2040.Secondly,thenextiterationoftheRenewablesEnergyDirective(REDIII)willalsohaveasignificantimpactonindustryemissions.Whenthedirectivecomesintoforce,industrywillhavetoincreasetherenewablesshareofitstotalenergyconsumptionmixby1.6%annuallyuntil2030.4Thiswillputfurtherpressureontheindustrysectortofindwaysofreducingitsemissions.aTop20emittersbasedongovernmentshortlistof‘maatwerkbedrijven’;foradditionalbilateralagreementsonreduction,excludingwasteprocessingorganizations,seeKamerbriefovervoortgangmaatwerkafspraken;fouroftop20emittersareinstallationsfromtheChemelotIndustrialSite,howeverallemissionsfromthesiteareincludedduetolackofgranulardata;powercompanies(electricitygeneration)areexcludedasthesefallundertheelectricitysectorinsteadofindustryFigure10:Emissionreduction,ETSversusnon-ETS,excl.electricitysector(MtCO2-eq,2013–2022)a,8,9,10,11,20,21ThelargestindustrialplayersarestillwaitingfortherightsetofregulationsandsupportmechanismstostarttherealtransitionIndustryprofessionalEmissionsreductionETSvs.non-ETS(MtCO2-eq)Non-ETS(133)RestofETS(39)Top20ETSemitters(32)20221Mtreductionsince2013CompaniesthatarenotcoveredbyETShavemadegreateremissionsreduction(35,-21%)(7,-15%)(3,-10%)13Deloitte'sEnergyTransitionMonitorThechallengesfortheindustrysectoraresignificant,andtwomainchoicesunderpinhowitcouldmeetitstargets,whichwillinfluencehowthesectorlooksinthefuture,anditsroleintheDutcheconomy.ThesechoicesareshapedbytwomaindirectionsopentotheNetherlands:tocreateagreenindustrialbase,andproduceasimilarrangeofgoodsdomesticallyatthesamescale;ortoreduceindustrialproduction,importtheproductsthatareneededandreplaceindustrialeconomicactivitywithlesscarbon-intensivegoodsorservices.OfcoursethesechoicesareguidedbyDutchandEuropeanlegislation,suchastheEuropeanGreenDeal,ETS,EnergyTaxDirective,andCarbonBorderAdjustmentMechanism(CBAM).Choice1:Whatistherightbalancebetweeninvestingintheenergytransitioninindustry,whilemaintainingcompetitivenessathomeandabroad?AgreendomesticindustrialbasecouldbenefittheNetherlands,throughself-sufficiency,longer-termcompetitiveadvantage,(blue-collar)jobsecurity,andcontroloverindustrialemissions.Inaddition,thecountry’soffshorewindresourceswouldbeapositivecontributorinthistransition.Suchanindustrycouldalsoproducethecleanenergytechnologiesforexport.However,thischoiceisnotwithoutimplications:althoughgoodsmanufacturedandusedwithinthiscountrycouldhavesimilarpricestotoday,Dutchexporttrademightbehamperediftheglobalmarketstillofferscheaper(andmorepolluting)alternatives.Choice2:Whatistherightbalancebetweentheaffordabilityandemissionsimpactofimportedproducts?TheoptiontoreduceemissionsbyreducingdomesticindustrialoutputandmeetingdomesticneedsthroughimportscouldbeanalternativetotransitioningtheDutchindustrialbase.Tomakesuchanapproacheffective,controlswouldbeneededthatrequireimportedgoodstomeetacarbonintensitystandard,whichwouldeventuallyreducetozero(alignedtotheEU’sCBAMinitiative).Suchstandardscouldbecomplementedbybilateralagreementswiththeexportingcountries,tohelpthemcreategreenproductsthatwouldabidethesestandards.Withsuchanapproach,importswouldhelptheNetherlandstakeabigsteptowarditsnationalemissionstargets,whilealsomakingapositiveimpactonglobalemissions.Withoutsuchcontrols,theclimatebenefitwouldbeminimal,asproductionwouldtakeplaceoutsideoftheNetherlandswithnoguaranteeoflowerglobalemissions.Thischoicealsohasimplicationsforthecountry’scompetitivenessandeconomicsecurity:industry’scontributiontotheDutcheconomywouldreducesignificantly,decliningindustrialactivitycouldleadtofewerjobs,whilebusinessandindividualcustomerscouldfacehighercostsfor(compliant)importedgoods.Neweconomicactivitywouldalsobeneeded,toreplaceindustrialproduction,preventalossofGDPandavoidapoorerstandardoflivingintheNetherlands.Takentogether,thegreatestpotentialforemissionsreductionbothathomeandabroadwillberealizedifDutchindustrymakesafullenergytransitiontoagreenbase,andanyimportedproductsareheldtoincreasinglystrictcarbonintensitystandards.Thecarbonintensityofdomesticindustrycouldbereducedbymakingproductionprocessesmoreenergy-efficient,orreplacingfossilfuelswithrenewableelectricityorcleanhydrogen.However,transformingsomeheavyindustrialprocessestousecleanerenergywillrequiretechnologyandinfrastructure(e.g.,forrenewableelectricity)atascalethatisnotyetfeasiblewithcurrentdevelopments.Chartingthiscoursewillrequiremuchdeepercollaborationbetweensociety,industryandgovernment,tobalanceeconomicsupport(tokeepexportseconomicallycompetitive)andnon-economicfactorssuchassecurityofsupply,jobs,controlandresilience.Onewaytoachievethisbalancewouldbetoformalizegreenindustrialproductionambitionsaspolicy,alongsideemissionsreductiontargets,toincentivizesupportforreducingindustrialemissions.Call-outC.ChoicesforDutchindustrytoreduceemissionsFigure11.EmissionsreductionchoicesforNLindustryNexttoemissionreductiontargets,weneedambitionsofgreenindustrialproductionintheNetherlandsAcademicReportsarenotjuststudiesanymore,butthebasisofrealfundamentalchoicesthatrequirelargecapitalinvestmentsJournalistEmissionreductioninIndustryTransitionDutchIndustrytogreenReduceOutputImportgreenproductsImportgreyproducts14Deloitte'sEnergyTransitionMonitor3.3Keytake-awaysandDeloitteperspectiveDevelopthepathtogetherAlthoughapartoftheroutetonetzerohasbeenachieved,reducingthelast68%ofDutchnationalemissionsandreachingthetargetofnetzeroby2050willbemorechallenging.Fundamentalchangesinthecomingyears,especiallyinindustry,willbecrucialandrequireclosemonitoringandconversationstosteerdecision-makingintherightdirection.ThedecisionsthatmustbemadebytheDutchindustrysector–whethertostayintheNetherlandsormoveabroad–willalsodependonwhatactiontheNetherlandstakestokeepandgreenifydomesticindustry.IftheaimistocreateagreenindustryintheNetherlands,thepublicandprivatesectorsneedtosupportitsdevelopmentthroughbilateraltradeagreements,importstandardsandthenecessaryinfrastructureinvestments.TakefullresponsibilityTakingresponsibilitymeans,firstly,lookingbeyondreducingmegatonnesofGHGs.SincetheNetherlandsisresponsibleforonly0.4%ofglobalemissions,thegreatestpotentialimpactofasuccessfultransitionwillbetoshowtheworldhowitcanbedone:transitiontheindustry,developthetechnology,designtheoptimalpolicy,andequiptalentwiththerightsetofcapabilities.ThefactthatmostoftheemissionsthattheNetherlandshavearesponsibilityforactuallytakeplaceoutsideoftheNetherlands,onlyemphasizesthispoint.Secondly,iftheDutchenergytransitionistobeeffectiveinreducingglobalemissions,itshouldhaveaclearpictureofalltheemissionsthatcanbeattributedtotheNetherlands,andtakeresponsibilityforthem.Therefore,theeffectonglobalgreenhousegasemissionsfrominternationalaviationandshippingandimportedgoodsshouldbetakenintoaccountwhendesigningandevaluatingnationalemissionreductionpoliciesandincentives.TakethepublicalongGiventhatnegativepublicsentimentsabouttheenergytransitionhaveincreasedoverthepasttenyears,andtheenergytransitioncannothappenwithoutbroadsocietalsupport,itisimportanttotakethepublicalongonthisjourney.Therefore,societalsupportfortheenergytransitionneedstobestimulatedbycelebratingitssuccesses.Thiscouldbeachievedthrough,forexample,grassrootscampaignstobuildexcitementforcleanenergy,andpolicyinitiativesthatpromotenewbehavioralnorms(ratherthanfinancialincentives),whilesupportingthemostvulnerablehouseholdsthroughtheirtransition.15Deloitte'sEnergyTransitionMonitorIn2022,about15%ofenergyconsumedintheNetherlandscamefromrenewablesources.Since83%ofnationalGHGemissionsoriginatefromtheDutchenergysystem,ashiftingitscompositionwillhaveamajorimpactonthecountry’soverallabilitytoreduceitsemissionsandmeetitsnet-zerotargets.Historically,theavailabilityofnaturalgasintheNetherlandsmadeitthedominantenergysource,anditstillrepresented36%oftotalprimaryenergyusein2022(seeFigure13).Thecountry’sdeep-seaharborshavealsomadeDutchportsanidealplaceforlandingcrudeoilforEuropefromacrosstheworld.Withsixlargerefineries,theNetherlandsisalsoalargeconsumer/refinerofoil,usedmainlybythemobilitysectorintheformoftransportfuelssuchaskeroseneandgasoline.TheDutchenergysystemisincreasinglyincludingnewsources,suchasbiomass,solar,wind,geothermalandambientenergy.bMostoftheserenewablesourcesareusedintheelectricitygenerationsector,butsome–suchasgeothermalandsomebiomassenergy–arealsouseddirectlybyothersectors.Historically,biomasshasbeenthedominantrenewablesourceintheNetherlands,whichmadedifferentchoicesorlacksthealternativeenergysourcesavailableinothercountries,suchashydro(Norway)ornuclear(France).However,otherrenewablesources–suchasNorthSeawindpower–aregainingtraction,anditisexpectedthattheNetherlandswillcometorelyonabroadermixofprimaryenergysourcesandcarriersinthefuture.ThreemaindecarbonizationtrendscanbeobservedintheDutchenergysystem.Firstly,electricityisbecomingcleaner,throughtheadoptionofrenewablesources.Secondly,moreenergyconsumptionisbecomingelectrifiedalthoughcurrentlyonlyinniches(e.g.,electricpersonalroadmobility,electrichomeheating),andthereforereducingthedependenceonoilproductsandnaturalgasforusessuchashomeheatingandmobility.Thirdly,itisexpectedthatsectorsunabletorunonelectricity(e.g.,steelmaking)willbepoweredbyrenewablemolecules,suchasbiofuels,biogasorhydrogen.Eventherenewablefuelscurrentlymadefrombiomasswillincreasinglybeproducedsyntheticallyusing(renewable)electricity.aExcludingnon-nationalactivitiesofinternationalaviationandshipping,whicharenotshowninthischapter.bEnergyretrievedfromambientairthroughheatpumpsinstalledinresidentialhouses.c(1)Tocalculatetheshareofrenewableenergy,inlinewithEuropeanagreements,thegrossfinalenergyconsumptionisused.Thisisconsumptionofenergybyend-usesectors(industry,households,services,agricultureandtransport)forenergeticapplications.Thisthereforeexcludesusefornon-energyapplications.TheDutchenergysystemisundergoingfundamentalchanges.Asof2022,renewablesrepresenteda15%shareoftotalenergyconsumption.Biomassremainedthemainsourceofrenewableenergy,butwindandsolararegrowingrapidly.Historically,energyconsumptionreliedonmolecularsources(coal,oilandgas),butthisshareisdecreasing.TheDutchelectricitysystemisthegreatestsuccessintheenergytransition,sofar,witha40%shareofelectricitynowcomingfromrenewables.However,integratingrenewablesmustgohandinhandwithelectrifyingmoreoftheenergysystem,whichhasstarted,butonlyinniches.Inthemidstofthesedevelopments,theNetherlandsisalsochangingstructurally,fromagasexportingcountrytoannetimporter.Figure12.Finalenergyconsumptionbycarrier(PJ,NL1990-2022)c,2,7,20,222,500PJ0‘90‘221,0001,5005002,000Shareofrenewableenergyincreasedto15%Finalenergyconsumptionbycarrier(PJ,NL,2022)OilCoalNaturalgasRenewableOther4.MonitoringtheDutchenergymix16Deloitte'sEnergyTransitionMonitorFigure13illustratesthecurrentDutchenergysystem,bythreeelements:totalprimaryenergy,totalfinalenergyconsumptionbycarrier,andtotalfinalenergyconsumptionbyend-sector.Thesystemstillreliesheavilyonfossilfuels(oil,naturalgasandcoal),for84%ofprimaryenergy.Lookingatwherethisenergyendsup,mostofthefinalenergyconsumptioniswithinIndustry(around40%).Thefigurealsoshowswherelossesariseintheenergysystemwhentheenergyoutputofacarrierislessthanitsinput.Theselossesoccurbecauseenergyisusedtorefinefuels,andproduceanddistributeelectricity,sototalfinalenergyconsumptionislessthanthetotalprimaryenergyfedintothesystem.Thelargestlossesareincurredinfossil-basedelectricityproduction.aNotethattheenergy-relateddiscussioninthisreportexcludesnon-energyusesofoil,gasandcoal,suchasplasticproductionsincethoseproductsarenotemittingGHGduringtheirend-use.b4.1Energyconsumptionbycarrier:molecules,notelectrons,arethedominantenergycarrierPublicdiscussionoftheDutchenergysystemhasfocusedheavilyonelectricity,includingphoto-voltaic(PV)solar,windenergy,electricvehicles(EVs)andheatpumps.Suchtechnologiesare(orarelikelytobecome)scalableandcommercially-available,soelectrificationprovidesoneofthemostimportantleversforreducingemissions,anditsshareoftotalfinalenergyconsumptionhasalreadygrowntofrom14%in1990to23%today(~65%increase)asshowninFigure14.However,electricityrepresentedonly23%ofDutchfinalenergyconsumptionin2022,andheat9%.d68%ofthefinalenergyconsumptionintheNetherlandsin2022wasconsumedinotherforms(e.g.,gasoline,diesel).Thissharehasshownalimiteddeclineoverrecentdecades(from79%in1990),whichwasdrivenbyadvancesinelectrificationsuchasEVsorheatpumps.Primarily,thedeclinehasbeenslowbecauseindustrialprocesses–suchaschemicalcracking,industrialheat,orsecondarysteelmaking–stillneedtobeelectrifiedandrequirelargeinvestments.aThisispartlyduetodifferenceinthestatisticalguidelinesofrenewableelectricityproductionandfossilelectricityproduction.SeeKraanetal.Theinfluenceoftheenergytransitiononthesignificanceofkeyenergymetrics.bEnergyusedformanufacturingplasticsandfertilizersisaccountedintheindustrysector,whiletheuseoffuelasfeedstockisexcludedasitdoesnotresultinanyenergyusenoremissions(exceptinthecaseofwasteincineration,whichisaccountedforinthepreviouschapteronemissions).cImportofelectricityisnotshown;“Other”inTPEconsistmostlyofwasteofnon-biogenicorigin(e.g.,plastics);foralistofdefinitions,seehttps://www.cbs.nl/en-gb/our-services/methods/definitions.dHeatintheNetherlandsispartlydistributedviadistrictheatingnetwork.Figure13.FlowofenergysourcesintheNLenergysystem(2022),fromTotalPrimaryEnergy(TPE)toTotalFinalConsumption(TFC)bycarrierandbyend-userc,7,11oilnaturalgascoalbiomassothersolarwindhydroambientgeothermalindustrybuiltenvironmenttransportTheenergysystemisstillreliantoffossilfuelsTotalprimaryenergyTotalfinalconsumptionbycarrierTotalfinalconsumptionbyendusersnon-energyuseDutchenergysystem(PJ,2022)nuclearoilproductselectricity&heatgasproductscoalbiomassambientgeothermalwhitespacesindicatelosses17Deloitte'sEnergyTransitionMonitorAlsonotableisthedeclineintotalenergyconsumption,whichhasdecreasedby9%since1990,despite18%populationgrowthand90%increaseinGDPinthesameperiod.a,23,24,25Thisisduetoseveralfactors:advancesinenergyefficiency,suchashomeinsulation,electrificationinlightindustrialsectors,combinedheatandpower,highenergypricesandinflation,anddecliningindustrialproductioninrecentyears,whichindicatesastructuralshiftfromaproductiontoaservice-basedeconomy.Thedirectconsumptionofbiomass(e.g.,woodstoves,biofuels,biogas)andotherrenewableenergyinnon-electricityform,e.g.,geothermal,ambientenergy,solarheathasincreasedfour-foldinthepast32years,from1%to4%.Thisdirectconsumptionexcludestheuseofbiomassfortheproductionofelectricityandheat(seenextparagraph).Biomass:AcloserlookatthedominantcarrieranditsfutureoutlookFigure15showsthatbiomassaccountsforthelargestshare(40%)ofrenewableenergyconsumption,followedbywind(28%)andsolar(22%).bWithinbiomass,thedominantformissolidbiomass,usedinhouseholdfireplaces,decentralizedelectricityandheatproduction,(partof)wasteincineration,andforco-firingpowerstations.Theothertwobiomasssourcesarebiofuels(biogasolineandbiodieselblendedintotraditionalfuels);andbiogas(mostlycreatedfromfermentingmanure,sewage,landfillsandothervegetablewaste),whichisblendedintothegassupplygridorco-firedingasturbinestogenerateelectricity.caFigureforGDPgrowthbetween1990–2022,netofinflation.bBiomassqualifiesasarenewableenergysource,becauseithasashortcarboncycle,whichmeansthatthecarbonthatisemittedbyburningwoodfromtreesorvegetablewastewasremovedfromtheatmosphereduringitsgrowthviaphotosynthesis.Therefore,GHGemissionsfrombiomassarenotaffectingemissionsinthelong-run.cBiofuelsincludehydrotreatedvegetableoil(HVO),hydroprocessedestersandfattyacids(HEFA)andfattyacidmethylesters(FAME).dWhenincludingenergyconsumptionbytheenergysector(194PJ)anddistributionlosses(26PJ),thetotalenergyconsumptionin2022amountsto~1,850PJ.HeatisconsumedintheformofhotwaterorsteameOnlyrenewablebiomassshowed–asperlatestsustainabilitycriteriaenteredintoforceforcertaininstallationsofsolidandgaseousbiomass(e.g.,thoseforsmallerboilersannouncedintheDutchClimateAgreementasof2022).Figure14.TotalFinalConsumptionbycarrier,excl.non-energyuseandlossessuchasgenerationanddistributionlosses(PJ,1990–2022)d,11Figure15.Consumptionofrenewableenergybyenergysourcee,7,11Shareofelectricityconsumptionincreasedto23%Energyconsumptionbycarrier(PJ,NL,2022)NaturalgasElectricityHeatOilproductsElectronsNon-electrons‘90‘20‘10‘002,000PJ1,00005001,500OtherWindSolarBiomass40%BiomassisthedominantsourceofrenewableenergyConsumptionofrenewableenergybysource(PJ,NL)‘90‘20‘10‘00300PJ0AmbientGeothermal200100SolidbiomassBiofuelsBiogasEnergyefficiencyshouldbeconsideredasthe'firstfuel'asitisthecleanestand,inmostcases,thecheapestwaytomeetourenergyneedsAcademicTodayweareonaquestforthemostenergyefficientwayofproducing,whileinrealityweshouldfirststartquestioningsomeofourconsumptionbyasking:doweneedthisdemand?IndustryProfessional18Deloitte'sEnergyTransitionMonitorFourmainreasonsaccountforthedominanceofbiomassamongstrenewablesources.Firstly,solidbiomass(woodandcharcoal)hastraditionallybeenusedinhouseholdfireplacesandstoves.Secondly,biogasfromanimalmanureaboundsbecauseofthelargeDutchagriculturalsector.Thirdly,biomasscaneasilybeblendedintoexistingenergygeneration(e.g.,co-firingwoodpelletsincoalpowerstations),andEUincentiveshaveincreaseddemandforthispracticefurther.Finally,Europeanblendingmandateshaveincreasedthedemandforbiofuels.aNonetheless,thedominanceofbiomassislikelytobeshort-livedbecauseitssustainablesupplyislimited.Thesupplyofvegetablewasteislimited,andcannotbeincreasedbygrowingadditionalcropswithoutcompromisingthefoodcropsforhumanconsumption.23Therefore,regulationsaroundbiomassarelikelytotightenevenfurtherinEurope,anddetertheuseofbiomasswherewindandsolarenergyoffereconomicalternatives(e.g.,electricitygeneration).Nonetheless,biomasswillremaincrucialfortheproductionofcleanmolecules(e.g.,biosustainableaviationfuel(SAF)andbioplastics),becausesyntheticproductionusingwind-andsolar-basedelectrolysisremainsmorecostly.4.2Energyconsumptionbyendsector:electrificationhasstarted,butonlyinnichesRoughlyhalfofallrenewableenergywasconsumedintheformofgreenelectricity,whichisblendedwithintheelectricitygrid.Akeychallengeisthereforetointegratemoreoftheserenewable(intermittent)sourcesandincreasetheoverallshareofelectricity,whichiscurrentlytheminorityenergycarrierforallsectors:3%inmobility,24%inindustryand35%inbuiltenvironment(seeFigure17).Intheshortterm,anincreaseintheelectricitysharewillbeachievedbyelectrifyingtrucksandsmallindustrialplants,andhouseholdheating.Lookingatmobilityin2022specifically,thefinalelectricityconsumptioninthissectorwassplitequallybetweencarsandtrains,whereEVscontributedonly1.5%ofthesector’senergyuse(seeFigure18).Onecouldarguethatelectrificationofcarsisquicktograbpublicattention,butithaslittlerealimpactonreducingemissions.Additionally,ithasbeenineffectivesofarintermsofemissionsreducedperEurosubsidyandofferslittlestrategicvalueforacountrywithlimitedcarproduction.However,governmentsubsidieshavecontributedtothecreationofthecountry’sEVinfrastructure(andcorrespondingEVcharger-industry),whichcanbepotentiallyusedpartlyforfutureelectrificationofroadfreight.Apartfromrenewableenergybeingusedintheformofgreenelectricity,otherformswereusedinseveralsectors,predominantlyintheformofbiomass.Inthemobilitysector,renewablesrepresented6%oftotalfinalenergyuse,duetotheblendingmandatesofbiofuels.Renewablesrepresented7%ofbuiltenvironmentenergyuse,comprisingmostlybiomass(e.g.,wood),biogasfedintothegasgrid,andrenewableheat(e.g.,ambientenergyandsolarheat).Inindustry,renewableenergysources(3%)wereusedmostlyinformofsolidbiomassandgeothermalenergy.aSeeRenewableEnergyDirectiveandHernieuwbareBrandstofeenhedendirective.bFordetailedmethodologyofthesentimentanalysis,seeAppendix.cTheneutralsentimentsaredividedequallyoverpositiveandnegativesentiments.Publicsentimenttowardbiomasshasbecomeincreasinglynegativeoverthepasttenyears.bIn2023,halfofthetweetsanalyzedexpressednegativesentimentstowardbiomass–morethanfivetimeshigherthanin2013.MostconcernsareabouthighCO2emissions,thenegativeeffectonairqualityifbiomassusecontinuestorise,andtheriskoflosingbiodiversityifbiomassenterslarge-scaleproduction.Thislackofpublicacceptancemightfurtherlimittherolethatbiomasscanplayintheenergytransition.Figure16:Changingshareofsentimentfortweetsmentioningbiomass(2013vs.2023)c,7Call-outD.Case-study:biomass–lowpopularityamongtheDutch20%20%40%20132023neutralpositivenegativeneutral40%60%Biomass19Deloitte'sEnergyTransitionMonitor4.3Transitionoftheelectricitysystem:theDutchenergysuccessstoryRenewableswillplayanimportantroleindecarbonizingthebuiltenvironment,industryandmobilitysector,andtheelectricitysectorisalreadytransformingrapidly.Fromlessthan1%in1990,2022sawanimpressive40%ofelectricitybeingproducedfromrenewablesources.cCleanelectricityisgeneratedlargelyfromsolar(38%)andwind(46%)sources,withlimiteduseofbiomass(16%)incoal-firedpowerstations.Moreimpressivestillisthatthisprogresshasbeenachievedwithoutincreasingelectricityimports,whileconsumptionhasincreasedby72%(since1990).Thisincreasedshareofcleanelectricitymeansthatthesector’scarbonintensityhashalvedsince1990.ForthevisionofaGHG-freeelectricitysystemincomingyearstobecomeareality(by2050accordingtotheKlimaatakkoord,by2035accordingtoRutteIV),dmoreinvestmentisneededinbatteryorhydrogenstorage,demandresponse,extratransmissioncapacity(incl.internationally)andflexible/baseloadsupply(e.g.,investmentsinnewnuclearcapacity),tocomplementtheincreasedcapacityforgeneratingcleanpowerintheNetherlands.ThisisespeciallyrelevantfortheNetherlandssinceitselectricitygenerationisveryadependentonemissions-intensivesources,suchasgasandoil,comparedtoothercountriesthatgenerateelectricityfromsourcessuchashydropower,biomassandnuclear.However,theuniquesaltcavernsintheNetherlandsareabletostorehydrogen,andthereforehavethepotentialtomaketheDutchelectricitysystemmoreflexible.Duringperiodsinwhichrenewablesgenerateasurplusofelectricity,theexcesscanbetransformedintohydrogen,stored,(attheexpenseofconversionlosses)thenusedtogenerateelectricityduringperiodswhenrenewablesprovideinsufficientpowertomeetelectricitydemand.Figure17alsoshowsthatcoalusewasdecliningby2020,buttheenergycrisis(duetoe.g.,highgaspricesandissueswithavailabilityofnuclearcapacity)hittingEuropehasledtoconsumptiongrowingagain,toprovidesecurityofsupply.AlthoughthisgrowthhasincreasedDutchCO2-eqemissions,ithasnotimpactedoverallEuropeanemissionlevelsbecausepowergenerationispartoftheETS.e,28a2022dataispreliminary;consumptionsharesbysectorarebasedon2021andbiomasstotalsarebasedon2021data;energyconsumptionfromAgricultureandFishery(7%)isallocatedtoindustry(fornaturalgas)andmobility(forallothercarriers);energyconsumptionfromother/unknownsectors(13%)isallocatedproportionallytoindustry,mobilityandbuiltenvironment;biogasconsumptionisallocatedproportionallytoindustry,mobilityandbuiltenvironment.b2022dataispreliminary.cRelativeshareofrenewablesintheelectricityproductionisbasedonrenewablenormalizedgrossproduction.Renewablenormalizedgrosselectricityproductionadjustedforweatherconditionsandincludingindirectproductionfromgreengas.From2021,electricityproductionfromsolidbiomassandbiogasininstallationsaboveacertainpowerlimitwillonlybeincludedifthebiomassusedmeetsthesustainabilityrulesfromtheEURenewableEnergyDirective(REDII).dGoalsetbytheKlimaatakkoordtheambitionhasbeenraisedintheCoalitionAgreementunderRutteIV(non-binding)tonet-zeroin2035.eTheETSallowsafixednumberofemissionallowancesforthesectorsitregulates(cap-and-trade),whichisdecreasedyearlyby2.2%.Higheremissionsfromelectricitygeneration(duetoemploymentofcoalinpowerstations)wascompensatedbyloweremissionsinothersectorstomaintainthetotalnumberofemissionallowancewithinthecap(forinstance,haltingoffertilizerproduction).Figure17:Energyconsumptionbysectorandcarrier(PJ,2022)a,7,11,27Figure18:Splitofenergyconsumptioninmobilitybetweenelectricity,oilproductsandnaturalgasb,11PolicyfocusonelectricmobilityintheNetherlandsdoesnotcontributetoourcompetitiveadvantageasacountryaswedon’thavealargecarindustryAcademicShareofelectricityinmobilityisstillmarginalBuiltenvironmentIndustryMobilityEnergyconsumptionbysector613603410100%0ElectricityOilproductsNaturalgasHeat50%OtherRoadmobility(365PJ)Railmobility(7PJ)Only3%ofmobilityiselectrifiedSplitofenergyconsumptioninselectedmobilitysectors(PJ,NL,2022)ElectricityNaturalgasandoilproducts1PJ20Deloitte'sEnergyTransitionMonitor4.4Fromexportertoimporter:structuralchangestoDutchenergydependencyHistorically,theNetherlandshasdependedonimportsforcoalandoil,whileproducingitsownnaturalgasandrenewableenergy,butthepicturehaschangedandFigure20showsitstransitionfromexportertoimporter.Amajorchangeoccurredin2013,whenthegovernmentdecidedtoreducegasproductionfromtheGroningengasfield.29By2018,naturalgasexportsfromtheNetherlandshadhalted,andthecountrybecameanimporterofgas.Theimplicationsofthisdevelopmentareenormous:theDutchenergysystemandindustrialproductionstilldependheavilyonnaturalgas(andremovingthatdependencewillnotbeeasy),butrelyingonothernationsfornaturalgasaffectstheDutchenergysecurity.Thiswasevidentduringtherecentturbulenceintheglobalenergymarkets,whichweredestabilizedbythepost-COVIDeconomicrecoveryandRussia-Ukraineconflict.ToensureenergysecurityintheNetherlands,thenationalinfrastructurehadtobeadjusted:andprojectssuchastheEnergiebufferZuidWendingandEemsEnergyTerminalhelpedtosecureandintegratetheimportsofliquefiednaturalgas(seeCall-outE,casestudyonhowtoacceleratetimelinesforpermitting).Beyonditsdisadvantagesforenergysecurityandaffordability,importednaturalgascanhaveamorenegativeimpactontheclimatethandomesticproduction.Inadditiontohigheremissionsfromshippingtheliquifiedfuel,naturalgasproducedabroadisoftenmorepollutingbecausedrillingproduceshigheremissions(fromleakageandflaring),whicharesubstantiallylowerintheNetherlandscomparedtointernationalstandards.Therefore,extendingthegasproductionfromDutchoffshoregasfieldscouldinsomewaycontributetoreducingemissions.29a1)Normalizedelectricityproductionbasedonnetfigures,i.e.,excludingtheenergyusedbytheelectricityinstallations(~5%),andincludinguseofbiogasinelectricityproduction;2)Foryearspriorto1998,onlyaggregateddataavailable;3)Oilproductsincludescokeovengas,blastfurnacegas,chemicalresidualgases;4)2022figuresarepreliminary.bNetimports/exportsconsiderede.g.,excludingenergysourcesimportedandre-exportedsubsequently;2022dataispreliminary,volumesforrenewableenergyandothercarriersassumedequaltoyearprior.Figure19:Electricityproductionbysource(PJ,1990–2022)a,7,11Figure20:ImportandexportofenergycarriersintheNetherlands(PJ)b,11StrategicautonomymeansreachinganacceptablelevelofdependencyonothercountriesGovermentOfficial1000Electricityproductionbysource(PJ,NL)Shareofrenewableelectricityproductionhasincreasedto40%‘90‘22RenewableNaturalgasCoalOtherOil300200400PJTheNetherlandstransformedintoanetimporterofnaturalgas‘98StartdecommissioninggasfieldsGroningen‘13‘17‘22Coal,OilandotherNaturalgasRenewableimportofgasImport-exportbalanceofenergy(PJ,NL)Production(P)ExportImport(I)05,000PJ4,0003,0002,0001,000-1,000IP21Deloitte'sEnergyTransitionMonitoraWhenthecourtoverturnedtheconstructionexemptionfornitrogenemissions(bouwvrijstelling)in2021manyrenewableprojectsawerestopped.Weneedbold,emergencymeasuresinsteadofthebusiness-as-usualroadmaps,whicharevagueandslowAcademicTheenergytransitionwillrequirelargeinfrastructureinvestmentstotransformtheenergysystem.Inadditiontodevelopmentssuchaswindturbinesandelectrolyzers,theNetherlandswillneedastrongerelectricitygrid,undergroundCO2storageandpipelines,suchasthehydrogenpipelinespartoftheEuropeanHydrogenBackbone.Achievingtheenergytransitionby2050willrequirecoordinatedactorsandsupplychains,butakeybarrierwillalsobepermits,whichinvolvelongtimelinesandcanstopbusinessesfrommakingdecisionsquickly.aAcceleratingthesetimelineswouldacceleratemanyenergytransitionrelatedprojects.AgoodexampleofwherethisaccelerationwassuccessfulintheenergyspaceistheEemsEnergyTerminal–anLNGterminalbuiltinEemshavenwherefuelimportedbyshipislanded,forusewithinthenationalgasgrid.Normally,suchaprojectwouldtakethreeyearstocomplete,buttheentireterminalwasfast-trackedandoperationalinarecord200days(~80%faster),allowingtheNetherlandstotackletheurgentgasshortagecausedbytheRussia-Ukraineconflict.Bycomparison,theWarmtelinQprojecttookeightyearstoreachafinalinvestmentdecision(FID)andanotherfouryearstoberealized.TheEemsEnergyTerminalexperiencesuggeststhatthecriticalfactorsforrapiddeliverywereanemergencyapproachtograntingpermits,andahighertoleranceforuncertaintybyallparties,specifically:•allpartiescommittedtothekeyprojectobjective,ofdeliverybytheagreeddate,whichcreatedasharedsenseofurgency;•governmentaccelerateditsnormaltimescaleforpermits,andbypassedthestandardtenderingprocessforissuingconditionalpermits;and•businessesacceptedahighertoleranceforrisk:unusually,nocommercialcontractsweresignedbeforeFIDtookplace,sopartieshadnoguaranteethattheLNGwouldbeboughtoncetheterminalwasbuilt.Theselearningsshowhowtheenergytransitioncanbeacceleratedbysimplifyingpermittingprocesses,increasethewillingnesstotakeriskorcreateasafe-failmechanismsforinvestors.TheEUIndustrialPlanandthelatestprovisionalagreementoftheEU’sRenewableEnergyDirectivewillincludededicatedaccelerationareasforrenewables,withparticularlyshortandsimplepermittingprocesses.Call-outE.Howtoacceleratetimelines22Deloitte'sEnergyTransitionMonitor4.5Keytake-awaysandDeloitteperspectiveDecarbonizemolecularenergydemandRoughlyhalf-waythroughtheenergytransition,atleastintime,theDutchenergysystemisstillrelianton85%nonrenewableresources,andonly23%ofenergyisconsumedintheformofelectricity.Despitetheaccelerationofwindandsolar-basedelectricity,biomassstillplaysacrucialroleintoday’srenewableenergyshare(40%).Thefactthatbiomassremainsthedominantsourceofrenewableenergyshowsthat,historically,biomasshasbeentheeasiestwaytoincreasetherenewableenergyshareinacountrysuchastheNetherlands.However,itsfutureusewillberestrictedbytheavailabilityofsustainablesupply,regulations,andcompetitionwiththefoodsystem.Therefore,althoughelectrificationshouldremainthemainfocus,theremainingdemandformolecularsourcesshouldbedecarbonizedmoreactively,bypromotingtheuseofcleanhydrogenandmakingoptimaluseofthelimitedbiomassresources,andshiftingitsmainuses.Thiswouldmeanashiftfromusingbiomassforgeneratingelectricityandlow-temperatureheat,toproducingsustainablefuelsforshippingandaviation(whiletakingintoaccounthowdifferentsourcesofbiomasscanbeusedmostefficientlyacrosssector).PositiontheNetherlandsasthepowerhouseToincreasetheshareofrenewableenergyintheNetherlands,givenitsgreatpotentialinoffshorewindenergy,thecountrycanpositionitselfasthepowerhouseforproducingoffshorewindenergyandgreenhydrogen.ThiscanbeachievedbystrengtheningtheexistingNorthSeaConsortium,todriveitsvisionandexecuteplansforthephysicalinfrastructureandmarketdesign,whichwillpositiontheNorthSeaasthepowerhouseofNorth-WestEurope’soffshorewindelectricityandhydrogenproduction.FixpermitdelaysTopreventdelaysandkeepmomentumintheenergytransition,governmentbodiesshouldcreatearegulatoryringfenceandchallengeprevailingassumptions,toacceleratepermittingtimesandsimplifyqualificationprocessesfornewprojects,whileimprovingtheuseoftechnologyanddatatomakefaster,betterdecisionsandspeeduptheirdevelopment.ThisisinlinewiththeEUIndustrialPlanthatincludesmechanismsforfasterpermittingtimelines.Supportsecurityandnear-termshiftswithgasTheenergysystemtransitionneedstobeachievedwhilealsobalancingaffordability,securityandsustainability.AstheDutchproductionofnaturalgascomestoanend,theNetherlandsmustlearntorelyonabroaderspectrumofenergysources,andrecognizetheadvantagesofdomesticnaturalgasproductionovserimports(i.e.,relativelylowcarbonintensity,increasedsecurityofsupply).Fortunately,theNetherlandsiswell-positionedtoregainenergyindependenceasfurtherdevelopmentofrenewableswillnotonlydecreasetherelianceonnaturalgasforelectricityproduction,butalsohasthepotentialtosatisfysomeoftheotherfuelrequirements.Hydrogen,producedwithwindandsolarpower,representsastrategicopportunityintheproductionofsyntheticfuels.Inturn,thesecouldhelpdecarbonizethemobility,industryandbuiltenvironmentsectors,andreinforcenationalenergysecurity.23Deloitte'sEnergyTransitionMonitorMonitoringGHGemissionsandtheenergymixgivesusefulinsightsintowheretheNetherlandsisnowbut,tounderstandwhereitisheading,thereisalsoaneedtolookatindicatorsthatsignalfuturechanges.Thischapterthereforeexploresinvestmentincleanenergytechnologies,withinthreegroups:households,privatesector,andpublicsector.a5.1Householdinvestment:technologypenetrationisgrowingrapidlyTheeightmillionhouseholdsintheNetherlandsdonot,together,investthemostmoneyofthethreegroups,buttheirwillingnesstoadoptcleanenergytechnologyiscrucialforreducingDutchemissions,becausepassengercarsareresponsiblefor15MtCO2-eqemissions(50%ofmobilityemissions)andresidentialhousingisresponsiblefor14MtCO2-eq(74%ofbuiltenvironmentemissions).17,30Investmentbyhouseholdscanalsoreflecttheirwiderunderlyinglifestylechoices,asanindicatorofsocietaltrends.Figure21showstheadoptioncurveofthreehouseholdtechnologies:rooftopsolarpanels(PV),electricvehicles(EVs),andheatpumps.ThechartshowsthatadoptionofallthreetechnologiesbyDutchhouseholdsisgrowingfast.Itisestimatedthat,by2022,anaverageofoneinthreehouseholdshadadoptedatleastoneofthesecleanenergytechnologies.Solarpanel(PV)take-uphasbeengrowingmostrapidly,andwasat25%in2022,oroneinfourhouseholdshavingatleastonePVpanelontheirroof.InEurope,theNetherlandshasthelargestinstalledPVcapacitypercapita.Heatpumpsarebeingadoptedmoreslowly,and5%ofhouseholdsarenowheatedbyelectricheatpumps.However,thistake-uplagsbehindotherEuropeancountriesandtheNetherlandsranks12th,withNorway,FinlandandSwedenasthetopthreecountries,withthehighestadoptionofheatpumpspercapita.31EVsarealsogainingtraction,with7%ofDutchhouseholdsnowdrivinganelectricar,while35%ofnewcarssoldin2022wereEVs.Dutchhouseholdshavealsoinvestedinprivatechargingpoints,andinstalledalmost400,000intheirhomes,supplementingthoseprovidedinpublicspaces(seeCall-outH).32,33Dutchcitizenshavethefourth-largestEVcarfleetinEurope.b,34LookingattheshareofEVsinpassengercars,theNetherlandsiseveninsecondplace–justbehindNorway.caAwordofcaution:metricsfortechnologyinvestmentareusedheretoindicatethegeneraldirectionoftheNetherlands(e.g.,futureemissionreductionpotential),andshouldnotbetakenasprecisequantitativepredictions.bThisisbasedontheamountofregisteredelectricpassengercarsintheNetherlands,soitincludeselectricpassengercarsusedforbusinesspurposes.cBasedon2021data.d(1)TheaverageofDutchhouseholdsthathaveinvestedincleanenergytechnologywascalculatedusingthestatisticalaveragewhichcalculatestheaverageofhouseholdsthathaveatleastoneofthethreetechnologies.Average=1–[(1–shareofhouseholdswithsolarpanels)(1–shareofhouseholdswithEVs)(1–shareofhouseholdswithheatpump)](2)Errormarginindicatestherangeofstatisticalpossibilitiesofhouseholdshavingatleastonetechnologies,giventheuptakeofthetechnologiesindividually.Investmentsbyhouseholds,companiesandgovernmentgiveagoodsenseofwheretheenergytransitionisheading.Householdinvestmentsincleanenergytechnologiesaregrowingrapidly.Privatesectorannouncementsalsolookpromising,withashiftfrominlandtooffshoreprojects.Governmentinvestmenthas,todate,beenmainlyinelectricitygeneration,butagrowingfocusonmolecularenergycanbeobserved,alongwithincreasinginvestmentintheinfrastructureforenergydistribution.Figure21.Shareof(selected)sustainableenergytechnologiesinNLhouseholds,1990–2022d,6,7,31,34,4040%ofhouseholds0Averageatleast1solarpanelsHeatpumpsEV’s‘90‘20‘00‘1010%20%DutchhouseholdsareinvestingincleanenergytechnologyShareofhouseholdsinvestingin(selected)cleanenergytechnologies(%,NL)errormarginaveragehigh-low30%5.WheretheenergytransitionintheNetherlandsisheading:household,privatesectorandpublicinvestment24Deloitte'sEnergyTransitionMonitor5.2Supply-sideprivatesectorinvestments:movingfromonshoretooffshoreProjectannouncementsaindicatethegeneraldirectionofstructuralchangesintheDutchenergysystem,andinemergingtechnologies.AsFigure22shows,projectannouncementssuggestlargefutureincreasesinoffshorewindcapacity,cleanmoleculesproduction(e.g.,greenandbluehydrogen,andSAF),carboncaptureandstorage(CCS),andbatterystorage.bHowever,thereisstillalargegapbetweentheannouncedcapacityofprojectsandthegovernmenttargetsintheNationaalPlanEnergiesystem(NPE),whichaimsfor70GWofoffshorewind,15–20GWofhydrogenand3.5to7GWnuclearby2050.35Theseexpansionsinthecapacityforrenewableenergysupplyarebuiltonthepremisethatstructuralchangeswillalsooccuronthedemand-side,suchaselectrifyingindustrialprocessesorscalingupgreenhydrogendemand,whichwillalsorequirelargescaleinvestments.Theproductioncapacitycurrentlybeingplannedfortheelectricitysystemsuggeststhatitsrapidexpansionwillcontinue,butwillchangeinnature.Whileonshoresolarandwindhassofardominated,offshorewindisexpectedtoplayamuchgreaterrole,asindicatedbygovernmentplanstotenderoffshorewindsites.Solar(PV)hasbeenabigsuccessintheNetherlands,duetoattractivepolicyincentives.cHowever,solarprojectsareoftensmallerinscale,andhaveshorterdevelopmenttimescales,sotheyareunder-representedinannouncedprojects.Basedonprojectannouncements,ashiftinthenatureofmolecularenergyisalsoexpected,anditwillbecomedominatedbyhydrogenandhydrogenderivates.Theroleofbiomassmightchangeintheyearsahead,anditwilldeclineastheprimarymolecularenergycarrier.Instead,itwillincreasinglybecomeasourceofbiogeniccarbon,combiningwithhydrogentocreatemorevaluableenergycarriers,andreducedemandforthelimitedsupplyofbiomass.TheNetherlandscanplayaleadingroleinelectrolysis-basedhydrogenproduction,givenitsabundanceofoffshorewind.Indeed,integratedhydrogenproductionisexpectedtobecomesizeableintheNetherlands.aAnnouncementsincludeallprojectsthatarebeingannounced,includingprojectswithFIDandprojectswithoutandacrossdifferenttimehorizons.bBasedonDeloitteDataCube.34cSeetheSalderingregeling.Financingthetransitionisachallenge:institutionalinvestorsmighthavethecapital,buttheirriskappetiteisnotalignedInvestor25Deloitte'sEnergyTransitionMonitorTheNetherlandshasagreatopportunitywithCCS,andiswell-positionedtoadoptthetechnology,withmanydecommissioned(offshore)gasfieldsandahighconcentrationofCO2sourcestreams(e.g.,PortofRotterdam)tobecaptured.Althoughprojectannouncements(includingsubsidyrequests)havebeendelayed,atheysuggestahugeincreaseinCCScapacityoverthecomingyears.CCStechnologyisexpectedmainlytoreduceemissionsfromindustryandelectricityproduction,astheonlysourcesofconcentratedCO2streams.EnergystorageprojectsintheNetherlandsplayanimportantpartinaCO2-freeenergysystem,becausetheycancomplementintermittentgenerationsources,suchaswindorsolar,toensureamorepredictableenergysupply.Althoughannouncementsindicatetherangeoftechnologiesthatcanbeexpectedinfutureprojects,thecapexthatiscommittedtotheseprojectsgivesanindicationofthescaleandlocationoftheinvestments.AsFigure22shows,mostcapitalwillbeallocatedtooffshorewindprojects(~€80billion),followedbyCCS(~€29billion)andgreenhydrogen(~€20billion).aManylargeCCSprojectsareonholdduetothenitrogenruling,potentiallydelayingthedevelopmentofCCScapacity.bAnnounced:allpubliclyannouncedprojectsnotyetoperationalwithdefinedproductioncapacityandtimeline(preandpost-FID);onlinedatevariesperproject.cAnnouncedcapacityonlyforutility-scale(solarabove20MWandwindabove10MW);3)LowCarbonFuelsinclude(clean)ammonia,methanol,bio-/e-gasandotherbiofuels;4)CAPEXimpliedbyannouncedprojectsisbasedonCAPEXproxiesfromknownprojects:Offshorewind:€3B/GW;Onshorewind:€1b/GW;Solar:€1B/GW;GreenH2:€11B/Mt;BlueH2:€11B/Mt;CCS:€1B/MtCO2;SAF:€5B/Mt;LCF:€0.3B/Mt;Geothermal:€7b/GW;Nuclear:€4b/GW).NotethattheimpliedCAPXgivesanindicationofthetotalinvestmentsineurobutnotthelevelizedcostsofenergy(LCOE)becausetheloadfactordiffersbetweenthedifferentproductionmethodsforcleanenergy.Privateinvestments:movingfromonshoretooffshoreOffshoreOnshoreSolarOperationalAnnouncedOtherSAFCCSCleanelectricityCleanmoleculesCCSCAPEXimplied802920Operational,announcedandtargetcapacityincleanenergytechnologies103212EnergystorageinGWinGWinMtCO2inMWh2050targetNuclear1GreenH2BlueH2announcedprojects,inbillioneuros1450100150300inMtFigure22.Operationalv.AnnouncedbcapacityincleanenergytechnologiesintheNetherlands(March2023)c,7,35,36,3726Deloitte'sEnergyTransitionMonitoraFordetailedmethodologyofthesentimentanalysis,seeAppendix.bTheneutralsentimentsaredividedequallyoverpositiveandnegativesentiments.cSpeedofchangesbasedon2022data.Ofthetwomainrenewableenergysources,theanalysisofsocialmediaposts(formerlyknownastweets)showedthatpositivesentimentstowardsolarenergyhavedeclined,butarestillgreaterthanpositivefeelingsaboutwindpower.aNegativesentimentstowardwindenergymorethandoubled(to35%)between2013and2023,probablybecausecitizensdislikehavingwindfacilitiesneartheirhomes,orinsight.However,mostoftheanalyzedsentimentscontinuedtoexpressneutralorpositivefeelingsaboutwind.Figure23:Comparisonofchangingshareofsentimentfortweetsmentioningwindversustweetsmentioningsolar(2013vs.2023)b,7Figure24:Examplesofspeedofbuild-outrequiredtomeetaselectionofNLemissiontargetsc,7,25,32,38,39,40Energytransitiontargetscansoundabstract.Sowhatdothesenumbersmeanfortheeffortthatisrequiredintheyearsupto2030and2050?Thissectionexploressomeexamplesindifferentsectors.AnexampleintheelectricitysectorThegovernmenthasatargetof70GWinoffshorewindenergyby2050.Toreachthisgoal,fromaninstalledbaseof4.7GWcapacityattheendof2023,andassumingacapacityof15MWperwindturbine,onewindturbinewillneedtobebuilteveryotherdayuntil2050.Thisismorethantwotimesmorethanthecurrentbuildrateand,allowingforconstructionbreaksinwinter,thisrateisevenhigherinreality.ExamplesinthemobilitysectorFollowingtheKlimaatakkoord,publictransporthasagoaltomakeallDutchOVbusesemission-freeby2030.Thecurrentfleetisapproximately5500buses.Thismeansthat,until2030,10buseseachweekneedtobecomepoweredbyelectricityorhydrogen.AndhowmanyEVchargersneedtobebuilteachyear?Thegovernmentaimstohave1.8millionEVchargingstations(includinghomechargers)by2030.Eventhoughtherearealreadyover500.000chargingstations,570chargingstationsneedtobeinstalledperday,whichismorethan17timesthecurrentinstallationspeed.AnexampleinbuiltenvironmentThegovernmentaimstotake7millionDutchhousesoffthegasgridby2050,andconnectthemtosustainableheatingsystems.Toreachthisgoalover600housesneedtobecomegasfreeeverysingleday(basedon700.000gasfreehousesin2022).TheseexamplesshowhowlargeachallengetheNetherlandsisfacing.Fortunately,theknowledgetobuildthisinfrastructureisalreadythereandnorevolutionarytechnologyisrequired.However,thespeedrequiredisexceptionalandwillpresentmanychallenges,suchasdirectingsufficientinvestment,orovercomingshortagesoflaborandmaterials.Call-outF.Casestudy:WindenergylesspopularthansolarCall-outG.WhatneedstobetrueiftheNetherlandswantstoreachitsemissionstargets?20%20%40%60%20132023neutralpositivenegativeneutral20%20%40%20132023neutralpositivenegativeneutralSolarWind40%40%Build1Windmillevery2daystill2050Put10emission-freebusesperweekintooperationuntil2030Install570chargingstationsperdayuntil2030Electrifytheheatingsystemfor600housesperdayuntil205027Deloitte'sEnergyTransitionMonitor5.3Publicinvestment:shiftingincentivesfromelectronstomoleculesGovernmentshavemanypolicyinstrumentsavailable,suchastaxes,obligationsorquotas,andmarketmechanismssuchastheETS.However,subsidiesarealeadingwayinwhichgovernmentscandrivechange,byreducingprivatecostsandhenceimprovingthebusinesscaseforprivateinvestment.EnergysupplyIntheNetherlands,themainsubsidyinstrumentforstimulatingrenewableenergyinvestmenthasbeentheSDE++subsidy.aTheallocationofSDE++subsidiestodifferenttechnologies+(+)givesanindicationofhowtheenergysystemwillchangeinthecomingyears.Between2015and2021,itfocusedheavilyonrenewableelectricity,leadingtoahighpercentageofrenewablepowerintheelectricitymix(discussedpreviously).Since2021,though,thefocusonrenewableelectricityhasdecreasedsignificantly,withonly9%offundsbeingallocatedtorenewableelectricityprojects.Now,muchmorefundingisbeingdirectedtowardCO2-relatedprojects,suchaslow-CO2productionandlow-CO2heat.aThisisnexttootherinstrumentssuchastheVersneldeklimaatinvesteringenindeindustrie(VEKI),DemonstratieEnergie-enKlimaatinnovatie(DEI+),hernieuwbareenergietransitie(HER+),amongstothers.Figure25:AllocatedSDE+(+)subsidiespertechnology,2011–2022(€M)7,41Thecapitalrequiredfortheenergytransitioniscolossal–institutionalinvestorsneedtoplayaroleinthis,butfirstincreasetheirriskappetiteInvestorIt’scrazytousepriceincentivesforenergyusewhichisanecessityoflifesuchasspaceheatingAcademic10,0000500RenewableelectricityRenewableheatRenewablegasLowCO2heatLowCO2production‘11‘22‘11‘22‘11‘22‘11‘22‘11‘22PublicinvestmentAllocatedSDE++subsidiespertechnology(€M)RooftopsolarWindFieldsolarRenewableelectricitybreakdown(%,2022)28Deloitte'sEnergyTransitionMonitorInfrastructureInadditiontocleanenergyincentives,thegovernmentisalsoresponsibleforplanningandcoordinatinginfrastructure.TheDutchelectricitytransmissionsystemoperator(TSO)TenneTrequiresmorethan€44billionoverthenextdecadetoexpandandmodernizeitsinfrastructureintheNetherlands.42Thethreelargestgasandelectricitydistributionnetworkcompanies(DSOs)willneedtoinvestbetween€23and€30billionuntil2050;andtheDutchheatingnetworkwillrequireafurtherinvestmentof€48billion.7,43,44,45Gasunieestimates€1.5billionisneededforthedevelopmentofthehydrogennetworkintheNetherlands.46OneexampleofasuccessfulinfrastructureinvestmentisthebuildingofanEVcharginginfrastructureintheNetherlands(althoughthiswasheavilydrivenbydemandside).5.4Keytake-awaysandDeloitteperspectivePrioritizeimpactforscaling–ReductionlevelsacrosssectorsindicatethattheEuropeancarbonprice(viatheETSsystem)isworkingrelativelywellforindustryandelectricity.However,strongermeasuresareneededtoaccelerateprogressinbuiltenvironmentandmobilityiftheirsectorgoalsaretobeachieved.Sofar,incentivesinthesesectorshaveencouragedhouseholdstostartadoptingcleanenergytechnologies,suchassolarpanels,heatpumpsandEVs.Now,theyshouldpromotethemassivescale-upthatisrequired:insteadoffocusingonmeasuresinETSsectors,nationalincentivesshouldsupportinitiativeswheretheDutchgovernmentisincontrol,andwhichmakethelargestimpactondecarbonization.Unlocknewmoney–Investmentfiguresshowpositivesignsforthetake-upofcleanenergytechnologies.Householdshavebeenadoptingcleantechnologyatafastgrowthrate,whiletheprivatesectorisplanningmajorcapacityincreasesacrosskeyenergysourcesandtechnologies.Projectdevelopersandinvestors(inallcategories)shouldaligntheirviewsonriskandincentivesmoreclosely,tounlocknewsourcesofmarketcapital,driveprojectrealizationandtaperrelianceonpublicfunding,tohelpacceleratetheenergytransition.LessonscanbelearnedfromtheLNGterminalEemshaven,whereinvestorswerewillingtoaccepthigherriskstoenabletheproject.Additionally,(national)publicpartiesshouldmakethebestuseofavailable(European)funds,whichcouldnotonlystimulatethetransitionbutalsofundthebuild-outoftherequiredinfrastructure.Findtheskillsandmaterials–Torealizetheambitiousprojectsdevelopmentplansandreachthetargetsforrenewableenergymanymaterialsand(new)peoplewiththerightskillsarerequired.Therefore,newmarketleversandtradingpartnershipsshouldbeexplored,tosecuretheskillsandmaterialsneededtoexpandthedevelopmentofarenewableenergysystem.aSlowchargershavepowerratingslessthanorequalto22kW.Wecan’tbuildallinfrastructureatthesametime(electricity,heat,hydrogen,CCS),sochoicesneedtobemadeincollaborationwithindustryIndustryProfessionalOneexampleofsuccessfulinfrastructurebuild-outisthedevelopmentofthenationalEVcharginginfrastructure.Thishasbeenagreatsuccess,andrepresentsaquarterofall500,000slowchargingpointsinEurope,givingDutchcardriversaccesstothecontinent’slargestchargingnetwork,inbothabsoluteandpercapitaterms.ThemaindriversofthisinfrastructuredevelopmentweregovernmentsubsidiesforEVsinprivateownershipandincompanyleaseschemes.Althoughtheeffectivenessofthisincentivedesignhasbeenquestioned,itdidenabletheincreasingshareofEVsintheDutchcarfleetto7%by2022.Figure26:Totalandper100.000capitaslowEVchargingpointsinEuropea,7,25,47Call-outH.Successfullydrivingelectrification–EVinfrastructureTheNetherlandsleadsonEVinfrastructureTotalnumberofEVchargersandpercapita(NL,2022)NETHERLANDSFRA800chargersper100,000capita40000120,000chargersGERITABELNOR60,00029Deloitte'sEnergyTransitionMonitor6.10boldideastospeeduptheenergytransition–Deloitte’sperspectiveTheDutchenergytransitionhasmadegoodprogressinmanypartsoftheenergysystem.However,thedecisionswemakeintheyearsaheadwillfundamentallychangethewayoflifeandeconomyintheNetherlands,anddeterminewhetherwewillreachthegoalofnetzeroby2050.Wehavemuchworktodoinashorttime,buttheNetherlandshastherightelementstodoitwell,withamatureeconomyandregulatoryenvironment,awell-educatedworkforce,acultureofinnovationandthewillingnesstoinvestinourfuture.Thechallengenowishowtoorchestratethesecapabilitiesinnewways,toacceleratethetransition,protectourenergysecurity,andbenefitoursocietyandeconomy.Wethereforeproposetenboldideas,tohelpdeliverasuccessfulenergytransition:01.DevelopthepathtogetherHarmonizepublicandprivateinterestsbydevelopingdeeperandmoreextensivebilateralagreementsbetweengovernmentalbodiesandthelargestemitterstoenabletheindustrialenergytransitionalongwithsettingsoutputtargetsfordomesticmanufacturingandbuildingtheinfrastructureforagreenindustrialbase.02.TakefullresponsibilityTheeffectongreenhousegasemissionsfrominternationalaviationandshippingandimportedgoodsshouldbetakenintoaccountwhendesigningandevaluatingemissionreductionpoliciesandincentives.03.TakethepublicalongPublicsupportfortheenergytransitionshouldbeincreasedbycelebratingitssuccesses,throughgrassrootscampaignsandpolicyinitiativesthatpromotenewbehavioralnorms(ratherthanfinancialincentives),whilesupportingthemostvulnerablehouseholdsthroughtheirtransition.04.DecarbonizemolecularenergydemandThedecarbonizationofenergyconsumptionwhichcannotbeelectrifiedshouldbestimulatedbydrivingthehydrogenmarketandbymakingoptimaluseofbiomass–shiftingitsrolefromgeneratingelectricity,low-temperatureheatandroadmobility,toproducingfuelsforthehard-to-decarbonizedecarbonizeshippingandaviationsectors.05.PositiontheNetherlandsasthepowerhouseNorthSeaConsortiumshouldbestrengthenedtocreateavisionandexecutionplanforthemarketdesignthatpositionstheNorthSeaasthepowerhouseofNorth-WestEurope’soffshorewindelectricityandhydrogenproduction.06.FixpermitdelaysAregulatoryring-fenceshouldbecreated,andprevailingassumptionsshouldbechallengedbygovernmentofficialstoacceleratepermittingtimesandsimplifyqualificationprocessesfornewprojects,whileimprovingtheuseoftechnologyanddatatomakefaster,betterdecisions.07.Supportsecurityandnear-termshiftswithgasSecurityofsupplyofnaturalgasshouldbestrengthenedbychoosingsourcesthataretheleastcarbonintensive(i.e.,national),leastpricevolatile(i.e.,supportedwithlongtermcontracts)foraslongasnaturalgasplaysaroleintheDutchenergysystem(atleastthenexttenyears).30Deloitte'sEnergyTransitionMonitoraSlowchargershavepowerratingslessthanorequalto22kW.08.PrioritizeimpactinscalingIncentivesthathavebeeneffectiveinencouraginghouseholdstoadoptcleanenergytechnologiesshouldnowpromotetheexpansionofmeasuresthathavegreatestimpact,andreducecostsofthesetechnologies,suchastransitioningdomesticheatingfromgastonewrenewabletechnologieswhichwillcreatethedemand,momentumandconfidencefortheprivatesectortoscaleupproduction.Focusofpolicymakersshouldbeonthosesectorswheretheirinfluenceislargest(ETSvsNon-ETS)andover-incentivizationshouldbeevaluated(e.g.,“salderingsregeling”).09.UnlocknewmoneyViewsonriskandincentivesshouldbealignedmorecloselyamongstdevelopersandinvestors(inallcategories)tounlocknewsourcesofmarketcapital,driveprojectrealizationandtaperrelianceonpublicfunding,tohelpacceleratetheenergytransition.WhererequiredthisshouldgohandinhandwithunlockingexistingEuropeanfundstosupporttheDutchenergytransition.10.FindtheskillsandmaterialsNewlabormarketleversandtradingpartnershipsshouldbeexploredtosecuretheskillsandmaterialsthatareneededtoexpandthedevelopmentofarenewableenergysystem.Theseideas,incombinationwiththefactspresentedintheEnergyTransitionMonitor,aimtoprovideastartingpointforthediscussion,collaborationanddecision-makingthatwilltakeustowardasuccessfulenergytransition.31Deloitte'sEnergyTransitionMonitor7.GlossaryandabbreviationsCBAMCarbonBorderAdjustmentMechanism(anEUtariffoncarbon-intensiveproducts)CBSCentraalBureauvoordeStatistiek(statisticalbureauoftheNetherlands)CCSCarboncaptureandstorage(usedtomitigatecarbonemissionsthatcan’tbeeliminatedatsource)CCUSCarboncapture,usageandstorage(usedtomitigatecarbonemissionsthatcan’tbeeliminatedatsource)CH4Methane(aGHG)CO2Carbondioxide(thedominantGHG)CO2-eqCarbondioxideequivalent(astandardizedmeasureofGHGemissions)ETSEmissionsTradingScheme(anEUemissionsreductioninitiative)EUEuropeanUnionEurostatStatisticsagencyoftheEuropeanUnionEVElectricvehicleF-gasesFluorinatedgases,whichcombinehydrogen,fluorineandcarbon,includinghydrofluorocarbons(HFCs),perfluorocarbons(PFCs),sulfurhexafluoride(SF6)andnitrogentrifluoride(NF3)FIDFinalinvestmentdecision(thepointinprojectplanningwhenfundshavebeensecured)GHGGreenhousegasH2Hydrogen(afuelsource)HFCHydrofluorocarbon(atypeofGHG)IPCCIntergovernmentalPanelonClimateChangeLNGLiquefiednaturalgas(acompressedformofnaturalgas,typicallyusedfortransportation)MtMegatonnes,or106tons(ameasurementofmass);inthisreport,GHGemissionsmeasuredinMtrefertotheCO2equivalentN2ONitrousoxide(aGHG)NEaNederlandseEmissieautoriteit(theDutchemissionsauthority)NGONon-governmentalorganization(e.g.,publicorpolicybody,independentofelectedgovernment)NLNederland(TheNetherlands)O3Ozone(aGHG)PFCPerfluorocarbon(atypeofGHG)PJPetajoule,or1015joules(ameasurementofenergy)PVPhotovoltaic(atechnologyusedinthesolargenerationofelectricity)SAFSustainableaviationfuel,includingbiomass-basedbio-SAFSDEStimuleringDuurzameEnergietransitie(Dutchgovernmentsustainabilityenergytransitionsubsidyscheme)32Deloitte'sEnergyTransitionMonitor8.TableofFiguresFigure1:ScopeoftheEnergyTransitionMonitor(energy-relatedGHGemissionsingreen)4Figure2:ThreegraphsshowingthestatusoftheDutchenergytransition:energy-relatedGHGemissions,shareofrenewableenergyintotalfinalenergyconsumptionandinvestmentsincleantechnologybyhouseholdsinNL5Figure3:Changingsentimentintweetsmentioningtheenergytransition6Figure4:NLGHGemissions,coveringnationalemissionsandemissionsfrominternationalaviationandshipping7Figure5:ScopeoftheEnergyTransitionMonitor8Figure6:DutchenergyrelatedGHGemissionsbysectorandsub-sector,showingcurrentandtargetemissions(MtCO2-eq,1990–2022)9Figure7:NLGHGemissionsfromindustryandothersectorsbytypeofgas(MtCO2eq,1990–2022)10Figure8:BreakdownofNLGHGemissionsinmanufacturingsegments(MtCO2eq,2022)11Figure9:Developmentofeconomicoutput(volume)andNLGHGemissions(%,indexyear2000,2000–2022)11Figure10:Emissionreduction,ETSversusnon-ETS,excl.electricitysector(MtCO2eq,2013–2022)12Figure11:EmissionsreductionchoicesforNLindustry13Figure12:Finalenergyconsumptionbycarrier(PJ,NL1990-2022)15Figure13:FlowofenergysourcesintheNLenergysystem(2022),fromTotalPrimaryEnergy(TPE)toTotalFinalConsumption(TFC)bycarrierandbyend-user16Figure14:TotalFinalConsumptionbycarrier,excl.non-energyuseandlossessuchasgenerationanddistributionlosses(PJ,1990–2022)17Figure15:Consumptionofrenewableenergybyenergysource17Figure16:Changingshareofsentimentfortweetsmentioningbiomass(2013vs.2023)18Figure17:Energyconsumptionbysectorandcarrier(PJ,2022)19Figure18.Splitofenergyconsumptioninmobilitybetweenelectricity,oilproductsandnaturalgas20Figure19:Electricityproductionbysource(PJ,1990–2022)20Figure20:ImportandexportofenergycarriersintheNetherlands(PJ)22Figure21:Shareof(selected)sustainableenergytechnologiesinNLhouseholds,1990–202222Figure22:Operationalv.AnnouncedcapacityincleanenergytechnologiesintheNetherlands(March2023)23Figure23:Comparisonofchangingshareofsentimentfortweetsmentioningwindversustweetsmentioningsolar(2013vs.2023)24Figure24:Examplesofspeedofbuild-outrequiredtomeetaselectionofNLemissiontargets24Figure25:AllocatedSDE+(+)subsidiespertechnology,2011–2022(€M)25Figure26:Totalandper100.000capitaslowEVchargingpointsinEurope2633Deloitte'sEnergyTransitionMonitor9.AppendixSentimentAnalysisMethodologySentimentAnalysisDefinitionsGatherTranslateScoreActions•AccessTwitterAPItocollectrawdata.•Applysearchqueryfor"energietransitie"inDutchtweets.•Limitcollectiontothe1000mostpopulartweetsperyear.•FiltertweetsfortheDutchlanguage(proxyforlocationfilter).•SavetweetsandmetadatatoaCSVfile.•UtilizetheGoogleTranslateAPIfortranslation.•TranslateDutchtweetstoEnglishforcompatibility.•Translateeachtweetindividuallyforaccuracy.•SavetranslatedtweetstoaCSVfile.•Useapre-trained,open-sourcesentimentanalysismodelfromHuggingFacecalledTwitter-roBERTabaseforSentimentAnalysis.•Feedtranslatedtweetsintothesentimentanalysismodel.•Themodelassignssentimentlabels(positive,negative,neutral)basedontweetcontent.•SavefinaloutputtoaCSVfile.•Aggregateandperformanalyses.•Expandwithotherdatasources(populationdensity,provincialgeospatialdata).TermDefinitionSocialmediasentimentanalysisTheprocessofanalyzinganddeterminingtheemotionsandattitudesexpressedbyindividualsonsocialmediaplatformsregardingspecifictopics,suchastheDutchenergytransition,usingadvancedalgorithmsandtechniquestoassessoverallsentiment.PositivesentimentFavorableoroptimisticemotions,opinions,andattitudesexpressedbyindividualstowardaparticularsubject.Inthecontextoftheenergytransition,positivesentimentmayincludeexpressionsofsupport,enthusiasm,orbeliefinthebenefitsandeffectivenessoftransitioningtorenewableenergysources.NegativesentimentUnfavorableorpessimisticemotions,opinions,andattitudesexpressedbyindividualstowardaspecifictopic.Inthecaseoftheenergytransition,negativesentimentmayinvolvecriticisms,concerns,ordoubtsaboutthefeasibility,costs,orpotentialdrawbacksassociatedwithadoptingrenewableenergysolutions.34Deloitte'sEnergyTransitionMonitorEricVennixPartneratDeloitteNorthandSouthEurope–NetherlandsIndustryLeadEnergy,Resources&IndustrialsinNorthWestEuropeevennix@deloitte.nlNielsvanGroenendaelPartneratDeloitteNorthandSouthEurope–Netherlandsnvangroenendael@deloitte.nlPritiHoffmanaPartneratDeloitteNorthandSouthEurope–Netherlandsprhoffman@deloitte.nlTarekHelmiPartneratDeloitteNorthandSouthEurope–NetherlandsFutureofEnergyleaderNLthelmi@deloitte.nlWendyRudderPartneratDeloitteNorthandSouthEurope–Netherlandswrudder@deloitte.nlOscarSnijdersPartneratDeloitteNorthandSouthEurope–Netherlandsosnijders@deloitte.nlHeleneGeijtenbeekPartneratDeloitteNorthandSouthEurope–NetherlandsGlobalInnovationandInvestmentIncentivegroupleaderNLhgeijtenbeek@deloitte.nlJeroenvanderWalPartneratDeloitteNorthandSouthEurope–NetherlandsIndustrysectorleaderPower,Utilities&RenewablesNLjvanderwal@deloitte.nlEmilKwaaitaalPartneratDeloitteNorthandSouthEurope–NetherlandsOfferingleadArtificialIntelligence&Dataekwaaitaal@deloitte.nlMainAuthorsMainAuthorsOurinsightscanhelpyoutakeadvantageofchange.Ifyou’relookingforfreshideastoaddressyourchallenges,weshouldtalk.35Deloitte'sEnergyTransitionMonitorAmirDaneshbodi–adaneshbodi@deloitte.nlAntonioCambio–acambio@deloitte.nlBobEvers–boevers@deloitte.nlCarlijnQuik–cquik@deloitte.nlDarioRaffaele–draffaele@deloitte.nlFransGeurts–fgeurts@deloitte.nlGinoArcangeli–garcangeli@deloitte.nlHelenBosse–hbosse@deloitte.nlLaurensvanGiersbergen–lvangiersbergen@deloitte.nlMichalArament–marament@deloitte.nlNikooDelgoshaie–ndelgoshaie@deloitte.nlOscarKraan–okraan@deloitte.nlPetraZaal–pzaal@deloitte.nlRebeccaVisser–rebvisser@deloitte.nlRensVendrig–rvendrig@deloitte.nlRikSchuppers–rschuppers@deloitte.nlSimoneBom-sbom@deloitte.nlVincentBolwerk–vbolwerk@deloitte.nlWouterRocchi–wrocchi@deloitte.nlYushaKareem–ykareem@deloitte.nlAcknowledgementsThispieceofworkwouldnothavehappenedifnotfortheeffortsof:Wewouldalsoliketothankalltheintervieweesforsharingtheirknowledgeandperspectiveontheenergytransitionwithus.36Deloitte'sEnergyTransitionMonitorSourceReferences1Klimaatwet2CBS–StatLine-Hernieuwbareenergie;verbruiknaarenergiebron,techniekentoepassing(2022)3Energieakkoord4EURenewableEnergyDirective5NationalEnergyandClimatePlan(NEPC)oftheNetherlands6CBS-Warmtepompen;aantallen,thermischvermogenenenergiestromen1994-2021(2023)7DeloitteAnalysis8CBSStatLine–Emissiesbroeikasgassen(IPCC,2023)9Emissieregistratie–Overzichtstabellenlucht,broeikasgassen(2022)10RVO–Emissiefactoren(2022)11CBSStatLine–Energiebalans;aanbod,omzettingenverbruik(2022)12Eurostat–IMGR_FCO2:ForeignCO2emissionsembodiedingrossimports1995-2018(2023)13CBS“GasverbruikNederlandin2022laagstein50jaar”(13.02.2023)14NetherlandsEnterpriseAgency(RVO.nl)15Klimaatakkoord16InternationalPanelonClimateChange–FifthAssessmentReport(2014)17Eurostat–AiremissionsaccountsbyNACERev.2activity(2023)18Eurostat–Productioninindustry(2023)19Eurostat–Producerpricesinindustry,total,annualdata(2023)20CBSStatLine–Productieeninzetnaarenergiedrager(2022)21Emissieautoriteit–RapportagesencijfersEUETS,Emissiecijfers2013–2021(2022)22CBSStatLine–Elektriciteitenwarmte1998-2022(2022)23CBS“Uitstootbroeikasgassen9procentlagerin2022”(15.03.2023)24WorldBankNLGDP(constant2015USD)25CBSStatline-Population;keyfigures,1950-2022(2022)26CircularBio-basedEuropeJointUndertaking(cbe.europa.eu)27CBSStatLine–Biomassa;verbruikenenergieproductieuitbiomassapertechniek(2022)28Directorate-GeneralforClimateAction“Slightupturnin2022ETSemissionsduetoenergycrisisandreboundinaviation–butdecliningtrendmaintained”(24.04.2023)29TheOxfordInstituteforEnergyStudies-DutchGasProductionfortheSmallFields:Whyextendingtheirlifecontributestotheenergytransitions(2021)30CBSStatLine–EmissiesnaarluchtopNederlandsgrondgebied;mobielebronnen(2022)31EuropeanHeatpumpAssociation(ehpa.org)32NationalChargingInfrastructureAgenda(NAL).33InternationalEnergyAgency(IEA)34Eurostat–Passengercars,bytypeofmotorenergy(2021)35NationaalplanEnergie(NPE)36DeloitteEnergyTransitionProjectsdatabase.37Nuclearenergymarketconsultation38RVO–DutchOffshoreWindMarketReport39Vattenfall“StartenmetdebouwvanHollandseKust-Zuid”(23.03.2021)40KlimaatmonitorDatabank–AantalwoningenNederland(2023)41RVO–StimuleringDuurzameEnergieproductieenKlimaattransities(SDE++)(2023).42Handelsblatt“ElectricitygridoperatorTennetsees111billioneuroinvestmentrequirement”(14.03.2023)43ING“Dutchutilities:Addressingthecapexandopexchallenges”(01.02.2023)44Deloitte“Heatishot:Renewableenergyisthefuture”(accessed08.08.2023)45Alliander“AgreementonthetermsoftheGovernment’sshareholdingsinregionalgridoperators”(28.11.2022)46Gasunie“Gasunie:besluitwaterstofinfrastructuurismijlpaalvoorenergietransitie”(30.06.2021)47EuropeanAlternativeFuelsObservatoryAsusedhere,“Deloitte”meansDeloitteNetherlands,DeloitteGlobalorDeloitteConsultingLLP,asubsidiariesofDeloitteLLP.Pleaseseewww.deloitte.com/us/aboutforadetaileddescriptionofDeloitte’slegalstructure.Certainservicesmaynotbeavailabletoattestclientsundertherulesandregulationsofpublicaccounting.ThispublicationcontainsgeneralinformationonlyandDeloitteisnot,bymeansofthispublication,renderingaccounting,business,financial,investment,legal,tax,orotherprofessionaladviceorservices.Thispublicationisnotasubstituteforsuchprofessionaladviceorservices,norshoulditbeusedasabasisforanydecisionoractionthatmayaffectyourbusiness.Beforemakinganydecisionortakinganyactionthatmayaffectyourbusiness,youshouldconsultaqualifiedprofessionaladvisor.Deloitteshallnotberesponsibleforanylosssustainedbyanypersonwhoreliesonthispublication.Copyright©2023DeloitteDevelopmentLLC.Allrightsreserved.

1、当您付费下载文档后,您只拥有了使用权限,并不意味着购买了版权,文档只能用于自身使用,不得用于其他商业用途(如 [转卖]进行直接盈利或[编辑后售卖]进行间接盈利)。
2、本站所有内容均由合作方或网友上传,本站不对文档的完整性、权威性及其观点立场正确性做任何保证或承诺!文档内容仅供研究参考,付费前请自行鉴别。
3、如文档内容存在违规,或者侵犯商业秘密、侵犯著作权等,请点击“违规举报”。

碎片内容

碳中和
已认证
内容提供者

碳中和

确认删除?
回到顶部
微信客服
  • 管理员微信
QQ客服
  • QQ客服点击这里给我发消息
客服邮箱