ABUNDANT,AFFORDABLEOFFSHOREWINDCANACCELERATEOURCLEANELECTRICITYFUTUREGaryNorton/DOEEXECUTIVESUMMARYPlummetingcostsandtechnicalperformanceimprovementsofoffshorewindhavedramaticallyenhancedtheprospectsfornear-termpowersectordecarbonization.ThehighresourcequalityofoffshorewindintheUnitedStates,coupledwithrapidlyfallingtechnologycosts,makesitpossibleforoffshorewindtoprovide10-25%oftotalelectricitygenerationintheU.S.powersystemin2050withoutsubstantiallyimpactingwholesaleelectricitycosts.Thisreport,2035Report3.0,examinestheprospectofachieving90%cleanelectricityby2035and95%cleanelectricityby2050.Threescenarios—Low,Medium,andHighAmbition—detailtheelectricitysystemimpactsofincreasedoffshorewindgrowthproviding10-25%oftotalgeneration.Globalcarbonemissionsmustbehalvedby2030tolimitglobalwarmingto1.5degreesCelsiusandavoidthemostcatastrophicimpactsofclimatechange(UNIPCC,2023).WhiletheUnitedStatescontinuestomakeprogressonnationaldecarbonizationtrends,withincreasesincleanenergyproduc-tiondeliveringcutsinpowersectoremissions,2022stillsawaslightriseinthenation’soverallgreenhousegasemissions(RhodiumGroup,2023).FortheU.S.toachievenetzeroemissions,inwhichthenationemitsnomorecarbonintotheatmospherethancanberemoved,theU.S.mustsignificant-lyrampupcleanenergyproductionwhileelectrifyingothersectorsoftheeconomy,suchasbuildings,transportation,andindustry—likelycausingU.S.electricitydemandtotripleby2050.DennisSchroeder/NREL20353.0THEREPORTiAroundtheglobe,nationshavebeguntograsptheopportunityonthewaters.Theglobalpipelineofoffshorewindprojectsthathavebeenannouncedorareinpre-constructionphasesnowstandsatover700GW(GEM,2023).TheEuropeanUnionwillendeavortobuildnearly400GWofoffshorewindby2050,whileChinainstalled20GWinthelasttwoyearsalone(EuropeanCommission,2023;GWEC,2023).WhiletheBidenAdministrationhasatargettodeploy30GWofoffshorewindby2030and110GWby2050,increasingoffshorewindambitionbeyondthesecurrentgoalscouldacceleratethenation’stransitiontonetzeroemissions.THEUNITEDSTATESHASHIGH-QUALITYANDABUNDANTOFFSHOREWINDPOTENTIALTheUnitedStateshassomeofthehighestoffshorewindpotentialintheworld.Whencombined,theU.S.coastline,includingtheGreatLakesregion,hasthetechnicalpotentialofnearly4,000GWofoffshorewindcapacity.Over1,000GWofthispotentialishighlyproductive,withcapacityfactorsabove50%,suggestingoffshorewindcanprovideaffordableandreliablecleanenergygenerationacrossthenation.OFFSHOREWINDCANBEINTEGRATEDINTOTHEU.S.POWERGRIDWITHOUTIMPACTINGWHOLESALEELECTRICITYCOSTSOffshorewindcostshavedroppedrapidlyoverthepastfewyears,andtheDepartmentofEnergy(DOE)forecastspricestofallto$53/MWhby2035,cheaperthanthelevelizedcostofanewcombinedcyclegasplantorcoalplant,andonparwithexistingsolarandwindprojects(WETO,2023).Asaresultofimprovedperformanceandfallingcosts,wholesaleelectricitycosts(thecostofgenerationplusnewtransmission)arecomparableinallOffshoreWindPolicyscenarios.WholesaleelectricitycostsintheHighAmbitionscenario,inwhichthenationdeploys750GWofoffshorewindby2050,arejust2.2%higherin2035thanaBaselinescenariowithminimaloffshorewinddeploymentand0.25%higherthanBaselinein2050.WholesaleelectricitycostsintheLowandMediumAmbitionoffshorewindscenariosarebothlowerthanBaselinein2050.20353.0THEREPORTiiOFFSHOREWINDCOMPLEMENTSLAND-BASEDRENEWABLESTOMEETINCREASEDELECTRICITYDEMANDINANETZEROECONOMYToachievenetzerocarbonemissionseconomy-widerequirestheeliminationoffossilfuelsandthetransitiontoelectricend-uses(suchaselectricvehiclesandheatpumps),whichwilllikelyleadtoatriplinginelectricitydemandby2050.Thenationwillhavetosignificantlyincreaseannualdeploymentsofcleanenergyresourcesandexpandtheavailablesuiteoftechnologiesinordertomeetfuturecleanenergygenerationneeds.Anexpandedcommitmenttooffshorewindcouldbolsterthetechnologysuchthatoffshorewindcouldsupport10-25%ofthenation’selectricitydemandby2050.AchievingnetzeroemissionsintheU.S.requirestheinstallationofover3,500GWofnewrenewableresourcesthrough2050.Theannualdeploymenttargetsacrossallscenariosareambitious,requiring100GWofnewland-basedsolarandwinddeployedeachyearthrough2050onaverage,andnearly40GWofnewoffshorewindeachyearbetween2035-2050.WhiletheU.S.installedarecord28GWofrenewablecapacityin2021,achievingnetzerogoalswithoutoffshorewindwillrequirethenationtoinstallland-basedwindandsolaratfivetimesthatrate.Increasingoffshorewinddeploymentswouldreducetheland-basedinstallationratetothreeorfourtimes2021levels.SCALINGTHEOFFSHOREWINDSUPPLYCHAINWILLREQUIRESIGNIFICANTCAPITALINVESTMENTANDROBUSTDOMESTICPOLICYSUPPORTThedevelopmentofarobustoffshorewinddomesticsupplychainisanecessarysteptowardsachievingtheUnitedStates’ambitiouscleanenergygoals.WhileresearchershaveidentifiedapathwaytodevelopingthesupplychainsneededtosupporttheBidenAdministration’s30GWby2030target,scalingtheoffshorewindindustrybeyondthatwillrequiretargeteddomesticpolicysupportandinfrastructureinvestment.Inorderforoffshorewindtoprovide10-25%ofthenation’selectricityneeds,cumulativeinvestmentinthesupplychainwouldneedtoexceed$260billionthrough2045.Manufacturingtheamountofblades,nacelles,towers,andcablesrequiredtomeettheMediumandHighAmbitiontargetswillrequireafourorfivefoldincreaseintheestimatednumberoffacilitiesneededtomeetthe30GWby2030target.LackofportcapacityandwindturbineinstallationvesselswilllikelyremainthelargestbottlenecktoscalingtheU.S.offshorewindindustry.20353.0THEREPORTiiiHIGH-QUALITYOFFSHOREWINDISAVAILABLEACROSSALLCOASTALSTATES,EXPANDINGTHEAREAAVAILABLEFORDEPLOYMENTWHILEDISPERSINGECONOMICBENEFITSACROSSTHENATIONTheU.S.isfortunateinitsabundantcoastlineandhigh-qualitywindpotentialacrossallmajorcoastalareas.ThequalityoftheoffshorewindresourcesuggeststhattheU.S.candeploysignificantnewoffshorewindcapacityalongtheU.S.coastline,bringingcleanenergyandtheaccompanyingeconomicbenefitstoamajorityofthepopulation.Asoffshorewinddeploymentincreases,theareadirectlyimpactedbyrenewableenergyinfrastructuredecreasesrelativetotheBaselinescenario.Becauseofthehighpowerdensityofoffshorewindresources,theU.S.couldgeneratemorecleanpoweronasmallerfootprintoffshore.COORDINATEDTRANSMISSIONPLANNINGCANREDUCEINTERCONNECTIONCOSTSANDACCELERATEDEPLOYMENTTIMELINESAnetzeroelectricitygridwillrequiresignificantnewinvestmentintransmissioninfrastructureinordertodistributecleanenergygenerationacrossthenation.Thetransitiontonetzerowillrequiredoublingexistingtransmissioninfrastructure.Byclusteringmultipleoffshorewindfarmstogetherandconnectingthemtotheonshoregridusingasingle,high-voltagetransmissionline,offshoretransmissioninvestmentscanbereducedbyapproximately35%relativetoabusiness-as-usualtransmissionapproach.Clusteringenablesdeveloperstobuildfewer,highercapacitylineswhichreducestotalassetsandminimizesenergylosses.Offshorewindprovidesanopportunitytoreimaginethetransmissionplanningprocessandavoidthebottlenecksthathaveplaguedland-basedrenewableenergydeployment.OFFSHOREWINDGENERATIONCANSUPPORTADEPENDABLEGRIDTOMEETNEAR-NETZEROEMISSIONSAdiverseportfolioofcleanenergytechnologies,bolsteredbyhighlyproductiveandwidelydeployedoffshorewind,iscriticaltoensuringfuturegriddependabilitywiththeanticipatedincreaseinenergydemandthrough2050.Notonlyisoffshorewindanabundantresource,itsgenerationpatternsareparticularlycomplementarytoexistingland-basedwindandsolarandwell-matchedtoelectricitydemandtrends.Overthecourseofanaverageyear,offshorewindcanpairwithothercleanresourcestoprovidenearly95%oftotalelectricitygenerationin2050.20353.0THEREPORTivSCALINGTHEDOMESTICOFFSHOREWINDINDUSTRYCOULDCREATENEARLY390,000JOBSANDSPURECONOMICACTIVITYACROSSTHECOUNTRYWhenisolatingtheimpactsofjustoffshorewinddevelopment,theHighAmbitionoffshorewindpolicyscenariocouldsupportapproximately390,000jobsacrosstheeconomyin2050.Ascenarioinwhichagreaterpercentageofgoodsandmaterialsaresourceddomestically—apolicygoaloftheInflationReductionAct—leadstoadditionaljobcreation,whileexpandingemploymentandeconomicbenefitsacrosstheentirecountry.ThebenefitsofoffshorewindthusexpandfarbeyondtheU.S.coastline.DIVERSIFYINGTHECLEANENERGYMIXTOPOWERANETZEROFUTUREScalingtheoffshorewindindustrytoprovide10-25%oftotalelectricitygenerationin2050willrequireanambitious,long-termpolicyagenda,robustindustrialpolicysupport,andlargeinvestmentsinthesupplychain,infrastructure,andtransmissionsystems.Inordertoachievenetzerotargets,theU.S.willneedtodeploynewrenewableenergycapacityatnearlyfourtimestoday’sannualrateofdeployment.Butthebenefitscanbehuge—developmentoftheU.S.offshorewindindustrywouldprovideahighlyproductive,reliablecleanenergyresourceneededtohelpachievea2050economy-widenetzerotarget,alongsideambitiousland-basedrenewableenergydevelopment.20353.0THEREPORTvTABLEOFCONTENTSExecutiveSummaryiIntroduction1Scenarios,Data,andMethods6OffshoreWindPotentialandProfiles7PowerSectorAnalysis8GridDependabilityAssessment8KeyAssumptions9ScenarioDesign11KeyFindings15TheUnitedStateshashigh-quality,17abundantoffshorewindresourcesOffshorewindcanbeintegratedinto19theU.S.powergridwithoutimpactingwholesaleelectricitycostsrelativetoBaselineOffshorewindcomplementsland-based21renewablestomeetincreasedelectricitydemandinanetzeroeconomyScalingupthesupplychainwillrequire26significantcapitalinvestmentandrobustdomesticpolicysupportHigh-qualitywindresourcesoffthe31shoresofallcoastalstatesincreasesopportunitiesfordeploymentwhiledispersingeconomicbenefitsacrossthenationCoordinatedtransmissionplanningcan36reduceinterconnectioncostsby35%andacceleratedeploymenttimelinesOffshorewindgenerationcaneffectively41balanceland-basedrenewablegenerationtosupportadependablegridScalingthedomesticoffshorewind46industrycouldcreatenearly390,000jobsandspureconomicactivityacrossthecountryConclusion50Additional2035ReportResources51References52NAMESANDAFFILIATIONSOFAUTHORSUmedPaliwal1@,NikitAbhyankar1@,TaylorMcNair2,JoseDominguezBennett1,DavidWooley1,JamieMatos1,RicO’Connell2,AmolPhadke1@1�UniversityofCalifornia,Berkeley,GoldmanSchoolofPublicPolicy2GridLabLeadAuthors@CorrespondingAuthorsMartySchwarzNationalRenewableEnergyLaboratoryMattShieldsNationalRenewableEnergyLaboratoryPatrickGillmanDepartmentofEnergyAmberHewettNationalWildlifeFederationLaraSkinnerClimateJobsInstitute,CornellUniversityEmmaRebhornClimateJobsNationalResourceCenterSushmaRaghavanClimateJobsNationalResourceCenterJuanGuevaraClimateJobsNationalResourceCenterStephanieMcClellanTurnForwardSaraParkinsonTurnForwardCatherineBowesTurnForwardArneJacobsonSchatzEnergyResearchCenter,CalPolyHumboldtEddieAhnBrightlineDefenseSarahXuBrightlineDefenseKathleenFrangioneOrstedJustinSharpSharplyFocusedBethTresederEquinorNicoleDiPaoloBlueGreenAllianceJBTengcoBlueGreenAllianceJessicaEckdishBlueGreenAllianceACKNOWLEDGEMENTSThefollowingpeopleprovidedinvaluabletechnicalsupport,input,andassistanceinmakingthisreportpossible:MaggieCaldwell,HarrisonCarpenter-Neuhaus,DanielleCrockett,TinaLi,ElianaMiller,RenePolanco,MonikaSharma,ElisabethSoto,CourtneySt.John,ClimateNexusCaseyBaker,KyraNgai,PriyaSreedharan,GridLabGregAlvarez,ToddFincannon,SilvioMarcacci,MichaelO’Boyle,MichelleSolomon,SarahSpengeman,EnergyInnovationSimoneCobb,GoldmanSchoolofPublicPolicy,UniversityofCalifornia,BerkeleyChaniWiggins,WinnStrategiesAnnieDore,BeeSpringsDesignsAnyaBreitenbach,Forge&FoundryChristopherJylkka,TomJones,DaymarkEnergyAdvisorsAnnFurbush,RosieHayward,IstvànHeilmann,DanHodge,JonStenning,CambridgeEconometricsBelowarethemembersoftheTechnicalReviewCommittee(TRC).TheTRCprovidedinputandguidancerelatedtostudydesignandevaluation,butthecontentsandconclusionsofthereport,includinganyerrorsandomissions,arethesoleresponsibilityoftheauthors.TRCmemberaffiliationsinnowayimplythatthoseorganizationssupportorendorsethisworkinanyway.FundingforthisreportwasprovidedbyOceankind,theEnergyFoundation,andAnita&JoshBekenstein.SUGGESTEDCITATIONPaliwal,U.,Abhyankar,N.,McNair,T.,Bennett,J.D.,Wooley,D.,Matos,J.,O’Connell,R.andPhadke,A.2023.2035andBeyond:Abundant,AffordableOffshoreWindCanAccelerateOurCleanElectricityFuture.GoldmanSchoolofPublicPolicy,UniversityofCalifornia,Berkeley.ABOUTGRIDLABGridLabisaninnovativenon-profitthatprovidestechnicalgridexpertisetoenhancepolicydecision-makingandtoensurearapidtransitiontoareliable,costeffective,andlowcarbonfuture.ABOUTENERGYINNOVATIONEnergyInnovationisanenergyandclimatepolicythinktankthatproducesindependentanalysistoinformpolicymakersofallpoliticalaffiliationsintheworld’slargestemittingregions.EnergyInnovationdeliversobjective,science-basedresearchtopolicymakersandotherdecision-makersseekingtounderstandwhichpoliciesaremosteffectivetoensureaclimatesafefutureforall.ABOUTUCBERKELEY’SCENTERFORENVIRONMENTALPUBLICPOLICYTheCenterforEnvironmentalPublicPolicy,housedatUCBerkeley’sGoldmanSchoolofPublicPolicy,takesanintegratedapproachtosolvingenvironmentalproblemsandsupportsthecreationandimplementationofpublicpoliciesbasedonexactinganalyticalstandardsthatcarefullydefineproblemsandmatchthemwiththemostimpactfulsolutions.INTRODUCTIONGlobalcarbonemissionsmustbehalvedby2030tolimitglobalwarmingto1.5°Celsiusandavoidthemostcatastrophicimpactsofclimatechange(UNIPCC,2023).Mostexistingstudies,includingtheoriginalreportthatlaunchedthe2035Reportseriesin2020,demonstratethatacombinationofland-basedwind,solar,andbatterystoragecancost-effectivelydecarbonizemuchoftheU.S.powersector(Phadkeetal.,2020).However,thepathtowardsU.S.decarbonizationwillbeunprecedented,requiringextensiveannualdeploymentsofcleanenergy,aswellassignificantpolicyreform.Theoriginal2035Report:PlummetingSolar,Wind,andBatteryCostsCanAccelerateourCleanElectricityFuture(2035Report1.0)chartedafeasibleandcost-effectivepathwaytoreach90%cleanelectricityby2035(Phadkeetal.,2020).Thesecond2035Report:PlummetingCostsandDramaticImprovementsinBatteriesCanAccelerateOurCleanTransportationFuture(2035Report2.0)expandedonthisanalysisbymodelingtheincreaseddemandfromtheelectrificationofthetransportationsector(Phadkeetal.,2021).Thisreportbuildsonpreviousassessments,examiningpotentialpathwaysto90%cleanelectricityby2035and95%cleanelectricityby2050andmeetingincreasedloadfromtheelectrificationofbuildings,transportation,andindustry,whiledeployingsignificantamountsofnewoffshorewindcapacity.Withatargetedcommitment,offshorewindcouldsupport10-25%ofthenation’selectricitydemandby2050.2035Report3.0looksbeyondtheoriginaltargetof90%cleanelectricityby2035,withamoreambitiousgoalofachievingnear-netzerocarbonemissionseconomy-wideby2050.Thisreportfocusesonhowtherapiddeploymentofoffshorewindcanhelpachievenear-andlong-termdecarbonizationtargets,evenasthetechnologytoachievethefinal5%-10%ofpowersectordecarbonizationisrapidlyevolving.Theyear2035isacriticalinflectionpointonthenation’sjourneytowardsnetzeroemissions.TheU.S.willneedtocontinuetodiversifythesetofcleanenergytechnologiestomeetrisingelectricitydemand,whilesimultaneouslybuildingoutthegridandsupportingindustriestobringwidespread,cost-effectivepower.Offshorewindisapowerfulandscalabletechnologytohelpmeetthoseneeds.20353.0THEREPORT1Offshorewind’splummetingcostsandmarkedperformanceimprovementshaveledtotheindustry’srapidexpansionworldwideanddramaticallyenhancedtheprospectsfornear-termpowersectordecarbonization.Offshorewindcostsareestimatedtofallnearly30%by2035,toapproximately$53/MWh(WETO,2023).Reducingthecostofoffshorewindinothercountrieshasrequiredaholisticapproach,usinggovernmentpoliciestoprovidelong-termcertaintytoanascentindustry,whileaddressingtransmission,port,vessel,andsupplychainconstraints.Despiteafederalcommitmenttoachievenetzeroemissionsby2050,theU.S.stilllagsbehindtherestoftheworldinoffshorewindambitionanddeployment.TheU.S.hasagoaltodeploy30GWofoffshorewindby2030,andhasacurrentprojectpipelineofapproximately50GW(ACP,2023).Thispipelinewouldlikelymeetlessthan2%ofthenation’selectricitydemandin2050.Asof2022,cumulativeinstalledglobalcapacityofoffshorewindreachedmorethan55GW,with709GWofprojectsintheinternationalpipeline(GEM,2023).Asoffshorewinddeploymentandassociatedcostreductionscontinue,nationshaverecognizedtheneedtoincreasetheambitionoftheiroffshorewindtargetstoleveragethispromisingtechnologyandreapfurthereconomicbenefits.LeadershiphasbeenmostpronouncedinEuropeandChina(Figure1).Chinainstalled20GWofoffshorewindinthelasttwoyears(GWEC,2023).TheUnitedKingdom(U.K.),withannualelectricitydemandlessthan10%thatoftheUnitedStates,hasalreadyinstalled13GWofoffshorewind,whichprovides13%ofthenation’selectricitygeneration.TheU.K.planstoexpandoffshorewindfromthecurrent13GWto50GWby2030,comprisingmorethan50%oftotalgeneration(NationalGridESO,2023;ACP,2023).NineEuropeannationsincludingtheU.K.recentlyannouncedatargettodeploy300GWofoffshorewindintheNorthSeaby2050(Henley,2023).AchievingasimilarscaleintheU.S.wouldimplyanationaloffshorewindtargetofatleast400-500GWby2050.DennisSchroeder/NREL20353.0THEREPORT2706050403020100OFFSHOREWINDINSTALLEDCAPACITY(GW)2010201120122013201420152016201720182019202020212022ChinaU.K.U.S.GermanyTaiwanNetherlandsDenmarkBelgiumOtherFIGURE1.Cumulativeinstalledglobalcapacityofoffshorewind,2022.DataSources:BNEF,2022;GWEC,2023.EventhoughtheUnitedStateshassomeofthestrongestoffshorewindresourcesintheworld,thefirsttwolarge-scaledomesticoffshorewindplantsareonlyjustenteringintoservicein2023.TheextensiveU.S.coastlineandstrongseawindshavethetechnicalpotentialofnearly4,000GWofoffshorewindcapacity—approximatelyfourtimestheamountofcapacityoftheentireU.S.powergridtoday.SelectareasofftheU.S.coastlineofferenoughwindresourcetogenerate1,000GWofenergywithcapacityfactors1greaterthan50%.Someofthebestwindresourcesinthecountrysitjustoffthecoastofmajorpopulationcenterswithsignificantelectricitydemand,includingtheNortheastcorridorandCaliforniacoast.Similartoearlierforecastsforsolarandland-basedwindresources,experts’costprojectionscontinuetoproveconservativewhencomparedwithrapidreal-worlddeclinesincost.Levelizedcostofelectricity(LCOE)projections,suchasthoseproducedintheNationalRenewableEnergyLaboratory’s(NREL)AnnualTechnologyBaseline(ATB),consistentlyneedtobereviseddownwardtomatchmarketbehavior(Figure2)(NREL,2022).ExpertsforecastaverageU.S.offshorewindLCOEpricestofallto$53/MWhby2035,belowtheaveragepriceofanewcombinedcyclenaturalgasplantandonparwithexistingsolarandwindplants(DOE,2023).Recognizingtheabilitytobeattheseforecasts,theDepartmentofEnergyhasa“FloatingOffshoreWindShot”goaltodeploy10GWoffloatingoffshorewindby2035andreducecoststo$45/MWh(EERE,2023).1Capacityfactorisdefinedastheratioofenergyproducedbyageneratorinagivenperiodoftimerelativetothetotalamountofenergythatthegeneratorcouldhaveproducedoperatingatfullpowerduringthattime.Itisameasureofhowproductivethatparticulargeneratingtechnologyis.20353.0THEREPORT3200180160140120100806040200OFFSHOREWINDLCOE$/MWh[2020REAL]20052010201520202025203020352040CHINAGERMANYTAIWANATB2015ATB2017ATB2022USUKFIGURE2.NRELAnnualTechnologyBaselineAdvancedcostprojectionsforyears2015,2017,and2022.LevelizedcostofelectricityforselectedoffshorewindprojectsinChina,Taiwan,UnitedStates,UnitedKingdom,andGermany.Allprojectcostsarein$2020real.DataSource:BNEF,2022.OffshorewindlevelizedcostofelectricityprojectionsaredetailedfortheyearinwhicheachprojectionwasmadeintheNRELATB(NRELATB2015,2017,2022)usingNRELATBAdvancedcostprojectionsforClass1(FixedBottom)offshorewindresources.LCOEprojectionsareillustratingtheconsistentdownwardrevisionofcosts.Theindividualmarkersrepresentcommerciallyoperatingoffshorewindprojectsthroughouttheworld,whichconsistentlyfallbelowprojectedLCOEs.WhiletheUnitedStatescontinuestomakeprogressonnationaldecarboniza-tion,achievingnetzeroemissions,inwhichthenationemitsnomorecarbonintotheatmospherethanitremoves,requiressignificantlyrampingupcleanenergyproductionwhileelectrifyingothersectorsoftheeconomy,suchasbuildings,transportation,andindustry.WeforecastthissolutionwillcauseU.S.electricitydemandtotripleby2050,requiringevengreaterreductionsinthepercentageofelectricityproducedfromfossilfuelsandsustainedrap-iddeploymentofcleanenergytechnologiesthrough2050.Thistrajectoryiscriticaltomeetournationalclimategoalsandlimittheworstimpactsofclimatechange.Offshorewindcanhelpmeetthisdramaticincreaseindemand,complementingexistingland-basedcleanenergyresourcesandprovidingabundantenergyduringcriticalpeakperiods.Theracetodeploynewcleanenergyresources20353.0THEREPORT4isincreasinglycrowdedandcomplex.Inordertomeetnetzerotargets,thenationmustdeployrenewableresourcesatfivetosixtimestherateofdeploymentin2022.Acceleratingcleanenergydevelopmentonlandandfurtherexpandingdeploymenttothewaterwouldhelpmeettheseambitiousgoalsanddefraysomeoftheland-useconstraintsfacingabusiness-as-usualapproachtoreachingnetzero.TheU.S.ExclusiveEconomicZone2(EEZ)isthelargestintheworld.ThecontiguousEEZmeasuredinthisstudycomprises2.7millionsquarekilometers,nearlyone-thirdthesizeofthecontiguousUnitedStates.Withappropriatepolicysupport,enhancedenvironmentalscreeningandsitingatscale,proactiveandholistictransmissionplanningapproaches,androbustsupportforsupplychainandportexpansion,thisspacecanserveasacriticalhubofnewcleanenergygeneration.Bycontinuingtodiversifythecleanenergymixwithcost-effectiveresourcessuchasoffshorewind,thenationincreasestheoddsofmeetingnetzeroambitionsequitably.Goingbigonoffshorewindwouldalsoprovideeconomicbenefitsacrossthecountry.Employmentanalysissuggeststhatthroughrobustsupplychaindevelopment,anambitiousoffshorewinddeploymenttargetcouldsupportnearly390,000newjobsnationwidein2050.Whiletherearesignificantsupplychainhurdlestoovercome,effortstoscalewindtechnologymanufacturingnowcanhelptheU.S.establishtheproduction,operational,distribution,andmaintenanceinfrastructurerequiredtomeetcleanenergytargets—makingitmorelikelytoavertthemostextremecatastrophesrelatedtoclimatechange.Afterabriefdescriptionofmethods,scenarios,anddatainthefollowingsection,keyfindingsofthe2035Report3.0aresummarized.Thereport’sappendicesprovidedetailsoftheanalysesandresults.AcompanionreportfromEnergyInnovation,PolicyPrioritiestoEnsureOffshoreWindPlaysaCentralRoleinourNet-ZeroFuture,outlineskeypolicyrecommendationstosupportambitiousoffshorewindgoalsandovercomedeploymentbarriers(EnergyInnovation,2023).AnotherrelatedreportfromDaymarkEnergyAdvisorsexploresthepotentialofanoffshoretransmissionbackbonetofacilitatereliabilityandcostreductions(DaymarkEnergyAdvisors,2023).AsupportingreportfromCambridgeEconometrics,highlightstheeconomicandemploymentbenefitsoflarge-scaleoffshorewinddeployment(Hodgeetal.,2023).OnefinalreportfromUCBerkeleyevaluatesthesupplychain,port,vessel,andinvestmentrequirementsofanationaloffshorewinddeploymentstrategy(Matos,Wooley,2023).2200nauticalmilesfromthecoast,excludingstatewaters.20353.0THEREPORT5SCENARIOS,DATA,ANDMETHODSThisreportcombinesthelatestrenewableenergyandtransmissioncostandperformancedatawithstate-of-the-artpowersystemsmodelingtodemonstratethetechnicalandeconomicfeasibilityofachieving90%carbon-free3(“clean”)electricityby2035and95%cleanelectricityby2050whileexpandingoffshorewindcapacity.WhiletheBidenadministrationhasagoalofachieving100%cleanelectricityby2035,eachscenariointhisreportincludingthebaselinescenarioexamines90%cleanelectricityby2035and95%in2050.Thismodelingapproachavoidsthecomplexityofmodelingfullydecarbonizedsystems,instead,focusingoncommerciallyviabletechnologiesthatcancontributesignificantnear-termpowersystemsemissionsreductions.Whilewedonotallowthemodeltodeploynewfossilfuelresources,themodelcanchoosenewgreenhydrogenfueledcombustionturbines.4Themodelmayalsochoosetodeploybatterystoragetechnologyindurationsof2,4,6,8,or10hours.ConsistentwithEPA’srecentregulationsonexistingcoal-firedpowerplants,wealsoforcethemodeltoretireallunabatedcoalcapacityby2035.Thisanalysisbuildsonthemethodsandresultsdevelopedinthe2035Report1.0,onceagaindemonstratingthetechnicalandeconomicfeasibilityoftheUnitedStatesachieving90%cleanelectricityby2035(Phadkeetal.,2020).2035Report3.0goesbeyondthescopeof2035Report1.0toexplorehowtargeteddeploymentofoffshorewindcanhelpcoverdramaticdemandincreasesfromtheelectrificationoftransportation,industry,andbuildingsandmeetnear-netzerogoalsby2050.Notonlydoesthisreportlookatalongertimehorizon,ittakesamorecomprehensivelookatnetzero-alignedelectricitydemandgrowthwhilefocusingonthepotentialcontributionsofoffshorewind,aresourcethatwasnotincludedineitherthe2035Report1.0or2.0analysis.3Generationfromanyresourcethatdoesnotproducedirectcarbondioxideemissionsisconsidered“clean”inthisanalysis,includinggenerationfromland-basedandoffshorewind,solar,geothermal,nuclear,biomass,andhydropower.4Inthisstudy,renewablecombustionturbinesarecombustionturbinesthatusegreenhydrogenasfueltopoweraturbineandproduceelectricity.20353.0THEREPORT6OFFSHOREWINDPOTENTIALANDPROFILESWeidentifiedandcreatedresourceprofilesforpotentialsuitableoffshorewindplantsitesalongtheU.S.coastline,includingtheGreatLakes,basedondataandtoolsfromNREL,theNationalAeronauticsandSpaceAdministration(NASA),andtheInternationalEnergyAgency(IEA).WereliedonmethodsdetailedinNREL’sresourcepotentialdatasettoidentifyapproximately10,000suitableoffshorewindplantsitesacrosstheU.S.at11.5kmspatialresolution(Lopezetal.,2022).Tobegin,weestablishedthetotaloceanareawithintheU.S.ExclusiveEconomicZone(200nauticalmilesfromthecoast,excludingstatewaters),includingtheGreatLakes.Wethenremovedanyareaswithwaterdepthsgreaterthan1,300meters,conservationareas,marineprotectedareas,shippinglanes,dangerzones,submarinecables,militaryareas,shipwrecks,oceandisposalsites,oil/gaspipelines,platforms,andotherexistinginfrastructure.Whilethisrepresentsarobustmodelingapproach,inreality,additionaloceanusesariseduringtheleasing,siteidentification,andenvironmentalreviewprocessesthatwillfurtherrestrictthetotalavailableareaforoffshorewinddevelopment.Todevelophourlywindgenerationprofiles,weusedmeteorologicaldatasuchashourlywindspeeds,winddirection,pressure,andtemperaturefromNASA’sMERRA-2reanalysisproductandthenusedtheGlobalWindAtlasdatasettodownscalethewindspeedsateachsite(GlobalWindAtlas,2022;NASA,2023).WethenusedNREL’sSystemAdvisorModel(SAM)tosimulateoffshorewindgenerationateachofthese10,000sites(Blairetal.,2018).WeusedthepowercurvefromInternationalEnergyAgency’s(IEA)15MWoffshoreReferenceTurbine,whichhasarotordiameterof240metersandahubheightof150meters(Gaertneretal.,2020).5Wemodeledhourlygenerationfora600MWwindfarmconsistingof40turbinesof15MWeacharrangedinarectangularshapewith8rowsand5columns.TheSAMmodeltakesasinputwindspeeds,winddirection,pressure,temperature,andturbinepowercurve,andoutputshourlywindgenerationforafarmconsideringtheimpactofwakeeffectsusingtheSimpleWakeModelinSAMand10%electricallosses.TheSimpleWakeModelusesthewindspeeddeficitfactortoestimatethereductioninwindspeedatadownwindturbineduetothewakeofanupwindturbine.Pleaserefertotheappendixformoredetails.5WevalidatedaveragewindspeedsdevelopedforthisanalysiswithNREL’slatestwindspeeddatasetforthreecallareasinCaliforniaandfoundthatourwindspeedestimatesmatchcloselywiththoseofNREL’s(Optisetal.,2020).Althoughwehaveusedindustry-standardweatherdatasetsthatarewidelyused,additionalworkisneededtocorrectanysystemicweatherandterrainbiases.20353.0THEREPORT7TheoffshorewindpotentialandprofileanalysisutilizesthesamemethodologyasNREL,updatedtoreflectcommerciallyavailabletechnologyandimprovedperformancestandards.Ourupdatedanalysisusesalargerturbinedeployedathigherhubheights,reflectiveofthestandardtechnologyinusetoday.Newer,higherperformingturbinesdeployedathigherhubheightshavetheeffectofincreasingaveragecapacityfactorsandthusincreasingtotalenergygeneration.POWERSECTORANALYSISWeperformedstate-of-the-artpowersectormodelingtoevaluatepotentialpathwaysfordecarbonizationusingNREL’sopen-source,capacity-expansionReEDSmodelandEnergyExemplar’sPLEXOSmodelingtool(NREL,2023;EnergyExemplar).Weutilizedpubliclyavailablegenerationandtransmissiondatasets.Forecastsofoffshorewindtechnology,renewableenergy,andbatterystoragecostsarebasedonNREL’s2022ATB(NREL,2022).ATBincludesthreeforecastsforalltechnologies:•A“Moderate”ormid-costcase.•An“Advanced”orlow-costcasethatassumesmoreaggressivecostdeclinesduetotechnologyadvancementandlearning.•A“Conservative”orhigh-costcasethatassumesslowercostdeclines.TheoffshorewindprofilesandcapacityfactorsdevelopedusingtheIEA15MWReferenceTurbineatahubheightof150meterswerethenappliedtotheReEDSmodel.Adetaileddescriptionofmodelingtoolsandassumptionscanbefoundintheappendix.GRIDDEPENDABILITYASSESSMENTReplicatingthemethodologyfromprevious2035Reports,weanalyzedthesensitivityoftheHighAmbitionoffshorewindscenariotoperiodsofextremelylowcleanenergygenerationand/orhighdemandinordertoensurethatthesystemcandependablymeetdemand(Phadkeetal.,2020;Phadkeetal.,2021).Thepowersystemsanalysisconsiderstheperformanceofeachofthemorethan20,000individualgeneratingunitsontheU.S.powergridandallmajortransmissioninterfaces.WeutilizedthePLEXOSproductioncostmodeltosimulatehourlyoperationofthepowersystem,atotalof60,000hoursoversevenuniqueweatheryears.20353.0THEREPORT8Inordertoprovethatthesystemisdependable—suchthatthegenerationsupplyisabletomeetdemandatalltimes,includingperiodsoflowrenewableenergygeneration,highintermittency,andpeakload—wemodeledeachhourwhileabidingtospecifictechnicalconstraints,suchasramprates,minimumgenerationrequirements,andminimumreserverequirements.TheGridDependabilityAssessmentonlyassessesthegenerationimpactsoftheHighAmbitionscenario,inordertodemonstratethedependabilityofagridoperatingwithextremelyhighlevelsofoffshorewindandotherrenewableenergygeneration.Whilethisrepresentsatechnicallyrigorousapproachtoevaluatingnationwidepowersystemsperformance,furtherdetailedanalysisisrequiredtoevaluatetheimpactof95%cleangenerationonlocalreliabilityandresourceadequacy.AfulldescriptionofthepowersystemsmethodologyisdetailedintheAppendix.KEYASSUMPTIONSTheresultsofthisanalysisarelargelydrivenbyanumberofkeyassumptions,includingtechnologycostandperformance,sitingconstraints,andcleanenergypolicy.Weconsideredthreesetsoffuturerenewableenergycosts,utilizingtheNRELATBcostprojections(NREL,2022).WealsoutilizedNREL’sprimarysitingconstraintstoevaluatesensitivitytotheavailabilityoflandforrenewableenergydeployment(Lopezetal.,2021).WeevaluatedtwosensitivitiesdevelopedbyNRELonthesitingofland-basedrenewableenergy,ReferenceandLimited.TheLimitedcasehasmorestringentsitingconsiderations,suchashighersetbacksfrombuildingsandcivilinfrastructure.Forexample,land-basedwindresourcesintheLimitedsitingsensitivityrequiresetbacksofthreetimestheturbinetipheight,cannotdevelopwithinaradarlineoftheturbine(frommilitaryorweatherradar),andcannotdeveloponanyfederallands.Ineffect,theLimitedsitingsensitivitysignificantlyreducestheareaavailableforland-basedrenewableenergydevelopment,particularlywind,whilesolarislessaffectedduetotheabundanceofsuitablesites.Theoffshoretransmissionnetworkwasmodeledwithtwosensitivities,whicharefurtherdetailedinKeyFindings:•Singleplantapproach:eachindividual600MWoffshorewindplantisconnecteddirectlytotheonshoretransmissionnetwork.•Clusteredapproach:asinglelineconnectsmultiple600MWoffshorewindplantsdirectlytotheonshoretransmissionnetwork.20353.0THEREPORT9AfulldescriptionofthetransmissionanalysisisdetailedintheKeyFindingssection,theAppendix,andasupportingreportfromDaymarkEnergyAdvisors.WeassumetheU.S.reachesnear-netzeroemissionseconomy-wideby2050.Thisimpliesaggressiveelectrificationofthetransportation,buildings,andindustrialsectors,aswellasarapidexpansionofgreenhydrogenproductionforuseinindustry(Figure3).Weutilized:•The2035Report2.0assessmentofadditionalelectricitydemandfromtransportationelectrification(Phadkeetal.,2022).•Acombinationofothertoolsandsources,suchasEnergyInnovation’sEnergyPolicySimulator,thePrincetonNet-ZeroAmericaStudy,andNREL’sElectrificationFuturesStudytoassesstheelectrificationdemandfromindustriesandbuildingsfornearnet-zeroemissions(Orvisetal.,2022;Larsonetal.,2021;andMurphyetal.,2021).•TheEnergyPolicySimulatorandNREL’sExaminingSupply-SideOptionstoAchieve100%CleanElectricityby2035(Denholmetal.,2022)toestimatethehydrogendemandfromindustries.12,00010,0008,0006,0004,0002,0000ELECTRICITYDEMAND(TWh/YR)19801990200020102020203020402050�Other�Hydrogen�IndustrialElectrification�Buildings�Transportation�ReferenceLoadFIGURE3.Historicalandprojectedelectricitydemand,withprojectedloadgrowthinthetransportation,building,industrial,andhydrogensectors.Thegrowthinelectricitydemandinthetransportationandbuildingsectorsalignswith100%electrificationofthosesectors.Inthetransportationsector,ourdemandprojectionisrepresentativeofafutureinwhich100%ofnewvehiclesalesareelectricby2035,closelyalignedtothoseassumptionsdevelopedin2035Report2.0(Phadkeetal.,2022).Inthebuildingssector,weassume100%ofnewapplianceandequipmentsalestobeelectricby2030,coupledwithaggressiveend-useefficiencyimprovements.Intheindustrialsector,ourdemandprojectionisrepresentativeofafutureinwhich100%oflow-andmedium-heatapplicationsareelectrifiedby2050.100%ofthesteel20353.0THEREPORT10andammoniamanufacturing,aswellasotherhighheatapplications,utilizegreenhydrogenasafuelandheatsourceby2050.Thisreportexplicitlyexaminesapathwaytowardsnear-netzerocarbonemis-sionseconomy-wideby2050,ultimatelyachieving95-97%carbonreductionsby2050relativeto2005levels.Wedonotrequirethemodeltomeet100%netzeroemissions,asthatwouldlikelyrequiresignificantcarboncaptureandsequestrationtechnologies,whichisbeyondthescopeofthisanalysis.SCENARIODESIGNWeusedthesedataandmethodstoanalyzeonebaselinescenarioandarangeofoffshorewinddeploymentscenarios.Weanalyzedtherobustnessoftheseassumptionsacrossvarioussensitivities,resultinginawiderangeofpowersectoroutcomes.Table1belowdetailsthecoreoffshorewindtargetsanalyzedinthisreport,whileTable2describesthemainsensitivitiesappliedinthemodel.ThesensitivitiesareexplainedinmoredetailbelowandintheAppendix.TABLE1.Keyoffshorewindtargetsanalyzedinthisreport.OFFSHOREWINDPOLICYSCENARIOSOFFSHOREWINDTARGETSOFFSHOREWINDGENERATION(APPROXIMATE%OFTOTALELECTRICITYGENERATIONIN2050)BusinessasUsual(Baseline)40GWby203567GWby20502%LowAmbition100GWby2035250GWby205010%MediumAmbition100GWby2035500GWby203520%HighAmbition100GWby2035750GWby205025%20353.0THEREPORT11TABLE2.Keysensitivitiesanalyzedinthisreport,foreverycombinationofthefollowingparameters(24casesassessedforeachoffshorewindtarget,meaningatotalof96modelruns).TECHNOLOGYCOSTSLAND-BASEDRENEWABLEENERGYAVAILABILITYCLEANELECTRICITYPOLICYOFFSHORETRANSMISSIONINTERCONNECTIONLAYOUTATBAdvancedLimited90%by203595%by2050SinglePlantATBModerateReferenceBusinessAsUsualClusteredATBConservativeTheoffshorewinddeploymentscenariosallutilizethesamesetofcoreassumptionsandtechnologycosts.WecomparetheoffshorewinddeploymentscenariostooneBaselinescenario.•CurrentDecarbonizationPolicy(BaselineScenario):Assumescurrentfederalandstatecleanenergytargets,existingtechnologyperformanceandtrends,andrequires90%cleanelectricityby2035and95%cleanelectricityby2050.Assumesapathwaytowardsnear-netzerocarbonemissionseconomy-wideby2050.•OffshoreWindPolicyScenarios:Requires90%cleanelectricityby2035and95%cleanelectricityby2050,accompaniedby100GWofoffshorewindby2035andvariouslevelsofoffshorewinddeploymentby2050,comprisingbetween10-25%oftotalgeneration.Assumesapathwaytowardsnear-netzerocarbonemissionseconomy-wideby2050.20353.0THEREPORT12TABLE3.Corescenariosdiscussedinthisreport.CURRENTDECARBONIZATIONPOLICY(BASELINESCENARIO)OFFSHOREWINDPOLICYSCENARIOSPolicyAssumptions•Includesstate,regional,andfederalpoliciesasof2022•IncentivesfromtheInflationReductionActandotherenergytaxcreditsCleanElectricityMixTargets•Pathwaytowardsnear-netzerocarbonemissionseconomy-wideby2050•90%by2035,nationwide•95%by2050,nationwideOffshoreWindCapacityTargets•Currentfederalandstateoffshorewindtargets•100GWofoffshorewindby2035•250,500,and750GWofoffshorewindby2050ScopeofElectrificationBuildings,transportation,andindustrialsectors,includinggreenhydrogenproductionCostProjectionBasisATBModerateLand-BasedRenewableAvailabilityLimitedFossilFuelPowerPlantStatus•Allexistingcoalretiredby2035•Nonewfossilgasadditionsafter2023exceptonesthatarecurrentlyunderconstructionWedesignedtheOffshoreWindPolicyscenarioswithinternationaltargetsinmind.NorthSeacountries,theEuropeanUnion(EU)asawhole,China,SouthKorea,andSoutheastAsiahavecommittedsignificantlytooffshorewindatascalewellbeyondcurrentU.S.commitments(Figure4).ThissignalsroomforincreasedU.S.ambition,andforeshadowsfurthertechnologicalimprovementsandcostreductionsenjoyedbymorematurerenewabletechnologiessuchassolarandonshorewindwithsimilarcharacteristics.Thoughourscenariosdonotexploretherelationshipbetweenscaleandendogenouslearning,thescientificliteratureincreasinglysupportsthepropositionthatgreaterdeploymentleadstofastercostdeclinesofrenewabletechnologiesthathavedemonstratedtheyareonalearningcurve(Wayetal.,2022).20353.0THEREPORT13TheGlobalAmbitiontoIncreaseOffshoreWindGenerationAroundtheglobe,offshorewinddevelopmentisincreasinglyviewedasakeydecarbonizationtool,andtheindustryisexpandingrapidly.Whilethetargetsanalyzedinthisreportareambitious,internationalcleanenergydevelopmentoffersinsightintotheglobalcleanenergyrevolutionunderwaythattheU.S.ispoisedtoacton.Globally,thepipelinefornewoffshorewindcapacitycontinuestoriseandnowstandsatover700GWofannouncedcapacity(GEM,2023).SoutheastAsiaChinaEU(plusU.K.&Norway)UnitedStates20202025203020352040204520502055CHINA2022ACTUAL,27SOUTHEASTASIA2035LIKELY,58CHINA2035LIKELY,187EU(PLUSU.K.ANDNORWAY)2035LIKELY,205U.S.2030GOAL,30EU(PLUSU.K.ANDNORWAY)2050GOAL,484U.S.2050GOAL,110FIGURE4.LikelyoffshorewindcapacitytargetsinChina,theEuropeanUnionplusNorwayandtheUnitedKingdom,andtheUnitedStates,2020-2050.DataSource:BNEF,2023.Cumulativeinstalledoffshorewindcapacitynowstandsatover55GW,followingarecord-setting2021inwhichnationsaroundtheglobeinstalled21GWofoffshorewind(GEM,2023;GWEC,2023).Numerouscountrieshaveconsistentlyuppedtheambitionoftheirinstallationtargets,recognizingthenecessityofnewoffshorewindcapacity.TheEuropeanUnionpreviouslyannouncedtargetstodeploy110GWofoffshorewindby2030,andatleast350GWby2050(EuropeanCommission,2023).SuchatargetfarsurpassestheBidenAdministration’sgoaltodeploy30GWofoffshorewindby2030and110GWby2050.Atthisrate,offshorewindwouldprovideapproximately5%ofthenation’s2050electricitydemand.TotalEUelectricitydemandisapproximately66%oftheU.S.totalelectricitydemand,suggestingthattheEUplanstomeetasignificantlyhighershareoftotalgenerationfromoffshorewindthantheU.S.currentlyplansto.NineNorthSeanationsrecentlyannouncedaplantogobeyondtheEUtargets,hopingtodeploy120GWofoffshorewindby2030and300GWby2050intheNorthSea(Henley,2023).Theninenations,whosecombinedelectricitydemandrepresentsjust40%ofcurrentU.S.electricitydemand,willneedtodeployupwardsof20GWperyeartomeetthe2050target.WhileoffshorewindproliferationinEuropestartedlongbeforetheUnitedStates’entranceintotheindustry,thescaleandspeedoftheirtargetswarrantsasignificantpointofcomparison.Chinaremainsagloballeaderininstalledrenewableenergycapacity.In2022,Chinainstalledapproximately29newoffshorewindplants.Atthesametime,othernationsarejoiningtheburgeoningindustry.Vietnam,Japan,theU.K.,SouthKorea,Italy,France,Spain,andGermanyallcompletedprojectsin2022(Buljan,2023).20353.0THEREPORT14KEYFINDINGSThissectionhighlightsouranalysis’topfindings,whichindicatehowcriticaloffshorewindwillbeinmeetingU.S.commitmentstoreachnetzerogreenhousegasemissionsby2050.WeanalyzetheimpactsofoffshorewindprovidinganincreasingamountoftotalenergygenerationtotheU.S.powermixin2050comparedtoaBaselinescenario.IntheBaselinescenario,67GWofoffshorewindcontributesapproximately2%ofgenerationasashareoftotalenergygenerationin2050.Ourthreescenarios—LowAmbition,MediumAmbition,andHighAmbition—showtheelectricitysystemimpactsofoffshorewindgrowingtoprovide10-25%oftotalgeneration,allowingamorerobustexaminationofthetradeoffsbetweentheseapproachesaspolicymakersattempttobalanceambitionandfeasibility.•TheU.S.hassomeofthehighestoffshorewindspeedsandpotentialcapacityintheworld,amountingtoover4,000GWoftechnicalpotential.1,000GWofpotentialoffshorewindcapacityalongtheEastCoast,GulfofMexico,WestCoast,andGreatLakeshascapacityfactorsover50%.•OffshorewindcanbeintegratedintotheU.S.powersystemandprovide10-25%oftotalelectricitygenerationintheU.S.powersystemin2050withoutsubstantiallyimpactingwholesaleelectricitycosts.Wholesaleelectricitycostsarejust0.25%higherintheHighAmbitionscenariothanBaselinein2050,whilecostsintheLowandMediumAmbitionscenariosarelowerrelativetoBaseline.•Thetransitionto100%cleanelectricityandanetzeroeconomywillrequireunprecedentedamountsofnewcleanenergycapacity.Wefindthatoffshorewindcanstrengthenandde-risktheU.S.pathwaytopowersectordecarbonizationinahighelectrificationscenario.TheMidAmbitionscenariowouldrequireannualdeploymentsofapproximately100GWofland-basedwindandsolar,and27GWofoffshorewindbetween2035-2050.TheadditionaloffshorewindcapacityreducesthetotalamountofcapacityinstalledontheU.S.powersystembynearly500GWrelativetoBaseline.•ResearchershaveidentifiedapathwaytodevelopingsupplychainsthatadequatelysupporttheBidenAdministration’s30GWby203020353.0THEREPORT15target,andallOffshoreWindPolicyscenarioswillrequirecoordinatedanddeliberateindustrialpolicysupportbeyond2030toincreasedomesticmanufacturing,developspecializedportfacilitiesandships,andenhancelocalemploymentopportunities.Ouranalysissuggeststhatinordertosupportanoffshorewindindustrythatprovides20%ofthenation’selectricitydemands,cumulativeinvestmentinthesupplychainwouldneedtoexceedatleast$260billionthrough2045.•High-qualitywindresourcesacrossthenationexpandtheavailabledeploymentandassociatedeconomicopportunitiesofoffshorewind.Offshorewindreducestheburdenofinfrastructuredevelopmentonland,andshiftsitoffshore,diversifyingtheriskofinfrastructuredevelopmenttoawiderarea.Asoffshorewinddeploymentincreases,theareadirectlyimpactedbyrenewableenergyinfrastructuredecreasesrelativetotheBaselinescenario.Becauseofthehighpowerdensityofoffshorewindresources,theU.S.couldgeneratemorecleanpoweronasmallerfootprintonwater.•Thetransitiontoanetzeroeconomywillrequiredoublingexistingtransmissioninfrastructure,amountingtoatleast$700billioninnewtransmissioninvestmentby2050.However,aclusteredtransmissionapproach,whichallowsforgreateraggregationofoffshorewindproductionintofewercollectionpoints,couldreduceoffshoretransmissioncostsby35%relativetoabusiness-as-usualapproach.Offshorewindprovidesanopportunitytoreimaginethetransmissionplanningprocessandavoidthebottlenecksthathaveplaguedland-basedrenewableenergydeployment.•Achievingnear-netzeroemissionsby2050throughelectrificationoftheeconomywillresultintheannualdemandforelectricitytosoartoatleast10,700TWh,withdailypeakdemandreachingover2,100GWinthewinter.Offshorewindhasacomplementarygenerationprofiletothatofsolarandland-basedwind,andiswell-suitedtomeetelectrificationdemand.Bycomplementingthegenerationprofilesofexistingcleanenergytechnologies,offshorewindcanhelpformasystemequippedtomorereliablymatchelectricitydemandpatternsanddiversifytheelectricitymix.•Whenisolatingtheimpactsofjustoffshorewinddevelopment,theHighAmbitionoffshorewindpolicyscenariocouldsupportapproximately390,000jobsacrosstheeconomy.Ascenarioinwhichagreaterpercentageofgoodsandmaterialsaresourceddomestically—apolicygoaloftheInflationReductionAct—leadstoadditionaljobcreation,whileexpandingemploymentandeconomicbenefitsacrosstheentirecountry.ThebenefitsofoffshorewindthusexpandfarbeyondtheU.S.coastline.20353.0THEREPORT16THEUNITEDSTATESHASHIGH-QUALITY,ABUNDANTOFFSHOREWINDRESOURCESTheU.S.hassomeofthehighestoffshorewindspeedsandpotentialcapacityintheworld.TheoffshorewindpotentialalongtheEasternSeaboard,GulfofMexico,GreatLakesregion,andthePacificcoasttotalsmorethan4,000GW(Figure5).Over1,000GWofthatoffshorewindresourceofferscapacityfactorsgreaterthan50%(Figure6).CAPACITYFACTOR35%60%FIGURE5.Offshorewindtechnicalresourcepotentialandcapacityfactors,averagedoversevenweatheryears(2007-2013).TECHNICALPOTENTIAL(GW)70%65%60%55%50%45%40%35%30%25%ANNUALCAPACITYFACTOR(%)05001,0001,5002,0002,5003,0003,5004,0004,500FIGURE6.Offshorewindcapacityfactorsupplycurve,averagedoversevenweatheryears.20353.0THEREPORT17Offshorewindgenerationcanhelpmeettherisingenergydemandsofahighlyelectrifiednetzeroeconomy,andallcoastalregionsofthecountryhavequalityoffshoreresources.TheNortheast,WestCoast,andGreatLakesregions’offshorewindmonthlycapacityfactorstypicallyaveragearound50%,whiletheSoutheastandGulfCoasthavecapacityfactorsofatleast35%.65%oftotalU.S.electricitydemandtodaycomesfromcoastalorGreatLakesstates,andcanbeserveddirectlybyoffshorewind.Offshorewindhasacomplementarygenerationprofiletothatofsolarandland-basedwind.Nationwide,offshorewindgenerationpeaksintheevening,rampingupassolargenerationbeginstofall.OffshorewindgenerationisgreatestinthesummerontheWestCoast,providingcapacityneededtocoverpeakairconditioningloads.OntheEastCoast,thegreatestamountofoffshorewindisgeneratedinthewinter,coincidingwithpeakperiodsofheatingdemand,whichisexpectedtoincreaseasbuildingsandindustryelectrifyheating(Figure7).Offshorewind’shighlevelsofeveninggenerationalsoreducetheneedforenergystorage.80%70%60%50%40%30%20%10%0%CAPACITYFACTORHOUROFTHEDAY113719416102221482051711233159216181224FIGURE7.AveragehourlycapacityfactorsofEastCoastandWestCoastoffshorewind.EASTCOASTJanuaryJuneNovember80%70%60%50%40%30%20%10%0%CAPACITYFACTORHOUROFTHEDAY113719416102221482051711233159216181224WESTCOAST20353.0THEREPORT18OFFSHOREWINDCANBEINTEGRATEDINTOTHEU.S.POWERGRIDWITHOUTIMPACTINGWHOLESALEELECTRICITYCOSTSRELATIVETOBASELINEWholesaleelectricitycosts(generationcostsplusnewtransmission)intheOffshoreWindPolicyscenariosarecomparabletoBaselinethroughoutthestudyperiod.IntheHighAmbitionscenario,inwhichoffshorewindprovidesnearly25%oftotalenergygenerationin2050,wholesaleelectricitycostsin2035arejust2.2%higherrelativetoBaseline,andjust0.25%higherthanBaselinein2050(Figure8).AcoordinatedtransmissionapproachcouldfurtherreducethecostdifferencebetweentheBaselineandOffshoreWindPolicyscenarios.Increasingtheshareofgenerationfromoffshorewindmodestlyimpactswholesaleelectricitycoststhroughoutthestudyperiod.Asoffshorewinddeploymentincreases,totalwholesaleelectricitycostsfallrelativetotheBaselinescenario,untiloffshorewindgenerationreachesapproximately20%oftotalenergygeneration.IntheLowandMediumAmbitionscenarios,wholesaleelectricitycostsareapproximately2%and3%cheaperthanBaselinein2050,respectively.Intheinterimyears,costsintheOffshoreWindPolicyscenariosareslightlyhigherthanBaselinecosts.In2040,thewholesaleelectricitycostsintheLowandMediumAmbitionscenariosare0.4%and2.6%moreexpensivethanBaseline,respectively.Inordertoachievea95%cleanelectricityshare,wholesaleelectricitycostsrisemodestlyrelativetotoday’selectricitycosts,buttherateofincreaseiscomparableacrossbothscenarios.TheInflationReductionAct(IRA)offerssignificanttaxincentivestosupportthedeploymentofnewrenewableandbatterystorageresources,includingoffshorewind,andhelpsmitigateanysignificantcostincreases.InallcasesincludingBaseline,wholesaleelectricitycostsareapproximately13%higherin2050thantoday.Inallscenarios,electricitydemandrisessignificantly,andwithit,anaccompa-nyingincreaseinnewgenerationcapacityandnewtransmissionisrequired.Despiteoffshorewindhavinghighercapitalcoststhanland-basedwindandsolar,offshorewind’shighaveragecapacityfactormeanslessoverallrenew-ablecapacityisrequiredtomeetloadintheOffshoreWindPolicyscenarios.20353.0THEREPORT19FIGURE8.Wholesaleelectricitycosts($/MWh)(generationplusnewtransmission)inBaselineandOffshoreWindPolicyscenariosusingNRELATBModeratecosts,2040-2050.WHOLESALEELECTRICITYCOST$/MWH(2020REAL)WHOLESALEELECTRICITYCOST$/MWH(2020REAL)WHOLESALEELECTRICITYCOST$/MWH(2020REAL)204020452050010203040506001020304050600102030405060HighAmbitionMediumAmbitionLowAmbitionBaselineWeappliedsensitivitiestoevaluatehowtechnologycostimpactsoveralltotalsystemcosts.Figure9displayswholesalecostsacrossalltechnologycostsensitivities.EvenatthehighdeploymenttargetsenvisionedintheHighAmbitionscenario,wholesaleelectricitycostimpactsremainmodest.WhenutilizingATBAdvanced(low)technologycosts,2035and2050electricitycostsarebothlowerthanthosefoundintoday’smarket.Futureimprovementsinwindturbineperformanceandsupplychainefficiencycouldlowercapitalcosts,increasecapacityfactors,anddeliverevenmoreacceleratedcostdeclines.Forexample,theATBAdvancedforecastutilizesan18MWturbineprototype,andassumescapitalandoperatingexpenditurereductionsduetoincreasedeconomiesofscale,lowerfabricationcosts,andimprovedcapacityfactors(NREL,2022).Futureanalysiscouldevaluatepotentialbarrierstoachievingcostreductionsorimprovedperformancesuchassupplychainconstraintsormacroeconomicimpacts.Thereisalsoaneedtomorerobustlyexamineendogenouslearningthroughdeploymentandtheimpactonoveralltechnologycosttrends.20353.0THEREPORT2070.0060.0050.0040.0030.0020.0010.000.00WHOLESALEELECTRICITYCOST$/MWH(2020REAL)YEARATBADVANCED20222046203420282040202420482036203020422026205020382032204470.0060.0050.0040.0030.0020.0010.000.00WHOLESALEELECTRICITYCOST$/MWH(2020REAL)YEARATBCONSERVATIVE202220462034202820402024204820362030204220262050203820322044HighAmbitionMediumAmbitionLowAmbitionBaseline70.0060.0050.0040.0030.0020.0010.000.00WHOLESALEELECTRICITYCOST$/MWH(2020REAL)YEARATBMODERATE202220462034202820402024204820362030204220262050203820322044FIGURE9.Wholesaleelectricitycosts($/MWh)(generationplusnewtransmission)inBaselineandOffshoreWindPolicyscenariosutilizingATBAdvanced,Moderate,andConservativecostprojections,2023-2050.OFFSHOREWINDCOMPLEMENTSLAND-BASEDRENEWABLESTOMEETINCREASEDELECTRICITYDEMANDINANETZEROECONOMYToachievenetzerocarbonemissionseconomy-widerequireseliminationoffossilfuelsandanationaltransitiontoelectricvehicles,heatpumps,andotherelectrictechnologiesintheindustrialsector.Theelectricityneededtopowerallofthisnewtechnology,plusagrowingU.S.economy,isexpectedtoalmosttripledemand,fromabout4,000terawatt-hours(TWh)in2020to6,700TWhin2035and10,700TWhby2050(Figure10).6Whileelectricitydemandgrewonaverage2.6%eachyearbetween1975and2005,ouranalysisprojectsthattheshifttoanelectrifiedeconomywillresultinanaverageannual3.3%increaseinelectricityconsumptionfrom2023to2050.6Thisreportexaminesapathwaytowardsnear-netzerocarbonemissionseconomy-wideby2050,achieving95-97%carbonreductionsby2050relativeto2005levels.Wedonotrequirethemodeltomeet100%netzeroemissions,asthatwouldlikelyrequireadditionalcarboncaptureandsequestrationmethods,whichisbeyondthescopeofthisanalysis.20353.0THEREPORT2112,00010,0008,0006,0004,0002,0000ELECTRICITYDEMAND(TWh/YR)19801990200020102020203020402050�Other�Hydrogen�IndustrialElectrification�Buildings�Transportation�ReferenceLoadFIGURE10.Historicalandprojectedelectricitydemand,withprojectedloadgrowthinthetransportation,building,industrial,hydrogen,andothersectors.Today’selectricgridcomprisesmorethan1,000GWofinstalledcapacity.Acombinationoffossilfuelsprovideabout60%oftotalgeneration,whilecleanenergyresourcesincludingnuclear,hydropower,biomass,geothermal,wind,andsolarprovidetherest.InorderfortheU.S.togrowthatshareofcleanelectricityto90-95%by2050whileelectricitydemandtriples,installedcapacitywilllikelygrowatleastfourfold,mostlyvialow-costrenewablegeneration.Deployingthatamountofinfrastructurewillbenoeasytask,raisingtheimportanceofrelyingonadiversityofresources,includingoffshorewind.Thisanalysissuggestsoffshorewindcouldprovide10-25%oftotalgenerationinanear-netzeroeconomy.Recently,theU.S.hasdeployedrenewableresourcesatarecordsettingpace,including28GWin2021,18.5GWin2022,andanexpected35GWofwindandsolarin2023(EIA860,2023;EIAToday,2023).Nevertheless,thenationwillhavetosignificantlyincreaseannualinstallationsofcleanenergyresourcesandacceleratedeploymenttimelinesinordertoachievenetzeroemissions.Anaccompanyingscale-upofoffshorewindcapacitywouldbolsterandcomplementrenewabledeploymenttrendsonlandandbringtheU.S.closertomeetingitsannualcleanelectricityneeds.By2050,theBaselinescenariodeploys3,400GWofnewland-basedwindandsolarresources,plus1,500GWofnewbatterystorageand1,300GWofhydrogenCTs,butonly67GWofoffshorewind.7Deploying3,400GWofland-basedrenewablesby2050wouldrequire127GWofnewcapacitytobeinstalledeachyear,fourtimestheinstallationsexpectedin2023,andnearlyfivetimesthecurrentrecordfrom2021(Figure11).7OffshorewinddeploymentsintheBaselinescenarioarelargelyaresultofstatelegislativeprocurementtargets.Forexample,NewYorkhasatargettoproduce9GWofoffshorewindby2035,whichisenforcedinthemodel.Thefavorableeconomicsofland-basedwindandsolarmakesoffshorewindslightlymoreexpensivetoday,andsoonlymodestamountsbeyondprocurementtargetsaredeployed.20353.0THEREPORT22Incontrast,weexaminemultipleOffshoreWindPolicyscenariosthatdeployincreasingamountsofoffshorewind.Ourmodeldoesnotendogenouslybuildsignificantoffshorewindcapacityaspartofthecost-optimum,reflectingtherealitythatadditionalpolicieswillbeneededtosupportscalingtheoffshorewindindustry,exploredinthecompanionpolicyreportfromEnergyInnovation(EnergyInnovation,2023).TheOffshoreWindPolicyscenariosexaminepathwaystoallcleanenergytechnologiesincreasingtheirshareoftotalenergygeneration,whileevaluatingoffshorewind’sspecificcontributiontothatincrease.Inallpolicyscenarios,asfossilgenerationfalls,offshorewindgenerationrisestomeet10-25%oftotalgeneration.BaselineLowAmbitionMediumAmbitionHighAmbition02004006008001,0001,2001,4001,6001,8002,0002,2002,4002,6002,8003,0003,2003,4003,800�Land-BasedRenewables�OffshoreWindCUMULATIVENEWCAPACITY(GW)2021/22DEPOLYMENTRATE3XRATE5XRATEFIGURE11.Cumulativeinstalledcapacityofoffshorewindcomparedtoland-basedwindandsolarintheBaselineandOffshoreWindPolicyscenarios,2050.In2021,theUnitedStatesdeployedapproximately28GWofnewwindandsolarresources,and18.5GWin2022(EIA860,2023).Thebarsonthechartrepresentacumulativeinstallationratein2050ofapproximately23GW/year(theaverageof2021and2022installations),aswellasthreeandfivetimesthatrate.InorderfortheU.S.toachievenear-netzeroemissionsby2050,thenationwillhavetoinstallland-basedrenewableenergyatroughlythreetosixtimestheaveragedeploymentrateof2021-2022(5.5timestoreachthecumulativeinstalledcapacityofrenewablesintheBaselinescenario,butjust3.5timestoreachthecumulativeinstalledcapacityintheHighAmbitionscenario).TheOffshoreWindPolicyscenariosrequireambitiousdeploymentsofallcleanenergyresourcestomeetrisingelectricitydemand.TheMidAmbitionscenariodeploys500GWofoffshorewindby2050,inadditionto600GWofland-basedwind,2,000GWofsolar,and1,200GWofbatterystorage(Figure13).Inthisscenarioin2050,offshorewindcomprises20%oftotal20353.0THEREPORT23annualgeneration,whileland-basedwindandsolarcontributeapproximately20%and45%ofannualgeneration,respectively.Theadditionalcleanenergygenerationfromoffshorewindreducestheneedforland-basedwindandsolarresourcesby25%(700GW)andbatterystoragecapacityby15%(200GW)comparedtotheBaselinescenario.Coupledwithexistinggas,hydropower,andnuclear,aswellasnewgreenhydrogenfueledcombustionturbines,cleangenerationissufficienttodependablymeethighelectrificationdemandwith95%carbon-freeelectricityin2050.Inallscenarios,renewableenergytechnologieswouldcontributenearly85%oftotalannualgenerationneeds,accompaniedbyexistingnuclearandhydropower,andnewhydrogenCTs(Figure12,Figure14).02,0004,0006,0008,00010,00012,000�Fossil�NuclearandHydropower�GreenHydrogen�Solar�OnshoreWind�OffshoreWindGENERATIONIN2050(TWh/YR)BaselineLowAmbitionMediumAmbitionHighAmbitionFIGURE12.AnnualgenerationintheBaseline,Low,Medium,andHighAmbitionscenarios,2050.Inordertoreachtheoffshorewinddeploymenttargetsenvisionedinthisreport,theUnitedStateswouldneedtoaddanaverage8GWofnewoffshorewindperyearbetween2023and2035,andbetween10-40GWperyearbetween2035and2050.In2035Report1.0and2.0,wedemonstratedthefeasibilityofscalingland-basedrenewablestomeetannualdeploymentgoalswithouttheadditionofoffshorewind,whichamountedto70-110GWofnewland-basedwindandsolarperyear,dependingonelectrificationtrends.Thisreportconsidersasimilarland-basedrenewabledeploymenttarget,whileaddingambitiousdeploymentsofoffshorewind.Forexample,theBaselinescenariorequiresannualrenewabledeploymentsof127GWperyear,nearlyfivetimestherateof2021’srecordrenewablesdeployment.Asoffshorewindcapacityrampsupacrossscenarios,land-basedrenewablecapacityfallsslightly.TheMidAmbitionscenariorequiresland-basedrenewableinstallationstoproceedatclosertofourtimesthe2021deploymentrateasoffshorewinddeploymentsincreasefrom8GWperyearinthe2020s,to27GWperyearbetween2035-2050.20353.0THEREPORT24BaselineLowAmbitionMediumAmbitionHighAmbition01,0002,0003,0004,0005,0006,0007,000Fossil�Nuclear&Hydropower�GreenHydrogen�Battery�Solar�OnshoreWind�OffshoreWindINSTALLEDCAPACITYIN2050(GW)FIGURE13.InstalledcapacityintheBaseline,Low,Medium,andHighAmbitionscenarios,2050.2035ThePathwaytoNetZeroTheyear2035representsasignificantinflectionpointinthenation’sdecarbonizationefforts.TheBidenAdministrationhasatargettoachieve100%cleanelectricityby2035,whichwouldhelpmeetthenation’scommitmenttoreduceeconomy-widegreenhousegasemissions50-52%by2030relativeto2005.TheBidenAdministrationalsohasatargettodeploy30GWofoffshorewindby2030.Thisreportspecificallyexaminesachieving90%cleanelectricityby2035.Whilewerecognizethenecessityofachieving100%,numerousotherstudiesexaminepathwaystoreachthistarget,oftenrelyingonnewtechnologiestoachievethefinal10%ofdecarbonization,suchashydrogenandcarboncapture.Ouranalysissuggeststhenationcanachievesignificantpowersectordecarbonizationwithtechnologiesthatarecommerciallyviabletodaysuchasland-basedwind,solar,batterystorage,andnowoffshorewind.Wefocusthisstudyonthosetechnologies’contributiontocleanenergygeneration,whileavoidingthecomplexityanduncertaintyinvolvedinmodelingthefinal5-10%ofpowersectordecarbonization.Thisanalysisrequiresthemodeltodeploy100GWofoffshorewindby2035,suchthatoffshorewindsuppliesapproximately5%ofannualgeneration—aparticularlychallengingtaskthatwillrequireaverageannualdeploymentsofapproximately8GWperyear.Whiledifficulttoachievebasedontoday’sleasingandpermittingprocesses,supplychaininfrastructure,ports,andvesselcapacity,scalingtheindustryoverthenext12yearstotargetthisgoaliscriticaltoensuringthatoffshorewindbecomesasubstantialcleanenergycontributorby2050.Atthesametime,theU.S.willneedtobedeployingatleast100GWofland-basedwindandsolareachyear.Whilechallengesabound,theappetitefordevelopmentpersists.AccordingtoLawrenceBerkeleyNationalLab,thereareover110GWofproposedoffshorewindcapacityinU.S.interconnectionqueuestoday(Randetal.,2023).20353.0THEREPORT25Thescaleofnewcleanenergydeploymentsunderallscenariosisunprece-dented,andwillrequirecoordinatedpolicysupporttoensurethatmanufac-turingfacilitiesandcleanenergyprojects,includingnewtransmissioncapaci-ty,arepermitted,financed,andconstructedinatimelymannerwithadequatepublicconsultation.Relyingonthehighlevelsofoffshorewindreflectedinourscenariosisnotasilverbullet.However,newoffshorewindcapacityhelpstodiversifytheenergymix,reducetheriskofmissingourclimategoals,andreflectsamorebalancedapproachtotheenergytransitionusingproventech-nologies,evenwhilerecognizingthechallengesofscalingtheindustry.ThesupportingreportfromEnergyInnovationoutlinesnumerousopportunitiestoreducepolicybarrierstodeploymentwhilesupportingajustandequitableenergytransition(EnergyInnovation,2023).BaselineLowAmbitionMediumAmbitionHighAmbition02,0004,0006,0008,00010,00012,000�OtherResources�Land-BasedRenewables�OffshorewindGENERATIONIN2050(TWh/YR)FIGURE14.Annualgenerationofoffshorewind,land-basedrenewables,andothergenerationsources(TWh)intheBaselineandOffshoreWindPolicyscenarios,2050.SCALINGUPTHESUPPLYCHAINWILLREQUIRESIGNIFICANTCAPITALINVESTMENTANDROBUSTDOMESTICPOLICYSUPPORTThedevelopmentofarobustoffshorewinddomesticsupplychainisanecessarysteptoachievetheUnitedStates’ambitiouscleanenergygoals.Inadditiontoreducingtherisktodevelopmenttimelinesandoverrelianceonforeignsupplychains,adomesticsupplychainensuresthatjobsandeconomicbenefitscanberetainedintheU.S.ThisisakeypolicygoalreflectedintheInflationReductionAct’sdomesticcontentrequirementsforcleanenergytechnologies.However,thereareseveraleconomicandtechnicalchallengesthatmustbeaddressed,includinglimitedport,vessel,andmanufacturinginfrastructure.Whilethechallengesaresubstantial,knowledgeofsupplychaincapacityrequirementsforambitioustargetswillhelpright-sizetheindustrytowardsincreasedeconomiesofscaleandacceleratedinfrastructuredevelopment.20353.0THEREPORT26ResearchershaveidentifiedaclearandtangiblepathtodevelopingsupplychainsthatadequatelysupporttheBidenAdministration’stargetof30GWofoffshorewindby2030.Theapproximately$22.4billionincapitalalreadycommittedissufficienttosecuremanufacturingsupplychainscommensuratewiththistarget,thoughsomeadditionalinvestmentislikelyneededinportinfrastructureandvessels(Matos,Wooley,2023).However,thissupplychaininvestmentneedstodoubleby2035anddoubleagainby2040toapproachtheoffshorewindambitionenvisionedintheMediumandHighAmbitionscenarios.Ouranalysissuggeststhatinordertosupportanoffshorewindindustrythatprovides20%ofthenation’selectricitydemands,cumulativeinvestmentinthesupplychainwouldneedtoexceedatleast$260billionthrough2045.8Adetailedsupplychainanalysis,baseduponNREL’sprojectionsofthesupplychaindevelopmentneedsforthe30GWby2030target,canbefoundinanaccompanyingreport,OffshoreWindSupplyChainDevelopmentandInvestmentAnalysis(Matos,Wooley,2023).Inthatreport,weestimatetherequiredproduction,facilities,andinvestmentneededtoreach100GWby2035andapproachthe2050OffshoreWindPolicyscenariotargetsdescribedinthisreport.Assumingcurrenttechnology,developing500GWofoffshorewindcapacitywillrequireupwardsof30,000finishedturbines,100,000turbineblades,andover115,000milesofarrayandexportcables,aswellasover100newmanufacturingfacilities(Table4).Manufacturingthatamountofequipmentdomesticallywouldrequireafourtofivefoldincreaseintheestimatednumberoffacilitiesorproductionlinesneededtomeetthe30GWtargetby2030.8Forcomparison,globalupstreaminvestmentinupstreamoilandgasisover$400billionperyear.See:Oilandgas:TheinvestmentgapdilemmaandOil,gasinvestmentstohit$628billionin2022ledbyupstreamgasandLNG.20353.0THEREPORT27TABLE4.Facilitiesrequiredfordomesticoffshorewindmanufacturingcapacity.TARGETCAPACITY(GW)BLADEFACTORIESNACELLEFACTORIESFOUNDATIONFACTORIES(FIXEDANDFLOATING)TOWERFACTORIESEXPORTCABLEFACTORIESARRAYCABLESFACTORIES309545442100by203512912695LowAmbition979774MediumAmbition20162016168HighAmbition302430242412CurrentAnnouncedFacilities(Jan2023)10122121Yearstoconstructasinglefacility3-53-52-43-55-65-69See:Shieldsetal.,2023.10See:Shieldsetal.,2023.20353.0THEREPORT28Aslargercapacityturbinesareadopted,manufacturingisenhanced,anddeploymentisstreamlined,theseestimatesmayshrink.11Forexample,iftheU.S.offshorewindindustryweretoshifttoward20MWoffshorewindturbines,approximately25,000turbineswillbeneededtoreach500GWoftotalcapacity,comparedtoover34,00015MWturbines.Additionally,ashifttowardgreaterrelianceonfloatingturbineswouldshiftsupplychain,port,andvesselneeds,particularlyontheEastCoastwherefixed-bottomturbinesarethenorm.Forreference,theU.S.hasinstalledapproximately70,000turbinesonlandtodate,amountingto140GWofland-basedwindcapacity(USGS,2022b).TABLE5.MajoroffshorewindsupplychainannouncementsintheU.S.(recreatedfromShieldsetal.,2022).COMPONENTLOCATIONINVESTORSINVESTMENT($MILLION)STATUSBladesPortsmouthMarineTerminal(Virginia)SiemensGamesa200AnnouncedNacelles(finalassemblyonly)NewJerseyWindPort(NewJersey)Vestas,AtlanticShoresNotannouncedAnnouncedNewJerseyWindPort(NewJersey)GE,ØrstedNotannouncedAnnouncedTowersPortofAlbany(NewYork)MarmenWelcon,Equinor350AnnouncedMonopilesPaulsboroMarineTerminal(NewJersey)EEW,Ørsted250UnderConstructionSparrowsPoint(Maryland)USWind150AnnouncedFoundationplatformsPortofProvidence(RhodeIsland)Eversource,Ørsted40AnnouncedConstraintsonthesupplychainforfinishedcomponentsaremostlyattributedtosubcomponentsandrawmaterials.Offshorewind-relatedsteelsupplywillneedtodoubleby2030,andthendoubleagaintosupport100GW(Musialetal.,2022).Whilesubstantial,steeldemandtomeetthe30GWtargetconstitutesjustonepercentofannualU.S.steelproduction.12Asinglesteel11Numerouswindturbinemanufacturershavealreadyannouncedcommercially-available18MWturbines(See:Lewis,2023).Movingfrom13MWto18MWturbineswouldreducetheneedforaround18unitsina1GWwindfarm,accordingtoChinesemanufacturerMingyang(See:Lee,2023).12U.S.rawsteelproductionwas87millionmetrictonsin2021(See:USGSa,2022).Theestimatedsteelrequiredtomeet30GWby2030is886,000tons(Shieldsetal.,2023).20353.0THEREPORT29millbeingconstructedbyNucorinKentuckywouldmeetapproximatelyhalfthedemandofa100GWnationaltarget,butmayhavedifficultysupplyingsteelproductstodistantregionswherenosuchcapacitycurrentlyexists(Lantzetal.,2022).Similarly,SparrowsPointSteelinMarylandisexpectedtobeconstructedinabouttwoyearsandproduceenoughmonopilestosupport2.4GWofturbinesannually(Richards,2021).Achieving100GWby2035wouldrequireatleastfouradditionalspecialtysteelplantsinthenextfewyears,withatleastoneeachintheWestCoastandGulfCoastregions.Lackofportcapacityandwindturbineinstallationvessels(WTIV)islikelythebiggestbottleneckfacingtheproductionandinstallationofturbinesatscale.Itisessentialtorapidlyexpandexistingportinfrastructuretosupportincreasedoffshorewindcapacity,anddevelopnewportsinselectlocations.Basedoninternationalbestpractices,itislikelythatadvancementsininstallationtechnologyandlargercapacityturbineswilldecreaseportarearequirements.Forexample,amajoroffshorewindportinDenmarkplanstoexpandportcapacityfrom1.5GWtodayto4.5GWby2025,throughtheuseofcomputermodelingtoreduceportspaceneededforturbineassembly(PortEsbjerg,2023).Elsewhere,newportinfrastructureisbeingdevelopedtoaccommodatelargerturbinesandincreasedthroughput.TwonewportdevelopmentsintheU.K.willserve9GWofcapacityannually,atleasttwoorthreetimesmorecapacitythansomeexistingU.S.portsareestimatedtosupport(Ellichipuram,2021).InSouthernCalifornia,thePortofLongBeachhasreleasedplansfora400acremarshalingporttoservetheMorroBayleasearea.CombinedwiththeHumboldtBayport,California’sportscouldsupportanannualinstallationof1-1.5GWperyear.13IfexistingU.S.portinfrastructurecouldscaleatsimilarratestothoseinEurope,increasingannualcapacityinstallation,theneedforgreenfieldportdevelopmentmaydecrease.Similarly,theU.S.governmentandprivateinvestorsmustcommitresourceswithinthenextthreetofiveyearsinordertosecurethecapacityoffourtoeightlarge-shipproductionlinesabletoproduceenoughshipstoincreaseinstalledcapacitybeyondthe30GWby2030goal.To-date,justonedomesticwindturbineinstallationvessel(WTIV)isunderconstruction,withplanstobeoperationalby2024.Therewerejust16WTIVsinoperationintheentireworldin2020,onlysixofwhicharecapableofinstalling15MWturbines,suggestingthatshipbuildingcapacityneedstoincreasesignificantlytomeetbothU.S.andglobaldemand(Shieldsetal.,2023).Recognizingthisneed,shipbuildersacrosstheglobeareexpandingoperations,withsomedeliveringnewbuilds13EstimationbasedonTable5oftheCaliforniaFloatingOffshoreWindRegionalPortsAssessment.20353.0THEREPORT30injustafewyears.ShipbuilderEneti,forexample,hasreceivedcontractsfordeliveryoftwonewinstallationvesselscapableofinstalling20MWturbinesthatwillbedeliveredinjusttwoyearstime(Anderson,2023).Effectiveindustrialpolicycansendstrongmarketsignalstomanufacturersandinvestors,helpingtocatalyzethelevelofinvestmentrequiredtomeettheseambitioustargets.AfterenactmentofboththeCHIPSandScienceActandtheIRAinAugust,2022,privateindustryinvestmentispoisedtofloodtheU.S.withnewdomesticmanufacturingcapacityforbatterymanufacturingfacilities,solarmodulefactories,electricvehicleplants,andothercriticaltechnologycomponents.Overjustthepast12months,manufacturershavecommittedatleast$227billioninnewdomesticmanufacturingtosupportnewadvancedtechnologymanufacturingintheseindustries.14Atthestatelevel,NewYorkrequiresSupplyChainInvestmentPlansandincludedupto$300millioninstatefundingaspartofitsmostrecentcompetitiveoffshorewindsolicitation.Proposalsfromdevelopersincludecommitmentsinseveralfacilitiesandportupgradesacrossthestate.15Supplychain,portandvesselconstraintsposesignificantchallengesfortheindustry.Establishingcriticalpolicysupportandcapitalinvestmentwillhelpachieve2035offshorewinddeploymenttargets,aswellashelptheindustryscaletomeetambitious2050goals.Theyear2035isacriticalinflectionpointfortheindustry,inwhichthenationwillhavetodemonstrateconcertedandsustainedinvestmentinmanufacturingfacilities,portinfrastructure,andworkforcedevelopment.HIGH-QUALITYWINDRESOURCESOFFTHESHORESOFALLCOASTALSTATESINCREASESOPPORTUNITIESFORDEPLOYMENTWHILEDISPERSINGECONOMICBENEFITSACROSSTHENATIONTheU.S.isfortunateinitshigh-qualitywindpotentialacrossallmajorcoastalareas.AlthoughU.S.offshorewindactivitycurrentlyisconcentratedalongtheNortheastcoast,ouranalysissuggeststhatoffshorewinddeploymentneednotberestrictedtooneregion.Rather,offshorewindcanbecost-effectivelydeployedalongmostoftheU.S.coastline.TherearecurrentlytwocommercialwindplantsoperatinginU.S.watersoffthecoastofVirginiaandRhodeIsland,andtheindustryisrapidlyexpanding.ConstructionhasstartedontwoadditionalprojectsinNewYorkandMassachusetts,withconsideration,planning,permitting,and/orsitecontrolunderwayfornewdevelopmentoffthecoastsofCalifornia,Connecticut,14See:InflationReductionAct(IRA)andCHIPSandScienceActInvestments.15See:NYSERDA2022OffshoreWindSolicitation;SubmittedProposals.20353.0THEREPORT31Delaware,Louisiana,Maine,Maryland,Michigan,NewJersey,NorthCarolina,Ohio,Oregon,RhodeIsland,Texas,Virginia,andintheGulfofMexico.TheBureauofOceanEnergyManagement(BOEM)hasidentifiedadditionalareasforpossiblenewwindleasesoffthecoastsofNewYork,SouthCarolina,California,theCentralAtlanticstates,Oregon,andMaine,aswellasintheGulfofMexico(offtheLouisianaandTexascoasts)(Musialetal.,2022;BOEM,2021;BOEM,2023).Since2014,BOEMhasheldleasesalesinwatersoffthecoastofRhodeIsland,Delaware,Massachusetts,Maryland,NewJersey,NewYork,NorthCarolina,Virginia,andCalifornia.GreatLakes131Gulf111South235NewEngland65Mid-Atlantic97Pacific113FIGURE15.Installedcapacity(GW)intheHighAmbitionscenario,2050.Figure15detailstheinstalledoffshorewindcapacityinaHighAmbitionfuture,representingthemostwidespreadandrobustdeploymentofoffshorewindconsideredinthisanalysis.16TheHighAmbitionscenarioshowspotentialtodeployapproximately65GWofoffshorewindinthewatersoffofNewEngland,97GWalongtheMid-Atlanticcoast,235GWinwatersofftheSoutheast(includingFlorida),111GWinGulfwaters,131GWinGreatLakeswaters,and113GWalongthePacificcoast.1716Thisanalysisonlyconsidersthecontiguous48states,understandingthatAlaskaandHawaiihaveuniqueenergysystemneedsthatarenotfullycapturedinourmodeling.17ReEDSchoosestodeployfixedorfloatingoffshorewindturbinesbasedontheresourcequality,capitalcost,interconnectioncost,andoceandepth.Basedonourexistingtechnologyunderstanding,mostoftheoffshorewinddeploymentontheWestCoastwillbefloatingwhilethatontheEastCoastandtheGulfwillbefixedbottom.However,uncertaintyremainsabouthowtechnologyimprovementsandcostdeclineswillimpactfuturedeploymenttrends.WhileReEDSdeploysrenewableresourcesatthestatelevel,offshorewindisuniqueinthatitisoftensitedinfederalwaters.Wethusaggregatestate-levelReEDSresultstotheregionsdescribedabove,understandingthatmostoffshorewindprojectswillbesitedinfederalwatersandmayspanmultiplestatelinesandconstitutemulti-stateagreements.MoredetailisprovidedintheAppendix.20353.0THEREPORT32WhileoffshorewindactivityiscurrentlyunderwayalongtheEastCoast,WestCoast,andGulfofMexico,activityintheGreatLakesisparticularlynascent.ThisanalysisevaluatesthepotentialforoffshorewindtoexpandacrossalltechnicallyviableregionsintheUnitedStates,includingtheGreatLakes.TheGreatLakesregionhashighwindspeedswithcapacityfactorsoftenaveragingover50%.Becauseofitsstrongwindresourcepotentialandproximitytolargepopulationcentersandtransmissioninterconnectionpoints,themodelchoosestodeployasignificantamountofnewoffshorewindcapacityintheGreatLakesregion.Whilethemodeldoesaccountfortechnicallimitationstodeploymentinthisregion,suchaswaterdepths,ecologicallysensitiveareas,shippinglanes,andexistinginfrastructure,itdoesnotaccountformajorpoliticalandregulatoryhurdles.OffshorewindintheGreatLakeswilllikelyhavetocontendwithuniquechallenges,suchasbladeicing(NYSERDA,2022).Thisanalysissuggeststhatstateandfederalactorsshouldfurtherevaluatethefeasibilityoflarge-scaleoffshorewinddevelopmentintheregion,whilerecognizingthatthereremainssignificanttechnicalpotentialacrossotherregionsoftheU.S.Theultimatechallengeindeployingthismagnitudeofoffshorewindcapacityisidentifyingavailableareasandleasingviablewindenergyareasatscale.Figure16detailsthescaleofthisdeploymentinthecontextofavailableoffshorearea.Weestimatethatroughly30%ofthecontiguousU.S.ExclusiveEconomicZone(EEZ)istechnicallyfeasiblefordevelopment(TechnicalPotentialZone).18IftheU.S.wasabletodeploy750GWofoffshorewindby2050identifiedintheHighAmbitionscenario,theturbineimpactareawouldamounttojust0.8%ofoffshoreareasuitablefordevelopmentwithintheU.S.EEZ(Figure16).19Thisestimaterepresentsahighlevelassessmentoftheoffshoreareaavailabletodeploynewoffshorewindresources.Importantly,ashighlightedintheaccompanyingPolicyReport,federalandstateagencieswillneedtotakeaproactiveapproachtomappingconflictsanddevelopingleasingstrategiesatscalewithstakeholderinputinordertofurtheravoidsensitiveenvironmentalareas,criticalfisheryhabitat,culturalresources,andotherimportantwaterspacesthathavenotbeenfullyevaluatedinthisanalysis(EnergyInnovation,2023).18ThisanalysisreliesonsitingassumptionsdevelopedbyNREL(Lopezetal.,2022).Basedontheseassumptions,themodelcanonlydeployoffshorewindinareasshallowerthan1,300metersindepthandwithinthe370kilometersoftheEEZ.60meteroceandepthisthedelineatorbetweenfixedandfloatingoffshorewindtechnology.SitingassumptionsalsoincludestandardexclusionsandsetbacksasdetailedinLopezetal.,2022.Inthisanalysis,theEEZisconfinedtothecontiguousU.S.,includingtheEastCoast,WestCoast,GulfofMexico,andGreatLakesregions.19Forpurposesofthisanalysis,turbineimpactareaisdefinedastheareadirectlyconsistingofturbinesandfoundations(aswellasassociatedwakeandscoureffects).Weassumea200mradiusfromtheturbinefoundationisaffectedbywakeandscoureffectsandbecomesunusableforanyotherpurpose(BOEM,2020).The200mradiusisanupperboundestimateoftheareaaffected.20353.0THEREPORT33AREA(MILLIONSQKM)ContinentalU.S.U.S.ContiguousExclusiveEconomicZoneOffshoreTechnicalPotentialZone(4100GW)NorthSeaTotalAreaLeaseArea-HighAmbitionOffshoreScenarioTurbineImpactArea-HighAmbitionOffshoreScenario0.01.02.03.04.05.06.07.08.09.00.006FIGURE16.Theturbineimpactarea(includingturbines,foundations,andassociatedwakeandscoureffects)ofoffshorewindintheHighAmbitionscenario,relativetothetotalleasearea,thetotalavailableareaintheNorthSea,theU.S.TechnicalPotentialZone(4100GW),thecontiguousU.S.ExclusiveEconomicZone,andtheContinentalU.S.,2050.Achieving100%cleanelectricitywillrequireavastbuild-outofnewrenewableenergyresources,bothonlandandoffshore.Todate,theU.S.hasdeployedover220GWofwindandsolar,withaleasedareaofapproximately7.1millionacresofland(Merrill,2021).InourBaselinescenario,theU.S.deploysover3,400GWofnewrenewablestomeetnear-netzeroemissionsin2050.Whiletheproposedland-basedrenewabledeploymentswouldspannearly72milliontotalacresofland,theareadirectlysitedwithsolarplantsandwindturbinesisfarsmaller—just21millionacres.Forwindenergy,theprojectstypicallyhavemultipleusesinadditiontoenergyproduction.Anestimated40%ofland-basedwindplantsintheU.S.arelocatedoncropland,while55%arelocatedonrangeland(USDA,2017).TheU.S.hasvast,untappedpotentialtogeneratecleanpoweroffitscoasts.Ouranalysisdemonstratesthatasoffshorewinddeploymentincreases,theareadirectlyutilizedbywindturbinesandsolarpanels(theDirectImpactArea)decreasesoverall(Figure17),largelybecauselessrenewableenergyisdeployedonland.IntheHighAmbitionscenario,theU.S.isabletoreducethedirectlandandwaterimpactsbynearly25,000squarekilometersrelativetoBaseline(6millionacres).Whilethetotalareaofleasedwaterincreasesasambitionincreases,onlyasmallfractionofthisareawillbedirectlyoccupied20353.0THEREPORT34byturbinesandfoundations.20Othernationswithsimilarnetzerotargetsplantodeployfarmoregenerationresourcesinsmallerareas.TheNorthSea,forexample,planstohost300GWofoffshorewindin2050—inanareajustone-fifththesizeoftheentireU.S.EEZ(Figure16).BaselineLowAmbitionMediumAmbitionHighAmbition010,00020,00030,00040,00050,00060,00070,00080,00090,000�DirectAreaLand�TurbineImpactAreaWaterAREA(MILLIONSQKM)BaselineLowAmbitionMediumAmbitionHighAmbition050,000100,000150,000200,000250,000300,000350,000400,000�LeaseAreaLandLeaseAreaWaterAREA(MILLIONSQKM)FIGURE17.Directarea(sq.km)impacted(includingsolarplants,windturbines,foundations,andassociatedwakeandscoureffects)(top),andtotalleasedarea(sq.km)(bottom),intheBaseline,Low,Medium,andHighAmbitionscenarios,2050.20Theareaconsistingofoffshorewindplants,likeonshorewindplantareas,mightservemulti-usepurposes.Forthisreason,wehighlighttheamountofspacedevotedspecificallytoturbinesandfoundations(aswellasassociatedwakeandscoureffects).However,otheruselimitationstowindplantsitesmayapply,suchasduringtheconstructionprocessandforongoingmaintenanceandoperations.20353.0THEREPORT35COORDINATEDTRANSMISSIONPLANNINGCANREDUCEINTERCONNECTIONCOSTSBY35%ANDACCELERATEDEPLOYMENTTIMELINESAnetzeroelectricitygridwillre-quiresignificantnewinvestmentintransmissioninfrastructureinordertodistributecleanenergygenerationacrossalargerfootprint.Manyna-tionaldecarbonizationstudieshavedemonstratedthevalueofaddition-al,high-voltagetransmission.Prince-ton’sNet-ZeroAmerica,forexample,envisionshigh-voltagetransmissioncapacitytriplingby2050tosupportahighelectrification,netzerofuture(Larsonetal.,2021).However,trans-missioninfrastructureishistoricallydifficulttopermitandconstruct.Off-shorewindprovidesanopportunitytorethinkthetransmissionplanningandinterconnectionprocessandavoidthebacklogthatexistingintercon-nectionprocesseshaveproducedonland.Backloggedengineeringstudiesanddelaysinpermittinghavestalledover2,000GWofwind,solar,andstor-ageininterconnectionqueuesacrossthecountry(Randetal.,2023).Thesedelaysnotonlyslowthedeploymentofcleanenergyandthenation’sshifttoanetzeroeconomy,theyhavere-sultedinrisinginterconnectioncosts.MISOandPJMrecordedaverageinter-connectioncostsof$120/kWin2021,65%higherthanthoseseenin2015-2019(BNEF,2023a).20353.0THEREPORT36Inordertomeetthe95%cleanelectricitytargetandincreasedelectricitydemandintheOffshoreWindPolicyscenarios,weestimatethatbulktransmissionsystemcapacitymustdoubleby2050relativeto2023levels.TheBaselinescenarioanalysisidentifiesaneedfor$402billioninnewtransmissionsysteminvestmentsbetween2023and2050(Figure18),withtheinvestmentallocatedfairlyevenlybetweenlinesthatconnectnewpowerplantstothehighvoltagenetwork(“spurlines”)at55%,or$220billion,andbulktransmissionsystemupgradesat45%,or$182billion.21TheHighAmbitionscenarioinvolvesatotaltransmissioninvestmentof$719billion,approximately80%greaterthanthatintheBaselinescenario,primarilyduetothemoreextensivespurlinedevelopmentrequiredtoconnectoffshorewindgenerationfacilitiestotheland-basedgrid.Spurlinesaccountforthemajorityoftransmissioninvestments(74%,or$532billion),whileinvestmentsinbulktransmissionremainrelativelyinlinewiththoseoftheBaselinescenario(24%,or$187billion).However,thisincreaseinspurlinecostdoesnotreflectbestpracticestomanaginginterconnectioncoststhroughholisticplanning—conceptsexploredinthesensitivityanalysis,aswellasourcompanionTransmissionAnalysisandPolicyReport(DaymarkEnergyAdvisors,2023;EnergyInnovation,2023).$BILLION(2020REAL)ClusteredSinglePlantClusteredSinglePlantClusteredSinglePlantClusteredSinglePlant0.0100.0200.0300.0400.0500.0600.0700.0800.0TRANSMISSIONINVESTMENT($BILLION)�OffshoreWindSpurlines�Land-BasedRenewableSpurlinesBulkTransmissionBASELINELOWAMBITIONMEDIUMAMBITIONHIGHAMBITIONFIGURE18.Investment($billion)inspurlines(onlandandinwater)andbulktransmissionlinesintheBaseline,Low,Medium,andHighAmbitionscenarios,clusteredandsingleplantapproach,2050.21Spurlinetransmissionreferstolinesneededtoconnectremoterenewableenergygenerationtothebulktransmissionsystemorloadcenters.Bulktransmissionreferstolarger,higher-capacitytransmissionlinesdesignedtocarryelectricityacrosslongdistancesathighvoltages,typicallyabove115kV.20353.0THEREPORT37Inouranalysis,offshorewindinterconnectioncostsareestimatedonasingleplantbasis,meaningthatasingleoffshorewindplant(600MW)isindividuallyconnectedtotheclosestavailableonshoregridconnection.ThisconceptualapproachissimilartothatdetailedbyNRELandBloombergNewEnergyFinance(BNEF)andresultsinexpectedinterconnectioncostsrangingfrom$800-$1100/kW(Beiteretal.,2016;BNEF,2021).Theseinterconnectioncosts,whichcanultimatelycomprise20-30%oftotaloffshorewindplantinvestmentcost,arehigherforoffshorewindthanland-basedwind.Thisapproachalsotypicallyrequiresupgradestotheonshoretransmissionnetworktofacilitatetheinterconnection.Clusteringmultipleoffshorewindplantstogetherandconnectingthemtotheonshoregridusingasinglehigh-voltagelinecansignificantlyreduceinterconnection(spurline)costs,whileincreasingresourceoptimization,economiesofscale,andenergyoutput(Figure19).Italsohasknock-oneffects,exploredinthepolicyreportandaBrattleanalysis,ofimprovingdevelopercertainty,facilitatinggreatercompetition,reducingenvironmentalandcommunityimpacts,andpotentiallyimprovinggridresilience(Pfeifenbergeretal.,2023;EnergyInnovation,2023).Thissharingofhigh-voltagetransmissioninfrastructure,includingconverterstationsandsubmarinecables,couldreduceU.S.offshorewindspurlinecostsby35%onaverage,asexplainedindetailintheAppendix.IfallplantsintheHighAmbitionscenarioareconnectedtotheonshoretransmissionsystemusingtheclusteredinterconnectionapproach,theoffshorespurlinecostsarereducedbyapproximately$135billion(from$532billionto$397billion)(Figure18).ThenationalgridoperatorintheUnitedKingdom,NationalGrid,estimatedthattheclusteredapproachcanlowerthecapitalandoperatingexpenditureofthetransmissionsystemby18%between2018and2050(NationalGridESO,2022).Thisapproachissimilartotheland-basedtransmissionplanconductedbythegridoperatorinTexas(ERCOT)knownasCompetitiveRenewableEnergyZones(CREZ)(Cohn,2020).20353.0THEREPORT38ARRAYSYSTEMEXPORTSYSTEMGRIDCONNECTIONARRAYSYSTEMEXPORTSYSTEMGRIDCONNECTIONFIGURE19.Representativedisplayofasingleplantinterconnectionapproachandaclusteredtransmissioninterconnectionapproach.Source:BasedonFigure24(Beiteretal.,2016).Thetopfigurerepresentsthesingleplantinterconnectionapproach,inwhicheachoffshorewindplanthasitsownsetofcollection,transport,anddeliveryinfrastructure.Inthisapproach,eachwindturbine’senergygenerationisaggregatedthroughafeedercircuit,whichisthendeliveredviaitsowntransmissioncabletoagridconnectionpointonland.Underthisapproach,exportcostsincreaselinearlywithbothwindplantcapacityanddistancetoshore,makingitdifficulttogaineconomiesofscaleorreduceinterconnectioncosts.Thebottomdiagramillustratesaclusteredtransmissioninterconnectionapproach.Inthiscase,multipleoffshorewindplantsareaggregatedtogetherthroughfeedersandtheaggregatedwindpoweristhentransportedtoagridconnectionviaasingle,high-voltageexportsystemanddeliveredtoasinglegridconnection.Multiplewindplantsarethusabletosharethehigh-voltagetransmissioninfrastructure,includingconverterstationsandsubmarinecables.Theresultisasignificantreductioninoverallinterconnectioncosts,whichhelpsreducethecapitalcostofeachinstalledwindproject.SINGLEPLANTCLUSTERED20353.0THEREPORT39Theclusteredtransmissionapproachallowsforgreateraggregationofoffshorewindproductionintofewercollectionpoints,ultimatelyreducingcosts.Clusteringallowsmultipleoffshorewindplantstosharetransmissioninfrastructure,whichpromisestwomajorefficiencygains.Clusteringenablesdeveloperstobuildfewer,highercapacity,highervoltagesubmarinecablestoreducetheamountoftotalassets,andhighervoltagetransmissionofwindgenerationallowsforlowerlossesinenergy.Theclusteredapproachcanalsomakeiteconomicallyfeasibletoaccesshighqualitywindresourcesatlocationsfurtherfromshore,whilelimitingseabeddisturbancesandreducingthenumberofonshorecrossings(Pfeifenbergeretal.,2023).BulktransmissioncapacityincreasestocomparablelevelsintheBaseline(toapproximately276,000GW-miles)andHighAmbition(to268,000GW-miles)scenariosby2050.However,aheavierrelianceonoffshorewindalsoshiftsnewbulktransmissioninfrastructureinvestmentstodifferentlocations:fromthemiddleofthecountryfortheBaselinescenariotowardthecoastfortheOffshoreWindPolicyscenarios(Figure20).BulktransmissioncostsarehigherperGW-milealongthecoastthanthosefoundinland,resultinginslightlyhigherbulktransmissioncostsfortheOffshoreWindPolicyscenarios.NEWTRANSMISSIONCAPACITY(MW)110010,000FIGURE20.NewbulktransmissionlinesintheHighAmbitionscenario,2050.20353.0THEREPORT40OFFSHOREWINDGENERATIONCANEFFECTIVELYBALANCELAND-BASEDRENEWABLEGENERATIONTOSUPPORTADEPENDABLEGRIDAdiverseportfolioofcleanenergytechnologies,buoyedbyanewinfluxofoffshorewind,iscriticaltoensuringfuturegriddependabilitywiththeanticipatedmajorincreasesinenergydemandthrough2050.Notonlycanoffshorewindprovideabundantenergy,itsgenerationpatternsareparticularlycomplementarytoexistingcleanenergytechnologies.Itisanticipatedthateconomy-wideelectrificationwillshiftnationalpeakloadperiodsfromsummerafternoonstowintermornings.Ouranalysissuggeststhatachievingnear-netzeroemissionsby2050throughelectrificationoftheeconomywillresultintheannualdemandforelectricitytosoarto10,700TWh,withdailypeakdemandreachingover2,100GWinthewinter.Inthissection,weexaminethegenerationimpactsoftheHighAmbitionscenario,inordertodemonstratethedependabilityofagridoperatingwithextremelyhighlevelsofoffshorewindandotherrenewableenergygeneration.DennisSchroeder/NREL20353.0THEREPORT412,0001,5001,0005000-5002,0001,5001,0005000-500GENERATION(GWh)GENERATION(GWh)JANUARYAUGUSTLoad�Curtailment�OffshoreWind�OnshoreWind�Solar�BatteriesCharging/Discharging�GreenHydrogen�Hydropower/HydroPumping�Nuclear�Other�Gas�CoalHOUROFTHEDAY(EST)HOUROFTHEDAY(EST)24681012141618202224246810121416182022242,0001,5001,0005000-500GENERATION(GWh)APRILHOUROFTHEDAY(EST)24681012141618202224FIGURE21.NationalaveragehourlygenerationdispatchintheHighAmbitionscenario,January,April,andAugust,2050.Duringperiodsofnormaldemandandgeneration,acombinationofsolar,offshoreandland-basedwind,andnewbatterystoragearelargelysufficienttomeetload.Batteriesareparticularlycriticaltomeetthedemandduringnon-solareveninghours.Duringperiodsofhighdemand,otherresourcessuchasgreenhydrogencombustionturbinesrampuptofillrisingenergydemand.Duringnormalperiodsofgenerationanddemand,theportfolioofland-basedwind,solar,andoffshorewind,combinedwithbatterystorage,issufficienttomeetenergyneeds,providing80%-90%oftotalelectricitygeneration(Figure21,Figure22).Duringperiodsofhighdemand,particularlyinpeakwintermonthssuchasJanuary,otherresourcesrampuptofillrisingenergydemand.Inparticular,greenhydrogencombustionturbines(CT)helpcompensateformismatchesindemandandrenewablegeneration.Thisisnotapredictionofhydrogen’sroleinthepowersector,butratherreflectsthefactthatresourceslowincapitalcostandhighinvariablecostarecomplementarywithhighshares20353.0THEREPORT42ofvariablerenewables.GreenhydrogenCTscontributeapproximately6-7%oftotalgenerationin2050inallOffshoreWindPolicyscenarios,providingareliablebackupduringperiodsoflowrenewableproductionorhighdemand.IntheBaselinescenario,greenhydrogenCTgenerationaccountsfor9%oftotalgeneration,slightlyhigherthanintheOffshoreWindPolicyscenarios.TheBaselinescenariorequiresslightlygreaterrelianceonhydrogengenerationasaresultoflessoffshorewindgeneration,whichtypicallyhasahighcapacityfactorandcanthusprovideadditionalgeneration.Itisimportanttonotethatpowersystemswithhighproportionsofrenewableswilllikelyrequirefirmgeneration,buttheexactresourcemixandtechnologymaychangedependingonfuturecostdeclinesandtechnologyimprovements.22463626166-4DAILYENERGY(TWh/DAY)1-JAN1-FEB1-MAR1-APR1-MAY1-JUN1-JUL1-AUG1-SEP1-OCT1-NOV1-DEC31-DECLoad�Curtailment�OffshoreWind�OnshoreWind�Solar�GreenHydrogen�Hydropower�Nuclear�Other�Gas�Coal�Battery0FIGURE22.Nationaldailyenergybalancein2050intheHighAmbitionscenario,averagedoversevenweatheryears.Duringperiodsofnormaldemandandgeneration,suchasApril,thedispatchstackisdominatedbyoffshorewind,solar,land-basedwind,andbatterydischarge.Inmonthswithhigherdemandorlowerrenewablegeneration,greenhydrogenCTgenerationincreasestomeetdemand.Tohighlightthedependabilityofa95%cleanelectricitygridin2050,show-casehowgenerationpatternsofrenewableresourcesbalanceeachother,andestimatefirmcapacityrequirements,weidentifiedtheperiodduringthesevenweatheryearsthatexperiencedthelargestgapbetweencleanelectric-itygeneration(includingbatterygeneration)andload.22NREL’srecentreport,ExaminingSupply-SideOptionstoAchieve100%CleanElectricityby2035offersadditionalinsightintothecomplexityofmodeling100%systems(Denholmetal.,2022).Inthisanalysis,NRELreliesonnumerousnewtechnologiesto“mitigatesupply/demandimbalancesoverlongertimescales.”Forexample,acorescenariothatdoesnotrelyoncarboncaptureandsequestrationrequirescloseto700GWofhydrogenCTs.Forcomparison,ourOffshoreWindPolicyscenariosinstallapproximatelyhalfthatamountin2035.20353.0THEREPORT43Themaximumnetloadperiod,whenhydrogenCTgenerationreachesitspeakof1,080GW,occursonJanuary19thinoneoftheweatheryears(2011)(Figure23).At7:00amEasternTimeonthatday,solargenerationisnearzero,whileonshorewindgenerationisashighas228GW,or40%ofitsinstalledcapacity.Thetotalsystemdemandofabout2,011GWismetbyacombinationofoffshorewindgeneration(316GW,representingabout45%ofinstalledcapacity)andothercleanresources,suchashydropowerandnuclear(140GWtotal),approximately1,080GWofhydrogenCT’s,and155GWofbatterystoragedischarge.JAN16JAN17JAN18JAN19JAN20JAN21JAN222,5002,0001,5001,0005000-500GENERATION(GWh)LoadCurtailmentOffshoreWindOnshoreWindSolarBatteriesCharging/DischargingGreenHydrogenHydropower/HydroPumpingNuclearOtherGasCoalFIGURE23.Nationaldispatch,HighAmbitionscenario,duringthemaximumnetloadweekoversevenweatheryears(2050).Acrosssevenweatheryears,thehydrogencapacityrequirementsprovedtobehighestinthewintermonths(December-February),whensolargenerationfallssignificantlyanddemandpicksupduetoincreasedelectrificationdemand.HydrogenCTgenerationabove500GWisrequiredforfewerthan100hoursperyearacrosstheseven-yearsimulation.Ofthe1,080GWofhydrogenCTdispatchedin2050intheHighAmbitionscenario,500GWhaveacapacityfactorlessthan1%,meaningthatresourcesareusedveryinfrequently(Figure24).Furtherresearchisneededtounderstandtheinteractionsbetweenindustrialend-uses,thehydrogeneconomy,anddemandtoexploretheroleofhydrogeninazero-carboneconomywithhigherfidelity.20353.0THEREPORT441,2001,0008006004002000GREENHYDROGENGENERATION(GW)010,00020,00030,00040,00050,00060,00070,000NUMBEROFHOURS1,1001,0501,0009509008508007507000200400600800FIGURE24.DurationcurveofgreenhydrogenCTgenerationoversevenweatheryears.23Nearly40%oftotalinstalledgreenhydrogenCTcapacity,approximately500GW,hasacapacityfactoroflessthan1%,meaningthatthesepeakingresourcesruninfrequently.Thismodelingapproachrepresentsaconservativestrategyforachieving95%cleanelectricity.Othertechnologyalternativesnotconsideredinthisanalysis,suchasdemandresponse,energyefficiency,orflexibleload,maybemorecost-effectiveforsystembalancinginpeakhours.Variouscomplementaryapproachescouldhelpachievethisdeepdecarbonizationpathway,withpotentialforevenlowersystemcostsandacceleratedemissionsreductions.Forexample,flexibleloadssuchasresponsiveelectricvehiclecharging,waterheating,orlargeindustrialloads,includingelectrolysis,couldrespondtochanginggridconditionsfasterandmorecost-effectivelythanconventionalpowergenerators.Flexibleloadscouldsimilarlytakeadvantageofzeroornegativelypricedelectricitythatislikelytooccurduringhoursofcurtailment,withthepotentialtoincreasetheoverallcleanenergyshare.Othertechnologieslikeadvancedgeothermal,advancednuclear,long-durationstorage,carboncapture,andhydrogenfuelcellscouldfurtherdiversifythetechnologyset23Notethat2007-2013didnothaveparticularlyseverewinterstormscomparedtosomeotherperiods.Therefore,foramorerobustanalysis,additionalassessmentincludingsimulationsover30weather-yearsmaybeneeded.20353.0THEREPORT45exploredinournetzeroscenarios,whichweredesignedtoprincipallyfocusontheimpactsofoffshorewinddeployment.SCALINGTHEDOMESTICOFFSHOREWINDINDUSTRYCOULDCREATENEARLY390,000JOBSANDSPURECONOMICACTIVITYACROSSTHECOUNTRYScalingadomesticoffshorewindindustryhasthepotentialtobringnewjobs,revitalizelocalcommunities,spurdomesticmanufacturing,andfurtherstimulatetheentireU.S.economythroughincreasedeconomicactivity.Whenisolatingtheimpactsofjustoffshorewinddevelopment,theHighAmbitionoffshorewindpolicyscenariocouldemployapproximately390,000peopleacrosstheeconomyin2050(Figure25).Inordertoevaluatethemacroeconomicandemploymentimpactsofatargeteddeploymentofoffshorewind,wepartneredwithCambridgeEconometricsusingtheirE3MEmodel,amacroeconometricmodeldesignedtoassessglobalenergyandenvironmentalpolicyimpacts.Forthepurposesofthisanalysis,weonlymodeledtheHighAmbitionoffshorewindpolicyscenario,inordertounderstandthegreatestpotentialmacroeconomicimpactsoftheindustry’sgrowth.Additionaldetailsofthisanalysisareprovidedintheaccompanyingreport,AssessingtheEconomicImpactsandSupplyChainDevelopmentofOffshoreWindintheUS(Hodgeetal.,2023).20353.0THEREPORT46CambridgeEconometricsexaminedalternativescenariostoevaluatetheenergytransitionmodeledinthe2035Report3.0,withbothmodestandambitiousdomesticcontentsupplychainfutures.OutputsfromtheReEDScapacityexpansiontool,includingtotalinvestmentbyenergytechnology,electricityprices,andpowersectorcapacityareusedasinputstotheE3MEmodeltoproducemacroeconomicandemploymentresults.TheE3MEutilizesadifferentbaselinethanthemain2035Reportscenariosinordertobetterunderstandthechangesthatoccurasaresultofdecarbonizationpathways.400350300250200150100500-50400350300250200150100500-50EMPLOYMENT(THOUSANDS)202520302035204020452050202520302035204020452050�Services�Construction�Otherutilities�Electricitysupply�Manufacturing�FossilfuelsupplyMODESTAMBITIOUSFIGURE25.EmploymentcontributionsoftheoffshorewindindustryintheHighAmbitionoffshorewindscenarioundertheModestandAdvancedDomesticContentStrategies,2025-2050.CambridgeEconometricsevaluatedtheimpactofdevelopingdomesticsupplychainsversussourcinglaborandmaterialfromoverseas.Thesescenariosalterthepercentageofgoodsandmaterialssourceddomestically,creatingModestDevelopmentandAmbitiousDevelopmenttrajectories.TherobustdevelopmentofdomesticsupplychainsintheAmbitiousDevelopmentscenario,whichhastheeffectofcreatingmoremanufacturingjobsforoffshorewindcomponentswithintheU.S.,andincreaseddemand(andthereforeemployment)acrossothergoodsandservicesintheirdomesticsupplychains,wouldleadtoanadditional65,000peopleemployedrelativetoaModestdomesticcontentstrategy.Approximatelyhalfofnewoffshorewindjobs(210,000in2050)areintheelectricitysectorrelatedtooperationsandmaintenanceofthesystem.Inthenearterm,thesejobsareconcentratedintheNortheast,whereasignificantamountofnewcapacitycomesonline.Throughoutthestudyperiod,thesejobseventuallyspreadtotheSouth,Gulf,GreatLakes,andWestCoastregionsascapacityinstallationsspreadtotheseareas.Theotherhalfofnew20353.0THEREPORT47jobsarerelatedtoconstruction,manufacturing,andotherinducedimpacts.Manufacturingemploymentisheavilyimpactedbydomesticcontentassumptions—ofthe65,000additionaljobscreatedintheAmbitiousDevelopmentscenariorelativetotheModestDevelopmentscenario,40,000areconcentratedinmanufacturing.ShoringupdomesticsupplychainstoincreaseU.S.manufacturingwouldprovideasubstantiveboosttooverallemploymentopportunities.Importantly,theemploymentandeconomicbenefitsofdomesticoffshorewinddevelopmentarescatteredacrosstheentirecountry.Themajorityofjobimpactsareconcentratedwherecurrentplannedoffshoredeploymentishighest(suchastheNortheastandMid-Atlantic),whilemanufacturingandrelatedjobsspreadthroughoutthenationasoffshorewinddeploymentincreases.Asoffshorewinddeploymentspreadsacrossthecountryovertheyears,employmenttrendsgenerallytracktheinstalledcapacity.Inthenext10-15yearsmodeled,about60%ofemploymentopportunitiesareconcentratedintheEastCoast,NewEngland,Mid-Atlantic,andSouth.Overtime,thisshiftsascapacitydeploymenttrendsshift(Figure26).In2050,forexample,theSouthaccountsfor28%ofemployment.400350300250200150100500400350300250200150100500EMPLOYMENT(THOUSANDS)202520302035204020452050202520302035204020452050PacificMountainGulfNorthCentralGreatLakesSouthMid-AtlanticNewEnglandMODESTAMBITIOUSFIGURE26.EmploymentcontributionsoftheoffshorewindindustrybyregionintheHighAmbitionoffshorewindpolicyscenariounderModestandAmbitiousDomesticContentStrategies,2025-2050.OverallimpactstonationalGrossDomesticProductarestronglylinkedtothepathwayofinvestmentovertime.TheHighAmbitionoffshorewindscenarioresultsinsignificantlyhigherinvestmentinoffshorewindtechnology,butmoremodestinvestmentsinbatterystorageandland-basedsolarand20353.0THEREPORT48wind,asaresultofthehighperformanceofoffshorewind.Dependingonthedomesticcontentoflocalsupplychains,thisscenariocanboostlong-termGDPmodestly—approximately0.1to0.2%—relativetoBaseline,whichequatestoapproximately$40billion(in2021prices)inadditionalU.S.annualeconomicactivityby2050.Supportingworkforcedevelopmenttoenablethislevelofjobgrowthisnotaforegoneconclusionandpolicyinterventionswillberequired.TheEnergyInnovationpolicyreportexploresworkforcedevelopmentpoliciestocomplementdeploymenttargetsandensurethatworkforcesarereadytosupportrapidscalingofoffshorewindwhilemaximizingeconomicbenefitsforcommunitiesimpactedbyoffshorewinddevelopment.20353.0THEREPORT49CONCLUSIONAsofAugust2022,therewerejust42MWofcommercial-scaleoffshorewindoperatinginU.S.waters.Scalingtheoffshorewindindustrytoprovide10-25%ofthenation’s2050electricitydemandwillrequireanambitious,long-termpolicyagenda,robustindustrialpolicysupport,andlargeinvestmentsinthesupplychain,infrastructure,andtransmissionsystems.Thechallengesareimmense,butnotinsurmountable.Inordertoachievenetzerotargets,theU.S.willneedtodeploymorenewgeneratingcapacitythaneverbefore—bothonlandandwater.Butthebenefitscanbehuge—developmentoftheU.S.offshorewindindustrywouldprovideahighlyproductive,reliablecleanenergyresourceneededtohelpachievea2050economy-widenetzerotarget,alongsideambitiousland-basedrenewableenergydevelopment.TheU.S.hasoneofthehighestoffshorewindpotentialsintheworld.ThecleanenergyresourcecanbeeffectivelyintegratedintotheU.S.powergridwithoutsubstantiallyimpactingwholesaleelectricitycosts.Aselectricitydemandincreasesduetoelectrificationtrends,offshorewindcanstrengthenandde-risktheU.S.pathwaytowardspowersectordecarbonization.High-qualityoffshorewindisabundantacrosstheentireU.S.coastline,increasingtheopportunitiesfordeploymentwhileexpandinganddiversifyingeconomicopportunities.Asacomplementaryresourcetoland-basedwindandsolar,offshorewindiswell-suitedtomeettheenergydemandsofanetzeroenergysystem.Scalingtheindustrywillrequirerobustcapitalinvestmentanddurabledomesticpolicysupporttoadvancesupplychainandinfrastructuredevelopment,butdoingsocouldsupportnearly390,000jobsintheoffshorewindindustryin2050.AcompanionreportfromEnergyInnovationdescribesthekeypolicyrecommendationstoenableanequitable,sustainedcommitmenttooffshorewinddevelopmentintheUnitedStates(EnergyInnovation,2023).20353.0THEREPORT50ADDITIONAL2035REPORTRESOURCESTechnicalAppendixPolicyPrioritiestoEnsureOffshoreWindPlaysaCentralRoleinourNet-ZeroFutureEnablingOffshoreWindDevelopmentThroughEffectiveTransmissionPlanningAssessingtheEconomicImpactsandSupplyChainDevelopmentofOffshoreWindintheUSOffshoreWindSupplyChainDevelopmentandInvestmentAnalysis2035Report1.0:PlummetingSolar,Wind,andBatteryCostsCanAccelerateourCleanElectricityFuture2035Report2.0:PlummetingCostsandDramaticImprovementsinBatteriesCanAccelerateourCleanTransportationFuture20353.0THEREPORT51REFERENCES1.Anderson,P.2023.EnetiDropsPlanstoBuildJonesAct-CompliantWTIV.Rigzone.2.AmericanCleanPower(ACP).2023.OffshoreWindMarketReport2023.3.Beiter,P.,Musial,W.,Smith,A.,Kilcher,L.,Damiani,R.,Maness,M.,Sirnivas,S.,Stehly,T.,Gevorgian,V.,Mooney,M.,andScott,G.2016.ASpatial-EconomicCost-ReductionPathwayAnalysisforU.S.OffshoreWindEnergyDevelopmentfrom2015–2030.U.S.DepartmentofEnergy,OfficeofScientificandTechnicalInformation.4.Blair,N.,DiOrio,N.,Freeman,J.,Gilman,J.,Janzou,S.,Neises,T.,andWagner,M.2018.SystemAdvisorModel(SAM)GeneralDescription(Version2017.9.5).NREL/TP-6A20-70414.5.BloombergNewEnergyFinance(BNEF).2021.OffshoreWind-to-HydrogenSoundsAStartingGun.6.BloombergNewEnergyFinance(BNEF,2022).2022.OffshoreWindMarketReport2022.7.BloombergNewEnergyFinance(BNEF,2023).2023.OffshoreWindMarketReport2023.8.BloombergNewEnergyFinance(BNEF,2023a).2023.APowerGridLongEnoughtoReachtheSunisKeytotheClimateFight.9.BloombergNewEnergyFinance(BNEF).2023.SustainableEnergyinAmerica2023Factbook.10.Buljan,A.2023.ChinaLeadsinNewOffshoreWindCapacitySecondYearinRow,LikelytoPreserveTopPositionin2023.Offshorewind.biz.11.BureauofOceanEnergyManagement(BOEM).2020.ComparisonofEnvironmentalEffectsfromDifferentOffshoreWindTurbineFoundations.U.S.Dept.oftheInterior,BureauofOceanEnergyManagement,Headquarters,Sterling,VA.12.BureauofOceanEnergyManagement(BOEM).2021.OffshoreWindLeasingPathForward2021-2025.13.BureauofOceanEnergyManagement(BOEM).2023.RenewableEnergy,StateActivities.14.Cohn,J.,andJankovska,O.2020.TexasCREZLines:HowStakeholdersShapeMajorEnergyInfrastructureProjects;BakerInstituteforPublicPolicy.RiceUniversity,Houston,Texas.15.TheBusinessCouncilforSustainableEnergy(BCSE).2023.SustainableEnergyinAmerica2023Factbook.16.DaymarkEnergyAdvisors.2023.EnablingOffshoreWindDevelopmentThroughEffectiveTransmissionPlanning.17.Denholm,P.,Brown,P.,Cole,W.,Mai,T.,Sergi,B.,Brown,M.,Jadun,P.,Ho,J.,Mayernik,J.,McMillan,C.,andSreenath,R.2022.ExaminingSupply-SideOptionstoAchieve100%CleanElectricityby2035.20353.0THEREPORT5218.DepartmentofEnergy,WindEnergyTechnologiesOffice(WETO).2023.ADrivingFORCEforProjectingOffshoreWindEnergyCosts.19.Ellichipuram,U.2021.UKannounces$132minvestmentinoffshorewindports-PowerTechnology.PowerTechnology.20.EnergyEfficiency&RenewableEnergy(EERE).2023.FloatingOffshoreWindShot.21.EnergyExemplar.2023.https://www.energyexemplar.com/plexos.22.EnergyInformationAdministration(EIA).2023.FormEIA-860.23.EnergyInnovation.2023.PolicyPrioritiestoEnsureOffshoreWindPlaysaCentralRoleinourNet-ZeroFuture.24.EuropeanCommission.2023.MemberStatesagreenewambitionforexpandingoffshorerenewableenergy.25.Evans,S.2019.Analysis:Record-lowpriceforUKoffshorewindcheaperthanexistinggasplantsby2023.CarbonBrief.26.FederalEnergyRegulatoryCommission(FERC).2023.EnergyInfrastructureUpdateforDecember2022.27.Gaertner,E.,Rinker,J.,Sethuraman,L.,Zahle,F.,Anderson,B.,Barter,G.,Abbas,N.,Meng,F.,Bortolotti,P.,Skrzypinski,W.,Scott,G.,Feil,R.,Bredmose,H.,Dykes,K.,Shields,M.,Allen,C.,andViselli,A.2020.DefinitionoftheIEA15-MegawattOffshoreReferenceWind.NationalRenewableEnergyLaboratory.28.GlobalEnergyMonitor(GEM).2023.SummaryTables-GlobalEnergyMonitor.29.GlobalWindAtlas.2023.30.GlobalWindEnergyCouncil(GWEC).2023.GlobalWindReport2023.31.Henley,Jon.2023.EuropeancountriespledgehugeexpansionofNorthSeawindfarms.TheGuardian.32.Hodge,D.,Stenning,J.,andFurbush,A.2023.AssessingtheEconomicImpactsandSupplyChainDevelopmentofOffshoreWindintheUS.CambridgeEconometrics.33.Jenkins,J.D.,Farbes,J.,Jones,R.,Patankar,N.,andSchivley,G.2022.“ElectricityTransmissionisKeytoUnlocktheFullPotentialoftheInflationReductionAct,”REPEATProject,Princeton,NewJersey.34.Kuhn,F.,Liebach,F.,Matthey,T.,Schlosser,M.,andZivansky,J.2022.Howtosucceedintheexpandingglobaloffshorewindmarket.35.Lantz,E.,Barter,G.,Gilman,P.,Keyser,D.,Mai,T.,Marquis,M.,Mowers,M.,Shields,M.,Spitsen,P.andStefek,J.2021.PowerSector,SupplyChain,Jobs,andEmissionsImplicationsof30GigawattsofOffshoreWindPowerby2030.Golden,CO:NationalRenewableEnergyLaboratory.NREL/TP-5000-80031.36.Larson,E.,Greig,C.,Jenkins,J.,Mayfield,E.,Pascale,A.,Zhang,C.,Drossman,J.,Williams,R.,Pacala,S.,Socolow,R.,Baik,E.,Birdsey,R.,Duke,R.,Jones,R.,Haley,B.,Leslie,E.,Paustian,K.andSwan,A.2021.Net-ZeroAmerica:PotentialPathways,Infrastructure,andImpacts;PrincetonUniversity,Princeton,NewJersey.37.Lazard.2021.LevelizedCostofEnergyAnalysis–Version15.0.38.Lee,A.2023.China’sMingyanglooks‘beyond18MW’with140-metrebladeoffshorewindturbinegiant.RechargeNews.39.Lewis,M.2023.Acolossal18MWwindturbineisabouttodebutinChina.Electrek.40.Lopez,A.,Mai,T.,Lantz,E.,Harrison-Atlas,D.,Williams,T.,andMaclaurin,G.2021.LanduseandturbinetechnologyinfluencesonwindpotentialintheUnitedStates.NationalRenewableEnergyLaboratory.20353.0THEREPORT5341.Lopez,A.,Green,R.,Williams,T.,Lantz,E.,Buster,G.,andRoberts,B.2022.OffshoreWindEnergyTechnicalPotentialfortheContiguousUnitedStates.U.S.DepartmentofEnergyOfficeofScientificandTechnicalInformation.42.MaritimeBlog.2022.U.S.OffshoreWindWTIVJonesActCompliance.43.Matos,J.andWooley,D.2023.OffshoreWindSupplyChainDevelopmentandInvestmentAnalysis.GoldmanSchoolofPublicPolicy.UniversityofCalifornia,Berkeley.44.Merrill,D.2021.TheU.S.WillNeedaLotofLandforaZero-CarbonEconomy.BloombergNews.45.Murphy,C.,Mai,T.,Sun,Y.,Jadun,P.,Muratori,M.,Nelson,B.,andJones,R.2021.ElectrificationFuturesStudy:ScenariosofPowerSystemEvolutionandInfrastructureDevelopmentfortheUnitedStates.Golden,CO:NationalRenewableEnergyLaboratory.NREL/TP-6A20-72330.46.Musial,W.,Spitsen,P.,Duffy,P.,Beiter,P.,Marquis,M.,Hammond,R.,andShields,M.2022.OffshoreWindMarketReport:2022Edition.47.NationalAeronauticsandSpaceAdministration(NASA).2023.Modern-EraRetrospectiveanalysisforResearchandApplications,Version2(MERRA-2).48.NationalGridESO.2020.HolisticApproachtoOffshoreTransmissionPlanninginGreatBritain.49.NationalGridESO.2022.OffshoreCoordinationProject.50.NationalGridESO.2023.ThePathwayto2030HolisticDesignNetwork.51.NationalRenewableEnergyLaboratory(NREL).2020.AnnualTechnologyBaseline.52.NationalRenewableEnergyLaboratory(NREL).2021.AnnualTechnologyBaseline.53.NationalRenewableEnergyLaboratory(NREL).2022.AnnualTechnologyBaseline.54.NationalRenewableEnergyLaboratory(NREL).2023.RegionalEnergyDeploymentSystemModel.55.NewYorkStateEnergyResearchandDevelopmentAuthority(NYSERDA).2022.NewYorkGreatLakesWindEnergyFeasibilityStudy.NYSERDAReportNumbery22-12.RenewableEnergyLaboratory,AdvisianWorleyGroup,andBrattleGroup/PterraConsulting.56.Optis,M.,Rybchuk,A.,Bodini,A.,Rossol,M.andMusial,W.2020.2020OffshoreWindResourceAssessmentfortheCaliforniaPacificOuterContinentalShelf.Golden,CO:NationalRenewableEnergyLaboratory.NREL/TP-5000-77642.57.Orsted.2023.BlockIslandWindFarm.58.Orvis,R.,Abhyankar,N.,Lin,J.,Kahrl,F.,Yin,S.,Paliwal,U.,Liu,X.,Khanna,N.,Luo,Q.,Wooley,D.,O’Boyle,M.,Ashmoore,O.,Solomon,M.,andPhadke,A.2022.Achievingan80%carbon-freeelectricitysysteminChinaby2035.IScience,25(10),105180.59.Pfeifenberger,J.,DeLosaIII,J.,Bai,L.,Plet,C.,Peacock,C.andNelson,R.2023.TheBenefitandUrgencyofPlannedOffshoreTransmission:ReducingtheCostsandBarrierstoAchievingU.S.CleanEnergyGoals.TheBrattleGroup.60.Phadke,A.,Paliwal,U.,Abhyankar,N.,McNair,T.,Paulos,B.,Wooley,D.andO’Connell,R.2020.2035:PlummetingSolar,WindandBatteryCostscanAccelerateourCleanElectricityFuture;GoldmanSchoolofPublicPolicy.UniversityofCalifornia,Berkeley.61.Phadke,A.,Paliwal,U.,Abhyankar,N.,McNair,T.,andKirsey,J.2021.2035Report2.0:PlummetingCostsandDramaticImprovementsinBatteriesCanAccelerateOurCleanTransportationFuture.UniversityofCalifornia,Berkeley,California.20353.0THEREPORT5462.PortEsbjerg.2023.Aworld’sfirst:DigitaltwinhelpsPortEsbjergtripleitswindcapacity.63.Rand,J.,Strauss,R.,Gorman,W.,Seel,J.,MulvaneyKemp,J.,Jeong,S.,Robson,D.,Wiser,R.2023.QueuedUp:CharacteristicsofPowerPlantsSeekingTransmissionInterconnection.NationalRenewableEnergyLaboratory.64.Richards,H.2021.Offshorewindtorevive‘hallowedground’forU.S.steel-E&ENews.E&ENews.65.Shaner,M.R.,Davis,S.J.,Lewis,N.S.,andCaldeira,K.2018.GeophysicalconstraintsonthereliabilityofsolarandwindpowerintheUnitedStates.Energy&EnvironmentalScience,11(4),914–925.66.Shields,M.,Marsh,R.,Stefek,J.,Oteri,F.,Gould,R.,Rouxel,N.,Diaz,K.,Molinero,J.,Moser,A.,Malvik,C.andTirone,S.2022.TheDemandforaDomesticOffshoreWindEnergySupplyChain.Golden,CO:NationalRenewableEnergyLaboratory.NREL/TP-5000-81602.67.Shields,M.,Stefek,J.,Oteri,F.,Maniak,S.,Kreider,M.,Gill,E.,Gould,R.,Malvik,C.,Tirone,S.andHines,E.2023.ASupplyChainRoadMapforOffshoreWindEnergyintheUnitedStates.Golden,CO:NationalRenewableEnergyLaboratory.NREL/TP-5000-84710.68.UnitedNationsIntergovernmentalPanelonClimateChange(UNIPCC).2023.SynthesisReportoftheIPCCSixthAssessmentReport:SummaryforPolicymakers.69.UnitedStatesDepartmentofAgriculture(USDA).2017.WindEnergyLandDistributionInTheUnitedStatesofAmerica.70.UnitedStatesEnergyInformationAdministration(EIA)TodayinEnergy.2023.MorethanhalfofnewU.S.electric-generatingcapacityin2023willbesolar.71.UnitedStatesGeologicalSurvey(USGSa).2022.MineralCommoditySummaries2022-IronandSteel.72.UnitedStatesGeologicalSurvey(USGSb).2022.HowmanyturbinesarecontainedintheU.S.WindTurbineDatabase?73.VineyardWind.2023.VineyardWind1.74.Way,R.,Ives,M.,Mealy,P.andFarmer,J.D.2022.Empiricallygroundedtechnologyforecastsandtheenergytransition.Joule.75.Xu,M.2023.Reuters.Chinasolarpowercapacitycouldpostrecordgrowthin2023.20353.0THEREPORT55
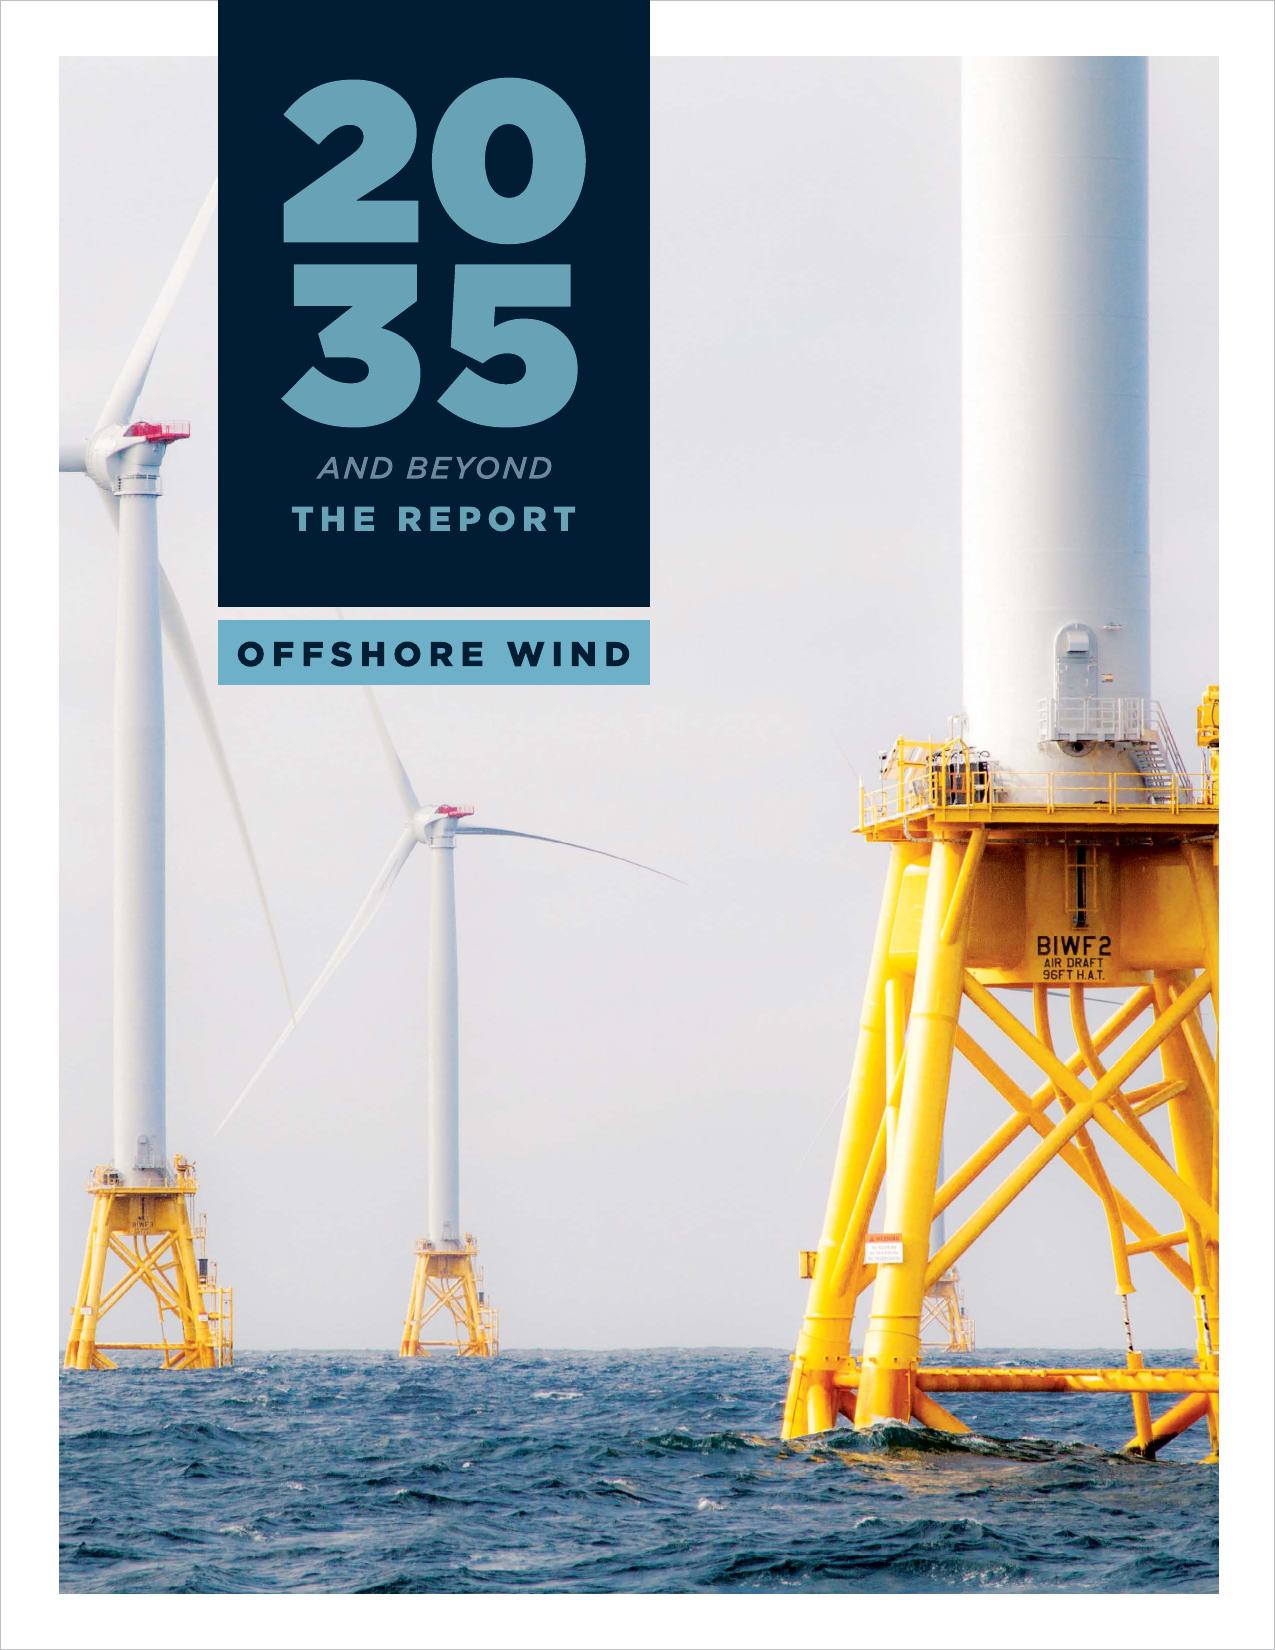

 VIP
VIP


