美国各州工业电气化(英文原版)VIP专享VIP免费

Ali Hasanbeigi, Ph.D. - Global Eciency Intelligence
Lynn A. Kirshbaum and Blaine Collison - David Gardiner and Associates
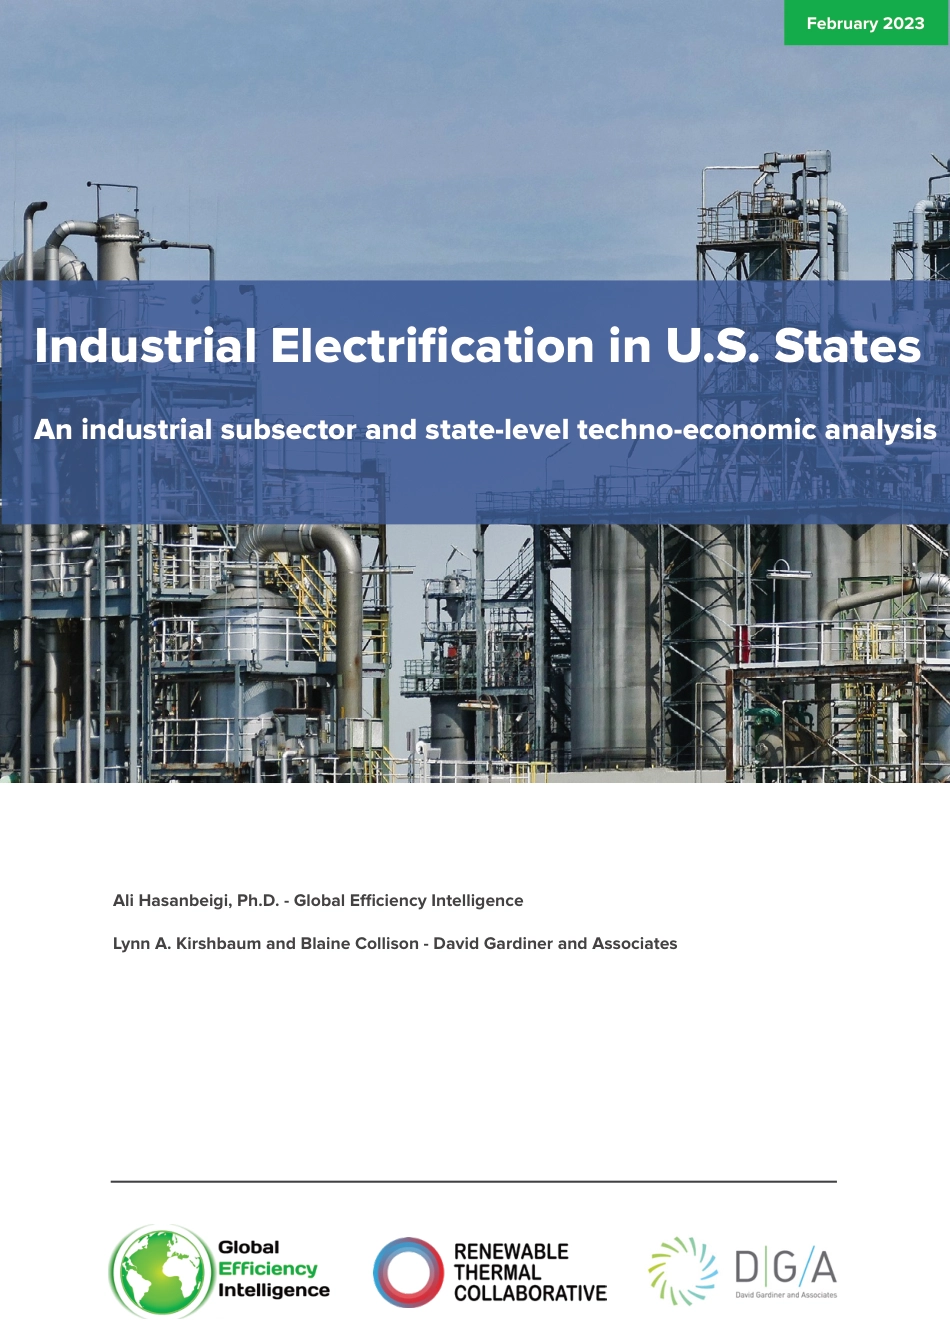
Industrial Electrification in U.S. States
An industrial subsector and state-level techno-economic analysis
February 2023
1
Industrial Electrification in U.S. States
Foreword by the authors
This report is a follow-up study to our previous report, “Electrifying U.S. Industry: A
Technology- and Process-Based Approach to Decarbonization.” In the previous report, we
studied the electrification potential for U.S. industry across 12 sub-sectors at the national level.
In this report, we analyze the electrification potential for the same 12 sub-sectors, but at the
state level, focusing on 20 states. The dierences in industries, energy prices, and electricity
grid emissions factors across dierent states are considered in this study to determine the
electrification potential.
Acknowledgements
This report was made possible with support from the ClimateWorks Foundation. The authors
would like to thank Rebecca Dell, Dan Fahey, and Lauren Marshall of the ClimateWorks
Foundation, Claire Dougherty and David Gardiner of David Gardiner and Associates, Jibran
Zuberi of Lawrence Berkeley National Laboratory, Ed Rightor of ACEEE, Colin McMillan of the
National Renewable Energy Laboratory, Sara Baldwin of Energy Innovation, and John Marano
of JM Energy Consulting for their valuable input to this study and/or their insightful comments
on earlier versions of this document.
Disclaimer
Global Eciency Intelligence, LLC and David Gardiner and Associates have provided the information
in this publication for informational purposes only. Although great care has been taken to maintain the
accuracy of the information collected and presented, Global Eciency Intelligence, LLC and David
Gardiner and Associates do not make any express or implied warranty concerning such information.
Any estimates contained in the publication reflect Global Eciency Intelligence, LLC’s and David
Gardiner and Associates’ current analyses and expectations based on available data and information.
Any reference to a specific commercial product, process, or service by trade name, trademark,
manufacturer, or otherwise does not constitute or imply an endorsement, recommendation, or favoring
by Global Eciency Intelligence, LLC and David Gardiner and Associates.
The report does not necessarily represent the perspectives of all Renewable Thermal Collaborative
(RTC) members or sponsors. An organization’s participation in this project does not represent an
endorsement of the full contents of this report.
This document may be freely quoted or reprinted, but acknowledgment is requested.
https://www.globaleciencyintel.com
https://www.renewablethermal.org
2
Industrial Electrification in U.S. States
The United States set an economy-wide target to reduce its net greenhouse gas (GHG)
emissions to 50-52% below 2005 levels by 2030 and set a goal to reach 100% carbon
pollution-free electricity by 2035. Meeting these goals will require a concentrated eort to
develop and deploy clean technologies across sectors. The U.S.’s emissions reduction targets
place a new emphasis on industrial emissions, highlighting the need for commercialization and
deployment of cleaner industrial technologies. Unleashing US$369 billion in climate and clean
energy incentives, the Inflation Reduction Act (IRA) provides powerful tailwinds for achieving
these climate change mitigation targets.
The industrial sector accounts for about a quarter of energy use and GHG emissions in the
U.S. While emissions from electricity generation continue to decline, thermal energy needs in
industry, especially for process heating, are a significant challenge for climate change
mitigation eorts.
There is a significant opportunity to decarbonize the industrial sector by shifting away from
carbon-intensive fossil fuels to clean sources such as electrification, where low- or zero-car-
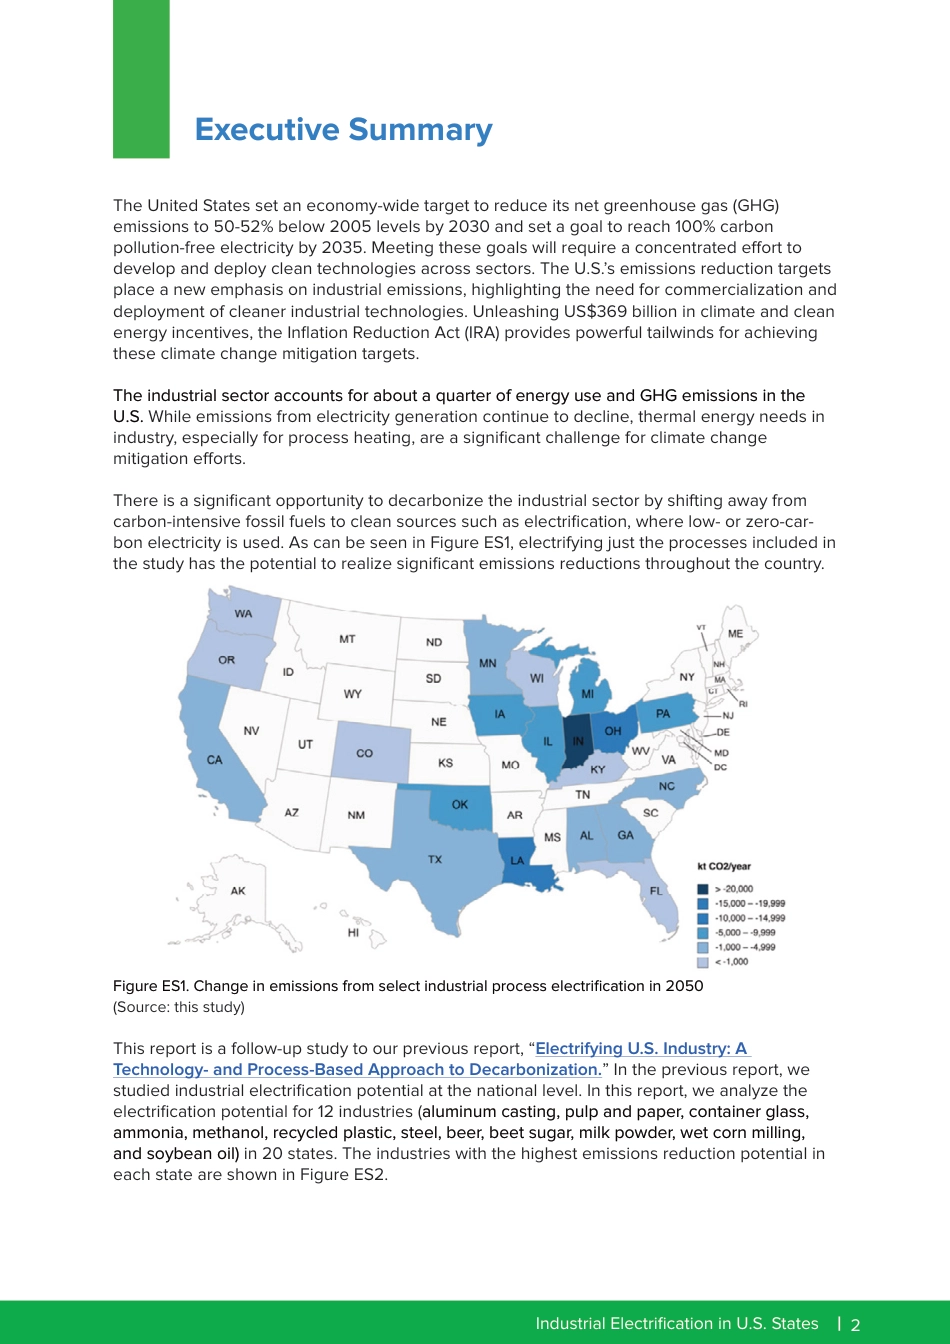
bon electricity is used. As can be seen in Figure ES1, electrifying just the processes included in
the study has the potential to realize significant emissions reductions throughout the country.
Figure ES1. Change in emissions from select industrial process electrification in 2050
(Source: this study)
This report is a follow-up study to our previous report, “Electrifying U.S. Industry: A
Technology- and Process-Based Approach to Decarbonization.” In the previous report, we
studied industrial electrification potential at the national level. In this report, we analyze the
electrification potential for 12 industries (aluminum casting, pulp and paper, container glass,
ammonia, methanol, recycled plastic, steel, beer, beet sugar, milk powder, wet corn milling,
and soybean oil) in 20 states. The industries with the highest emissions reduction potential in
each state are shown in Figure ES2.
Executive Summary
AliHasanbeigi,Ph.D.-GlobalEfficiencyIntelligenceLynnA.KirshbaumandBlaineCollison-DavidGardinerandAssociatesIndustrialElectrificationinU.S.StatesAnindustrialsubsectorandstate-leveltechno-economicanalysisFebruary20231IndustrialElectrificationinU.S.StatesForewordbytheauthorsThisreportisafollow-upstudytoourpreviousreport,“ElectrifyingU.S.Industry:ATechnology-andProcess-BasedApproachtoDecarbonization.”Inthepreviousreport,westudiedtheelectrificationpotentialforU.S.industryacross12sub-sectorsatthenationallevel.Inthisreport,weanalyzetheelectrificationpotentialforthesame12sub-sectors,butatthestatelevel,focusingon20states.Thedifferencesinindustries,energyprices,andelectricitygridemissionsfactorsacrossdifferentstatesareconsideredinthisstudytodeterminetheelectrificationpotential.AcknowledgementsThisreportwasmadepossiblewithsupportfromtheClimateWorksFoundation.TheauthorswouldliketothankRebeccaDell,DanFahey,andLaurenMarshalloftheClimateWorksFoundation,ClaireDoughertyandDavidGardinerofDavidGardinerandAssociates,JibranZuberiofLawrenceBerkeleyNationalLaboratory,EdRightorofACEEE,ColinMcMillanoftheNationalRenewableEnergyLaboratory,SaraBaldwinofEnergyInnovation,andJohnMaranoofJMEnergyConsultingfortheirvaluableinputtothisstudyand/ortheirinsightfulcommentsonearlierversionsofthisdocument.DisclaimerGlobalEfficiencyIntelligence,LLCandDavidGardinerandAssociateshaveprovidedtheinformationinthispublicationforinformationalpurposesonly.Althoughgreatcarehasbeentakentomaintaintheaccuracyoftheinformationcollectedandpresented,GlobalEfficiencyIntelligence,LLCandDavidGardinerandAssociatesdonotmakeanyexpressorimpliedwarrantyconcerningsuchinformation.AnyestimatescontainedinthepublicationreflectGlobalEfficiencyIntelligence,LLC’sandDavidGardinerandAssociates’currentanalysesandexpectationsbasedonavailabledataandinformation.Anyreferencetoaspecificcommercialproduct,process,orservicebytradename,trademark,manufacturer,orotherwisedoesnotconstituteorimplyanendorsement,recommendation,orfavoringbyGlobalEfficiencyIntelligence,LLCandDavidGardinerandAssociates.ThereportdoesnotnecessarilyrepresenttheperspectivesofallRenewableThermalCollaborative(RTC)membersorsponsors.Anorganization’sparticipationinthisprojectdoesnotrepresentanendorsementofthefullcontentsofthisreport.Thisdocumentmaybefreelyquotedorreprinted,butacknowledgmentisrequested.https://www.globalefficiencyintel.comhttps://www.renewablethermal.org2IndustrialElectrificationinU.S.StatesTheUnitedStatessetaneconomy-widetargettoreduceitsnetgreenhousegas(GHG)emissionsto50-52%below2005levelsby2030andsetagoaltoreach100%carbonpollution-freeelectricityby2035.Meetingthesegoalswillrequireaconcentratedefforttodevelopanddeploycleantechnologiesacrosssectors.TheU.S.’semissionsreductiontargetsplaceanewemphasisonindustrialemissions,highlightingtheneedforcommercializationanddeploymentofcleanerindustrialtechnologies.UnleashingUS$369billioninclimateandcleanenergyincentives,theInflationReductionAct(IRA)providespowerfultailwindsforachievingtheseclimatechangemitigationtargets.TheindustrialsectoraccountsforaboutaquarterofenergyuseandGHGemissionsintheU.S.Whileemissionsfromelectricitygenerationcontinuetodecline,thermalenergyneedsinindustry,especiallyforprocessheating,areasignificantchallengeforclimatechangemitigationefforts.Thereisasignificantopportunitytodecarbonizetheindustrialsectorbyshiftingawayfromcarbon-intensivefossilfuelstocleansourcessuchaselectrification,wherelow-orzero-car-bonelectricityisused.AscanbeseeninFigureES1,electrifyingjusttheprocessesincludedinthestudyhasthepotentialtorealizesignificantemissionsreductionsthroughoutthecountry.FigureES1.Changeinemissionsfromselectindustrialprocesselectrificationin2050(Source:thisstudy)Thisreportisafollow-upstudytoourpreviousreport,“ElectrifyingU.S.Industry:ATechnology-andProcess-BasedApproachtoDecarbonization.”Inthepreviousreport,westudiedindustrialelectrificationpotentialatthenationallevel.Inthisreport,weanalyzetheelectrificationpotentialfor12industries(aluminumcasting,pulpandpaper,containerglass,ammonia,methanol,recycledplastic,steel,beer,beetsugar,milkpowder,wetcornmilling,andsoybeanoil)in20states.TheindustrieswiththehighestemissionsreductionpotentialineachstateareshowninFigureES2.ExecutiveSummary3IndustrialElectrificationinU.S.StatesFigureES2.Industrieswiththehighestemissionsreductionpotentialfromelectrificationin2050(Source:thisstudy)Thereportidentifiesspecificprocessesthatcouldbeelectrifiedintheneartermwithcommerciallyavailabletechnologiesandanalyzestheexpectedchangesinenergyuse,CO2emissions,andenergycosts.Understandingwhichconventionalprocessescouldbeelectrifiedandhowthisimpactsemissionsandcostscanhelpindustrialfacilitiesidentifywhichoftheirprocessesmaybesuitablecandidatesforelectrification.Inaddition,understandingthepotentialgrowthinindustrialelectricitydemandthatwillresultfromelectrificationcanhelputilities,gridoperators,andelectricitygeneratorsplanforthesechangesandensureequipmentandgenerationresourcesareavailabletomeetthegrowingdemandforrenewableelectricity.Itshouldbenotedthat,inpractice,electrificationprojectswillhappenattheplantlevel.Ifagivenindustrialfacilityinanystateelectrifiesitsprocessheatingdemandtodayandpurchasesrenewableelectricity(e.g.,throughapowerpurchaseagreement(PPA))tosupplytheelectricitydemandoftheelectrifiedprocessheating,theCO2emissionsreductionsfromelec-trificationcanbeachievedimmediately.Therefore,ourstate-levelresultsthatarebasedonexpectedgrid-widedecarbonizationtimelinesshouldnotover-ridetheimmediatedecarbon-izationimpactofanelectrifiedplantpartneredwithanewrenewableenergypurchase.Plantsdonotneedtowaituntilthegridisdecarbonizedtohaveemissionsreductionimpacts.Emissionsreductionshaveglobalbenefits,helpingtomitigateclimaterisksandclimatechangeimpactsaroundtheworld.Butreducingemissionshaslocalbenefitstoo.Whenindustrialfacilitiesusefossilfuelson-site,surroundingcommunitiescanbeimpactedbytheresultingairpollution.IntheU.S.,low-incomecommunitiesareoftenexposedtohigherlevelsofairpollutioninurbanandruralareas,andinallstates.Industrialelectrificationoffersanopportunitytoreducelocalizedemissionsandimprovehealthoutcomesforcommunities.Electrifyingindustrialprocessesandrealizingthesebenefitswillrequireamultifacetedefforttosolvesignificantchallengesinrenewableelectricitygenerationandtransmission,technologydevelopmentanddeployment,andworkforcedevelopment.Thisreportrecommendssiximpactfulchangesthatwouldsupportincreasedindustrialelectrification:1)Supportdemonstrationofemergingelectrificationtechnologiesandnewapplicationsofexistingtechnologies,2)Financiallyincentivizeelectrification,3)Increaserenewableelectricitygenerationcapacity,4)Enhancetheelectricitygrid,5)Engagecommunities,and6)Developtheworkforce.4IndustrialElectrificationinU.S.StatesExecutivesummary21.Introduction51.0.Theindustrialthermalenergychallenge51.1.Theelectrificationopportunity61.2.Asector-andstate-specificanalysis72.U.S.industrialenergyuseandheatconsumptionprofile83.State-levelindustrialelectrificationpotential113.0.Methodology113.1.Aluminumcastingindustry163.2.Pulpandpaperindustry203.3.Containerglassindustry243.4.Ammoniaindustry283.5.Methanolindustry323.6.Plasticrecyclingindustry353.7.Steelindustry383.8.Beerindustry443.9.Beetsugarindustry473.10.Milkpowderindustry503.11.Wetcornmillingindustry533.12.Soybeanoilindustry583.13.TotalenergysavingsandCO2emissionsreductionpotential624.Industrialelectrification’simpactontheelectricitygrid654.0.TheU.S.electricitygrid654.1.Industrialelectrification’selectricitygridimpacts665.Industrialelectrificationco-benefits685.0.Whatareco-benefits?685.1.Improvingairqualityandhealthoutcomes695.2.Controllingcosts695.3.Ensuringequitablerealizationofco-benefits695.4.Analyzingnear-termbenefits706.Recommendationstoaccelerateindustrialelectrification72References76Appendices80Appendix1.Industrialelectrificationtechnologies80Appendix2.Industrialelectrificationtechnologies’benefitsandchallenges83Appendix3.Baseyearandprojectedindustrialenergyprices85TableofContents5IndustrialElectrificationinU.S.StatesTheUnitedStatessetaneconomy-widetargettoreduceitsnetgreenhousegas(GHG)emissionsto50-52%below2005levelsby2030andsetagoaltoreach100%carbonpollution-freeelectricityby2035.(UNFCCC2021).Meetingthesegoalswillrequireaconcentratedefforttodevelopanddeploycleantechnologiesacrosssectors.Theelectricitygenerationandtransportationsectorshavebenefittedfromtwodecadesofsupportivepoliciesforandinvestmentsintechnologyresearchanddevelopment,whilesimilarsupportfortheindustrialsectorhaslaggedbehind.TheU.S.’semissionsreductiontargetsplaceanewemphasisonindustrialemissions,highlightingtheneedforcommercializationanddeploymentofcleanertechnologies.UnleashingUS$369billioninclimateandcleanenergyincentives,theInflationReductionAct(IRA)providespowerfultailwindsforachievingtheseclimatechangemitigationtargets.Industrialelectrificationoffersapathwaytodecarbonizenumerousindustrialthermalprocesses.Furtherrenewableelectricitydeploymentreducesgridemissionsfactorsacrossthecountry,creatinganear-termopportunitytoreduceindustrialthermalemissionsthroughelectrification.Thisreportidentifiesspecificindustrialthermalprocessesthatcouldbeelectrified,manywithcommerciallyavailabletechnologies.1.0.TheIndustrialThermalEnergyChallengeIndustrialthermalenergyneeds,especiallyforheat,areasignificantchallengeforclimatechangemitigationefforts.Heatrepresentstwo-thirdsofallenergydemandintheindustrialsector(IEA2018a).However,only10%ofthisdemandismetusingrenewableenergy(OECD/IEA2014).IntheUnitedStates,dueinlargeparttothecountry’srelativelyinexpensivenaturalgas,fossilfuelcombustiontoproduceheatandsteamusedforprocessheating,reactions,evaporation,concentration,anddryingcreatesabout52%ofthecountry’sindustrialdirectGHGemissions(McMillan2017).Despiteindustrialthermal’ssignificantcontributionstoglobalenergydemandandGHGemissions,scalable,cost-effectivesolutionstoaddressthermalenergyemissionsfromtheprocessandotheron-siteheatingandcoolingneedsarenotwidelyavailable.Thisiscontrastedwiththetransportationandpowersectors,whereavailablerenewableelectricity,electricvehicles,andnewmobilitystrategiesreflectimportantprogressoverthepasttwodecades.Renewablethermalenergysolutions,includingelectrificationsolutions,facemanytechnology,market,andpolicybarriersthathindertheirdevelopmentanddeploymentatscale,asdescribedinourpriorreport(Hasanbeigietal.2021).Thermalenergyfacesseveraluniquechallengeswhencomparedwithrenewableelectricity.Thermalneedsvarytremendouslyfromoneindustrialprocesstoanotherandareoftensite-orsector-specific.Processesalsorequireheatatwidelydifferenttemperatures,andsolutionsforhigh-tempera-tureprocessesdiffergreatlyfromlow-temperatureprocesses.Manyindustrialthermalenergybuyershavesetforthemselvesambitious,science-basedemissionsreductiontargets,recognizingtheurgentneedtoreduceemissionsnotonlyfromelectricitygenerationbutalsofromthermalenergyconsumption.Butmeetingtheseindividualgoals,aswellasthenation’semissionsreductiongoals,willprovechallengingwithoutfurtherdevelopmentanddeploymentofemissions-reducingtechnologies.Introduction16IndustrialElectrificationinU.S.States1.1.TheElectrificationOpportunityThereisasignificantopportunitytodecarbonizetheindustrialsectorbyshiftingheatproduc-tionawayfromcarbon-intensivefossilfuelstocleansourcessuchaselectrification,wherelow-orzero-carbonelectricityisused.Globally,morethan50%ofthefinalenergydemandisforheating,andabouthalfisforindustrialheating(IEA2018b).Thereissubstantialunrealizedpotentialtoelectrifyindustrialprocessesatlowandmediumtemperatures.Someindustrieshavealsoelectrifiedhigh-temperatureprocesses,suchasthesteelindustryusingelectricarcfurnaces.However,muchoftheelectrificationdiscussiontodatehasfocusedonthetransportationandbuildingsectors,withlittleattentionpaidtotheindustrialsector.Thisreportaimstofillsomeofthatvoidbyexaminingindustrialsubsectors’heatconsumptionprofilesandelectrificationpotentialbasedonexistingheatdemandprofilesandelectrificationtechnologiesavailabletomeetthoseheatingneeds.Thereportidentifiesspecificprocessesthatcouldbeelectrifiedintheneartermwithcommerciallyavailabletechnologiesandanalyzestheexpectedchangesinenergyuse,CO2emissions,andenergycosts.Understandingwhichconventionalprocessescouldbeelectrifiedandhowthisimpactsemissionsandcostscanhelpindustrialfacilitiesidentifywhichoftheirprocessesmaybesuitablecandidatesforelectrification.Inaddition,understandingthepotentialgrowthinindustrialenergydemandthatwillresultfromelectrificationcanhelputilities,gridoperators,andelectricitygeneratorsplanforthesechangesandensureequipmentandgenerationresourcesareavailabletomeetthegrowingdemandforrenewableelectricity.Electrifyingindustrialprocesseshasthepotentialtoreduceemissionsthroughoutthestatesstudied,asseeninFigure1.Thismapshowsthechangeinemissionsfromindustrialprocesselectrificationin2050.Industrialelectrificationandassociatedemissionsreductionsofferpotentialco-benefits,includingimprovedairqualityandpublichealth,reducedairpollutionabatementcosts,laborproductivity,andcropyieldbenefits.However,itisimportanttoensurethattheseco-benefitsareequitablyrealized,asnearlyallmajoremissionsourcesectors,includingindustry,disproportionatelyaffectpeopleofcolor,andwhileairqualityhasimprovedintheU.S.overthepastseveraldecades,peopleofcolor,particularlyBlackandHispanicAmericans,arestillexposedtohigher-than-averagelevelsofairpollution.Identifyingandanalyzingallco-benefitswhendevelopingindustrialelectrificationprograms,plans,andpoliciescanhelptoincreaseuptake.Additionalinformationonco-benefitsisfoundinchapter5.Figure1.Changeinemissionsfromindustrialprocesselectrificationin20507IndustrialElectrificationinU.S.States1.2.ASector-andState-SpecificAnalysisThisreportiscomprisedofabottom-upindustrialsubsector,systems,andtechnology-levelassessmentofthetechnologiesavailableandthepotentialforelectrification,in12industrialsubsectorsin20statesintheU.S.AscanbeseeninthemapinFigure2,thesectorswiththehighestemissionsreductionpotentialsvaryacrossthestatesstudied,thoughseveraltrendsdoemerge.ThereisclearpotentialtoreduceemissionsintheGreatLakesregionthroughsteelelectrification,whilethePacificNorthwestandGulfCoastregions,aswellasGeorgia,couldseethelargestemissionsreductionsfromammoniaelectrification.Electrifyingthepulpandpaperindustryhasthepotentialtosignificantlyreduceemissionsinseveralstates,includingAlabama,Florida,Kentucky,andWisconsin.Additionalstate-levelanalysislookingacrossindustrialsubsectorsisfoundintheindividualstatefactsheetsinAppendix4.Figure2.Industrieswiththehighestemissionsreductionpotentialin2050Thereportalsoconsiderstheimplicationsofindustrialelectrificationonfutureelectricitygeneration,transmission,anddistributioninchapter4.Asthebuildings,transportation,andindustrialsectorspushtoelectrifyanddecarbonize,demandforrenewableelectricitywillincrease,placingadditionalstrainonalreadyagingelectricitygridinfrastructure.Thesegridimpactsmustbeconsideredandaddressedtoensureasmoothtransitiontoelectrificationandtorealizeemissionsreductions.Asnotedabove,thereportalsoexaminestheimportanceofidentifyingandquantifyingindustrialelectrificationco-benefitsinchapter5.Takingnear-termco-benefitssuchasimprovedairqualityintoaccountwhendevelopingandassessingindustrialelectrificationprojectscanofferaholisticviewofaprojectandmakethebenefitsmoretangible.WhiletheU.S.hasalreadyrealizedpublichealthandecosystembenefitsfromimprovedairqualityprograms,thesebenefitshavenotbeenequallyfeltacrossourcommunities,aspeopleofcolorcontinuetohavehigherexposurestopoorairqualityandresultingnegativehealthoutcomes.Industrialelectrificationoffersanopportunitytoreduceemissionsinfrontlinecommunitiesandequitablydistributeclimatemitigationresources.Finally,inchapter6,thereportofferssixrecommendationsthatwouldhavethemostimpactonincreasingindustrialelectrification.8IndustrialElectrificationinU.S.StatesTheU.S.industrialsectoraccountsforaboutaquarterofenergyuseandgreenhousegas(GHG)emissionsintheU.S.ThemajorityoftheenergyusedintheU.S.industryisfossilfuels(U.S.DOE/EIA2020).In2018,thermalprocessesaccountedfor74%oftotalmanufacturingenergyuseintheU.S.;processheatingaccountedfor35%,combinedheatandpowerorcogenerationaccountedfor26%,andconventionalboilersaccountedfor13%(estimatedfromU.S.DOE/EIA2021andU.S.DOE2019)(Figure3).Figure3.U.S.manufacturingenergyusebyendusesin2018-valuesintrillionBtu1(estimatedfromU.S.DOE/EIA2021andU.S.DOE2019)Note:Processheating,processcooling,machinedrives,andotherprocessesusesteam.WeonlyreporttheenergyuseforsteamunderconventionalboilerandCHPtoavoiddoublecounting.Fiveindustriesaccountformorethan80%ofallU.S.manufacturingthermalprocessenergyconsumption:petroleumrefining,chemicals,pulpandpaper,ironandsteel,andfoodandbeverage(U.S.DOE/EIA2021).Thelevelofindustrializationvariesacrossstates.Somestates,suchasTexas,Louisiana,California,Illinois,Ohio,andIndiana,havealargeindustrialsectorandareamongthehighestindustrialenergy-consumingstates,whilestatessuchasRhodeIsland,NewHampshire,Vermont,andHawaiihavesmallindustrialsectors.Figure4showstherankingofall50statesintermsofannualindustrialenergyconsumption.1.1trillionbtu=1,055TJ2U.S.IndustrialEnergyuseandHeatConsumptionProfile9IndustrialElectrificationinU.S.StatesFigure4.AnnualenergydemandbythemanufacturingsectorineachU.S.statein2018(valuesinTrillionBtu)(Estimatedbasedon:U.S.DOE/EIA2021,U.S.DOE2019,andMcMillanetal.2018)Industrialprocessheatingoperationsincludedrying,heattreating,curingandforming,calcining,andsmelting.Processheatingtechnologiescanbegroupedintofourgeneralcategoriesbasedonthetypeofenergyconsumed:directfuel-firing,steam-based,electric-based,andhybridsystems(whichuseacombinationofenergytypes).Inprocessheating,thematerialisheatedbyheattransferfromaheatsourcesuchasaflame,steam,hotgas,oranelectricalheatingelementbyconduction,convection,orradiation—orsomecombinationofthese.Inpractice,lower-temperatureprocessestendtouseconductionorconvection,whereashigh-temperatureprocessesrelyprimarilyonradiativeheattransfer.Energyuseandheatlossesfromthesystemdependonprocessheatingparameters,systemdesign,operatingpractices,andotherfactors(ORNL2017).Around30%oftotalU.S.industrialheatdemandisrequiredatlowtemperaturesbelow100°C.Two-thirdsofU.S.industrialprocessheatisforapplicationsbelow300°C,consideredmediumtemperatures(Figure5)(McMillan2019).Inthefood,beverage,andtobacco;transportequipment;machinery;textile,andpulpandpaperindustries,theshareofheatdemandatlowandmediumtemperaturesisabout,orevenabove,60%ofthetotalheat10IndustrialElectrificationinU.S.Statesdemand.Withafewexceptions,itisgenerallyeasiertoelectrifylow-temperatureprocessesthanhigh-temperatureprocessesbecauseoflowercapitalcost,availabilityofelectrificationtechnologies,andotherreasons.Therefore,thereissignificantpotentialforindustrialprocesselectrificationforlow-ormedium-temperatureheatingapplications.Figure5.Cumulativeprocessheatdemandbytemperaturein2014(McMillan2019)Theindustrialsectorusesawidevarietyofprocessesemployingdifferenttypesanddesignsofheatingequipment.Processheatingmethodsusedinmanufacturingoperationslargelydependontheindustry,andmanycompaniesusemultipleoperations.Forexample,steelmakingfacilitiesoftenemployacombinationofsmelting,metalmelting,andheat-treatingprocesses.Chemicalmanufacturingfacilitiesmayusefluidheatingtodistillapetroleumfeedstockandacuringprocesstocreateafinalproduct,aswellasotherprocessheatingmethodsfortheproductionofotherproducts(ORNL2017).Unsurprisingly,manyofthestateswiththehighestindustrialenergyconsumptionalsohavethehighestindustrialCO2emissions.Figure6showsindustrialCO2emissionsforall50states.Texas,Louisiana,andCaliforniahavethehighestlevelsofbothindustrialenergyconsumptionandindustrialCO2emissions.Figure6.IndustrialCO2emissionsin2019(millionmetrictonnesofCO2/year)11IndustrialElectrificationinU.S.States3.0.MethodologyThischapterpresentstheresultsofouranalysisofelectrificationpotentialin12industrialsubsectorsin20U.S.states(Table1).Thissectiondescribesthemethodologyfortheanalysisaswellasscenariodescriptionsandkeyassumptions.Industries:Thesector-specificelectrificationanalysisfocusesonelectrifyingtheend-usetechnologiesasopposedtoelectrifyingthesteamboilersonly.Inmostindustrialprocesses,steamisusedasaheatcarrier,andsteamitselfisnotneededintheprocess.Therefore,insteadofusingsteam(regardlessofwhetheritisgeneratedbyfuelsorelectricboilers),wecanconsiderusingend-useelectrificationtechnologies(suchasthosedescribedinAppendix1)toprovidetheheatfortheprocess.Electrifyingend-useprocesseshavetheadvantageofincreasingeffi-ciencybyremovingsteamdistributionlosses.Table1.U.S.industrialsubsectorsanalyzedinthisstudyNo.IndustrysubsectorNo.Industrysubsector1Aluminumcasting7Steel2Pulpandpaper8Beer3Containerglass9Beetsugar4Ammonia10Milkpowder5Methanol11Wetcornmilling6Recycledplastic12CrudesoybeanoilStates:Figure7showsthe20statesincludedinthisstudyandtheirindustrialenergyuse.Allselectedstatesareamongthetop20industrialenergy-consumingstatesintheU.S.,exceptColorado(21)andOregon(32),whichareincludedbecauseoftheirforward-lookingenergyandclimatepolicies.Theotherstatesinthetop20butnotincludedinthisstudyareTennessee(18)andSouthCarolina(19).Figure7.Industrialenergyusein2019(trillionBtu)3State-levelIndustrialElectrificationPotential12IndustrialElectrificationinU.S.StatesAnalysis:Toconductthisbottom-up,systems-andtechnology-levelelectrificationanalysisforeachindustrialsubsector,wefollowedfoursteps,asshowninFigure8.Weanalyzedtheexistingheatingsystemsusedinthemainprocessesforeachsubsector,includingtheheatdemandandtemperatureprofile.Then,weidentifiedsuitableelectrificationtechnologiesthatcanprovidethesameheatandfunctionforeachthermalprocess.Almostalloftheelectrificationtechnologiesweidentifiedandassignedtoprocessesarecommerciallyavailable.Insomecaseswherecommercialelectrifiedtechnologieswerenotavailable,weusedinformationaboutanemergingelectrifiedtechnologythatwasapplicabletotheprocessunderinvestigationbasedontheinformationfromtheliterature.Then,wedidahigh-levelassessmentoftechnologyintegrationneedsineachsector.Havingtheenergyintensityofprocessheatingtechnologiesforbothconventionalandelectrifiedprocesses,wethencalculatedtheenergyuse,CO2emissions,energycost,andelectricitygridimplicationsofelectrificationineachindustry.Figure8.MethodologytoestimateelectrificationpotentialinU.S.industrialsubsectorsWealsousedprojectionsfortheproductionforeachsubsectoraswellasprojectionsinthegridemissionsfactorandunitpriceofenergyinordertoprojecttheenergyuse,GHGemissions,andenergycostimplicationsofelectrificationineachindustry.Theelectricitygridemissionsfactorandaverageunitpriceofnaturalgasusedinouranalysisforeachstateareshownbelow.ItshouldbenotedthatthechangesinenergyuseandGHGemissionsestimatedforeachsubsectorarethetotaltechnicalpotentialsassuminga100%adoptionrate.Actualindustrialelectrificationtechnologyadoptionwillbegradualandovertime.Fortheenergyintensityofprocessesandtechnologiesusedinouranalysis,wekepttheintensitiesconstantduringthestudyperiodof2021-2050.Wedidnottakeintoaccountthetechnologylearningcurveandgradualimprovementintechnologies’energyperformance(bothforconventionalandelec-trifiedtechnologies)inouranalysis.Thiswasprimarilyduetoalackofinformationforprojec-tionsofenergyperformanceimprovementfortherangeoftechnologiesconsideredintheanalysis.Energyuse:Thechangeinenergyuseresultsinfinalenergyterms,whichmeanselectricityisnotpresentedinprimaryenergyusingaverageelectricitygenerationefficiencyandtransmissionanddistributionlosses.13IndustrialElectrificationinU.S.StatesCO2emissions:Twogridemissionsfactorscenariosaremodeledthroughtheanalysis:Abaselinescenariothatassumesthenationalelectricitygridachieveszerocarbonemissionsin2050andincorporatesearlierstatezero-emissionstargetsandastatedpolicyscenariothatalignswiththeU.S.’scommitmenttoachievingazero-carbongridby2035.Additionaldetailsareincludedbelow.Figure9showstheelectricitygridemissionsfactorsin2021and2030inthestatesstudiedunderthebaselinescenarioandstatedpolicyscenario.Fortheprojectionsofthegridemissionsfactorindifferentstates,thebaselinescenarioassumesthattheelectricitygridwillachievezero-carbonemissionsin2050unlessastatehasaspecifictargettoachieveazero-carbongridbefore2050.Inthosecases,weusedthatstate’stargetyeartoachievezero-carbonemissionsfortheirelectricitygrid.Wealsodevelopedastatedpolicyscenariowhereweassumedallstatesachieveazero-carbongridin2035.ThisisthestatedpolicyofthecurrentBiden-HarrisAdministration.TheCO2emissionsreductionresultsshowbothscenarios.Thisstudyassumesalineartrendinthegridemissionsfactorbetween2021and2050inthebaselinescenarioand2035inthestatedpolicyscenario.Figure9.Electricitygridemissionsfactorsin2021and2030(kgCO2/MWh)0100200300400500600700800WashingtonOregonCaliforniaIllinoisOklahomaNorthCarolinaPennsylvaniaGeorgiaAlabamaIowaMinnesotaUnitedStatesFloridaTexasLouisianaMichiganColoradoWisconsinOhioIndianaKentuckyGridemissionsfactor(kgCO2/MWh)20212030-Baseline2030-StatedPolicy14IndustrialElectrificationinU.S.StatesItshouldalsobenotedthattheelectrificationtechnologiesweconsideredinouranalysisforeachprocessandsubsectormaynotbetheonlyelectrificationoptions.Otherelectrifiedheatingtechnologiesmightbeavailableandapplicabletotheprocessesanalyzed.Inaddition,otherprocesseswithinthesubsectorsstudiedmighthaveelectrificationpotentialthatisnotconsideredinthisstudy.Insummary,theenergysavingsandCO2reductionpotentialsshowninourstudyareonlyaportionofthetotalsavingspotentialthatcanbeachievedbyfullelectrificationoftheseindustrialsubsectorsineachstate.Energycost:Twoenergycostscenariosaremodeledthroughouttheanalysis:EIAelectricitypriceforecastandlowerrenewableenergy(RE)priceforecast.Additionaldetailsareincludedbelow.Inourenergycostanalysis,weassumednaturalgasasthemainfuelusedinU.S.industries,exceptforthesteelindustry,whereweassumedcoalasthemainfuelusedintheprimarysteelmakingprocess.EnergypricesvarysignificantlyfromstatetostatewithintheU.S.Theresultsofourcostperunitofproductioncomparisonsarehighlysensitivetotheunitpriceofenergy.Figures10and11showtheunitpriceofelectricityandnaturalgasin2021inthestatesincludedinthisstudy.Whenconsideringtheeconomicviabilityofindustrialelectrificationbasedonenergyprices,theratioofindustrialelectricitytonaturalgasprices(asshowninFigure12fordifferentstates)ismoreimportantthanabsoluteenergypricesthemselves.Thelowerthisratio,themoreattractiveindustrialelectrificationisfromtheenergycostsavingsperspective.Figure10.Industrialelectricityunitpricein2021($/kWh)(AdaptedbasedonU.S.DOE/EIA2021)00.020.040.060.080.10.120.140.16OklahomaLouisianaTexasWashingtonKentuckyOregonGeorgiaAlabamaOhioPennsylvaniaNorthCarolinaIowaIllinoisUnitedStatesIndianaFloridaMichiganWisconsinColoradoMinnesotaCaliforniaUnitpriceofelecricity($/kWh)15IndustrialElectrificationinU.S.StatesFigure11.Industrialnaturalgasunitpricein2021($/kWh)(AdaptedbasedonU.S.DOE/EIA2021)Figure12.Theratiooftheindustrialunitpriceofelectricitytonaturalgasin2021Inaddition,renewableelectricitypricescoulddecreasemoresubstantiallythanwhatweassumedinourBaselinescenariobasedonU.S.DOE/EIAprojectionsupto2050,makingelectrificationtechnologiesmorecompetitive.Toaddressthisissue,weaddedascenariowithlowerrenewableenergy(RE)priceforecastthatassumes50%lowerelectricitypricescomparedwiththeEIAforecast.EIAhashistoricallyoverestimatedtheunitpriceofelectricityinindustryandunderestimatedtheadoptionrateanddecreaseinrenewableelectricitycost.Infact,currentsolarandwindpowerpurchaseagreement(PPA)pricesintheU.S.arearoundhalfofthecurrentaveragepriceofelectricityfortheindustryintheU.S.(LBNL2022a,b).Itisforeseeablethatrenewableelectricitypriceswillfurtherdeclineby2030and2050.00.0050.010.0150.020.0250.03OklahomaTexasWisconsinLouisianaKentuckyAlabamaGeorgiaIowaMinnesotaIllinoisUnitedStatesOregonColoradoNorthCarolinaFloridaIndianaMichiganOhioCaliforniaWashingtonPennsylvaniaUnitpriceofnaturalgas($/kWh)-2.04.06.08.010.012.0WashingtonPennsylvaniaOhioNorthCarolinaOregonMichiganIndianaFloridaColoradoIllinoisUnitedStatesKentuckyGeorgiaAlabamaIowaCaliforniaMinnesotaLouisianaOklahomaTexasWisconsin16IndustrialElectrificationinU.S.StatesItisalsopossiblethatthepriceofnaturalgasandotherfossilfuelsmayincreasemorethanweprojectedupto2050(basedonU.S.DOE/EIAprojections),especiallyifacarbontaxorcarbonpriceisintroducedintheU.S.Wehavenotincludedsuchconsiderationinournaturalgasandcoalpriceprojections;weusedthefuelpriceprojectionsratesfromU.S.DOE/EIA(2018).3.1.AluminumCastingIndustrySpecificaluminumcastingprocesseshavebeendevelopedbasedoneachindustry’srequirements.In2021,thetotalquantityofprimaryaluminumproductionintheU.S.was1.1millionmetrictonnes.Approximately30percentofprimaryaluminumiscasted(OEMTechBrief,2019)andthetotalquantityofaluminumcastingproductsproducedintheU.S.wasabout330thousandtonnesin2021(Thomasnet2019).Castingisdefinedasasimpleandlow-costprocessthatcanbeutilizedforformingaluminumintoawidevarietyofproducts.Itisthemostwidelyusedprocessfortheproductionofaluminumproducts.Thefundamentalprinciplebehindthecastingprocessinvolvespouringmoltenaluminumintoamoldtoobtainthedesiredpattern.Thethreemostpopulartechniquesarediecasting,permanentmoldcasting,andsandcasting(TheAluminumAssociation2010).Adetailedexplanationofconventionalandelectrifiedprocessesforthealuminumcastingindustryisprovidedinourpreviousreport(Hasanbeigietal.2021).Table3comparestheenergyintensityofthealuminumcastingindustry’sconventionalandelectricprocesses.Table3.Conventionalandelectricaluminumcastingprocesses’energyintensities(BeyondZeroEmissions,2019)ConventionalSystemProcessesProcessStepsAllElectricProcessesReverberatoryFurnaceTowerFurnaceInductionCorelessFurnaceSingle-shotinduction(kWh/tonne)(kWh/tonne)(kWh/tonne)(kWh/tonne)13321066Melting700657123123Holding--137137TransferandHolding137-15921326Total837657EnergyuseFigure13showsthatelectrificationwillsignificantlyreducethetotalfinalenergyuseforaluminumcastingindifferentstatesduringthestudyperiod2030-2050.Theenergysavingsincreaseovertimebecauseoftheassumedproductionincreaseinthissectorupto2050.Oursavingscalculationisbasedonmaximumenergysavingsbyreplacingreverberatoryfurnaceswithelectrifiedsingle-shutinductionfurnaces.Wisconsin,Ohio,Kentucky,Michigan,andIndianaarethestateswiththelargestenergysavingspotentialsfromswitchingtoelectricaluminumcastingprocesses.17IndustrialElectrificationinU.S.StatesFigure13.Changeinthealuminumcastingindustry’stotalfinalenergyuseafterelectrification(technicalpotentialassuming100%adoptionrate)CO2emissionsFigure14showsthechangeinnetCO2emissionsofthealuminumcastingindustryindifferentstatesafterelectrificationunderthebaselinescenario.ElectrificationofaluminumcastingcanresultinadecreaseinCO2emissionsin2030in18outof20statesstudied.Intheothertwostates(IndianaandKentucky),therelativelyhighergridemissionsfactorin2030(Figure9)causesaslightincreaseinCO2emissionsin2030.ElectrificationcanhelprealizesubstantialannualCO2emissionreductionsby2050inallstates.ThisCO2emissionsreductionresultsfromtheelectricitygrid’sdecliningCO2emissionsfactor(griddecarbonization)in2050inallstates.Figure14.Changeinthealuminumcastingindustry’snetCO2emissionsafterelectrification-baselinescenario(technicalpotentialassuming100%adoptionrate)Figure15showsthealuminumcastingindustry’schangeinnetCO2emissionsinstatesafterelectrificationunderthestatedpolicyscenario.Underthisscenario,theCO2emissionsreductionpotentialinfutureyears(2030,2040,and2050)issubstantiallyhigherthanthebaselinescenariobecausemorerapidgriddecarbonizationisassumedunderthestatedpolicyscenario.-200-180-160-140-120-100-80-60-40-200WisconsinOhioKentuckyMichiganIndianaMinnesotaCaliforniaTexasPennsylvaniaIllinoisWashingtonIowaOklahomaOregonFloridaNorthCarolinaGeorgiaColoradoAlabamaLouisianaChangeinEnergyUse(TJ/Year)203020402050-20-15-10-505WisconsinOhioKentuckyMichiganIndianaMinnesotaCaliforniaTexasPennsylvaniaIllinoisWashingtonIowaOklahomaOregonFloridaNorthCarolinaGeorgiaColoradoAlabamaLouisianaChangeinCO2Emissions(ktCO2/Year)20302040205018IndustrialElectrificationinU.S.StatesFigure15.Changeinthealuminumcastingindustry’snetCO2emissionsafterelectrification-statedpolicyscenario(technicalpotentialassuming100%adoptionrate)TherateofCO2emissionsreductionfromelectrificationvariesacrossstates.ThisisillustratedmoreclearlyinFigures16and17showingthechangeinnetCO2emissionsinthealuminumcastingindustryafterelectrificationinIndianaandCalifornia.TheCO2emissionsinitiallyincreasedinIndianain2030underthebaselinescenario,butasIndiana’sgriddecarbonizesovertime,electrificationofthealuminumcastingindustryresultsinCO2emissionsreductions.InCalifornia,however,electrificationofthealuminumcastingindustrywillresultinCO2emissionsreductionsin2030becauseCaliforniahasalowergridemissionsfactor(seeFigure9).Figure16.Changeinthealuminumcastingindustry’snetCO2emissionsafterelectrificationinIndiana-20-18-16-14-12-10-8-6-4-20WisconsinOhioKentuckyMichiganIndianaMinnesotaCaliforniaTexasPennsylvaniaIllinoisWashingtonIowaOklahomaOregonFloridaNorthCarolinaGeorgiaColoradoAlabamaLouisianaChangeinCO2Emissions(ktCO2/Year)203020402050-12-10-8-6-4-2024203020402050ChangeinCO2Emissions(ktCO2/Year)BaselineScenario(ZeroCarbonGridin2050orasStatedinEachState'sTarget)StatedPolicyScenario(ZeroCarbonGridin2035inAllStates)19IndustrialElectrificationinU.S.StatesFigure17.Changeinthealuminumcastingindustry’snetCO2emissionsafterelectrificationinCaliforniaEnergycostFigure18showsthatunderthescenariowiththeEIAelectricitypriceforecast,theenergycost(in2021)$perunitofproduction(tonneofcastaluminum)in2030fortheelectrifiedprocessinthealuminumcastingindustryissubstantiallyhigherthanthatoftheconventionalprocessin2021inmoststatesexceptPennsylvaniaandWashington.Thisisbecausethesetwostateshavearelativelylowerratiooftheindustrialunitpriceofelectricitytonaturalgas(seeFigure12).Figure18alsoshowstheenergycostperunitofproductionforanelectrifiedaluminumcastingprocessin2050undertwoscenarios,onewithhigherandanotherwithlowerelectricitypricesineachstate.Itisclearthataccesstolow-costelectricitycansubstantiallyreducetheenergycostoftheelectrifiedaluminumcastingprocess,makingitevenmorecost-effectivethantheconventionalprocessinmoststatesstudied.Figure18.EnergycostperunitofproductioninthealuminumcastingindustryAlso,naturalgaspricescouldincreasemoresubstantiallyupto2050thanwhatisassumedinthisstudy.Itshouldbenotedthatourcostcomparisonfocusesonlyonenergycosts.Amorecomprehensivecostanalysisthattakesintoaccountthechangeincapitalcosts,operation-8-7-6-5-4-3-2-10203020402050ChangeinCO2Emissions(ktCO2/Year)BaselineScenario(ZeroCarbonGridin2050orasStatedinEachState'sTarget)StatedPolicyScenario(ZeroCarbonGridin2035inAllStates)020406080100120CaliforniaFloridaMichiganWisconsinMinnesotaColoradoTheUnitedStatesPennsylvaniaIllinoisOregonNorthCarolinaOhioIowaGeorgiaTexasWashingtonAlabamaLouisianaOklahomaKentuckyEnergyCostperUnitofProduction(2021$/ton)2021ConventionalProcess2030ElectrifiedProcess(withEIAElec.PriceForecast)2030ElectrifiedProcess(withLowerREPriceForecast)2050ElectrifiedProcess(withEIAElec.PriceForecast)2050ElectrifiedProcess(withLowerREPriceForecast)20IndustrialElectrificationinU.S.Statesandmaintenancecosts,andelectrifiedtechnologies’non-energybenefits(suchasimprovedproductquality,reducedwaste,increasedproductionrate,andreducedmaintenance)couldmakeelectrifiedtechnologiesmorefinanciallyattractive.3.2.PulpandPaperIndustryIn2017,thetotalpaperandcardboardproductionacrosstheglobewasaround419millionmetrictonnes.China,theU.S.,andJapanarethetoppapermanufacturingnations(Garside2020d).ThepulpandpapermanufacturingindustryisthethirdlargestenergyconsumerinU.S.manufacturing.ThepulpandpaperindustryintheU.S.iscomprisedofpulpmills,millsdedicatedtomanufacturingpaperandpaperboard,andintegratedmillsthatprocesspulpaswellasmanufacturepaper.Morethan50%oftotalU.S.productionoccursintheSouth,whiletheNortheast,NorthCentral,andWesternregionsrepresenttheremainingproductionintheU.S.Thereareanestimated386pulp,paper,andpulpandpapermillsdistributedacross41states(Brueskeetal.2015).In2017,thetotalpulp,paper,andpaperboardproductionintheU.S.wascloseto72millionmetrictonnes(FAO2017).Adetailedexplanationofconventionalandelectrifiedprocessesforthepulpandpaperindustryisprovidedinourpreviousreport(Hasanbeigietal.2021).Table4comparestheenergyintensityofthepulpandpaperindustry’sconventionalandelectricprocesses.Table4.Conventionalandelectricpulpandpaperproductionprocesses’energyintensities(OuranalysisbasedonBrueskeetal.2015)ConventionalSystemProcessProcessstepsProcessUsingElectricDryerEquipmentThermalDemand(kWh/tonne)ElectricalDemand(kWh/tonne)ThermalDemand(kWh/tonne)ElectricalDemand(kWh/tonne)EquipmentLiquorEvapo-rator99646LiquorEvaporation99646LiquorEvaporatorPulpmachine56740PulpingChemicalPreparation56740PulpmachineCookingma-chine65695WoodCooking65695CookingmachineConventionalbleachingplant31275Bleaching31275ConventionalbleachingplantSteam/fuel-baseddryer1,245128PaperDrying0.01,236InfrareddryerPapermakingmachine310296PaperMachineWetEnd310296Papermakingmachine4,088682Subtotal2,8421,7914,771TotalEnergy4,633EnergyuseFigure20showsthatelectrificationwillsignificantlyreducethetotalfinalenergyuseforpulpandpaperinnumerousstatesduringthestudyperiod.Theslightreductioninannualsavingpotentialbetween2030-2050isduetoanassumedslightreductioninprimarypaper21IndustrialElectrificationinU.S.Statesproductionduringthisperiod.Georgia,Alabama,Wisconsin,NorthCarolina,andFloridaarethestateswiththelargestenergysavingspotentialsfromswitchingtoelectricdryinginthepaperindustry.Figure20.Changeinthepulpandpaperindustry’stotalfinalenergyuseafterelectrification(technicalpotentialassuming100%adoptionrate)CO2emissionsFigure21showsthepulpandpaperindustry’schangeinnetCO2emissionsafterelectrifi-cationunderthebaselinescenario.Theindustry’selectrificationwouldresultinanincreaseinCO2emissionsin2030inallstatesstudiedexceptWashington,whichhasthelowestgridemissionsfactor.Itshouldbenotedthataround67%offuelusedinthepaperindustryisbiomasswhichisaby-productofthepulpingprocess(U.S.DOE2019).InourCO2emissionsanalysis,wetookthisintoaccountandassumedbiomasswascarbonneutral.ThatisthemainreasonwhyelectrificationcausesanincreaseinCO2emissionsofthepaperindustryinmoststatesupto2040untilthegridisfullydecarbonizedin2050toshowtheCO2benefitofelectrificationinthissector.NotethecarbonaccountingforbiomassundertheGHGprotocolisundergoingrevisionandcouldchangehowbiomassistreated.Ifitdoes,biomasswastematerialmaynotbeconsideredcarbonneutralautomaticallyasitisnow,andtheestimatedcarbonandcostbenefitscouldchangedramatically.ElectrificationcanhelprealizeannualCO2emissionsreductionsinallstatesin2050underthebaselinescenario(Figure21)andin2040underthestatedpolicyscenario(Figure22).ThissubstantialreductioninCO2emissionsistheconsequenceofadeclineintheelectricitygrid’sCO2emissionsfactorbetween2021and2050inallstates.Figure21.Changeinthepulpandpaperindustry’snetCO2emissionsafterelectrification-baselinescenario(technicalpotentialassuming100%adoptionrate)-3,500-3,000-2,500-2,000-1,500-1,000-5000GeorgiaAlabamaWisconsinNorthCarolinaFloridaLouisianaWashingtonPennsylvaniaMichiganCaliforniaTexasKentuckyOklahomaOregonMinnesotaOhioIllinoisIndianaIowaColoradoChangeinEnergyUse(TJ/Year)203020402050-600-400-20002004006008001,0001,2001,400GeorgiaAlabamaWisconsinNorthCarolinaFloridaLouisianaWashingtonPennsylvaniaMichiganCaliforniaTexasKentuckyOklahomaOregonMinnesotaOhioIllinoisIndianaIowaColoradoChangeinCO2Emissions(ktCO2/Year)20302040205022IndustrialElectrificationinU.S.StatesFigure22showsthechangeinnetCO2emissionsofthepulpandpaperindustryindifferentstatesafterelectrificationunderthestatedpolicyscenario.Underthisscenario,theCO2emissionsreductionpotentialinfutureyears(2030,2040,and2050)issubstantiallyhigherthanthebaselinescenariobecauseofmorerapidgriddecarbonizationassumedunderthestatedpolicyscenario.Figure22.Changeinthepulpandpaperindustry’snetCO2emissionsafterelectrification-statedpolicyscenario(technicalpotentialassuming100%adoptionrate)TherateofCO2emissionsreductionsinfutureyearsvariesfromstatetostate,asshowninthemapinFigure23.StatesintheSoutheast,aswellasWisconsin,havethegreatestemissionsreductionpotentialsfrompulpandpaperelectrificationin2050.Figure23.Changeinemissionsinthepulpandpaperindustryin2050ThedifferencesamongstatesareillustratedfurtherinFigures24and25,showingchangesinthepulpandpaperindustry’snetCO2emissionsafterelectrificationinGeorgiaandWashington.InGeorgia,CO2emissionsreductionswillbeachievedin2040underthestatedpolicyscenario.InWashington,however,CO2emissionsreductionsfromelectrificationofthepulpandpaperindustrystartin2030underbothscenariosbecauseofthelowergridemissionsfactorinWashington(seeFigure9).-600-400-2000200400600GeorgiaAlabamaWisconsinNorthCarolinaFloridaLouisianaWashingtonPennsylvaniaMichiganCaliforniaTexasKentuckyOklahomaOregonMinnesotaOhioIllinoisIndianaIowaColoradoChangeinCO2Emissions(ktCO2/Year)20302040205023IndustrialElectrificationinU.S.StatesFigure24.Changeinthepulpandpaperindustry’snetCO2emissionsafterelectrificationinWisconsinFigure25.Changeinthepulpandpaperindustry’snetCO2emissionsafterelectrificationinWashingtonEnergycostFigure26showsthatunderbothelectricitypriceforecasts,theenergycostperunitofproduction(tonneofpaper)in2030fortheelectrifiedprocessinthepulpandpaperindustryissubstantiallyhigherthanthatoftheconventionalprocessin2021inallstates.Itshouldbenotedthatonlythedryingprocessiselectrifiedinthisanalysis,so40-55%ofthecostshownfortheelectrifiedprocessinFigure26isrelatedtonaturalgasusedinprocessesotherthandrying.Figure26alsoshowstheenergycostperunitofproductionforanelectrifiedpulpandpaperprocessin2050undertwoscenarios,onewithhigherandanotherwithlowerelectricitypricesineachstate.Around67%ofthefuelusedinaconventionalpulpandpaperplantthatproducespaperfromvirginpulpisfrombiomassandpulpingliquor(blackliquor),whicharepulpingprocessbyproducts(U.S.DOE2019).Thesebyproductbiomassfuelsareavailabletopulpandpaperplantsataverylowcost.Thecostanalysisandcomparisonhereassumeszerocostforbyproductfuelsusedintheconventionalprocessandassumestheelectrifiedprocessusesnobyproductfuels,butrathernaturalgaswouldbetheremainderoffuelusedinanintegratedpulpandpaperplant,sonaturalgascostsareincluded.-250-200-150-100-500203020402050ChangeinCO2Emissions(ktCO2/Year)BaselineScenario(ZeroCarbonGridin2050orasStatedinEachState'sTarget)StatedPolicyScenario(ZeroCarbonGridin2035inAllStates)-600-400-20002004006008001,0001,2001,400203020402050ChangeinCO2Emissions(ktCO2/Year)BaselineScenario(ZeroCarbonGridin2050orasStatedinEachState'sTarget)StatedPolicyScenario(ZeroCarbonGridin2035inAllStates)24IndustrialElectrificationinU.S.StatesFigure26.Energycostperunitofproductioninthepulpandpaperindustry3.3.ContainerGlassIndustryTheglassindustrymanufacturesawiderangeofproductsusedacrossvariouskeysectorsoftheU.S.economy,includingconstruction,householdmarkets,andautomotive.Thefourmajorglassproductsareflatglass,pressedorblownglass,glasscontainers,andproductsmadefrompurchasedglass(IBISWorld2020).In2021,thetotalrevenuegeneratedbytheU.S.glassmanufacturingindustrywasaround$30billion(Garside2020b).ThetotalglassproductionintheU.S.wasaround20millionmetrictonnesin2017(Gaile2017).SincecontainerglassproductsaccountforaroundhalfofU.S.glassproduction(U.S.DOE2017a),thetotalquantityofcontainerglassproductionintheU.S.isestimatedtobeapproximately10Mtin2021.Adetailedexplanationofthecontainerglassindustry’sconventionalandelectrifiedprocessesisprovidedinourpreviousreport(Hasanbeigietal.2021).Table5comparestheenergyintensityofthecontainerglassindustry’sconventionalandelectricprocesses.Table5.Conventionalandelectriccontainerglassproductionprocesses’energyintensities(OuranalysisbasedonU.S.DOE2017aandBeyondZeroEmissions2019)ConventionalSystemProcessProcessstepsAllElectricProcessHeatingEquipmentElectricalDemand(kWh/tonne)ThermalDemand(kWh/tonne)ElectricalDemand(kWh/tonne)HeatingEquipmentElectrically-poweredmixer/crusher1610Mixing161Electrically-poweredmixer/crusherGas-firedfurnace2041150Melting860Electrically-poweredglassmelterForehearthandform-ingequipment26105Conditioning&Forming104ElectricforehearthsGas-firedAnnealinglehr25210PostForming(Annealing)183ElectricAnnealinglehr4161465Subtotal13081881TotalEnergy1308050100150200250300350400CaliforniaPennsylvaniaWashingtonMichiganFloridaIndianaColoradoOhioMinnesotaNorthCarolinaOregonIllinoisIowaWisconsinGeorgiaAlabamaLouisianaKentuckyTexasOklahomaEnergyCostperUnitofProduction(2021$/ton)2021ConventionalProcess2030ElectrifiedProcess(withEIAElec.PriceForecast)2030ElectrifiedProcess(withLowerREPriceForecast)2050ElectrifiedProcess(withEIAElec.PriceForecast)2050ElectrifiedProcess(withLowerREPriceForecast)25IndustrialElectrificationinU.S.StatesEnergyuseContainerglassproductionwasidentifiedin18ofthe20statesincludedinthisstudy.Figure27showsenergysavingsfromcontainerglassproductionelectrificationacrossstatesin2030-2050.Theslightenergysavingsincreaseovertimeisbecauseanincreaseincontainerglassproductionisassumedupto2050.California,Indiana,Illinois,Georgia,andPennsylvaniaarethestateswiththepotentialtosavethemostenergybyswitchingtoelectriccontainerglassproduction.Figure27.Changeinthecontainerglassindustry’stotalfinalenergyuseafterelectrification(technicalpotentialassuming100%adoptionrate)CO2emissionsFigure28showsthecontainerglassindustry’schangeinnetCO2emissionsafterelectrificationunderthebaselinescenario.Thecontainerglassindustry’selectrificationcanresultinadecreaseinCO2emissionsin2030inallstatesexceptIndiana,whichhasahighgridemissionsfactorin2030(seeFigure9).AsthegriddecarbonizesinIndiana,electrificationcanhelprealizesubstantialannualCO2emissionsreductionsby2040inthatstateaswell.Figure28.Changeinthecontainerglassindustry’snetCO2emissionsafterelectrification-baselinescenario(technicalpotentialassuming100%adoptionrate)-3,500-3,000-2,500-2,000-1,500-1,000-5000CaliforniaIndianaIllinoisGeorgiaPennsylvaniaNorthCarolinaOklahomaTexasOhioColoradoFloridaWisconsinMichiganMinnesotaWashingtonLouisianaOregonAlabamaChangeinEnergyUse(TJ/Year)203020402050-500-400-300-200-1000100200CaliforniaIndianaIllinoisGeorgiaPennsylvaniaNorthCarolinaOklahomaTexasOhioColoradoFloridaWisconsinMichiganMinnesotaWashingtonLouisianaOregonAlabamaChangeinCO2Emissions(ktCO2/Year)20302040205026IndustrialElectrificationinU.S.StatesFigure29showsthecontainerglassindustry’schangeinnetCO2emissionsafterelectrificationunderthestatedpolicyscenario.Underthisscenario,theCO2emissionsreductionpotentialinfutureyears(2030,2040,and2050)issubstantiallyhigherthanthebaselinescenariobecausemorerapidgriddecarbonizationisassumedunderthestatedpolicyscenario.Figure29.Changeinthecontainerglassindustry’snetCO2emissionsafterelectrification-statedpolicyscenario(technicalpotentialassuming100%adoptionrate)ThemapinFigure30showstheemissionsreductionpotentialacrossthestatesincludedintheanalysis.CaliforniaandIndianahavethehighestpotentialtoreduceemissionsinthecontainerglassindustryby2050.Figure30.Changeinemissionsinthecontainerglassindustryin2050Figures31and32showthecontainerglassindustry’schangeinnetCO2emissionsafterelectrificationintwomajorcontainerglassmanufacturingstates,IndianaandCalifornia.InIndiana,theCO2emissionswillincreasein2030underthebaselinescenario.InCalifornia,however,thelowergridemissionsfactorallowsCO2emissionsreductionsfromthecontainerglassindustry’selectrificationin2030aswellasinfutureyears.-500-450-400-350-300-250-200-150-100-500CaliforniaIndianaIllinoisGeorgiaPennsylvaniaNorthCarolinaOklahomaTexasOhioColoradoFloridaWisconsinMichiganMinnesotaWashingtonLouisianaOregonAlabamaChangeinCO2Emissions(ktCO2/Year)20302040205027IndustrialElectrificationinU.S.StatesFigure31.Changeinthecontainerglassindustry’snetCO2emissionsafterelectrificationinIndianaFigure32.Changeinthecontainerglassindustry’snetCO2emissionsafterelectrificationinCaliforniaEnergycostFigure33showsthatunderthescenariowiththeEIAelectricitypriceforecast,theenergycostperunitofproduction(tonneofcontainerglass)in2030foranelectrifiedcontainerglassproductionprocessissignificantlyhigherthanthatoftheconventionalprocessin2021inmoststatesexceptPennsylvaniaandWashington.Thisisbecausethesetwostateshavealowerratiooftheindustrialunitpriceofelectricitytonaturalgas(seeFigure12).However,undertheLowerREpriceforecastscenario,theenergycostperunitofproductionin2030fortheelectrifiedprocessislowerthanthatoftheconventionalprocessin2021inalmostallstates.-500-400-300-200-1000100200203020402050ChangeinCO2Emissions(ktCO2/Year)BaselineScenario(ZeroCarbonGridin2050orasStatedinEachState'sTarget)StatedPolicyScenario(ZeroCarbonGridin2035inAllStates)-500-450-400-350-300-250-200-150-100-500203020402050ChangeinCO2Emissions(ktCO2/Year)BaselineScenario(ZeroCarbonGridin2050orasStatedinEachState'sTarget)StatedPolicyScenario(ZeroCarbonGridin2035inAllStates)28IndustrialElectrificationinU.S.StatesFigure33.EnergycostperunitofproductioninthecontainerglassindustryThequalityrequirementformostflatglassissignificantlyhigherthanforcontainerglass.Thismakeselectrifyingmeltingforflatglassproductionmorechallenging.Infuel-firedcontainerglassfurnacesandall-electriccontainerglassfurnaces,meltingandrefiningareachievedinonetank.Incontrast,inflatglassproduction,meltingandacertaindegreeofrefiningtakeplaceinthemainmeltingchamber,andasecondaryrefiningchambercompletestheprocess,resultinginacomparativelylongerprocessingtime.Electricboostinginafuel-firedflatglassfurnacecanandisapplied,thoughnotaswidelyasincontainerglassproduction(Stormont2020).3.4.AmmoniaIndustryAmmonia-basedfertilizersandchemicalsplayasignificantroleincrop-yieldgrowth.Overthepastfewdecades,engineerssuccessfullydevelopedprocessesthatresultinwideraccesstoammoniaathighlyreducedcosts.TheU.S.isoneoftheworld’sleadingproducersandconsumersofammonia.In2021,15U.S.companiesproducedatotalofapproximately14millionmetrictonnesofammoniaacross34facilities(Garside2020a).Around88%ofam-moniamanufacturedgloballyisutilizedforfertilizerproduction,andtheremainderisusedtosupportformaldehydeproduction(AIChE2016).Tomakeammonia,hydrogenandN2areneeded.Thecurrentprocessusessteammethanereforming(SMR)toproducehydrogen.Intheall-electricprocess,hydrogenisproducedviaelectrolysis.Adetailedexplanationoftheammoniaindustry’sconventionalandelectrifiedprocessesisprovidedinourpreviousreport(Hasanbeigietal.2021).Table6comparestheenergyintensityofconventionalandelectricprocessesfortheammoniaindustry.050100150200250CaliforniaFloridaMichiganWisconsinMinnesotaColoradoIndianaPennsylvaniaIllinoisOregonNorthCarolinaOhioGeorgiaTexasWashingtonAlabamaLouisianaOklahomaEnergyCostperUnitofProduction(2021$/ton)2021ConventionalProcess2030ElectrifiedProcess(withEIAElec.PriceForecast)2030ElectrifiedProcess(withLowerREPriceForecast)2050ElectrifiedProcess(withEIAElec.PriceForecast)2050ElectrifiedProcess(withLowerREPriceForecast)29IndustrialElectrificationinU.S.StatesTable6.Conventionalandelectricammoniaproductionprocesses’energyintensities(BeyondZeroEmissions2019)ConventionalSystemProcessProcessstepsAllElectricProcessEquipmentElectricalDemand(kWh/tonne)ThermalDemand(kWh/tonne)ElectricalDemand(kWh/tonne)EquipmentPrimaryReformerFeedstock(SMRtoproduceH2)-5,694Usingdifferentprocessmethods30DesalinationPrimaryReformerFuel-4,0838,824ElectrolysisSecondaryReforming--90AirseparationtoacquirenitrogenCO2Removal-333550HydrogenandnitrogenreactionintheHaber-BoschprocessMethanation-83--AmmoniaSynthesis--555--Boiler--1,388--Turbine,Compressor,Others(Electrical)1,694---1,6948,249Subtotal9,4949,943TotalEnergy9,494Hydrogenandnitrogenarereactedat450°Cand200barpressureoveracatalysttoformammonia.Primaryandsecondaryreformingandammoniasynthesisallproducewasteheatwhichisreusedintheboilers.EnergyuseAmmoniaproductionwasidentifiedinnineofthe20statesincludedinthisstudy.Electrifi-cationwillsignificantlyreducetheammoniaindustry’stotalfinalenergyuseduringthestudyperiod(Figure34).Theenergysavingsincreaseovertimebecauseanincreaseinammoniaproductionisassumedupto2050.Figure34.Changeintheammoniaindustry’stotalfinalenergyuseafterelectrification(technicalpotentialassuming100%adoptionrate)-10,000-9,000-8,000-7,000-6,000-5,000-4,000-3,000-2,000-1,0000LouisianaOklahomaTexasIowaGeorgiaOhioIllinoisWashingtonOregonChangeinEnergyUse(TJ/Year)20302040205030IndustrialElectrificationinU.S.StatesCO2emissionsAmmoniaproductionelectrificationthroughtheproductionofhydrogenbyelectrolysiswouldresultinanincreaseinCO2emissionsin2030inLouisiana,Texas,andOhio(Figure35).Therelativelyloweremissionsfactorsoftheothersixammonia-producingstates(seeFigure9)allowforCO2emissionsreductionsin2030.AstheelectricitygriddecarbonizesinLouisiana,Texas,andOhioin2040and2050,weseesubstantialannualCO2emissionreductionsfromammoniaproductionelectrificationinthesestatesaswell.Figure35.Changeintheammoniaindustry’snetCO2emissionsafterelectrification-baselinescenario(technicalpotentialassuming100%adoptionrate)Ifazero-carbongridisachievedearlierinallstates,theCO2emissionsreductionpotentialinfutureyears(2030,2040)issubstantiallyhigher(Figure36)thanthebaselinescenario.Figures35and36showthatinsomestates,CO2emissionswillincreasein2030underthebaselinescenariobutdecreasein2030underthestatedpolicyscenariobecausetheelectricitygriddecarbonizesmorerapidly.Figure36.Changeintheammoniaindustry’snetCO2emissionsafterelectrification-statedpolicyscenario(technicalpotentialassuming100%adoptionrate)-10,000-8,000-6,000-4,000-2,00002,0004,000LouisianaOklahomaTexasIowaGeorgiaOhioIllinoisWashingtonOregonChangeinCO2Emissions(ktCO2/Year)203020402050-10,000-9,000-8,000-7,000-6,000-5,000-4,000-3,000-2,000-1,0000LouisianaOklahomaTexasIowaGeorgiaOhioIllinoisWashingtonOregonChangeinCO2Emissions(ktCO2/Year)20302040205031IndustrialElectrificationinU.S.StatesThemapinFigure37showstheemissionsreductionpotentialacrossthestatesincludedintheanalysis.WhiletheGulfCoastregionhasasignificantpotentialtoreduceemissionsbyelectrifyingammoniaproduction,sotoodoseveralotherstatesinterspersedinotherregions,includingGeorgia,Ohio,andIowa.Figure37.Changeinemissionsintheammoniaindustryin2050EnergycostFigure38showsthatunderthescenariowiththeEIAelectricitypriceforecast,theenergycostperunitofproduction(tonneofammonia)in2030forammonia’selectrifiedprocessissubstantiallyhigherthanthatoftheconventionalprocessin2021inallstates.However,undertheLowerREpriceforecastscenario,electrifiedammoniaproductioncanbecost-competitivewiththeconventionalprocessinseveralstatessuchasOhioandWashington.Figure38.Energycostperunitofproductionintheammoniaindustry0100200300400500600700IllinoisOregonOhioIowaGeorgiaTexasWashingtonAlabamaLouisianaOklahomaEnergyCostperUnitofProduction(2021$/ton)2021ConventionalProcess2030ElectrifiedProcess(withEIAElec.PriceForecast)2030ElectrifiedProcess(withLowerREPriceForecast)2050ElectrifiedProcess(withEIAElec.PriceForecast)2050ElectrifiedProcess(withLowerREPriceForecast)32IndustrialElectrificationinU.S.States3.5.MethanolIndustryMethanol(CH3OH)isaliquidchemicalthatservesasabuildingblockforthousandsofdaily-useproducts,suchasplastics,paints,cosmetics,andfuels.Itistheworld’smostcommonlyshippedchemicalcommodity(Hobsonetal.,2018).Currently,methanolismostlymanufacturedfornon-fueluseintheU.S.ThesubstantialdemandformethanolinNorthAmericaisduetotheincreasingdemandformethyltertiarybutylether(MTBE),aceticacid,andformaldehyde(GrandViewResearch2019).In2021,U.S.totalmethanolproductionvolumewasestimatedtobearound5.7millionmetrictonnes.ThevastmajorityofmethanolplantsarelocatedintheGulfCoastregion,andwithadditionalplantsinfinalphasesofconstruction(EIA,2019).Adetailedexplanationofconventionalandelectrifiedmethanolindustrialprocessesisprovidedinourpreviousreport(Hasanbeigietal.2021).Table7comparestheenergyintensityofconventionalandelectricprocessesforthemethanolindustry.Table7.Conventionalandelectricmethanolproductionprocesses’energyintensities(Hasanbeigietal.2021)ConventionalSystemProcessProcessstepsAllElectricProcessEquipmentElectricalDemand(kWh/tonne)ThermalDemand(kWh/tonne)ElectricalDemand(kWh/tonne)EquipmentSteamMethaneReforming2801,546H2Production6,238ElectrolysissystemConventionalSteamBoiler-467MeOHSynthesis381ElectricsteamBoilerDistillationUnit-638MeOHDistillation--Motors240-Others240Motors5202,651Subtotal7,0553,171TotalEnergy7,055Electricsteamboilerscanbeusedinsteadofconventionalfossilfuelboilerstomeettheall-electricprocessrequirement.Astheefficiencyofelectricboilers(>99%)ishigherthanconventionalones(typically75-80%),therequiredamountofenergyislower.EnergyuseMethanolproductionwasidentifiedintwooutof20statesincludedinthisstudy,LouisianaandTexas.Electrificationwillsignificantlyincreasethetotalfinalenergyuseformethanolproductioninbothstatesduringthestudyperiod(Figure39).Thesubstantialamountofenergyrequiredbythewaterelectrolysisprocessforhydrogenproductionisthemainreasonfortheriseinenergyuseforthemethanolelectrificationprocess.33IndustrialElectrificationinU.S.StatesFigure39.Changeinthemethanolindustry’stotalfinalenergyuseafterelectrification(technicalpotentialassuming100%adoptionrate)CO2emissionsMethanolproductionelectrificationcanresultinanincreaseinCO2emissionsin2030-2040underthebaselinescenarioinbothstates(Figure40).Astheelectricitygriddecarbonizesinbothstatesin2050,wewillseeareductioninannualCO2emissions.Figure40.Changeinthemethanolindustry’snetCO2emissionsafterelectrification-baselinescenario(technicalpotentialassuming100%adoptionrate)Ifazero-carbongridisachievedin2035inbothstates,CO2emissionsreductionswillbeachievedearlierthaninthebaselinescenario,in2040ratherthan2050.Also,theCO2emissionsincreasein2030underthestatedpolicyscenarioismuchsmallerthanthatinthebaselinescenariobecausetheelectricitygriddecarbonizesmorerapidly.010,00020,00030,00040,00050,00060,00070,00080,000LouisianaTexasChangeinEnergyUse(TJ/Year)203020402050-4,000-3,000-2,000-1,00001,0002,0003,0004,0005,0006,000LouisianaTexasChangeinCO2Emissions(ktCO2/Year)20302040205034IndustrialElectrificationinU.S.StatesFigure41.Changeinthemethanolindustry’snetCO2emissionsafterelectrification-statedpolicyscenario(technicalpotentialassuming100%adoptionrate)EnergycostFigure42showsthatusingtheEIAelectricitypriceforecast,theenergycostperunitofproduction(tonneofmethanol)in2030fortheelectrifiedmethanolproductionprocessisaroundseventimeshigherthanthatoftheconventionalprocessin2021inbothstates.Usingalowerelectricitypriceforecastscenario,electrifiedmethanolproductionisstillmorethanthreetimesmoreexpensivecomparedwiththeconventionalprocessinbothstates.Figure42.EnergycostperunitofproductioninthemethanolindustryOtherresearchersalsoestimatemethanol’sproductioncostbasedonfossilfuelandelectrolysis-basedprocesses.Despiterenewableelectricitycostreductions,itisclearthatmanufacturingmethanolwiththeelectrifiedprocessisnotandwillnotbecostcompetitivewiththeconventionalfossil-fuelbasedproductionprocess(Bosetal.2020).-3,000-2,500-2,000-1,500-1,000-50005001,0001,5002,000LouisianaTexasChangeinCO2Emissions(ktCO2/Year)203020402050050100150200250300350400TexasLouisianaEnergyCostperUnitofProduction(2021$/ton)2021ConventionalProcess2030ElectrifiedProcess(withEIAElec.PriceForecast)2030ElectrifiedProcess(withLowerREPriceForecast)2050ElectrifiedProcess(withEIAElec.PriceForecast)2050ElectrifiedProcess(withLowerREPriceForecast)35IndustrialElectrificationinU.S.States3.6.PlasticRecyclingIndustryPlasticsarearapidlyrisingproportionofmunicipalsolidwaste(MSW).DifferenttypesofplasticsareincludedintherangeofMSWcategories:IntheU.S.,thecontainersandpackagingcategoryaccountedforthehighestplastictonnage(around14milliontonnes)in2017.Majorproductsincludedunderthiscategoryarebags,packagingmaterials,polyeth-yleneterephthalate(PET)bottles,jars,high-densitypolyethylene(HDPE)bottles,andothercontainers(EPA2017).Themaingoalsofrecyclingplasticsaretoreduceplasticpollutionandusefewervirginmaterialsforplasticproductmanufacturing.In2015,theU.S.recycledaround3.14milliontonnesofplastics,equivalenttoabout9%oftotalplasticproductionintheU.S.thatyear(Leblanc2019).Here,wecomparetheenergyintensitiesoftheelectrifiedplasticrecyclingprocessandthetraditionalvirginresinproductionmethodinpetrochemicalplants.Theenergy-andemissions-savingpotentialoftheelectrifiedplasticrecyclingprocessisinadditiontotheotherenvironmentalbenefitsthatplasticrecyclingdelivers.Itshouldbenotedthatvirginresinsproducedinpetrochemicalplantscanbeusedinawiderangeoflow-to-high-valueapplications,whilerecycledplasticstypicallyhaveapplicationsinthelow-valuerange.Adetailedexplanationofconventionalandelectrifiedprocessesforplasticmanufacturingisprovidedinourpreviousreport(Hasanbeigietal.2021).Tables8and9comparetheenergyintensitiesoftheconventionalandelectricprocessesforplasticmanufacturing.Table8.Originalpolymerproductionenergyintensity(Usedasplasticmainrawmaterials)(Gervet,2007)ThermalDemand(kWh/tonne)ElectricalDemand(kWh/tonne)Total(kWh/tonne)Polyethylene(PE)15,2744,16619,439Polypropylene(PP)16,1074,16620,272polyethyleneterephthalate(PET)8,60914,71823,327Average13,3297,68321,012Table9.All-electricplasticrecyclingprocessenergyintensity(BeyondZeroEmissions,2018)ProcessTemperature(°C)ElectricalDemand(kWh/tonne)Shredding-0Watercooling1070Aircompression-20Melting190270Extrusion/Molding-120Lighting-60Totalenergy540valueislessthan0.5.36IndustrialElectrificationinU.S.StatesEnergyuseFigure43showsthatusingtheelectrifiedplasticrecyclingprocesswillsignificantlyreducethetotalfinalenergyuseinplasticproductioncomparedtovirginresinproductionduringthestudyperiodupto2050.Ohio,Texas,Michigan,Minnesota,andIndianaarethestateswiththelargestenergy-savingpotentialsfromswitchingtoelectrifiedplasticrecyclingproduction.Figure43.Changeintheplasticsindustry’senergyuseusingelectricplasticrecyclingprocess(technicalpotentialassuming100%adoptionrate)CO2emissionsFigure44showstheplasticindustry’schangeinnetCO2emissionsafterelectrificationunderthebaselinescenario.Becauseofthesubstantialenergysavingsfromplasticproductionelectrification(showninFigure43),electrificationresultsinCO2emissionsreductionsin2030inallstatesstudied.ThedeclineintheCO2emissionsreductionpotentialbetween2030and2050showninFigures44and45resultsfromadeclineintheelectricitygrid’sCO2emissionsfactorinthisperiod:asthegriddecarbonizes,virginresinproductionemissionsintensitywilldecrease,therebyreducingthedifferencebetweentheconventionalvirginresinprocessandtheelectrifiedrecycledplasticprocess.Figure44.Changeintheplasticsindustry’snetCO2emissionsusingelectricplasticrecyclingprocess-baselinescenario(technicalpotentialassuming100%adoptionrate)-35,000-30,000-25,000-20,000-15,000-10,000-5,0000OhioTexasMichiganMinnesotaIndianaNorthCarolinaGeorgiaPennsylvaniaWisconsinIllinoisAlabamaFloridaCaliforniaIowaKentuckyLouisianaOklahomaColoradoWashingtonOregonChangeinEnergyUse(TJ/Year)203020402050-2,000-1,800-1,600-1,400-1,200-1,000-800-600-400-2000OhioTexasMichiganMinnesotaIndianaNorthCarolinaGeorgiaPennsylvaniaWisconsinIllinoisAlabamaFloridaCaliforniaIowaKentuckyLouisianaOklahomaColoradoWashingtonOregonChangeinCO2Emissions(ktCO2/Year)20302040205037IndustrialElectrificationinU.S.StatesFigure45showstheplasticindustry’schangeinnetCO2emissionsafterelectrificationunderthestatedpolicyscenario.Underthisscenario,theCO2emissionsreductionpotentialin2030and2040aresubstantiallyhigherthanthebaselinescenariobecausemorerapiddecarbonizationisassumedunderthestatedpolicyscenario.Figure45.Changeintheplasticsindustry’snetCO2emissionsusingelectricplasticrecyclingprocess-statedpolicyscenario(technicalpotentialassuming100%adoptionrate)Figure46showsthatnumerousstateshaveanopportunitytoreduceemissionsbyemployinganelectrifiedplasticsrecyclingprocesstoreplacetheconventionalvirginresinprocess.TexasandOhiohavethehighestpotentialtoreduceemissionsbymakingthischange.Figure46.Changeinemissionsintheplasticrecyclingindustryin2050EnergycostFigure47showsthattheenergycostperunitofproduction(tonneofplastic)fortheelectrifiedplasticrecyclingprocessin2030islessthan5%ofthecostofaconventionalplasticmanufacturingprocessin2021.Itshouldbenotedthattheenergyrelatedtothetransportationandsortingofrecycledplasticandthecostassociatedwiththemarenotincludedinthisanalysis.-1,600-1,400-1,200-1,000-800-600-400-2000OhioTexasMichiganMinnesotaIndianaNorthCarolinaGeorgiaPennsylvaniaWisconsinIllinoisAlabamaFloridaCaliforniaIowaKentuckyLouisianaOklahomaColoradoWashingtonOregonChangeinCO2Emissions(ktCO2/Year)20302040205038IndustrialElectrificationinU.S.StatesFigure47.Energycostperunitofproductionintheconventionalplasticsindustryandelectrifiedplasticsrecyclingprocess3.7.SteelIndustryTheU.S.steelindustryproduced87milliontonnes(Mt)ofcrudesteelin2021:30%wasproducedbyprimarysteelmakingplantsusingblastfurnace-basicoxygenfurnaces(BF-BOF),and70%wasproducedbyelectricarcfurnaces(EAFs),whichmainlyusesteelscrap.TheU.S.alsoimported27Mtandexported6.7Mtofsteelmillproductsin2020.ThevalueofrawsteelproducedbytheU.S.ironandsteelindustryin2021wasabout$92billion.ThreeU.S.companiesoperateBF-BOFplantsthatproducepigironandcrudesteelandhaveintegratedsteelmillsinninelocationsinIndiana,Ohio,Illinois,andMichigan.FiftycompaniesownEAFsteelplants,producingcrudesteelat98mini-mills.Indianaaccountedforanestimated26%oftotalrawsteelproduction,followedbyOhiowith12%,Michiganwith5%,andPennsylvaniawith5%.Nootherstatehasmorethan5%oftotaldomesticrawsteelproduction(USGS2020).Ironandsteelmanufacturingisoneofthemostenergy-intensiveindustriesworldwide.itproductionhasamongthehighestCO2emissionsofanyindustry,giventhevolumeofsteelproducedandthatcoalistheprimaryfuelandfeedstockforironoxidechemicalreduction.Theironandsteelindustryaccountsforaround11%ofglobalCO2emissionsand7%ofglobalGHGemissions(Hasanbeigi,2021).Adetailedexplanationofconventionalandelectrifiedprocessesforthesteelindustryisprovidedinourpreviousreport(Hasanbeigietal.2021).Table10comparestheenergyintensityofthesteelindustry’sconventionalandelectricprocesses.02004006008001,0001,2001,4001,600CaliforniaFloridaMichiganWisconsinMinnesotaColoradoIndianaPennsylvaniaIllinoisOregonNorthCarolinaOhioIowaGeorgiaTexasWashingtonAlabamaLouisianaOklahomaKentuckyEnergyCostperUnitofProduction(2021$/ton)2021ConventionalProcess2030ElectrifiedProcess(withEIAElec.PriceForecast)2030ElectrifiedProcess(withLowerREPriceForecast)2050ElectrifiedProcess(withEIAElec.PriceForecast)2050ElectrifiedProcess(withLowerREPriceForecast)39IndustrialElectrificationinU.S.StatesTable10.Conventionaland(mostly)electricsteelmakingprocesses’energyintensitiesSteelProductionTypesProcessStepsThermalDemand(kWh/tonne)ElectricalDemand(kWh/tonne)TotalEnergy(kWh/tonne)BF-BOFSteelProductionSintering/PelletizationCokeMakingBlastFurnaceBasicOxygenFurnaceCasting,Rolling,andFinishing4,8616215,482Scrap-EAFSteelProductionEAFCasting,Rolling,andFinishing6677101,377H2DRI-EAFSteelProductionH2ProductionDRIProductionEAFCasting,Rolling,andFinishing6673,5004,167SteelProductionbyElectrolysisElectrolysisofIronOreCasting,Rolling,andFinishing5563,3003,856H2DRIEAF:HydrogenDirectReducedIron(DRI)-EAFsteelmakingprocessAllU.S.integratedBF-BOFsteelplantsarelocatedinIndiana,Ohio,Illinois,Pennsylvania,andMichigan.Theanalysisquantifiestheenergy,GHGemissions,andcostimplicationsofconvertingallBF-BOFsteelmakinginthesefourstatestoelectrifiedsteelmakingusingoneofthethreeelectrifiedsteelmakingprocessesshowninTable10.EnergyuseFigures48to50showenergysavingsfromelectrifiedsteelmakingusingoneofthethreeelectrifiedprocessesin2030-2050.Electrificationwillsignificantlyreducethesteelindustry’stotalfinalenergyuseinthesefivestatesduringthestudyperiodinallthreeelectrifiedtechnologycases.SwitchingtoScrap-EAFsteelproductioncreatesthelargestenergysavings.Theenergysavingsincreaseovertimebecauseanincreaseinsteelproductionisassumedupto2050.Itshouldbenotedthattheenergysavingsachievedfromthesethreeelectrifiedsteelmakingprocessescannotbecombined.ThesearethreeseparatetechnologyscenariostoshowtheenergysavingsandGHGimplicationsifoneelectrifiedsteelmakingprocesswereusedtoreplaceBF-BOFsteelmaking.Figure48.Changeinthesteelindustry’stotalfinalenergyuseafterelectrificationusingScrap-EAFtechnology(technicalpotentialassuming100%adoptionrate)-250,000-200,000-150,000-100,000-50,0000IndianaOhioIllinoisPennsylvaniaMichiganChangeinEnergyUse(TJ/Year)20302040205040IndustrialElectrificationinU.S.StatesFigure49.Changeinthesteelindustry’stotalfinalenergyuseafterelectrificationusingH2DRI-EAFtechnology(technicalpotentialassuming100%adoptionrate)Figure50.Changeinthesteelindustry’stotalfinalenergyuseafterelectrificationusingelectrolysistechnology(technicalpotentialassuming100%adoptionrate)CO2emissionsSteelproductionelectrificationwithScrap-EAFtechnologycouldresultinasubstantialdropinCO2emissionsin2030inallfivestates(Figure51).However,electrificationwithH2DRI-EAFandelectrolysistechnologycanresultinasmallerdropinCO2emissionsin2030(Figures52-53).Astheelectricitygriddecarbonizesinthesestatesbetween2030and2050,substantialannualCO2emissionreductionsfromsteelproductionelectrificationoccurwiththesetechnologies.AlthoughtheH2DRI-EAFandelectrolysisprocessroutesresultinrelativelysmallertotalenergysavings,sincethemajorityofenergyusedinH2DRI-EAFandelectrolysisiselectricity(forH2productionneededinH2DRIandelectrolysisprocessintheelectrolysisofironore),theirCO2emissionsreductionsarecomparablewithScrap-EAFin2050astheelectricitygridisdecarbonized.-250,000-200,000-150,000-100,000-50,0000IndianaOhioIllinoisPennsylvaniaMichiganChangeinEnergyUse(TJ/Year)203020402050-250,000-200,000-150,000-100,000-50,0000IndianaOhioIllinoisPennsylvaniaMichiganChangeinEnergyUse(TJ/Year)20302040205041IndustrialElectrificationinU.S.StatesFigure51.Changeinthesteelindustry’snetCO2emissionsafterelectrificationusingScrap-EAFtechnology-baselinescenario(technicalpotentialassuming100%adoptionrate)Figure52.Changeinthesteelindustry’snetCO2emissionsafterelectrificationusingH2DRI-EAFtechnology-baselinescenario(technicalpotentialassuming100%adoptionrate)Figure53.Changeinthesteelindustry’snetCO2emissionsafterelectrificationusingelectrolysistechnology-baselinescenario(technicalpotentialassuming100%adoptionrate)-30,000-25,000-20,000-15,000-10,000-5,0000IndianaOhioIllinoisPennsylvaniaMichiganChangeinCO2Emissions(ktCO2/Year)203020402050-30,000-25,000-20,000-15,000-10,000-5,0000IndianaOhioIllinoisPennsylvaniaMichiganChangeinCO2Emissions(ktCO2/Year)203020402050-30,000-25,000-20,000-15,000-10,000-5,0000IndianaOhioIllinoisPennsylvaniaMichiganChangeinCO2Emissions(ktCO2/Year)20302040205042IndustrialElectrificationinU.S.StatesIfazero-carbongridisachievedearlierinthesestates,theCO2emissionsreductionpotentialinfutureyears(2030,2040,and2050)issubstantiallylarger(Figure54)thanthebaselinescenario.Figure54.Changeinthesteelindustry’snetCO2emissionsafterelectrificationusingH2DRI-EAFtechnology-statedpolicyscenario(technicalpotentialassuming100%adoptionrate)ThemapinFigure55showsthatsteelproductionintheU.S.,andthusemissionsreductionpotentialfromelectrifyingthesteelindustrywithH2DRI-EAFtechnology,isconcentratedintheGreatLakesregion.Figure55.ChangeinemissionsinthesteelindustryusingH2DRI-EAFin2050EnergycostFigures56to58showtheenergycostperunitofproduction(tonneofsteel)fortheBF-BOFandthreeelectrifiedsteeltechnologies.ComparedwithBF-BOFsteelproduction,underthescenariowiththeEIAelectricitypriceforecast,theenergycostperunitofproductissubstantiallylowerforScrap-EAFtechnologyandsignificantlyhigherfortheH2DRI-EAFandelectrolysistechnologiesin2030inallstates.TheScrap-EAFhasalowerenergycostthanBF-BOFsteelmakingandtheothertwoelectrifiedprocessesmainlybecauseScrap-EAFhassubstantiallylowerenergydemand(Table10)thantheotherprocesses.UndertheLowerREelectricitypriceforecast,bothH2DRI-EAFandelectrolysistechnologieshavealowerenergycostperunitofproductioncomparedwiththeBF-BOFsteelproductioninallstatesstudiedexceptIllinois.-30,000-25,000-20,000-15,000-10,000-5,0000IndianaOhioIllinoisPennsylvaniaMichiganChangeinCO2Emissions(ktCO2/Year)20302040205043IndustrialElectrificationinU.S.StatesFigure56.EnergycostperunitofproductioninthesteelindustryforconventionalandScrap-EAFtechnologyFigure57.EnergycostperunitofproductioninthesteelindustryforconventionalandH2DRI-EAFtechnologyFigure58.Energycostperunitofproductioninthesteelindustryforconventionalandelectrolysistechnology020406080100120140160180MichiganIndianaPennsylvaniaIllinoisOhioEnergyCostperUnitofProduction(2021$/ton)2021ConventionalProcess2030ElectrifiedProcess(withEIAElec.PriceForecast)2030ElectrifiedProcess(withLowerREPriceForecast)2050ElectrifiedProcess(withEIAElec.PriceForecast)2050ElectrifiedProcess(withLowerREPriceForecast)050100150200250300MichiganIndianaPennsylvaniaIllinoisOhioEnergyCostperUnitofProduction(2021$/ton)2021ConventionalProcess2030ElectrifiedProcess(withEIAElec.PriceForecast)2030ElectrifiedProcess(withLowerREPriceForecast)2050ElectrifiedProcess(withEIAElec.PriceForecast)2050ElectrifiedProcess(withLowerREPriceForecast)050100150200250300MichiganIndianaPennsylvaniaIllinoisOhioEnergyCostperUnitofProduction(2021$/ton)2021ConventionalProcess2030ElectrifiedProcess(withEIAElec.PriceForecast)2030ElectrifiedProcess(withLowerREPriceForecast)2050ElectrifiedProcess(withEIAElec.PriceForecast)2050ElectrifiedProcess(withLowerREPriceForecast)44IndustrialElectrificationinU.S.States3.8.BeerIndustryIn2021,therewerereportedtobeover8,000breweriesintheU.S.,collectivelyproducingaround211millionbarrelsoftotalannualbeer.In2050,productionisexpectedtoriseto252millionbarrels(U.S.DOE2017b).Brewingisoneofthefoodandbeverageindustry’shighestenergy-consumingsubsectors(U.S.DOE/EIA,2017).Thebrewingprocessisaprocedurethattransformsyeast,water,grains,andhopsintobeer.Ingredientvariationandproductionconditions,suchasvarietalsandtemperature,yieldawiderangeofbeertypesandstyles(Sánchez2017).Heatpumpscouldbeutilizedtoelectrifythebeerproductionprocessinfourprocessstages.Thecoefficientofperformance(COP)2oftheseheatpumpsisincludedinTable11.Table11.Heatpumpspecifications(BeyondZeroEmissions,2019)ProcessStageOutputTemperature(OC)CoefficientofPerformanceHeatPump1Boiling1101.8HeatPump2Boiling1101.8HeatPump3Pasteurization605HeatPump4Mashing&Cleaning804Adetailedexplanationofthebeerindustry’sconventionalandelectrifiedprocessesisprovidedinourpreviousreport(Hasanbeigietal.2021).Table12comparestheenergyintensityofbeerproduction’sconventionalandelectricprocesses.Table12.Conventionalandelectricbeerproductionprocesses’energyintensities(BeyondZeroEmissions2019)ConventionalSystemProcessProcessstepsAllElectricProcessHeatingEquipmentThermalDemand(kWh/Hectoliter)ElectricalDemand(kWh/Hectoliter)HeatingEquipmentCentralizedGasBoilerSystem2.9Mashing0.6HeatPump4CentralizedGasBoilerSystem12.9Boiling6.1HeatPump1&2CentralizedGasBoilerSystem5.2Pasteurization0.9HeatPump3CentralizedGasBoilerSystem12.0Cleaning&ProductionSupport2.6HeatPump433.0Subtotal10.233.0TotalEnergy10.2HeatpumpnumbersinthiscolumnrefertothetypeofheatpumpasindicatedinTable112.ThecoefficientofperformanceorCOPofaheatpumpisaratioofusefulheatingprovidedtowork(energy)required.HigherCOPequatestohigherefficiency,lowerenergyconsumptionandthusloweroperatingcosts.45IndustrialElectrificationinU.S.StatesEnergyuseBeerproductionelectrificationwillsignificantlyreducethetotalfinalenergyuseduringthestudyperiod(Figure59).Theenergysavingsincreaseovertimebecauseanincreaseinproductionisassumedupto2050.Colorado,California,Texas,Ohio,andGeorgiaarethestateswiththelargestenergysavingspotentialsfromswitchingtoelectrifiedbeerproductionprocesses.Figure59.Changeinthebeerindustry’stotalfinalenergyuseafterelectrification(technicalpotentialassuming100%adoptionrate)CO2emissionsFigure60showsthatstatesacrossthecountryhavetheopportunitytorealizeemissionsreductionsin2050withanelectrifiedbeerproductionprocess.ColoradoandCaliforniahavethehighestemissionsreductionpotential.Figure60.Changeinemissionsinthebeerindustryin2050Figure61showsthebeerindustry’schangeinnetCO2emissionsafterelectrificationunderthebaselinescenario.BeerproductionelectrificationwillresultinadropinCO2emissionsin2030inallstatesstudied.ElectrificationfurtherreducesannualCO2emissionsby2050inallstatesbecauseofgriddecarbonization.-3,500-3,000-2,500-2,000-1,500-1,000-5000ColoradoCaliforniaTexasOhioGeorgiaWisconsinPennsylvaniaFloridaNorthCarolinaMichiganOregonIllinoisWashingtonMinnesotaIndianaLouisianaIowaKentuckyAlabamaOklahomaChangeinEnergyUse(TJ/Year)20302040205046IndustrialElectrificationinU.S.StatesFigure61.Changeinthebeerindustry’snetCO2emissionsafterelectrification-baselinescenario(tech-nicalpotentialassuming100%adoptionrate)Figure62showsthatunderthestatedpolicyscenario,theCO2emissionsreductionpotentialin2030issubstantiallyhigherthaninthebaselinescenariobecausemorerapidgriddecarbonizationisassumed.Figure62.Changeinthebeerindustry’snetCO2emissionsafterelectrification-statedpolicyscenario(technicalpotentialassuming100%adoptionrate)EnergycostFigure63showsthatunderthescenariowiththeEIAelectricitypriceforecast,theenergycostperunitofproductionin2030fortheelectrifiedprocessinthebeerindustryishigherthanthatoftheconventionalprocessin2021insomestates(includingCalifornia,Texas,andOklahoma),almostequalinsomestates(includingFlorida,Michigan,andNorthCarolina),andlowerinotherstates(includingPennsylvania,Washington,andOhio).ThisisbecausestateslikeCalifornia,Texas,andOklahomahavearelativelylowerratiooftheunitpriceofelectricitytonaturalgas.(seeFigure12).-180-160-140-120-100-80-60-40-20020ColoradoCaliforniaTexasOhioGeorgiaWisconsinPennsylvaniaFloridaNorthCarolinaMichiganOregonIllinoisWashingtonMinnesotaIndianaLouisianaIowaKentuckyAlabamaOklahomaChangeinCO2Emissions(ktCO2/Year)203020402050-180-160-140-120-100-80-60-40-200ColoradoCaliforniaTexasOhioGeorgiaWisconsinPennsylvaniaFloridaNorthCarolinaMichiganOregonIllinoisWashingtonMinnesotaIndianaLouisianaIowaKentuckyAlabamaOklahomaChangeinCO2Emissions(ktCO2/Year)20302040205047IndustrialElectrificationinU.S.StatesFigure63showstheenergycostperunitofelectrifiedbeerproductionprocessesin2050undertwoscenarios,onewithhigherandanotherwithlowerelectricitypricesineachstate.Evenunderthehigher2050electricitypricescenario,anelectrifiedbeerproductionprocessiscost-competitivecomparedtotheconventionalprocessinmanystatesstudied.Figure63.Energycostperunitofproductioninthebeerindustry3.9.BeetSugarIndustryOneofthemostpopularandwidelyavailablesweeteners,granulatedwhitesugar,isextractedfromsugarcaneandsugarbeetplants.Itiscolloquiallyreferredtoas“sugar”ortablesugarandisamongthepurest(about99.95%)foodproducts.Thesugarcontentofbeetandcanejuicesisquitesimilar,butimpurityamountsdiffer.Impuritiesinbeetandcanejuicearearound2.5%and5%,respectively.Theprocessesandthechemicalsutilizedforrefiningcaneandbeetsugarsvaryduetodifferencesinimpuritiesandtheproducts’compositions(Campos2020).Bagasse,adrypulpyresidueobtainedasaby-productofthesugarcanesugarmanufacturingprocess,isutilizedasafuelincogenerationsystemsthatprovideheatandelectricityforthesugarproductionprocess.Overthelastfewyears,numeroussugarcanefactorieshaveproducedexcesselectricitythatcanbesoldtothegrid,providinganadditionalrevenuestream(Ensinas2006).Therefore,sugarcaneproductionelectrificationwasdeemedlesslikely,andthestudyfocusedonbeetsugarproductionelectrification.TotalannualU.S.beetsugarproductionisestimatedtobearound4.6millionmetrictonnes(U.S.DOE2017b).Itisalsooneofthefoodandbeverageindustry’shighestenergy-consumingsubsectors.Adetailedexplanationofconventionalandelectrifiedprocessesforthebeetsugarindustryisprovidedinourpreviousreport(Hasanbeigietal.2021).Table13comparestheenergyintensityofbeetsugarproduction’sconventionalandelectricprocesses.0.00.20.40.60.81.01.21.41.61.8CaliforniaFloridaMichiganWisconsinMinnesotaColoradoIndianaPennsylvaniaIllinoisOregonNorthCarolinaOhioIowaGeorgiaTexasWashingtonAlabamaLouisianaOklahomaKentuckyEnergyCostperUnitofProduction(2021$/HectoLiter)2021ConventionalProcess2030ElectrifiedProcess(withEIAElec.PriceForecast)2030ElectrifiedProcess(withLowerREPriceForecast)2050ElectrifiedProcess(withEIAElec.PriceForecast)2050ElectrifiedProcess(withLowerREPriceForecast)48IndustrialElectrificationinU.S.StatesTable13.Conventionalandelectricbeetsugarproductionprocesses’energyintensities(Hasanbeigietal.2021)ConventionalSystemProcessProcessstepsAllElectricProcessHeatingEquipmentElectricalDemand(kWh/tonne)ThermalDemand(kWh/tonne)ElectricalDemand(kWh/tonne)HeatingEquipmentConventionalSteamGenerator153778JuiceDiffusion464HeatPumpConventionalSteamGeneratorJuicePurificationHeatPumpConventionalSteamGeneratorEvaporationHeatPumpConventualSteamGeneratorCrystallizationElectricSteamBoilerDirectFuelBaseDryer806PulpDrying806ElectricAirDryer1531,584Subtotal1,2701,737TotalEnergy1,270EnergyuseWeidentifiedbeetsugarproductionineightofthestudiedstates.Electrificationwillreducethetotalfinalenergyuseforbeetsugarproductioninalleightstates(Figure64).Theenergysavingsincreaseovertimebecauseanincreaseinbeetsugarproductionisassumedupto2050.Figure64.Changeinthebeetsugarindustry’stotalfinalenergyuseafterelectrification(technicalpotentialassuming100%adoptionrate)CO2emissionsFigure65showswhichstatesinthisstudyhavethepotentialtoreduceCO2emissionsin2050byelectrifyingthebeetsugarindustry.Minnesotahasthehighestpotentialtoreduceemissions,whileMichiganandCaliforniaalsohavearelativelyhighpotential.-2,500-2,000-1,500-1,000-5000MinnesotaMichiganCaliforniaIowaOregonColoradoIllinoisOhioChangeinEnergyUse(TJ/Year)20302040205049IndustrialElectrificationinU.S.StatesFigure65.Changeinemissionsinthebeetsugarindustryin2050BeetsugarproductionelectrificationcouldresultinaslightincreaseinCO2emissionsin2030inMichiganandOhiobecauseoftheirrelativelyhighergridCO2emissionscomparedtootherbeetsugar-producingstates(Figure66).Astheelectricitygriddecarbonizesinthesetwostatesbetween2030and2050,theywillrealizedannualCO2emissionsreductionsthroughelectrifyingbeetsugarproduction.Figure66.Changeinthebeetsugarindustry’snetCO2emissionsafterelectrification-baselinescenario(technicalpotentialassuming100%adoptionrate)Ifazero-carbongridisachievedearlierinallstates,theCO2emissionsreductionpotentialinfutureyearsissubstantiallyhigher(Figure67)thanthebaselinescenario.InMichiganandOhio,CO2emissionswillincreasein2030underthebaselinescenario,butCO2emissionswilldecreasein2030underthestatedpolicyscenariobecausemorerapidelectricitygriddecarbonizationisassumed.-500-400-300-200-1000100MinnesotaMichiganCaliforniaIowaOregonColoradoIllinoisOhioChangeinCO2Emissions(ktCO2/Year)20302040205050IndustrialElectrificationinU.S.StatesFigure67.Changeinthebeetsugarindustry’snetCO2emissionsafterelectrification-statedpolicyscenario(technicalpotentialassuming100%adoptionrate)EnergycostFigure68showsthattheenergycostperunitofproduction(tonneofbeetsugar)in2030fortheelectrifiedbeetsugarprocessismorethantwotimeshigherthanthatoftheconventionalprocessin2021inallstatesunderthescenariowiththeEIAelectricitypriceforecast.UsingtheLowerREpriceforecastscenario,electrifiedbeetsugarproductioncanbecost-competi-tivewiththeconventionalprocessinallstatesinboth2030and2050exceptinCalifornia.Figure68.Energycostperunitofproductioninthebeetsugarindustry3.10.MilkPowderIndustryDehydratingliquidmilkusingdryingprocessescreatespowderedmilkordriedmilk.Milkpreservationisoneofthemainreasonstodryitsincemilkpowderhasamuchlongershelflifeascomparedtoliquidmilkandhasnorefrigerationrequirements(Rotronic2015).TheU.S.-500-450-400-350-300-250-200-150-100-500MinnesotaMichiganCaliforniaIowaOregonColoradoIllinoisOhioChangeinCO2Emissions(ktCO2/Year)203020402050050100150200250CaliforniaMichiganMinnesotaColoradoIllinoisOregonOhioIowaEnergyCostperUnitofProduction(2021$/ton)2021ConventionalProcess2030ElectrifiedProcess(withEIAElec.PriceForecast)2030ElectrifiedProcess(withLowerREPriceForecast)2050ElectrifiedProcess(withEIAElec.PriceForecast)2050ElectrifiedProcess(withLowerREPriceForecast)51IndustrialElectrificationinU.S.Statesistheworld’ssinglelargestmanufacturerofskimmilkpowder(SMP)ornonfatdrymilk,withcloseto1.1milliontonnesproducedin2019.U.S.SMPproductioncontinuestorise,andthecountrycurrentlyproducesalmostaquarterofSMPglobally.U.S.SMPexportshaverisen,withover50%ofproductiondestinedforoverseasmarkets(U.S.DairyExportCouncil2015).Thedairyindustryisalsooneofthelargestenergy-consumingfoodandbeveragesubsectors.Adetailedexplanationofconventionalandelectrifiedprocessesforthemilkpowderindustryisprovidedinourpreviousreport(Hasanbeigietal.2021).Table14comparestheenergyintensityofthemilkpowderindustry’sconventionalandelectricprocesses.Table14.Conventionalandelectricmilkpowderproductionprocesses’energyintensities(BeyondZeroEmissions2018)ConventionalSystemProcessProcessStepsAllElectricProcessEquipmentElectricalDemand(kWh/tonne)ThermalDemand(kWh/tonne)ElectricalDemand(kWh/tonne)EquipmentCentrifuge133Separation13Centrifuge---ReverseOsmosis35ReverseOsmosisPumpSteamBoiler-388Pre-Heating47HeatPump1MechanicalandThermalVaporRecompression90133Evaporation27MechanicalandThermalVaporRecompressionSteamBoiler501,139Drying492HeatPump2,ElectricAirHeaterFluidizedBed45111Cooling148FluidizedBed1981,774Subtotal7621,972TotalEnergy762EnergyuseAllstatesstudiedhavemilkpowderproductionexceptLouisiana.Electrificationwouldreducethemilkpowderindustry’stotalfinalenergyuse(Figure69).California,Wisconsin,Michigan,Pennsylvania,andMinnesotaarethestateswiththelargestenergysavingspotentialsfromswitchingtoelectrifiedmilkpowderproduction.Figure69.Changeinthemilkpowderindustry’stotalfinalenergyuseafterelectrification(technicalpotentialassuming100%adoptionrate)-1,600-1,400-1,200-1,000-800-600-400-2000CaliforniaWisconsinMichiganPennsylvaniaMinnesotaIllinoisIowaIndianaOhioKentuckyWashingtonTexasOregonGeorgiaColoradoNorthCarolinaAlabamaFloridaOklahomaChangeinEnergyUse(TJ/Year)20302040205052IndustrialElectrificationinU.S.StatesCO2emissionsMilkpowderprocesselectrificationhasthepotentialtoreduceemissionsthroughoutthecountry.AsshowninFigure70,Californiahasthehighestpotentialtoreduceemissions.Figure70.Changeinemissionsinthemilkpowderindustryin2050MilkpowderprocesselectrificationcandecreaseCO2emissionsin2030inallmilkpowder-producingstatesstudied(Figure71).Figure72showsthemilkpowderindustry’schangeinnetCO2emissionsafterelectrificationunderourstatedpolicyscenario,wherehigherCO2emissionsreductionsareachievedinfutureyears.Figure71.Changeinthemilkpowderindustry’snetCO2emissionsafterelectrification-baselinescenario(technicalpotentialassuming100%adoptionrate)-140-120-100-80-60-40-200CaliforniaWisconsinMichiganPennsylvaniaMinnesotaIllinoisIowaIndianaOhioKentuckyWashingtonTexasOregonGeorgiaColoradoNorthCarolinaAlabamaFloridaOklahomaChangeinCO2Emissions(ktCO2/Year)20302040205053IndustrialElectrificationinU.S.StatesFigure72.Changeinthemilkpowderindustry’snetCO2emissionsafterelectrification-statedpolicyscenario(technicalpotentialassuming100%adoptionrate)EnergycostFigure73showsthatunderthescenariowiththeEIAelectricitypriceforecast,theenergycostperunitofproductionforanelectrifiedmilkpowderprocessin2030issubstantiallyhigherthanthatoftheconventionalprocessin2021insomestates(includingCalifornia,Texas,andOklahoma),almostequalinsomestates(includingFlorida,Michigan,andIndiana),andlowerinotherstates(includingPennsylvania,Washington,andOhio).Thisisprimarilydrivenbytheratiosoftheunitpriceofelectricitytonaturalgasineachstate(seeFigure12).Figure73.Energycostperunitofproductioninthemilkpowderindustry3.11.WetCornMillingIndustryIntheU.S.,wetmillinganddrymillingarethetwocommontechniquestoprocesscorn.Ethanolistheprimaryproductofthedrymillingprocessandisabyproductofthewetcornmillingprocess.Thewetmillingprocess’sprimaryproductsarecornstarchandediblecorn-140-120-100-80-60-40-200CaliforniaWisconsinMichiganPennsylvaniaMinnesotaIllinoisIowaIndianaOhioKentuckyWashingtonTexasOregonGeorgiaColoradoNorthCarolinaAlabamaFloridaOklahomaChangeinCO2Emissions(ktCO2/Year)203020402050020406080100120140CaliforniaFloridaMichiganWisconsinMinnesotaColoradoIndianaPennsylvaniaIllinoisOregonNorthCarolinaOhioIowaGeorgiaTexasWashingtonAlabamaOklahomaKentuckyEnergyCostperUnitofProduction(2021$/ton)2021ConventionalProcess2030ElectrifiedProcess(withEIAElec.PriceForecast)2030ElectrifiedProcess(withLowerREPriceForecast)2050ElectrifiedProcess(withEIAElec.PriceForecast)2050ElectrifiedProcess(withLowerREPriceForecast)54IndustrialElectrificationinU.S.Statesoil(O’BrienandWoolverton2009).Thewetcornmillingprocessefficientlyseparatescompo-nentsandshelledcornpartsforfoodandindustrialpurposes.Thisstudyfocusesonthewetcornmillingprocess.IntheU.S.,thereare25cornrefiningplantsandfouradditionalprocessingplants.In2018,themanufacturingvalueaddedbythecornrefiningindustrywasestimatedtobearound$12billion(CRA2019).TheU.S.wetcornmillingindustry’stotalproductionin2021wasaround30milliontonnes(U.S.DOE2017b).Theindustryisalsooneofthefoodandbeverageindustry’slargestenergy-consumingsubsectors(U.S.DOE/EIA,2017).Adetailedexplanationoftheconventionalandelectrifiedwetcornmillingprocessesisprovidedinourpreviousreport(Hasanbeigietal.2021).Table15comparestheenergyintensityofthewetcornmillingindustry’sconventionalandelectricprocesses.Table15.Conventionalandelectricwetcornmillingproductionprocesses’energyintensities(Hasanbeigietal.2021)ConventionalSystemProcessProcessStepsAllElectricProcessHeatingEquipmentElectricalDemand(kWh/tonne)ThermalDemand(kWh/tonne)ElectricalDemand(kWh/tonne)HeatingEquipment4.9-Cornreceiving5CentralSteamSystems2.536Steeping11HeatPump@51°CCentralSteamSystems6.1225Steepwaterevaporation70MechanicalVaporRecompression7.9-Germrecovery(1stgrind)84-Germrecovery(2ndgrind)40.3-Germrecovery(germwashing)0ConventionalFluidizedBedDryer5.178Germdewateringanddrying5ElectricalFluidizedBedDryer24.9-Fiberrecovery254.4-Fiberdewatering8211.5-Protein(gluten)recovery12ConventionalRotaryDryer5.941Glutenthickeninganddrying47ElectricalRotaryDryer5.5-Starchwashing6ConventionalRotaryDryer30.8312Starchdewateringanddrying343ElectricalRotaryDryerConventionalRingDryer11.2259Glutenfeeddryer270ElectricalRingDryer125951Subtotal8881,076TotalEnergy88855IndustrialElectrificationinU.S.StatesEnergyuseWetcornmillingproductionwasidentifiedin15ofthe20statesstudied.Figure74showsthatelectrificationwillsignificantlyreducethewetcornmillingindustry’stotalfinalenergyuseduringthestudyperiod.Theenergysavingsincreaseovertimebecauseanincreaseinwetcornmillingproductionisassumedupto2050.Iowa,Illinois,Indiana,Minnesota,andOhioarethestateswiththelargestenergysavingspotentialsfromswitchingtoelectrifiedwetcornmillingprocesses.Figure74.Changeinthewetcornmillingindustry’stotalfinalenergyuseafterelectrification(technicalpotentialassuming100%adoptionrate)CO2emissionsFigure75showsthewetcornmillingindustry’schangeinnetCO2emissionsafterelectrificationunderthebaselinescenario.WetcornmillingelectrificationcouldresultinanincreaseinCO2emissionsin2030inIndiana,Ohio,Texas,Kentucky,andWisconsinduetothehigher2030gridemissionsfactorsinthesestates(seefigure9).ElectrificationcanhelprealizelargeannualCO2emissionreductionsby2050inallstatesduetoadeclineintheelectricitygrid’sCO2emissionsfactorbetween2030and2050.Figure75.Changeinthewetcornmillingindustry’snetCO2emissionsafterelectrification-baselinescenario(technicalpotentialassuming100%adoptionrate)-10,000-9,000-8,000-7,000-6,000-5,000-4,000-3,000-2,000-1,0000IowaIllinoisIndianaMinnesotaOhioWisconsinCaliforniaWashingtonTexasKentuckyPennsylvaniaFloridaLouisianaNorthCarolinaColoradoChangeinEnergyUse(TJ/Year)203020402050-3,000-2,500-2,000-1,500-1,000-5000500IowaIllinoisIndianaMinnesotaOhioWisconsinCaliforniaWashingtonTexasKentuckyPennsylvaniaFloridaLouisianaNorthCarolinaColoradoChangeinCO2Emissions(ktCO2/Year)20302040205056IndustrialElectrificationinU.S.StatesFigure76showsthewetcornmillingindustry’schangeinnetCO2emissionsafterelectrificationunderthestatedpolicyscenario.TheCO2emissionsreductionpotentialinfutureyearsissubstantiallyhigherthanthebaselinescenariobecausemorerapidgriddecarbonizationisassumed.Figure76.Changeinthewetcornmillingindustry’snetCO2emissionsafterelectrification-statedpolicyscenario(technicalpotentialassuming100%adoptionrate)TherateofCO2emissionsreductionsfromelectrificationvariesacrossstates,asshowninthemapinFigure77.IowaandIllinoishavethegreatestemissionsreductionpotentialsin2050.Figure77.Changeinemissionsinthewetcornmillingindustryin2050ThedifferencesamongstatesareillustratedfurtherinFigures78and79,showingthewetcornmillingindustry’schangeinnetCO2emissionsafterelectrificationinIndianaandIllinois.InIndiana,CO2emissionswillinitiallyincreasein2030,butasthestate’sgriddecarbonizes,theCO2emissionsreductionpotentialsarerealizedfromwetcornmillingelectrification.InIllinois,however,thelowergridemissionsfactorin2030allowswetcornmillingelectrificationtoachieveCO2emissionsreductionsby2030(seeFigure9).-3,000-2,500-2,000-1,500-1,000-5000500IowaIllinoisIndianaMinnesotaOhioWisconsinCaliforniaWashingtonTexasKentuckyPennsylvaniaFloridaLouisianaNorthCarolinaColoradoChangeinCO2Emissions(ktCO2/Year)20302040205057IndustrialElectrificationinU.S.StatesFigure78.Changeinthewetcornmillingindustry’snetCO2emissionsafterelectrificationinIndianaFigure79.Changeinthewetcornmillingindustry’snetCO2emissionsafterelectrificationinIllinoisEnergycostFigure80showsthattheenergycostperunitofproductionfortheelectrifiedwetcornmillingprocessin2030issubstantiallyhigherthanthatoftheconventionalprocessin2021inallstatesunderthescenariowiththeEIAelectricitypriceforecast.Accesstolow-costelectricityinthefuturecansubstantiallyreducetheelectrifiedwetcornmillingproductionprocess’energycost,makingitmorecost-effectivewiththeconventionalprocessinallstatesstudied,asshownintheLowerREpricescenarioonthegraph.-600-500-400-300-200-1000100200300400203020402050ChangeinCO2Emissions(ktCO2/Year)BaselineScenario(ZeroCarbonGridin2050orasStatedinEachState'sTarget)StatedPolicyScenario(ZeroCarbonGridin2035inAllStates)-2,500-2,000-1,500-1,000-5000203020402050ChangeinCO2Emissions(ktCO2/Year)BaselineScenario(ZeroCarbonGridin2050orasStatedinEachState'sTarget)StatedPolicyScenario(ZeroCarbonGridin2035inAllStates)58IndustrialElectrificationinU.S.StatesFigure80.Energycostperunitofproductioninthewetcornmillingindustry3.12.SoybeanOilIndustrySoybeanoil,extractedfromsoybeanseeds,isamongtheworld’smostbroadlyusednaturaloils.Itisusedforavastrangeofapplications,suchasnutritionalsupplements,cosmetics,food,andagriculture.Theindustryisdrivenbytherisingdemandforsoybeanmealforlivestock,resultinginaconsiderableincreaseinsoybeanoilproduction(EMR2020).In2019,theU.S.producedanestimated9.5milliontonnesofsoybeanoil(U.S.DOE2017b).Soybeanoilproductionisalsooneofthefoodandbeverageindustry’slargestenergy-consumingsubsectors(U.S.DOE/EIA2017a).Adetailedexplanationofthesoybeanoilindustry’sconventionalandelectrifiedprocessesisprovidedinourpreviousreport(Hasanbeigietal.2021).Table16comparestheenergyintensityofthesoybeanoilindustry’sconventionalandelectricprocesses.Table16.Conventionalandall-electriccrudesoybeanoilproductionprocesses’energyconsumption(Hasanbeigietal.2021)ConventionalSystemProcessProcessstepsAllElectricProcessHeatingEquipmentElectricalDemand(kWh/tonne)ThermalDemand(kWh/tonne)ElectricalDemand(kWh/tonne)HeatingEquipmentConventionalSteamGenerator-17Leaching7HeatPumpConventionalSteamGenerator-143Evaporators124ElectricSteamBoilerConventionalSteamGenerator-501501IndirectResistiveHeatingConventionalSteamGenerator-18Stripping16ElectricSteamBoilerConventionalSteamGenerator-815Desolventizer212FluidizedBedUsingAir/NitrogenConventionalSteamGenerator-293Tailgasstripper-125-Electricaldevices1251251,787Subtotal9841,912Total984020406080100120140160CaliforniaFloridaWisconsinMinnesotaColoradoIndianaPennsylvaniaIllinoisNorthCarolinaOhioIowaTexasWashingtonLouisianaKentuckyEnergyCostperUnitofProduction(2021$/ton)2021ConventionalProcess2030ElectrifiedProcess(withEIAElec.PriceForecast)2030ElectrifiedProcess(withLowerREPriceForecast)2050ElectrifiedProcess(withEIAElec.PriceForecast)2050ElectrifiedProcess(withLowerREPriceForecast)59IndustrialElectrificationinU.S.StatesEnergyuseFigure81showsthatelectrificationwillreducethesoybeanoilindustry’stotalfinalenergyuseduring2030-2050.Iowa,Indiana,Illinois,Minnesota,andOhioarethestateswiththelargestenergysavingspotentialsfromswitchingtoelectrifiedsoybeanoilproductionprocesses.Figure81.Changeinthesoybeanoilindustry’stotalfinalenergyuseafterelectrification(technicalpotentialassuming100%adoptionrate)CO2emissionsFigure82showsthechangeinthesoybeanoilindustry’snetCO2emissionsafterelectrificationunderthebaselinescenario.SoybeanoilproductionelectrificationcouldresultinCO2emissionsincreasesin2030inIndianaandKentuckybecauseoftheirrelativelyhighergridemissionsfactorscomparedwiththatofothersoybeanoil-producingstates.Figure82.Changeinthesoybeanoilindustry’snetCO2emissionsafterelectrification-baselinescenario(technicalpotentialassuming100%adoptionrate)-8,000-7,000-6,000-5,000-4,000-3,000-2,000-1,0000IowaIndianaIllinoisMinnesotaOhioOklahomaAlabamaGeorgiaNorthCarolinaKentuckyLouisianaTexasCaliforniaWashingtonMichiganWisconsinColoradoOregonFloridaPennsylvaniaChangeinEnergyUse(TJ/Year)203020402050-900-800-700-600-500-400-300-200-1000100IowaIndianaIllinoisMinnesotaOhioOklahomaAlabamaGeorgiaNorthCarolinaKentuckyLouisianaTexasCaliforniaWashingtonMichiganWisconsinColoradoOregonFloridaPennsylvaniaChangeinCO2Emissions(ktCO2/Year)20302040205060IndustrialElectrificationinU.S.StatesFigure83showsthesoybeanoilindustry’schangeinnetCO2emissionsafterelectrificationunderthestatedpolicyscenario.Underthisscenario,theCO2emissionsreductionpotentialinfutureyears(2030,2040,and2050)issubstantiallyhigherthanthebaselinescenariobe-causemorerapidgriddecarbonizationisassumedunderthestatedpolicyscenario.Figure83.Changeinthesoybeanoilindustry’snetCO2emissionsafterelectrification-statedpolicyscenario(technicalpotentialassuming100%adoptionrate)Figure84showsCO2emissionsreductionsin2050forthesoybeanoilindustry.Iowa,Illinois,andIndianahavethegreatestemissionsreductionpotentialin2050,whileadditionalGreatLakesandSoutheasternstates,aswellasOklahoma,havearelativelyhighopportunitytodecarbonize.Figure84.Changeinemissionsinthesoybeanoilindustryin2050Figures85and86showthesoybeanoilindustry’schangeinnetCO2emissionsafterelectrificationinIndianaandIowa,illustratinghowdifferentgridemissionsfactorsimpactemissionsreductionsinthemediumandlongterm.InIndiana,CO2emissionsinitiallyincreasein2030,butinlateryears,CO2emissionsreductionpotentialsarerealizedasthegriddecarbonizes.InIowa,however,CO2emissionsreductionsfromsoybeanoilproductionelectrificationcouldbeachievedin2030becausethestatehasalowergridemissionsfactor(seeFigure9).-900-800-700-600-500-400-300-200-1000IowaIndianaIllinoisMinnesotaOhioOklahomaAlabamaGeorgiaNorthCarolinaKentuckyLouisianaTexasCaliforniaWashingtonMichiganWisconsinColoradoOregonFloridaPennsylvaniaChangeinCO2Emissions(ktCO2/Year)20302040205061IndustrialElectrificationinU.S.StatesFigure85.Changeinthesoybeanoilindustry’snetCO2emissionsafterelectrificationinIndianaFigure86.Changeinthesoybeanoilindustry’snetCO2emissionsafterelectrificationinIowaEnergycostFigure87showsthatunderthescenariowiththeEIAelectricitypriceforecast,theenergycostperunitofproductionin2030forsoybeanoilelectrifiedprocessesissubstantiallyhigherthanthatoftheconventionalprocessin2021inmoststatesexceptPennsylvaniaandWashington.Thisisbecausethesetwostateshavearelativelylowerratiooftheunitpriceofindustrialelectricitytonaturalgas(seeFigure12).Ascenariowithlowerelectricitypricescansubstantiallyreducetheenergycostofelectrifiedsoybeanoilproduction,makingitevenmorecost-effectivethantheconventionalprocessinallstatesstudiedexceptCalifornia,Texas,andOklahoma.-800-700-600-500-400-300-200-1000100203020402050ChangeinCO2Emissions(ktCO2/Year)BaselineScenario(ZeroCarbonGridin2050orasStatedinEachState'sTarget)StatedPolicyScenario(ZeroCarbonGridin2035inAllStates)-900-800-700-600-500-400-300-200-1000203020402050ChangeinCO2Emissions(ktCO2/Year)BaselineScenario(ZeroCarbonGridin2050orasStatedinEachState'sTarget)StatedPolicyScenario(ZeroCarbonGridin2035inAllStates)62IndustrialElectrificationinU.S.StatesFigure87.Energycostperunitofproductioninthesoybeanoilindustry3.13.TotalEnergySavingsandCO2EmissionsReductionPotentialThissectionpresentsthetotalenergysavingsandCO2emissionsreductionpotentialsthatcanbeachievedinall20statesfromtheelectrificationof9ofthe12industrialsubsectorsincludedinthisstudy.ThetotalenergysavingsandCO2emissionsreductionpresentedinthissectiondonotincludetheammonia,methanol,andplasticrecyclingindustries.Ammoniaandmethanolarenotincludedbecausetheelectrificationimpactsarearesultofelectrifyinghydrogen,whichisafeedstock,notanenergysource,throughelectrolysis.Inthemethanolindustry,theswitchfromnaturalgas-basedhydrogenproductiontoelectrolysis-basedhydrogenproductionresultsinasubstantialincreaseinfinalenergyuse,whichballoonsthetotalenergyandCO2results.Becausehydrogenisafeedstock,thislargeenergychangeimpactsthestudy’sabilitytoproduceatrueapples-to-appleselectrificationeffectscomparison.Plasticrecyclingisexcludedbecausethestudycomparesmechanicalelectrifiedplasticrecyclingwithtraditionalvirginresinplasticproduction.Theenergysavingsoftherecycledprocessaregreatenoughincomparisontothetraditionalprocess,thattheimpactofelectrificationaloneisdwarfed,impactingthecomparabilityofthefinalresultsacrossindustries.Figure88showsthatelectrificationwillsignificantlyreduceindustrialtotalfinalenergyuseinallstatesstudied.Indiana,Ohio,Illinois,Iowa,andMichiganarethestateswiththelargestenergysavingspotentialsfromelectrifyingnineindustriesincludedinthisstudy(excludingammonia,methanol,andplasticrecyclingindustriesforthereasonsexplainedabove).Forcontext,every10,000TJofenergycanpoweraround260,000U.S.householdsperyear.020406080100120140160CaliforniaFloridaMichiganWisconsinMinnesotaColoradoIndianaPennsylvaniaIllinoisOregonNorthCarolinaOhioIowaGeorgiaTexasWashingtonAlabamaLouisianaOklahomaKentuckyEnergyCostperUnitofProduction(2021$/ton)2021ConventionalProcess2030ElectrifiedProcess(withEIAElec.PriceForecast)2030ElectrifiedProcess(withLowerREPriceForecast)2050ElectrifiedProcess(withEIAElec.PriceForecast)2050ElectrifiedProcess(withLowerREPriceForecast)63IndustrialElectrificationinU.S.StatesFigure88.Changeinindustrialenergyuseusingelectrifiedprocessesinnineindustriesstudied(Excludesammonia,methanol,andplasticrecyclingindustries,technicalpotentialassuming100%adoptionrate)Figure89showsthechangeinindustrialnetCO2emissionsafterelectrifyingthenineindustriesunderthebaselinescenario,whichassumesfullgriddecarbonizationby2050.ElectrifyingthesenineindustriescouldresultinCO2emissionsreductionin2030inmoststates,andallstatesby2050.Forcontext,reducingannualCO2emissionsby1,000ktisequaltotakingabout217,000internalcombustionenginepassengercarsofftheroad.Figure89.ChangeinindustrialnetCO2emissionsusingelectrifiedprocessesinnineindustriesstudied(excludesammonia,methanol,andplasticrecyclingindustries-baselinescenario,technicalpotentialassuming100%adoptionrate)Figure90showsthechangeinindustrialnetCO2emissionsafterelectrifyingthesenineindustriesunderthestatedpolicyscenario.ThisscenarioshowsasubstantiallyhigherCO2emissionsreductionpotentialinfutureyearsthanthebaselinescenariobecausemorerapidgriddecarbonizationisassumedunderthestatedpolicyscenario.-100,000-90,000-80,000-70,000-60,000-50,000-40,000-30,000-20,000-10,0000IndianaOhioIllinoisPennsylvaniaMichiganIowaCaliforniaMinnesotaGeorgiaWisconsinNorthCarolinaTexasAlabamaColoradoOklahomaFloridaLouisianaWashingtonKentuckyOregonChangeinEnergyUse(TJ/Year)203020402050-30,000-25,000-20,000-15,000-10,000-5,00005,000IndianaOhioIllinoisPennsylvaniaMichiganIowaMinnesotaCaliforniaGeorgiaNorthCarolinaWisconsinAlabamaOklahomaFloridaTexasLouisianaColoradoWashingtonKentuckyOregonChangeinCO2Emissions(ktCO2/Year)20302040205064IndustrialElectrificationinU.S.StatesFigure90.ChangeinindustrialnetCO2emissionsusingelectrifiedprocessesinnineindustriesstudied-statedpolicyscenario(excludesammonia,methanol,andplasticrecyclingindustries,technicalpotentialassuming100%adoptionrate)-30,000-25,000-20,000-15,000-10,000-5,00005,000IndianaOhioIllinoisPennsylvaniaMichiganIowaMinnesotaCaliforniaGeorgiaNorthCarolinaWisconsinAlabamaOklahomaFloridaTexasLouisianaColoradoWashingtonKentuckyOregonChangeinCO2Emissions(ktCO2/Year)20302040205065IndustrialElectrificationinU.S.StatesIndustrialelectrificationhasthepotentialtoreduceemissionsacrossindustrialsubsectorsandaroundthecountry,butaginginfrastructureandcompetingdemandsforrenewableelectricityresourcesposechallengestorealizingthesereductions.AsdiscussedfurtherinChapter6,investingintheelectricitygridwillhelptoaccelerateindustrialelectrificationandcontributetomeetingthenation’semissionsreductiongoals.4.0.TheU.S.ElectricityGridTheU.S.electricitygridisacomplex,interconnectedsystemlinkingbothutility-scaleanddistributedgenerationresourcestocustomerswithvaryingandvariableelectricityneeds.Asoftheendof2020,therewere11,070utility-scale(anameplatecapacityofatleast1MW)electricpowerplantsintheU.S.(EIA2022a).Thecountry’spowersystemalsoincludesnearly160,000milesofhigh-voltagepowerlinesandmillionsoflow-voltagepowerlinesanddistributiontransformers,connecting145millioncustomers(EIA2016).In2021,about4,116billionkilowatt-hours(kWh)ofelectricityweregeneratedatutility-scaleelectricitygenerationfacilitiesfromavarietyofresourcesandtechnologies:about61%wasfromfossilfuels,about19%wasfromnuclear,andabout20%wasfromrenewables(EIA2022b).Electricitygenerationfromrenewableresourceshasincreasedovertime,whilecoalusehasdeclinedinrecentyears.Majorfactorsthathavecontributedtochangesinthegenerationmixincludelowernaturalgasprices,staterequirementstousemorerenewableresources,financialincentivesforbuildingnewrenewablegenerationcapacity,federalairpollutionemissionregulationsforpowerplants,andslowingelectricitydemand(EIA2021a).Managingthegrid’sresources,infrastructure,andenergyflowsisaconsiderableundertaking.Trendstowardsdistributedenergygeneration,renewableelectricity,andelectrification,aswellasdealingwithaginginfrastructureandmorefrequentsevereweatherimpacts,increasegridmanagementcomplexity.Majorinfrastructureupgradesareneededtoreliablyincorpo-ratenewtechnologiesandsystems,changingmarketdynamics,andshiftingconsumerpreferences(NCSL2021).Additionalpressurewillbeplacedonanalreadystrainedgridsystemasmultiplesectors,includingtransportationandbuildingsinadditiontoindustry,movetoelectrifytoaccessrenewableresourcesandreducetheiremissions.Todeliverelectrifica-tionatscale,investmentwillbeneededtobuildorupgradekeyinfrastructure,includingelectricityproduction,energytransmission,anddistributionnetworks,andend-userinfrastructure(IRENA2019,13).High-capacitylong-distancetransmissionlinescanbedesignedandbuiltrapidlyenoughtoensuretransmissiongridcapacitydoesnotcauseadelayinelectrification,butdisputesaroundplanning,design,andbuildingpowerlineshavethepotentialtocausedelays(ETC2018,136).AsdiscussedfurtherinChapter6,engagingcommunitiesearlyintheprocesscanamelioratedelaysandofferopportunitiestoconsiderandaddressenvironmentalandenergyjusticeconcernsattheoutset.Whilegridupgradesandreinforcementcanbedoneonashortertimeframeanddonottypicallyprovidethesameoppositionaslong-distancetransmissionprojects,ifsignificantreinforcementisrequiredinmanypartsofthenetworksimultaneously,thiscouldcreatebottlenecksinprojectmanagementandconstructioncapacity(ETC2018).4IndustrialElectrification’sImpactontheElectricityGrid66IndustrialElectrificationinU.S.StatesDevelopingacoherentpowerstrategyisessentialtoacceleratethepaceofpowerdecarbon-ization,planfortheelectrificationofabroadersetofeconomicsectors,andanticipaterelatedpowergridinvestmentneeds(ETC2018).TheU.S.’slong-termstrategytoachieveecono-my-widenet-zeroemissionsby2050notesthatgridinfrastructureinvestments–includingbuildingoutnewlong-distance,high-voltagetransmissionprojects–canenhanceresilience,improvereliability,betterintegratevariablegenerationresources,lowerelectricitycosts,andconnectcleanenergyresourcestodemandcenters(State/EOP2021).4.1.IndustrialElectrification’sElectricityGridImpactsTheanalysisresultsclearlyshowthatin11oftheindustrialsectorsstudied,electrificationresultsinareductioninthetotalannualfinalenergyuse.Theexceptionismethanolproductionelectrification,whereanelectrolysisprocessproduceshydrogenandincreasestheannualenergyuse.Whileelectrificationdecreasesnetfinalenergydemand,electricitydemandincreases.Figure91showsthatelectrifyingnineindustries;excludingammonia,methanol,andplasticrecyclingasexplainedinChapter3.13;resultsinanincreaseinannualelectricityconsumptionin2030(GWh/year).Thistranslatesintoanincreaseinelectricityloadafterindustrialelectrificationin2030(MW),asshowninFigure92.Forexample,tofullyelectrifythenineofthetwelveindustries(excludingammonia,methanol,andplasticrecyclingforreasonsmentionedinChapter3.14)includedinthisstudywiththeprocessesdescribedinthisreport,Indianawillneedanadditional23.7GW,Texasanadditional1.3GW,andCaliforniaanadditional2GWofpowergenerationcapacityin2050.Forcomparison,in2021,theU.S.hadaround1,200GWofpowergenerationcapacity.Toestimatetheseadditionalloads,weassumedalltheadditionalloadiscomingfromcleanrenewableenergysources.Wefurtherassumedthatthattwo-thirdofthisadditionalloadiscomingfromsolarpowerandone-thirdfromwindpower.Utilities,policymakers,industry,andotherstakeholdersshouldpayattentiontothispotentialincreaseddemandforrenewableelectricity,andtheassociatedneedformorerenewableelectricitygeneration,additionalenergystorage,demandresponseprograms,transmissionanddistributionsystemexpansion,andgridmodernization.Asnotedabove,multiplesectors,includingtransportationandbuildings,arealsolookingtoincreaseelectrificationasawaytoaccessrenewableenergyresourcesandreducetheiremissions.Ensuringthatsufficientrenewableresourcesarebroughtonlineandconnectedtodemandcenterswillbecriticaltoasmoothenergytransitionandrapidmultisectordecarbonization.Figure91.Increaseinannualelectricityconsumptionafterindustrialelectrificationin2030-2050(GWh/year)(assuming100%adoptionrate)010,00020,00030,00040,00050,00060,000IndianaOhioIllinoisIowaPennsylvaniaMichiganGeorgiaAlabamaWisconsinNorthCarolinaMinnesotaFloridaCaliforniaLouisianaWashingtonTexasOklahomaKentuckyOregonColoradoIncreaseinAnnualElectricityUseAfterElectrifcation(GWh/Year)20302040205067IndustrialElectrificationinU.S.StatesFigure92.Increaseinelectricityloadafterindustrialelectrificationin2030,2040,and2050(MW)(assuming100%adoptionrate)05,00010,00015,00020,00025,000IndianaOhioIllinoisIowaPennsylvaniaMichiganGeorgiaAlabamaWisconsinNorthCarolinaMinnesotaFloridaCaliforniaLouisianaWashingtonTexasOklahomaKentuckyOregonColoradoIncreaseinElectricityLoadAfterElectrifcation(MW)20302040205068IndustrialElectrificationinU.S.StatesIndustrialelectrification,energyefficiencyimprovements,andswitchingtolower-carbonenergysourcescansignificantlydecreaseGHGemissionsandreduceclimatechangeimpacts.Agrowingbodyofresearchhasfoundthatthesemeasurescanalsodirectlymitigatemanynon-climatechangerelatedhumanhealthhazardsandenvironmentaldamage(Williamsetal.2012).5.0.WhatareCo-Benefits?Co-benefitsaremosteasilyunderstoodasthebenefitsthataccruefromtheimplementationofaprogramorpolicythatareinadditiontotheprogramorpolicy’sprimaryobjective.TheIntergovernmentalPanelonClimateChange(IPCC)definesco-benefitsas,“thebenefitsofpoliciesthatareimplementedforvariousreasonsatthesametime–includingclimatechangemitigation–acknowledgingthatmostpoliciesaddressingGHGmitigationhaveother...equallyimportantrationales”(Metzetal.2001).Othersincreasethescopeofco-benefitstoincludeotherpolicymeasures,definingco-benefitsas,“thosederivedfromtheintentionaldecisiontoaddressairpollution,energydemand,andclimatechangeinanintegratedmanner,butalsoconsiderstheotherunspecifiedbenefitsthatmayarisesuchasimprovedtransportandurbanplanning,reducedhealthandagriculturalimpacts,improvedeconomyorreducedoverallpolicyimplementationcost”(Castilloetal.2007).Manystudiesgroupco-benefitswithinfourbroadcategoriesofimpactedsystems:health,ecological,economic,andsocialco-benefits(Davisetal.2000).Co-benefitscanalsobecategorizedbytheparticularendpointimpacted,forexample,theIPCC’sFourthAssessmentReportseparatesindustrialGHGemissionsmitigationstrategyco-benefitsasthoseaffectinghumanhealth,emissions,waste,production,operationsandmaintenance,workingenvironment,and“other”(Metzetal.2007).Exampleco-benefitsthatfallintoeachcategoryareprovidedinTable17.Table17.Co-benefitsofenergyefficiencyanddecarbonizationpoliciesandprograms(Metzetal.2007)Categoryofco-benefitExamplesHealthReducedmedical/hospitalvisits,reducedlostworkingdays,reducedacuteandchronicrespiratorysymptoms,reducedasthmaattacks,increasedlifeexpectancy.EmissionsReductionofdust,carbonmonoxide(CO),CO2,nitrousoxides(NOx)andsulfurdioxide(SO2);reducedenvironmentalcompliancecosts.WasteReduceduseofprimarymaterials;reductionofwastewater,hazardouswaste,wastematerials;reducedwastedisposalcosts;useofwastefuels,heatandgas.ProductionIncreasedyield;improvedproductqualityorpurity;improvedequipmentperformanceandcapacityutilization;reducedprocesscycletimes;increasedproductionreliability;increasedcustomersatisfaction.Operation&maintenanceReducedwearonequipment;increasedfacilityreliability;reducedneedforengineeringcontrols;lowercoolingrequirements;lowerlaborrequirements.WorkingenvironmentImprovedlighting,temperaturecontrolandairquality;reducednoiselevels;reducedneedforpersonalprotectiveequipment;increasedworkersafety.OtherDecreasedliability;improvedpublicimage;delayedorreducedcapitalexpenditures;creationofadditionalspace;improvedworkermorale.5IndustrialElectrificationCo-Benefits69IndustrialElectrificationinU.S.StatesInadditiontohumanhealth,agriculturallandarea,andecosystemservicesimpacts,reducedairpollutionabatementcosts,employmentimpacts,andchangesinthepriceofprimaryproductioninputssuchasfuelsandrawmaterialcanbeconsideredindustrialelectrificationanddecarbonizationco-benefits.5.1.ImprovingAirQualityandHealthOutcomesTheU.S.hasalreadyseenhowimprovingairqualitycanresultinnumerousco-benefits.Since1970,CleanAirAct(CAA)programshaveloweredlevelsofnumerouspollutants,leadingtodramaticimprovementsinairqualityandachievingsignificantpublichealthbenefits.Lowerairpollutionlevelsalsomeanlessdamagetoecosystemhealth,includingplantsandanimals,andcropandtimberyieldimprovements(EPA2022).Whileairqualityimprovementprogramshaveassociatedcosts,theseareoutweighedbysignificantbenefits.TheEPAhasfoundthatCAAprogramsyielddirectbenefitstotheAmericanpublicthatvastlyexceedcompliancecosts.Inadditiontodirectbenefitsexceedingdirectcosts,economicwelfareandeconomicgrowthratesimprovedbecausecleanerairresultsinfewerair-pollution-relatedillnesses,requiringlessmoneyspentonmedicaltreatmentsandlowerabsenteeismamongworkers(EPA2022).Thoughtheseprogramshavebeensuccessful,thereisstillworktobedone.In2017,airpollutionwasassociatedwithabout100,000annualprematuredeathsintheU.S.andhasbeenlinkedtomyriadnegativehealthimpacts(Liuetal.2021).Moreover,whileairqualityhasimprovedintheU.S.overthepastseveraldecades,peopleofcolor,particularlyBlackandHispanicAmericans,arestillexposedtohigher-than-averagelevelsofairpollution(Laneetal.2022).5.2.ControllingCostsIndustrialelectrificationcanreduceairpollutionabatementcosts.Someenergy-andcarbon-intensiveindustrialplantsmustinstallairpollutioncontroltechnologiestoreducetheircriteriaairpollutantemissions(suchasPM,SOx,andNOx)toalignwithregulatoryairemissionsstandards.Theseairpollutioncontroltechnologiescouldcostmillionsofdollarstoinstallandhavehighoperatingandmaintenancecosts.Inaddition,industrialplantssometimeshavetopayadditionalfeesforemissionsreleasedfromtheirfacilities.Switchingindustrialplants’thermalprocessesandheatingsystemsfromfossilfuel-basedtoelectrifiedsystemscanhelptoreduceoreveneliminatethecostofinstallingairpollutioncontroltechnologiesorpayingairpollutionfees.Thiscanresultinsubstantialcostsavingsinbothcapitalcostsandoperatingcostsforindustrialcompanies.Suchindustrialelectrificationco-benefitsshouldbequantifiedforelectrificationprojectsbasedonplant-levelinformationandtakenintoaccountinelectrificationprojectcost-benefitanalyses,asdiscussedfurtherbelow.5.3.EnsuringEquitableRealizationofCo-BenefitsAirpollutionanditsassociatedhealthimpactsarenotequallydistributedbyrace,ethnicity,andincome.Researchhasdocumentedhigher-than-averageairpollutionexposuresforracialandethnicminoritypopulationsandlower-incomepopulationsintheU.S.(Liuetal.2021).Racialandethnicandsocio-economicdisparitiesinairpollutionexposureintheU.S.arewelldocumentedandhavepersisteddespiteoveralldecreasesinPM2.5pollution(Tessumetal.2021).70IndustrialElectrificationinU.S.StatesFrom1990-2010,airpollutionconcentrationsdeclinedandabsoluteracialandethnicexposuredisparitiesalsodeclined.However,in2010,racialandethnicexposuredisparitiesformultiplepollutantsremainedacrossincomelevels,inurbanandruralareas,andinallstates(Liuetal.2021).Thecausesofsystemicracial/ethnicairpollutionexposuredisparitiesarecomplexandrootedinpartinhistoricalpatternsofexclusionanddiscrimination,includinginpolicymaking,investment,andlandusedecisions.(Laneetal.2022).Nearlyallmajoremissionsourcesectors,includingindustry,disproportionatelyaffectpeopleofcolor(Tessumetal.2021).Infrastructureandlandusedecisionsmademanyyearsagocontinuetoshapepresent-dayspatialdistributionsofpollutionsources:thelocationsofemittinginfrastructure,includingindustrialfacilities,aretypicallylong-lived(Laneetal.2022).Industrialelectrificationoffersanopportunitytoimproveuponhistoricalandsystemicwrongsthathavenegativelyimpactedcommunitiesofcolor.Industrialelectrificationthatreducesfossilfueluseinindustrialplantsalsolowersoreliminatescriteriaairpollutants,helpingtoimprovethehealthandqualityoflifeincommunitieslivingclosetotheindustrialplants.But,itisalsocriticaltoengagelocalcommunitiesthatwillbeimpactedbychangestoindustrialinfrastructure,includingancillaryinfrastructuresuchastransmissionanddistributionlinesandequipmentandrenewablegenerationandenergystorageresources.Structuralinequalitycanlimittheeffectivenessofparticipatoryandconsultativeapproaches,improvingproceduraljusticethroughbetterpublicparticipationandengagementindecision-makingprocessescanensurethatcommunityvoicesareheardandallowinfrastruc-turedeveloperstoaddresscommunityconcerns(Hess,McKane,andPietzryk2021).Thosedeployingelectrificationtechnologiesandrelatedinfrastructurecantakecuesfromthefederalgovernment’sJustice40Initiative,aplantodeliver40%oftheoverallbenefitsofclimateinvestmentstodisadvantagedcommunities(OMB2021).Allactors,whetherornottheyaresubjecttotheInitiative,canlooktothefederalguidancetomaximizebenefitstodisadvantagedcommunities.Forexample,thosedeployinginfrastructurecan:•Avoidpotentialburdenstodisadvantagedcommunities;•Inevaluatingprojectproposals,considerwhetherproposalsincludecommunityengagement,planning,andfeedback;•Applycostsavingsfromprojectimplementationtobenefitdisadvantagedcommuni-ties,forexamplebyreinvestingsavingsinthelocalcommunitytopromoteworkforcedevelopmentandcommunityhealth;•Supporttechnicalassistanceandcapacitybuildingwithincommunities;and•Fosterjobtraining.AdditionalrecommendationsforcommunityengagementcanbefoundinChapter6.5.4.AnalyzingNear-termBenefitsReducingemissionsandthusimprovingairqualitycanresultinnear-term,nationwidebenefits,includingimprovedhumanhealth,laborproductivity,andcropyieldbenefits,andadditionalbenefitsfromreducedheatexposureincreasearound2060(Shindelletal.2021).However,climatechangemitigationpoliciesareoftenframedasglobal,long-term,andsubjecttouncertainties.Increasingtheemphasisonthelocalized,near-term,airquality-relatedbenefitsofreducingemissionscouldhelptoeliminatethemismatchbetweentheperceptionofclimateasafutureriskandtheneedtoactquicklynowtomitigatelong-termclimatechange(Shindelletal.2021).71IndustrialElectrificationinU.S.StatesManyclimatepoliciesandprograms,includingforindustrialelectrificationanddecarboniza-tion,attimesfacepoliticalresistance,partiallybecauseitisdifficulttoquantifytheirfullbenefits.Incorporatingco-benefitsintoindustrialelectrificationanddecarbonizationpolicyandprogramanalysismightsignificantlyincreasetheuptakeofthesepolicies.Fasterpolicyuptakeisespeciallyimportantinthisdecadeinviewofnet-zeroGHGemissionstargets.Ongoingdevelopmenteffortsthatdonotconsiderco-benefitsmaylockinsuboptimaltechnologiesandinfrastructureandresultinhighcostsinfutureyears.Overthepasttwodecades,studieshaverepeatedlydocumentedthatnon-climatechangerelatedenergyefficiencyanddecarbonizationbenefitsthatresultfromGHGmitigationstrategiescanbevaluedfrombetween30%toover100%ofthecostsofsuchpoliciesandprogramsstrategies(Williamsetal.2012).Monetizedbenefitsfromairqualityimprovementsandreducedheatexposureareinthetensoftrillionsofdollarsforavoideddeathsandtensofbillionsforlaborproductivity,cropyieldincreasesandreducedhospitalexpenditures(Shindelletal.2021).PolicymakersaroundtheworldareincreasinglyinterestedinincludingbothGHGandnon-GHGimpactsinanalysesofindustrialelectrification,energyefficiency,anddecarbonizationpoliciesandprograms.Identifyingalltherelevantco-benefitsisahighpriorityforco-benefitstudiesasmanypolicies,especiallyindevelopedcountries,areexplicitlydrivenbyacost-optimizationrequirementtoarriveatthe“best”emissionslevelconsideringallcostsandallbenefits.Includingadditionalmonetaryandnon-monetaryco-benefitsallowspolicymakerstoincreasethestringencyofandresourcestotheirprogramsandreapconsiderableadministrativeandpublicbenefits(U.S.EPA,2011).72IndustrialElectrificationinU.S.StatesElectrifyingindustrialprocessesproducesnumerousbenefitsincludingreducedenergydemandandemissions.However,barriersstillinhibitelectrifiedtechnologies’developmentanddeployment,asdescribedinourpreviousreport(Hasanbeigietal.2021).Thischapterrecommendsthesixmostimpactfulchangesthatwouldsupportincreasedindustrialelectrification.Thesechangeswillrequirenumerousactorstoworktogethertosolvesignificantchallengesinrenewableelectricitygenerationandtransmission,technologydevelopmentanddeployment,andworkforcedevelopment.1.IncreaseRenewableElectricityGenerationCapacityAdditionalrenewableelectricitygenerationresourcesareneededtomaximizeemissionsreductionsfromindustrialelectrification.Ensuringthatrenewableelectricityisusedwhenelectrifyingindustrialprocesseswillallowtheemissionsreductionspotentialsdescribedinthisreporttobeachieved.Astheindustrial,transportation,andbuildingssectorsalllooktoincreaserenewableelectricityuse,significantamountsofrenewableelectricityresourceswillneedtobeconstructed.Stateshavetoolstoencourageadditionalrenewableelectricitygenerationcapacity.Statescanincreasetheirrenewableportfoliostandard(RPS)requirements,requiringincreasingpercentagesofelectricitytocomefromrenewableresources.Incentivizingdistributedrenewablegenerationresourcesatindustrialsiteswouldalsoincreaserenewablecapacityandhavethebenefitofbeinggeneratedclosetowhereitisconsumed,reducingtheneedforadditionaltransmissionanddistributioncapacity.Statescanalsosupportutility-scalerenewablegenerationprojectstoincreasecapacityandworktowardsazero-carbonelectricitygridmix.Inaddition,ensuringthatstatesitingandpermittingprocessesallowadditionalprojectstobeconstructedwillincreasecapacity.Utilitieswillalsoneedtoensurethatrenewableresourcesareabletoconnecttothetransmissionanddistributionsystem.Interconnectionofsignificantadditionalgenerationresourceswillrequiregridupgrades,asdiscussedfurtherbelow.Itisalsocriticaltoengagecommunitieswhererenewableenergygenerationresourceswillbelocatedandcommunitiesthatmaybeimpactedinotherways,suchaspreservationofandaccesstoculturalresources.Furtherrecommendationsaroundcommunityengagementareofferedinrecommendation3,below.2.EnhancetheElectricityGridAsnotedabove,theindustrial,transportation,andbuildingssectorsareallworkingtoincreaserenewableelectricityuse,requiringsignificantamountsofrenewableelectricityresourcestobeaddedtotheresourcemix.Thisincreaseddemandacrosssectorswillrequirenotonlyadditionalrenewableelectricitysupply,butalsoanelectrictransmissionanddistribution(T&D)systemthatcanadequatelymanagetheincreasedenergyvolume.Statescanworkinregionalcollaborations,includingwiththeirindependentsystemoperators(ISOs)orregionaltransmissionorganizations(RTOs),toaddressT&Dinadequaciesataregionallevel.States,throughtheirpublicutilitycommissionsandwithelectricutilities,willneedtoexaminetheimpactofincreasedelectricdemandonthesystemasawhole.Newandupgradedequipmentwillbeneededtomeettheincreasingdemand.6RecommendationstoAccelerateIndustrialElectrification73IndustrialElectrificationinU.S.StatesGiventheincreaseinsevereweathereventsthatresultfromclimatechange,theelectrici-tygridwillalsoneedtobehardenedtoensureitsresilienceandreliableelectricityservice.Resiliencymeasureswilldependonlocalconditions–appropriatehardeningeffortswilllikelybedifferentincoastalcommunitiesthantheyareinregionsthatreceivesignificantamountsofsnowandice,andurbanandruralareasmayfinddifferentapproachesmosteffective.Interstatetransmissionupgradesmayrequirefederalactiontomaketransmissionsitingandpermittingreforms.Itwillbenecessaryforpowertoflowseamlesslyfromonepartofthecountrytoanother,bringingrenewableelectricityfromwhereitisgenerated,frequentlyinmoreruralareasinthemiddleofthecountry,towhereitwillbeconsumedbyindustrialcustomers,manyofwhicharelocatedalongthecoastsandinmoredenselypopulatedareas.Thewholesalemarket’soperationmayalsorequirefederalinterventiontoensurethattransactionsaresimple.Forgridupgradestoo,itiscriticaltoengagecommunitieswhereneworupgradedequipmentwillbelocatedorwhereitsimpactswillbefelt.FurtherrecommendationsaroundcommunityengagementareofferedinRecommendation3,below.3.EngagecommunitiesAsnotedinRecommendations1and2,above,projectdevelopersmustengagecommunitiesthatwillbeimpactedbyindustrialelectrificationandchangestoindustrialinfrastructure,includingancillaryinfrastructuresuchastransmissionanddistributionlinesandequipmentandrenewablegenerationandenergystorageresources.Projectdevelopersshouldseekoutandencouragecommunityparticipationearlyoninplanningprocesses.Projectdevelopersshouldrecognizethehistoricalcontextofindustrialfacilitylocationsandhowpoorairqualityandothernegativeenvironmentalimpactshaveandcontinuestodisproportionatelyaffectcommunitiesofcolor.Developersshouldalsoconsiderhowtheirprojectscanensurethepreservationofandaccesstocommunities’culturalresources.Whenengagingcommunities,projectdevelopersshouldconsidertheenvironmentalandenergyjusticeconcernsofthecommunitiesandlookforopportunitiestoreversehistoricalandsystemicwrongsincludingracial,ethnic,andsocioeconomicdisparitiesinaccesstocleanenergyresources,accesstoeducationandwell-paidjobs,disparatehealthimpactsfrompollution,andpreservationofandaccesstoculturalresources.AsnotedinChapter5,structuralinequalitycanlimittheeffectivenessofparticipatoryandconsultativeapproaches.Projectdevelopersshouldworktoimproveproceduraljusticethroughbetterpublicparticipationandengagementindecision-makingprocesses.Develop-ersmustensurethatcommunityvoicesareheardandaddresscommunityconcerns.4.SupportdemonstrationofemergingelectrificationtechnologiesandnewapplicationsofexistingtechnologiesWhilestatesmaynotconducttheirownelectrificationtechnologyresearchanddevelopment,theycansupporttechnologydemonstrationanddeployment.Statescancreatetheirownpilotprojectsorincentiveprogramstofurtherelectrificationtechnologies.Inaddition,statescanlookforopportunitiestoaccessfederalresourcestosupportindustrialelectrification.Forexample,the2021InfrastructureInvestmentandJobsAct74IndustrialElectrificationinU.S.Statesappropriates$500milliontotheIndustrialEmissionsReductionTechnologyDevelopmentProgramforgrants,contracts,cooperativeagreements,anddemonstrationprojectsfocusedonemissionsreductionsforheavyindustryachievedthroughalternativepathwaystoheatgeneration,includingelectrification.Statescanaccesstheseresourcesorsupportmanufactur-ersinapplyingforfundsdirectly.Manyofthetechnologiesincludedinthisreportarecommerciallyavailableandreadyfordeployment.Incaseswherean“offtheshelf”solutionisnotpossible,industrialcompaniescanworkwithoriginalequipmentmanufacturerstofurtherdevelopandrefineelectrifiedtechnologiesthatmeettheirspecificprocessandapplicationrequirements.Thiscanbesupportedthroughavailablefederalfundingandaccesstothisfundingcanbesupportedbystategovernments.5.FinanciallyincentivizeelectrificationEnergypricescanvarysignificantlyfromstatetostateorevenfromcountytocounty.Comparisonsofthecostperunitofproductionarehighlysensitivetounitpriceofenergy.EIAprojectsthatelectricitypricesin2050willbesomewhathigherthantheyaretoday.However,itisanticipatedthatrenewableelectricitypriceswillcontinuetodecline,andmaydeclinefasterthanpredicted.Thiswouldmakeelectrificationtechnologiesmorecompetitivewithconventionalfossilfuel-basedtechnologies.Therefore,thisanalysisconsiderscostsofelectrificationusingboththeEIA-forecastedpricesaswellasprices50%lower.Inaddition,naturalgasandotherfossilfuelpricesmayincreasemorethanprojected,especiallyifacarbonpricingpolicyisintroducedintheU.S.Suchconsiderationswerenotincludedinthisstudy,butcouldalsomakeelectrificationtechnologiesmorecompetitive.Energycostisonlyasmallportionoftotalmanufacturingcostformostindustrialsubsectors,exceptforindustriessuchasthecementandsteelindustrieswhereenergyaccountsfor30%-40%oftotalmanufacturingcost.Insectorswhereenergycostisonlyasmallportionofproductioncost,asmallorevenmoderateincreaseinenergycostperunitofproductresultingfromelectrificationwillhaveaminimalimpactonthepriceoffinalproduct.Therefore,itwillhaveminimalimpactinthepricethatfinalconsumerswillpayfortheproductorproductsmadefromthosematerials.However,itshouldbenotedthatenergy-intensiveindustriesruntypicallyatlowmargins,operateinaverycompetitiveglobalmarket,andhencecanbesen-sitiveincreasesinenergycosts.Therefore,appropriatepolicymeasuresshouldbeinplacetoaddressthisissue.Statesandmanufacturersmaybeabletoreducecosts,especiallyforpilotordemonstrationprojects,byaccessingfederalfinancial,technical,orprogramsupport.Statesmayalsoimplementtheirownpoliciesandprogramsaimedatreducingcostsassociatedwithelectrificationtechnologyadoption.Suchpoliciescouldincludetaxincentives,reducedpermittingcosts,orrate-basedutilityinfrastructureupgradecosts.Grantsforswitchingtoelectrifiedtechnologieswouldreducemanufacturers’upfrontcosts,incentivizingchanges.Grantscouldbemadeforpilotprojectstoencourageearlyadoptionanddemonstratesuccess.Thewayutilityratesarestructuredcanalsoincentivizeelectrification.Electricityratesandratemakingvaryacrossstates,soindividualizedapproachesappropriatetoeachstatewouldbeneeded.75IndustrialElectrificationinU.S.StatesFinally,financiersrequireadditionalinformationaboutelectrificationtechnologiesandtheirbenefits.Thosethatcouldprovidefinancingforelectrifiedtechnologiesmaynotbeawareofindustrialelectrification’sbenefitsorcompanies’orinterestinpursuingitasawaytoreduceenergyuseandemissions.Betterunderstandingindustrialelectrificationtechnologies’capabilitiesandtheneedforadditionalinvestmentandsupportcanimproveinvestmentdecisions.6.DeveloptheworkforceEmployeesandcontractorsatindustrialfacilitiesmayrequiretrainingonnewtechnologiesandtheirinstallation,operation,andmaintenance.Statescanutilizetheireducationalprogramsinhighschools,technicalschools,communitycolleges,anduniversitiestoprovidetrainingoncurrentelectrifiedtechnologiesandensurethatthefutureworkforceisreadytodevelopthenextgenerationoftechnologies.Statesshouldlookacrosstheiragenciesandoffices,includingeducation,highereducation,energy,publicutilitycommission,andeconomicdevelopment,toreceiveinputoneducationalprogramdevelopment.Inputfromutilities,tradeassociations,teachers,andstudentswillalsobevaluabletoensuretrainingprogramsaremeetingcurrentandfutureneeds.Thosedevelopingtheworkforceshouldengagewithunderservedcommunitiesandworktogethertodeveloprelevanteducationalandtrainingprogramstoensurethesecommunitiescanequitablyparticipateinthecleanenergyeconomy.76IndustrialElectrificationinU.S.StatesAlabamaPower.(2020).ElectricBoilers.Availableat:https://www.alabamapower.com/busi-ness/ways-to-save/space-heating/electric-boilers.htmlALDVacuumTechnologies.(2019).PAM(PlasmaArcMeltingFurnace).Availableat:https://www.ald-vt.com/portfolio/engineering/vacuum-metallurgy/plasma-arc-melting-furnace/BeyondZeroEmissions,(2019).ZeroCarbonIndustryPlan:ElectrifyingIndustry.Melbourne,Australia.Bos,M.J.,Kersten,S.R.A.,&Brilman,D.W.F.(2020).Windpowertomethanol:Renewablemethanolproductionusingelectricity,electrolysisofwaterandCO2aircapture.AppliedEnergy,264,114672.BostonMetal.2020.MoltenOxideElectrolysis.Availableathttps://www.bostonmetal.com/Brueske,S.,Kramer,C.,&Fisher,A.(2015).BandwidthStudyonEnergyUseandPotentialEn-ergySavingOpportunitiesinUSPulpandPaperManufacturing.Energetics.Campos,A.(2020).Canevs.BeetSugar:ADifference?Availableat:www.whatsugar.com/post/difference-between-cane-and-beet-sugarCastillo,C.K.,D.C.Sanqui,M.Ajero,andC.Huizenga.(2007).TheCo-benefitsofRespondingtoClimateChange:StatusinAsia.MandaluyongCity,Philippines:CleanAirInitiativeforAsianCities.Conway,J.(2020).TotalnumberofbreweriesintheUnitedStates(2012-2019).Availableat:https://www.statista.com/statistics/224157/total-number-of-breweries-in-the-united-states-since-1990/CornRefinersAssociation(CRA).(2019).IndustryOverview.Availableat:https://corn.org/wp-content/uploads/2020/02/CRA-Industry-Overview-2021-Final.pdfDeason,J.,Wei,M.,Leventis,G.,Smith,S.,Schwartz,L.(2018).ElectrificationofbuildingsandindustryintheUnitedStates:Drivers,barriers,prospects,andpolicyapproaches.Law-renceBerkeleyNationalLaboratoryEnergyAnalysisandEnvironmentalImpactsDivision.https://eta-publications.lbl.gov/sites/default/files/electrification_of_buildings_and_indus-try_final_0.pdfElectricPowerResearchInstitute(EPRI).(2009).ThePotentialtoReduceCO2EmissionsbyExpandingEnd-UseApplicationsofElectricity,EPRI,PaloAlto,CA:2009.1018871.Emissions,B.Z.(2018).ZeroCarbonIndustryPlan:ElectrifyingIndustry.BeyondZeroEmis-sionsInc.:Melbourne,Australia.EncyclopediaBritannica.(2011).Radio-frequencyheating.Availableat:https://www.britannica.com/technology/radio-frequency-heatingEnergyTransitionsCommission(ETC).(2018)MissionPossible:ReachingNet-ZeroCarbonEmissionsFromHarder-to-AbateSectorsbyMid-Century.Availableat:http://www.ener-gy-transitions.org/sites/default/files/ETC_MissionPossible_FullReport.pdf.ExpertMarketResearch(EMR).(2020).GlobalSoybeanOilMarketOutlook.Availableat:www.expertmarketresearch.com/reports/soybean-oil-marketFAO.(2017).FAOyearbook:Forestproducts....FAO.Flournoy,B.(2018).HowDoesanElectricARCFurnaceWork?.Availableat:https://www.hun-ker.com/12608288/how-does-an-electric-arc-furnace-workGarside,M.(2020a).AmmoniaproductionintheUnitedStatesfrom2014to2019.Garside,M.(2020b).GlassIndustry-Statistics&Facts.Garside,M.(2020c).MethanolproductionintheUnitedStatesfrom1990to2019.Statista.References77IndustrialElectrificationinU.S.StatesGarside,M.(2020d).PaperIndustry-Statistics&Facts.Statista.Gervet,B.(2007).Theuseofcrudeoilinplasticmakingcontributestoglobalwarming.Lulea:LuleaUniversityofTechnology.GHElectrotermia.(2011).Heating.GHInductionAtmospheres.(2020).WhatisInductionHeating?.GrandViewResearch.(2019).MethanolMarketSizeWorth.Availableat:www.grandviewre-search.com/industry-analysis/methanol-marketHasanbeigi,Ali;Collison,B.,Kirshbaum,L.,Gardiner,D.(2021).ElectrifyingU.S.Industry:Tech-nologyandProcess-BasedApproachtoDecarbonization.GlobalEfficiencyIntelligence,LLC.andRenewableThermalCollaborative.Hasanbeigi,Ali(2021).GlobalSteelIndustry’sGHGEmissions.GlobalEfficiencyIntelligence,LLC.HeraeusGroup.(2020).UVCuringProcess.Availableat:https://www.heraeus.com/en/hng/light_is_more/how_does_it_work/uv_curing/uv_curing.html#tabs-48256-1Hess,DavidJ.,RachelG.McKane,andCarolinePietzryk.(2021).Endoftheline:environmentaljustice,energyjustice,andoppositiontopowerlines.EnvironmentalPolitics.Hobson,C.,andMárquez,C.(2018).RenewableMethanolReport.Technicalreport.IBISWorld.(2020).GlassProductManufacturingIndustryintheUS-MarketResearchReport.Availableat:www.ibisworld.com/united-states/market-research-reports/glass-prod-uct-manufacturing-industryIEA,(2018a),“Commentary:Cleanandefficientheatforindustry”IEA,(2018b).“Renewableheatpolicies:Deliveringcleanheatsolutionsfortheenergytransi-tion,”InternationalRenewableEnergyAgency(IRENA).(2019).ElectrificationwithRenewables:Drivingthetransformationofenergyservices.Availableat:https://www.irena.org/-/media/Files/IRENA/Agency/Publication/2019/Jan/IRENA_RE-Electrification_SGCC_2019_pre-view.pdf.Irfan,U.(2013).Cleaner,CheaperWaytoMakeSteelUsesElectricity.Sustainability–ScientificAmerican.Jadun,P.,McMillan,C.,Steinberg,D.,Muratori,M.,Vimmerstedt,L.,&Mai,T.(2017).Electrifica-tionfuturesstudy:End-useelectrictechnologycostandperformanceprojectionsthrough2050(No.NREL/TP-6A20-70485).NationalRenewableEnergyLab.(NREL),Golden,CO(UnitedStates).Lane,HaleyM.,etal.(2022).HistoricalRedliningisAssociatedwithPresent-DayAirPollutionDisparitiesinU.S.Cities.EnvironmentalScienceandTechnologyLetters.LawrenceBerkeleyNationalLaboratory(LBNL).(2022a).WindPowerPurchaseAgreement(PPA)Prices.Availableathttps://emp.lbl.gov/wind-power-purchase-agreement-ppa-pricesLawrenceBerkeleyNationalLaboratory(LBNL).(2022b).PVPurchaseAgreement(PPA)Prices.Availableat:https://emp.lbl.gov/pv-ppa-pricesLeblanc,R.(2019).AnOverviewofPlasticRecycling.Availableat:https://www.thebalancesmb.com/an-overview-of-plastic-recycling-4018761LightTechLightSources.(2020).UVCuringApplications.Liu,Jiawen,etal.(2021)DisparitiesinAirPollutionExposureintheUnitedStatesbyRace/Eth-nicityandIncome,1900-2010.EnvironmentalHealthPerspectives.McMillan.(2019).SolarforIndustrialProcessHeatAnalysis.Availableat:https://www.nrel.gov/analysis/solar-industrial-process-heat.htmlMcMillan,C.,Boardman,R.MichaelMcKellar,PiyushSabharwall,MarkRuth,ShannonBragg-Sitton.(2017),GenerationandUseofThermalEnergyintheU.S.IndustrialSectorandOpportunitiestoReduceitsCarbonEmissions.78IndustrialElectrificationinU.S.StatesMetz,B.,O.Davidson,R.Swart,andJ.Pan.(eds.)(2001).IntergovernmentalPanelonClimateChange(IPCC)ThirdAssessmentReport.ClimateChange2001:Mitigation.Cambridge:CambridgeUniversityPress.NationalConferenceofStateLegislatures(NCSL).(2021).ModernizingtheElectricGrid:StateRoleandPolicyOptions.Availableat:https://www.ncsl.org/research/energy/modernizing-the-electric-grid-state-role-and-policy-options.aspx.NaturalResourcesCanada(NRCan).(2020).HeatingandCoolingwithaHeatPump.OfficeofEnergyEfficiency.O’Brien,D.,&Woolverton,M.(2009).RecenttrendsinUSWetanddrycornmillingproduc-tion.AgMRCRenewableNewsletter.OakridgeNationalLaboratory(ORNL).2017.ApplicationofElectrotechnologiesinProcessHeatingSystems—ScopingDocument.OECD/IEA,2014.“HeatingWithoutGlobalWarming:MarketDevelopmentsandPolicyConsid-erationsforRenewableHeat,”OEMTechBrief,(2019).TheAluminumCastingIndustryataGlance:FeaturedDieCastingSec-tion.Availableatchrome-extension://efaidnbmnnnibpcajpcglclefindmkaj/https://cwmdie-cast.com/wp-content/uploads/2020/06/OEMTechBrief45-Aluminum-Die-Casting-Industry.pdfOfficeofManagementandBudget(OMB).(2021).InterimImplementationGuidancefortheJustice40Initiative.M-21-28.RadioFrequencyCo.(2020).GeneralIndustry.Availableat:Rotronic.(2015).MilkPowderProduction.Availableat:https://radiofrequency.com/general-in-dustry/Shindell,Drew,etal.(2021).Temporalandspatialdistributionofhealth,labor,andcropbene-fitsofclimatechangemitigationintheUnitedStates.ProceedingsoftheNationalAcade-myofSciences.Stormont,R.A.(2020).Electrificationofglassproduction.Electroglass,Ltd.,personalcommuni-cation,October2020.Svirchuk,Y.S.(2011).PlasmaArcFurnace.Thermopedia.Availableat:http://www.thermopedia.com/content/1034/Tessum,ChristopherW.,etal.(2021).PM2.5pollutersdisproportionatelyandsystemicallyaffectpeopleofcolorintheUnitedStates.SciencePolicy.TheAluminumAssociation.(2010).U.S.andCanadianfoundryshipmentsofaluminumcasting.Thomasnet.(2019).TopAluminumCastingCompaniesintheUSA.Availableat:www.thomas-net.com/articles/top-suppliers/aluminum-casting-companies-manufacturers.UnitedNationsFrameworkConventiononClimateChange(UNFCCC).(2021).TheUnitedStatesofAmericaNationallyDeterminedContribution.Availableat:https://www4.unfccc.int/sites/ndcstaging/PublishedDocuments/United%20States%20of%20America%20First/United%20States%20NDC%20April%2021%202021%20Final.pdf.U.S.DairyExportCouncil.(2015).WhyU.S.MilkPowder.Availableat:www.thinkusadairy.org/products/milk-powders/why-us-milk-powderU.S.DepartmentofEnergy(U.S.DOE).(2017a).BandwidthStudyonEnergyUseandPotentialEnergySavingsOpportunitiesinU.S.GlassManufacturing.U.S.DepartmentofEnergy(U.S.DOE).(2017b).BandwidthStudyonEnergyUseandPotentialEnergySavingsOpportunitiesinU.S.foodandbeverageManufacturing.U.S.DepartmentofEnergy(U.S.DOE).(2019).ManufacturingEnergyandCarbonFootprint.Availableathttps://www.energy.gov/eere/amo/manufacturing-energy-and-carbon-foot-prints-2014-mecs79IndustrialElectrificationinU.S.StatesU.S.DepartmentofEnergy/EnergyInformationAdministration(U.S.DOE/EIA).(2017a).Manu-facturingenergyconsumptionsurvey,2014.U.S.DepartmentofEnergy/EnergyInformationAdministration(U.S.DOE/EIA).(2017b).UnitedStatesElectricityProfile.U.S.DepartmentofEnergy/EnergyInformationAdministration(U.S.DOE/EIA).(2018).AnnualEnergyOutlook(2018)-Table:EnergyPricesbySectorandSource.U.S.DepartmentofStateandU.S.ExecutiveOfficeofthePresident(State/EOP).(2021).“TheLong-TermStrategyoftheUnitedStates:PathwaystoNet-ZeroGreenhouseGasEmis-sionsby(2050).”Availableat:https://www.whitehouse.gov/wp-content/uploads/2021/10/US-Long-Term-Strategy.pdf.U.S.EnergyInformationAdministration(U.S.DOE/EIA).(2019).Newmethanolplantsexpectedtoincreaseindustrialnaturalgasusethrough(2020).U.S.DepartmentofEnergy/EnergyInformationAdministration(U.S.DOE/EIA).(2021).Manufac-turingenergyconsumptionsurvey,(2018).U.S.EnergyInformationAdministration(EIA).(2016).U.S.electricsystemismadeupofinter-connectionsandbalancingauthorities.Availableat:https://www.eia.gov/todayinener-gy/detail.php?id=27152.U.S.EnergyInformationAdministration(EIA).(2021a).Electricityexplained:Electricitygenera-tion,capacity,andsalesintheUnitedStates.LastupdatedMarch18,2021.Availableat:https://www.eia.gov/energyexplained/electricity/electricity-in-the-us-generation-ca-pacity-and-sales.php.U.S.EnergyInformationAdministration(U.S.DOE/EIA).(2021).StateEnergyDataSystem(SEDS).U.S.EnergyInformationAdministration(EIA).(2022a).HowmanypowerplantsarethereintheUnitedStates?LastaccessedMarch14,(2022).Availableat:https://www.eia.gov/tools/faqs/faq.php?id=65&t=2.U.S.EnergyInformationAdministration(EIA).(2022b).WhatisU.S.electricitygenerationbyenergysource?LastupdatedMarch4,(2022).Availableat:https://www.eia.gov/tools/faqs/faq.php?id=427&t=2U.S.EnvironmentalProtectionAgency(EPA).(2011).AssessingtheMultipleBenefitsofCleanEnergy:aresourcesforstates.EPA-430-R-11-014,Washington,D.C.:U.S.EPA.U.S.EnvironmentalProtectionAgency(EPA).(2017).FactsandFiguresaboutMaterials,WasteandRecycling:Plastics:Material-SpecificData.U.S.EnvironmentalProtectionAgency(EPA).(2022).ProgressCleaningtheAirandImprovingPeople’sHealth.LastaccessedMarch13,(2022).Availableat:https://www.epa.gov/clean-air-act-overview/progress-cleaning-air-and-improving-peoples-health.U.S.GeologicalSurvey(USGS).(2020).MineralCommoditySummaries:IronandSteel.Venkat,P.(2016).RJIntroductiontoAmmoniaProductionAIChE.CEPMagazine,69,75.Williams,Christopher;Hasanbeigi,Ali;Wu,Grace;Price,Lynn.(2012).InternationalExperienceswithMeasuringandQuantifyingtheCo-BenefitsofEnergyEfficiencyandGreenhouseGasMitigationPoliciesandPrograms.Berkeley,CA:LawrenceBerkeleyNationalLabora-tory.LBNL-5924E.80IndustrialElectrificationinU.S.StatesAppendix1.IndustrialElectrificationTechnologiesThisappendixprovidesabriefdescriptionofsomeofthemainelectrificationtechnologiesapplicabletotheindustrialsector.Moredetailedinformationabouttheseelectrificationtechnologiescanbefoundinthereferencescitedwithinthetext.Whilemanyoftheelectrictechnologiesneededforelectrificationinindustryarefullycommercialized,someareatthedevelopmentorpilotstage,especiallyforhigh-temperatureprocesses.Furtherinvestmentinresearchanddevelopment(R&D)isneeded,particularlytoaddresssomeofthehigh-temperatureheatingprocessesusedincement,glass,andsomechemicalproduction.ElectricBoilerElectricboilerstypicallyutilizeelectricpoweredresistiveheatingelementsthathelpconvertelectricityintoheat.Theflowofelectriccurrentandthein-turnheatingarecontrolledbyathermostat.Thegeneratedheatcanbeutilizedforpurposessuchasprovidinghotwaterforheatingsystemsorgeneratingsteamforindustrialprocesses(AlabamaPower,2020).Largerelectricboilersaretypicallyelectrodeboilers(jettype)thatuseelectricityflowingthroughstreamsofwatertocreatesteam.Akeybenefitassociatedwithelectricboilersisthattheyareabletoconvertelectricityintoheatwithanefficiencyofalmost100%,withminimalradiationlossesobservedfromexposedboilersurfaces(AlabamaPower,2020).Onaverage,thecapitalcostofanelectricboilerisnearly40%lessthanthatofanequivalentnaturalgas-firedboiler(Jadunetal.,2017).HeatPumpHeatpumpsaredevicesthatextractandtransferheatfromoneplacetoanother.Commonexamplesofthistechnologyincluderefrigeratorsandairconditioners.Insideaheatpump,arefrigerantiscycledacrosstwoheatexchangercoils.Inthefirstcoil,itundergoesevaporationbygatheringheatfromitssurroundingsandinthesecondcoil,therefrigerantiscondensed,leadingtothereleaseofabsorbedheat(NRCan,2020).Thetechnologyoffersahighcoefficientofperformance(COP)andhasthepotentialtosavecoststhroughthereplacementofgas-firedheatingprocesses(BeyondZeroEmissions,2018).ElectricArcFurnaceElectricarcfurnacesmeltmetalsviadirectandradiantheating,generatedbymeansofelectricitythatjumpsfromtheenergizedtothegrounded(neutral)electrode,resultinginhighvoltageelectricarcs(Flournoy,2018).Thesefurnacesaremostcommonlyutilizedformeltingsteelforrecycling,producingalmost30%oftheworld’ssteeloutput.Theyutilizesubstantiallylowerenergycomparedtoprimarysteelproductionusingblastfurnace-basicoxygenfurnace(BeyondZeroEmissions,2018).InductionHeatingInductionheatingoccursbyplacingthematerialthatneedstobeheatedinsideanelectromagneticfieldgeneratedbypassingelectricitythroughaconductororcoil.Theelectromagneticfieldhelpsheatthematerialbyinducingcirculatingelectriccurrentswithinthematerial(GHInductionAtmospheres,2020).Theprocessisutilizedforawiderangeofapplicationsincludingmetalhardening,soldering,andannealing.Someoftheadvantagesofthistechnologyare:enhancedprocessefficiency,uniformandpreciseheating,andnoon-siteemissions(GHElectrotermia,2011;Britannica,2011).Appendices81IndustrialElectrificationinU.S.StatesRadio-frequencyHeatingRadio-frequencyheatingisaformofdielectricheatingwithsystemsoperatinginthe10-30MHzfrequencyand10-30meterswavelengthranges.Theprocessworksbyagitatingthemoleculesofthematerial,resultinginthegenerationofheatwithinthematerial.Sincetheentirethicknessofthematerialisheatedsimultaneously,theprocessoffersuniformheatingatlowtemperatures(RadioFrequencyCo,2020).Thistechniqueworkswellwithmaterialsthatarepoorconductorsofheatandelectricityduetoitsgreaterdepthofpenetrationandismuchmoreefficientthanconventionalheatingprocesses(BeyondZeroEmissions,2018).ElectricInfraredHeaterElectricinfraredheatersoperatethroughtheconversionofelectricityintoradiantheat.Theprocessinvolvesthedirectheatingoftheobjectinsteadofheatingtheairinbetween,thusensuringtheefficienttransferofheat(Herschel,2020).Thesesystemscanbedesignedwithtemperaturerequirementsandthetargetmaterial’sabilitytoabsorbinfraredradiationinmind.Thetechnologyoffersnumerousadvantages,includinghighoverallefficiency,fasterresponsetimethangasconvectionsystems,lowcost,andminimalmaintenanceeffort(BeyondZeroEmissions,2018).Ultra-violet(UV)HeatingUVradiationisprimarilyutilizedfortheefficientcuringofcoatingssuchaspaints,inksandadhesives.TheprocessworksbyexposingUVformulations(inks,coatingsoradhesivescontainingasmallproportionofphotoinitiators)toUVradiation,resultingintheirinstantcuring.SomeadvantagesoftheUVcuringprocessincludeimprovedresistancetoabrasion,fasterproductionspeeds,lowenergyintensity,andreductioninprocessingtimes(HeraeusGroup,2020).Thetechnologyisutilizedforvariousapplicationssuchasadhesivebonding,generalelectronics,packaging,semiconductors,andcoatings(LightTech,2020).MicrowaveHeatingMicrowaveheatingisaformofdielectricheatingwithsystemsoperatinginthe900-3000MHzfrequencyand10-30centimeterswavelengthranges.Theprocessworksbyagitatingthemoleculesofthematerial,resultinginthegenerationofheatwithinthematerial(BeyondZeroEmissions,2018).Thisprocessisutilizedforawidevarietyofindustrialapplications,includingsimpleheating,drying,anddefrosting.Itisespeciallyusefulforheatingproductsormaterialswithpoorthermalconductivity,largevolumeandsmallsurfacearea,andhighsensitivitytolargesurfaceandbulktemperaturedifferentials(MKS,2014).FigureA.1.showssomeofthecharacteristicsofelectromagneticheatingtechnologies.FigureA.1.Electromagneticheatingtechnologies(BeyondZeroEmissions,2018)82IndustrialElectrificationinU.S.StatesElectricInductionMeltingTheworkingprinciplebehindelectricinductionfurnacesistheinductionofalowvoltage,highcurrentinametal(secondarycoil)withthehelpofaprimarycoilatahighvoltage(AtlasFoundryCompany,n.d.).Theinducedcurrentleadstothedevelopmentofastirringmotion,whichmaintainsthemoltenmetalataconstanttemperature,ensuringahomogenousandgoodqualityoutput.Inductionfurnacesarecategorizedintochannelinductionfurnacesandcrucibleinductionfurnaces.Channelinductionfurnacesareutilizedformeltingnon-ferrousmetalswithlowermeltingpoints,operatingatanefficiencyofaround80to90%.Crucibleinductionfurnacesareutilizedformeltingmetalswithhighermeltingpoints(suchassteelandcastiron)andtheyoperateatanefficiencyof80%(BeyondZeroEmissions,2018).PlasmaMeltingIntheprocessofplasmaarcmelting,thepartlyionizedinertgasactingastheplasmaarctorchcolumnservesasthesourceofheat.Themetalmeltingprocessoccursatapressurerangeofaround300–1000mbar(abs.)underinertgasconditions(ALD,2019).Thetechniqueisutilizedforawiderangeofprocessheatingapplicationsacrossvariousindustriessuchasmetal,chemical,mineral,andplastic.andhasthepotentialtodisplacenaturalgasfurnaces(EPRI,2009).Someofthenumerousadvantagesoftheprocessarereducedimpurities,highstabilityandeaseoftemperatureadjustment,andreducedairpollution(Svirchuk,2011).ElectrolyticReductionElectrolyticreductionutilizestheprocessofelectrolysistoextractmetalsfromtheircompounds.Thetechniqueisutilizedforthesmeltingofalumina,wherethemetalintheoreundergoeschemicalreduction,resultingintheproductionofaluminum(BeyondZeroEmissions,2018).Anotherelectrolytictechnologyiselectrolysisofironoretoproducesteel(BostonMetal,2020).ThemajoradvantagesofthisprocessincludereducedimpuritiesandthepotentialtoachievesubstantialreductioninCO2emissionswhenlow-carbonelectricityisusedforelectrolysis.(Irfan,2013).IndirectElectrificationIndirectelectrificationiswhenrenewableelectricityisusedtoproducehydrogenviatheelectrolysisofwaterintooxygenandhydrogen,andthishydrogenisthenusedasasubstitutefornaturalgasinthermalindustrialprocesses(Deasonetal.2018).Hydrogenproducedwithelectrolysisusingrenewableelectricityisknownas“green”hydrogen.Thecostofproductionanddistributionofhydrogen,especiallyfromrenewableenergysources,ishigh.83IndustrialElectrificationinU.S.StatesAppendix2.IndustrialElectrificationTechnologies’BenefitsandChallengesTableA.1.Electrificationtechnologiesforindustryandtheirbenefitsandchallenges(Rightoretal.2020)84IndustrialElectrificationinU.S.States85IndustrialElectrificationinU.S.StatesAppendix3.BaseYearandProjectedIndustrialEnergyPricesEIA’sAnnualEnergyOutlook(2019)forecastsindustry-specificenergypricesuntil2050fordifferentU.S.geographicalregionsundertheirreferencecasescenario.BasedonthefuturepricedevelopmentpresentedinTableA.2(U.S.DOE/EIA2019),thisstudyprojectsthefutureenergypricesfortheindustrylocatedindifferentstates(TableA.3).TableA.2.ProjectedEIAindustrialenergypriceindicesfordifferentU.S.geographicregions(Datasource:U.S.DOE/EIA,2019)RegionElectricityNaturalgas203020402050203020402050UnitedStates0.950.950.961.181.291.48NewEngland0.980.970.970.971.051.19Mid-Atlantic0.991.011.041.071.151.28EastNorthCentral0.950.920.921.151.241.39WestNorthCentral0.890.890.861.201.311.50SouthAtlantic0.950.940.931.141.221.37EastSouthCentral0.870.870.881.181.281.44WestSouthCentral1.021.041.071.241.381.58Pacific1.041.061.041.171.291.48Mountain0.820.840.861.211.321.53RegionCoal203020402050UnitedStates1.071.081.10NewEngland1.101.161.23Mid-Atlantic1.071.091.10EastNorthCentral1.051.061.07WestNorthCentral1.031.051.06SouthAtlantic1.101.151.20EastSouthCentral1.081.091.14WestSouthCentral1.091.111.11Pacific1.011.001.01Mountain1.011.011.02

1、当您付费下载文档后,您只拥有了使用权限,并不意味着购买了版权,文档只能用于自身使用,不得用于其他商业用途(如 [转卖]进行直接盈利或[编辑后售卖]进行间接盈利)。
2、本站所有内容均由合作方或网友上传,本站不对文档的完整性、权威性及其观点立场正确性做任何保证或承诺!文档内容仅供研究参考,付费前请自行鉴别。
3、如文档内容存在违规,或者侵犯商业秘密、侵犯著作权等,请点击“违规举报”。

碎片内容

碳中和
已认证
内容提供者

碳中和

确认删除?
回到顶部
微信客服
  • 管理员微信
QQ客服
  • QQ客服点击这里给我发消息
客服邮箱