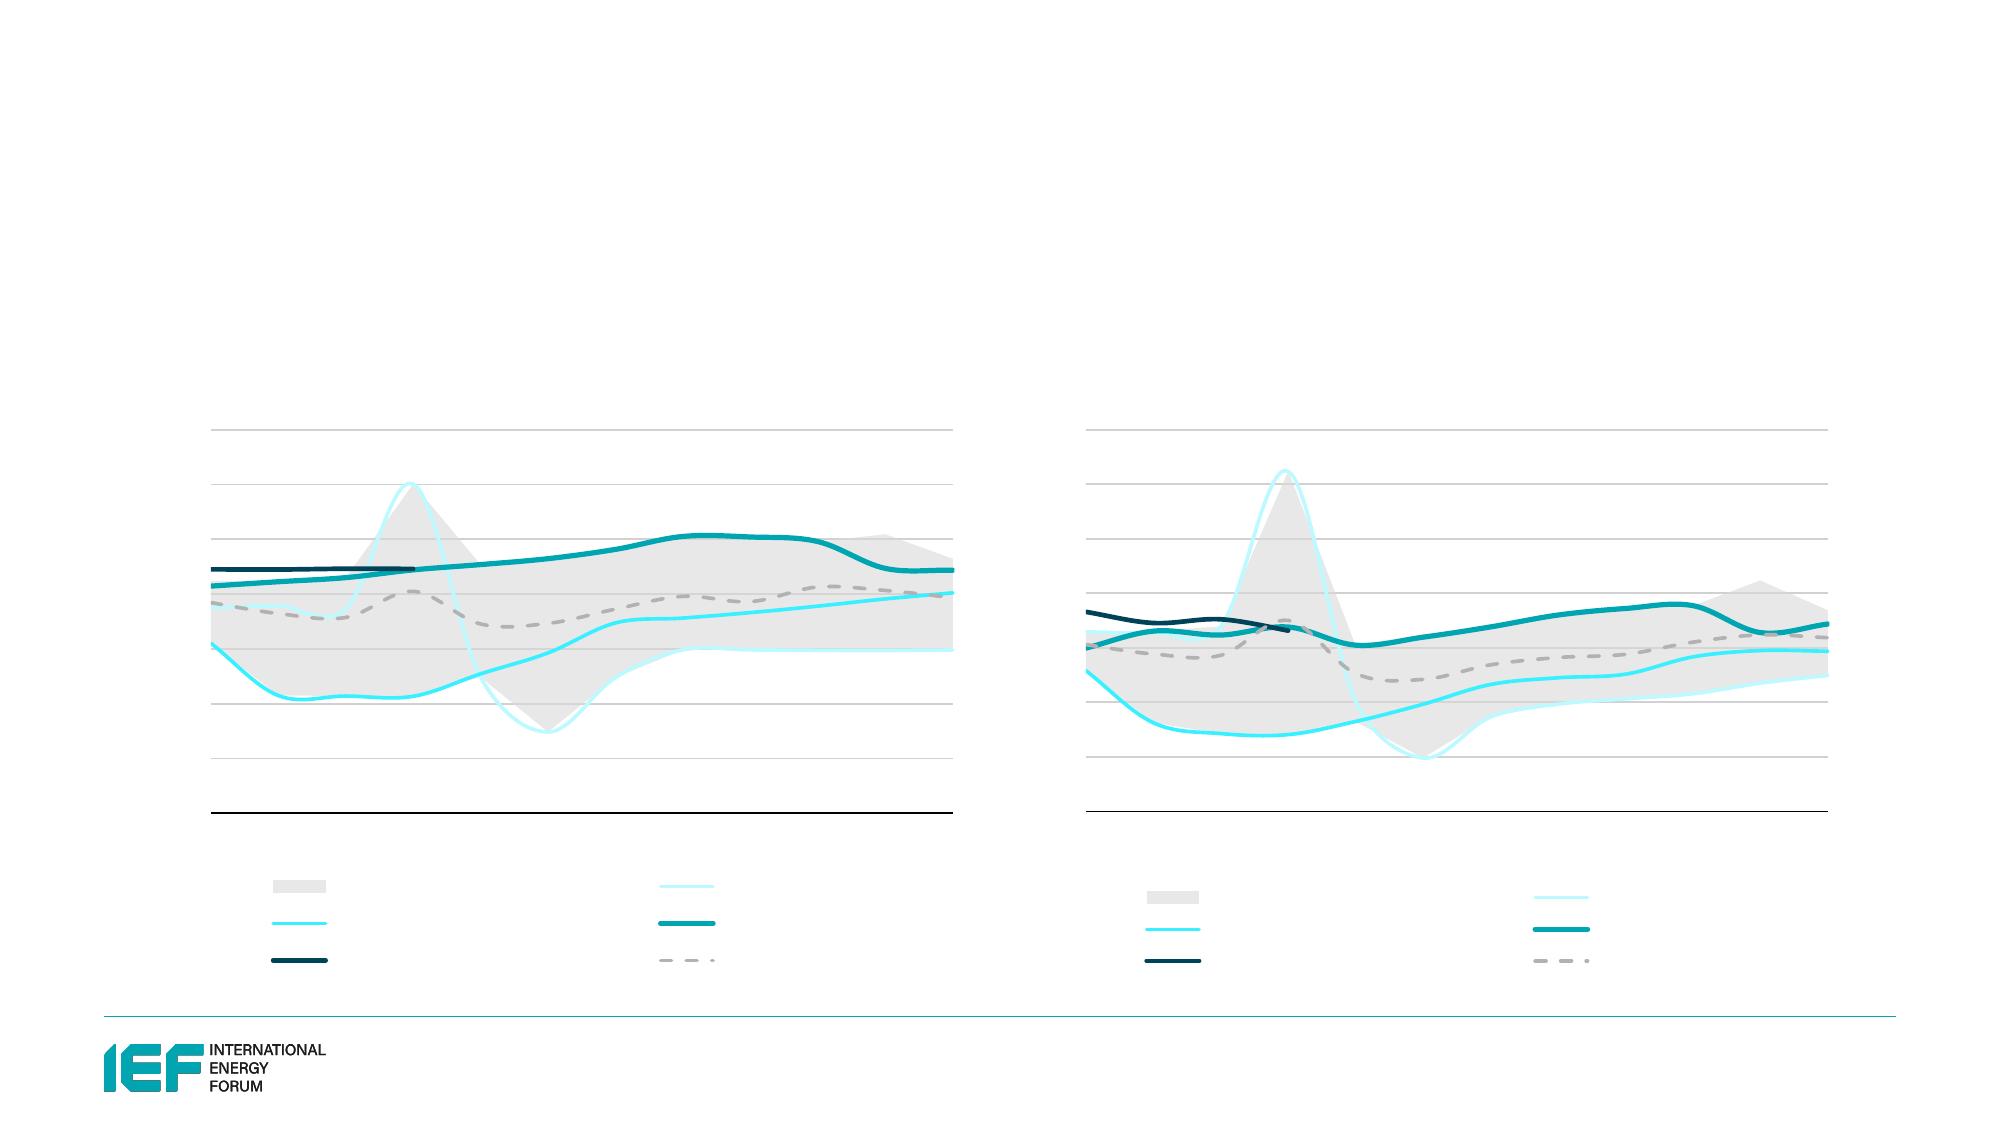
MonthlyOil&GasDataReviewEnergySecurityThroughDialogueief.org1June2023SummaryfindingsfromthelatestJODIoil&gasdatabasesupdateOilHighlights2SaudicrudeproductionfellmarginallyinAprilwhilecrudeexportsdroppedby207kb/d6.07.08.09.010.011.012.013.0JanFebMarAprMayJunJulAugSepOctNovDecRange(2018-2022)2020202120222023Avg(2018-2022)SaudiArabia:CrudeProductionMillionBarrelsPerDaySource:IEF,JODIOil34.05.06.07.08.09.010.011.0JanFebMarAprMayJunJulAugSepOctNovDecRange(2018-2022)2020202120222023Avg(2018-2022)SaudiArabia:CrudeExportsMillionBarrelsPerDaySource:IEF,JODIOilSaudifueloilanddieselimportsroseacombined150kb/dinApril40.000.050.100.150.200.250.300.35JanFebMarAprMayJunJulAugSepOctNovDecRange(2018-2022)2020202120222023Avg(2018-2022)SaudiArabia:DieselImportsMillionBarrelsPerDaySource:IEF,JODIOil0.000.050.100.150.200.250.300.350.400.45JanFebMarAprMayJunJulAugSepOctNovDecRange(2018-2022)2020202120222023Avg(2018-2022)SaudiArabia:FuelOilImportsMillionBarrelsPerDaySource:IEF,JODIOilSaudiArabia’sdirectuseofcrudeoilroseby35kb/dinApril5200300400500600700800JanFebMarAprMayJunJulAugSepOctNovDecRange(2018-2022)2020202120222023Avg(2018-2022)SaudiArabia:DirectCrudeBurnThousandBarrelsPerDaySource:IEF,JODIOilIndiandemanddippedbelowyear-agolevelsforthefirsttimeinoverayear;Crudeimportsfellslightlybutremainedabovethe5-yearseasonalhigh60.01.02.03.04.05.06.0JanFebMarAprMayJunJulAugSepOctNovDecRange(2018-2022)2020202120222023Avg(2018-2022)India:CrudeImportsMillionBarrelsPerDaySource:IEF,JODIOil0.01.02.03.04.05.06.0JanFebMarAprMayJunJulAugSepOctNovDecRange(2018-2022)2020202120222023Avg(2018-2022)India:TotalProductDemandMillionBarrelsPerDaySource:IEF,JODIOilKorea’stotalproductdemandandproductexportsplungedinApril70.800.901.001.101.201.301.401.501.601.70JanFebMarAprMayJunJulAugSepOctNovDecRange(2018-2022)2020202120222023Avg(2018-2022)Korea:ProductExportsMillionBarrelsPerDaySource:IEF,JODIOil2.002.202.402.602.803.003.20JanFebMarAprMayJunJulAugSepOctNovDecRange(2018-2022)2020202120222023Avg(2018-2022)Korea:TotalProductDemandMillionBarrelsPerDaySource:IEF,JODIOilJapan’stotalproductdemandfellseasonallyinAprilanditscrudeinventoriesjumpedtoan11-monthhigh81.602.102.603.103.604.104.605.10JanFebMarAprMayJunJulAugSepOctNovDecRange(2018-2022)2020202120222023Avg(2018-2022)Japan:TotalProductDemandMillionBarrelsPerDaySource:IEF,JODIOil300320340360380400420JanFebMarAprMayJunJulAugSepOctNovDecRange(2018-2022)2020202120222023Avg(2018-2022)Japan:CrudeInventoriesMillionBarrelsSource:IEF,JODIOilGasHighlights9AggregatedfiguresusethetotalforcountriesthathavereporteddataeverymonthsinceApril2018Gasproductiondeclinedby8.3bcminAprilledbya5.6bcmdropinRussianoutput160170180190200210220230JanFebMarAprMayJunJulAugSepOctNovDecRange(2018-2022)2020202120222023Avg(2018-2022)NaturalGasProduction(32Countries)BillionCubicMetresSource:IEF,JODIGas102030405060708090JanFebMarAprMayJunJulAugSepOctNovDecRange(2018-2022)2020202120222023Avg(2018-2022)RussiaNaturalGasProductionBillionCubicMetresSource:IEF,JODIGasSource:IEF,JODIGasNaturalgasdemanddeclinedby29.2bcminApril,lessthantheseasonalaveragedeclineof35bcm100120140160180200220240JanFebMarAprMayJunJulAugSepOctNovDecRange(2018-2022)2020202120222023Avg(2018-2022)NaturalGasGrossInlandDeliveries(44Countries)BillionCubicMetresSource:IEF,JODIGas11Naturalgasinventoriesbuiltseasonallyby11.9bcminAprilandremainednearthetopofthe5-yearrange050100150200250300JanFebMarAprMayJunJulAugSepOctNovDecRange(2018-2022)2020202120222023Avg(2018-2022)NaturalGasClosingStocks(28Countries)BillionCubicMetresSource:IEF,JODIGas12EU+UKgasdemandwasbelowtheseasonalaveragelevelsinApril,butinventoriesbuiltataslowerpacethanusual(+3.1bcmvs.historical+4.8bcm)1310203040506070JanFebMarAprMayJunJulAugSepOctNovDecRange(2018-2022)2020202120222023Avg(2018-2022)EU+UK:NaturalGasGrossInlandDeliveriesBillionCubicMetresSource:IEF,JODIGas0102030405060708090100JanFebMarAprMayJunJulAugSepOctNovDecRange(2018-2022)2020202120222023Avg(2018-2022)EU+UK:NaturalGasClosingStocksBillionCubicMetresSource:IEF,JODIGasTheGlobalHomeofEnergyDialogueief.orgTheGlobalHomeofEnergyDialogueief.org14


 VIP
VIP VIP
VIP VIP
VIP VIP
VIP VIP
VIP VIP
VIP VIP
VIP VIP
VIP VIP
VIP VIP
VIP